Table of Contents for
PHP 7: Real World Application Development
 PHP 7: Real World Application Development
Published by
Packt Publishing, 2016
PHP 7: Real World Application Development
Published by
Packt Publishing, 2016
- Cover
- Table of Contents
- PHP 7: Real World Application Development
- PHP 7: Real World Application Development
- PHP 7: Real World Application Development
- Credits
- Preface
- What you need for this learning path
- Who this learning path is for
- Reader feedback
- Customer support
- 1. Module 1
- 1. Building a Foundation
- PHP 7 installation considerations
- Using the built-in PHP web server
- Defining a test MySQL database
- Installing PHPUnit
- Implementing class autoloading
- Hoovering a website
- Building a deep web scanner
- Creating a PHP 5 to PHP 7 code converter
- 2. Using PHP 7 High Performance Features
- Understanding the abstract syntax tree
- Understanding differences in parsing
- Understanding differences in foreach() handling
- Improving performance using PHP 7 enhancements
- Iterating through a massive file
- Uploading a spreadsheet into a database
- Recursive directory iterator
- 3. Working with PHP Functions
- Developing functions
- Hinting at data types
- Using return value data typing
- Using iterators
- Writing your own iterator using generators
- 4. Working with PHP Object-Oriented Programming
- Developing classes
- Extending classes
- Using static properties and methods
- Using namespaces
- Defining visibility
- Using interfaces
- Using traits
- Implementing anonymous classes
- 5. Interacting with a Database
- Using PDO to connect to a database
- Building an OOP SQL query builder
- Handling pagination
- Defining entities to match database tables
- Tying entity classes to RDBMS queries
- Embedding secondary lookups into query results
- Implementing jQuery DataTables PHP lookups
- 6. Building Scalable Websites
- Creating a generic form element generator
- Creating an HTML radio element generator
- Creating an HTML select element generator
- Implementing a form factory
- Chaining $_POST filters
- Chaining $_POST validators
- Tying validation to a form
- 7. Accessing Web Services
- Converting between PHP and XML
- Creating a simple REST client
- Creating a simple REST server
- Creating a simple SOAP client
- Creating a simple SOAP server
- 8. Working with Date/Time and International Aspects
- Using emoticons or emoji in a view script
- Converting complex characters
- Getting the locale from browser data
- Formatting numbers by locale
- Handling currency by locale
- Formatting date/time by locale
- Creating an HTML international calendar generator
- Building a recurring events generator
- Handling translation without gettext
- 9. Developing Middleware
- Authenticating with middleware
- Using middleware to implement access control
- Improving performance using the cache
- Implementing routing
- Making inter-framework system calls
- Using middleware to cross languages
- 10. Looking at Advanced Algorithms
- Using getters and setters
- Implementing a linked list
- Building a bubble sort
- Implementing a stack
- Building a binary search class
- Implementing a search engine
- Displaying a multi-dimensional array and accumulating totals
- 11. Implementing Software Design Patterns
- Creating an array to object hydrator
- Building an object to array hydrator
- Implementing a strategy pattern
- Defining a mapper
- Implementing object-relational mapping
- Implementing the Pub/Sub design pattern
- 12. Improving Web Security
- Filtering $_POST data
- Validating $_POST data
- Safeguarding the PHP session
- Securing forms with a token
- Building a secure password generator
- Safeguarding forms with a CAPTCHA
- Encrypting/decrypting without mcrypt
- 13. Best Practices, Testing, and Debugging
- Using Traits and Interfaces
- Universal exception handler
- Universal error handler
- Writing a simple test
- Writing a test suite
- Generating fake test data
- Customizing sessions using session_start parameters
- A. Defining PSR-7 Classes
- Implementing PSR-7 value object classes
- Developing a PSR-7 Request class
- Defining a PSR-7 Response class
- 2. Module 2
- 1. Setting Up the Environment
- Setting up Debian or Ubuntu
- Setting up CentOS
- Setting up Vagrant
- Summary
- 2. New Features in PHP 7
- New operators
- Uniform variable syntax
- Miscellaneous features and changes
- Summary
- 3. Improving PHP 7 Application Performance
- HTTP server optimization
- HTTP persistent connection
- Content Delivery Network (CDN)
- CSS and JavaScript optimization
- Full page caching
- Varnish
- The infrastructure
- Summary
- 4. Improving Database Performance
- Storage engines
- The Percona Server - a fork of MySQL
- MySQL performance monitoring tools
- Percona XtraDB Cluster (PXC)
- Redis – the key-value cache store
- Memcached key-value cache store
- Summary
- 5. Debugging and Profiling
- Profiling with Xdebug
- PHP DebugBar
- Summary
- 6. Stress/Load Testing PHP Applications
- ApacheBench (ab)
- Siege
- Load testing real-world applications
- Summary
- 7. Best Practices in PHP Programming
- Test-driven development (TDD)
- Design patterns
- Service-oriented architecture (SOA)
- Being object-oriented and reusable always
- PHP frameworks
- Version control system (VCS) and Git
- Deployment and Continuous Integration (CI)
- Summary
- A. Tools to Make Life Easy
- Git – A version control system
- Grunt watch
- Summary
- B. MVC and Frameworks
- Laravel
- Lumen
- Apigility
- Summary
- 3. Module 3
- 1. Ecosystem Overview
- Summary
- 2. GoF Design Patterns
- Structural patterns
- Behavioral patterns
- Summary
- 3. SOLID Design Principles
- Open/closed principle
- Liskov substitution principle
- Interface Segregation Principle
- Dependency inversion principle
- Summary
- 4. Requirement Specification for a Modular Web Shop App
- Wireframing
- Defining a technology stack
- Summary
- 5. Symfony at a Glance
- Creating a blank project
- Using Symfony console
- Controller
- Routing
- Templates
- Forms
- Configuring Symfony
- The bundle system
- Databases and Doctrine
- Testing
- Validation
- Summary
- 6. Building the Core Module
- Dependencies
- Implementation
- Unit testing
- Functional testing
- Summary
- 7. Building the Catalog Module
- Dependencies
- Implementation
- Unit testing
- Functional testing
- Summary
- 8. Building the Customer Module
- Dependencies
- Implementation
- Unit testing
- Functional testing
- Summary
- 9. Building the Payment Module
- Dependencies
- Implementation
- Unit testing
- Functional testing
- Summary
- 10. Building the Shipment Module
- Dependencies
- Implementation
- Unit testing
- Functional testing
- Summary
- 11. Building the Sales Module
- Dependencies
- Implementation
- Unit testing
- Functional testing
- Summary
- 12. Integrating and Distributing Modules
- Understanding GitHub
- Understanding Composer
- Understanding Packagist
- Summary
- Bibliography
- Index
After an application is developed, tested, debugged and then profiled, it is time to bring it to production. However, before going to production, it is best practice to stress/load test the application. This test will give us an approximate result of how many requests at a certain time can be handled by our server running the application. Using these results, we can optimize the application, web server, database, and our caching tools to get a better result and process more requests.
In this chapter, we will load test different open source tools on both PHP 5.6 and PHP 7 and compare these applications' performance for both versions of PHP.
We will cover the following topics:
- Apache JMeter
- ApacheBench (ab)
- Seige
- Load testing Magento 2 on PHP 5.6 and PHP 7
- Load testing WordPress on PHP 5.6 and PHP 7
- Load testing Drupal 8 on PHP 5.6 and PHP 7
Apache JMeter is a graphical and open source tool used to load test a server's performance. JMeter is completely written in Java, so it is compatible with all operating systems that have Java installed. JMeter has a complete set of extensive tools for every kind of load testing, from static content to dynamic resources and web services.
Its installation is simple. We need to download it from the JMeter website and then just run the application. As mentioned before, it will require Java to be installed on the machine.
Note
JMeter can test FTP servers, mail servers, database servers, queries, and more. In this book, we can't cover all these topics, so we will only load test web servers. Apache JMeter's list of features can be found at http://jmeter.apache.org/.
When we run the application at first, we will see the following window:
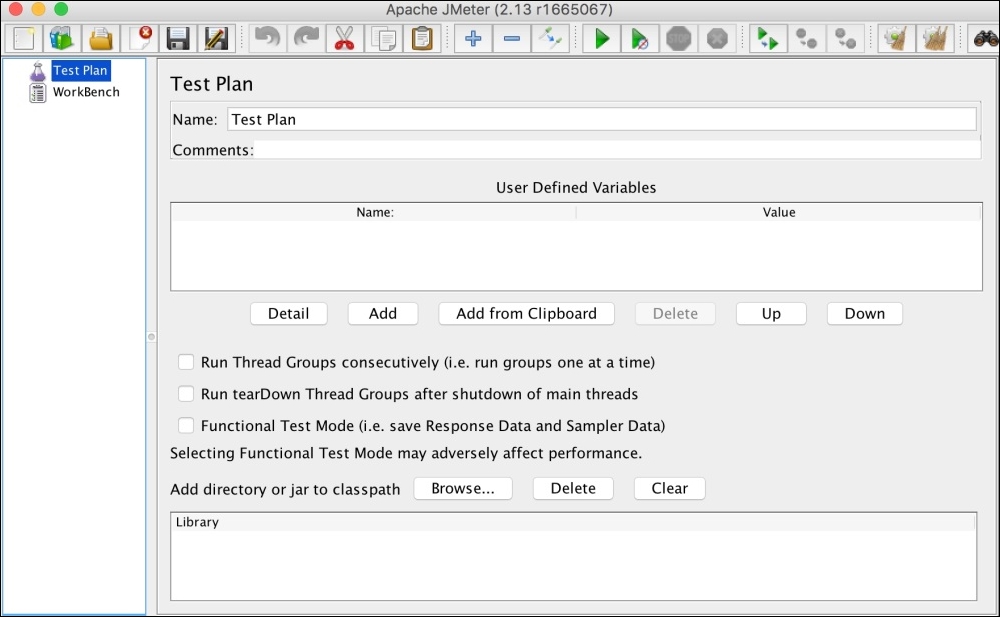
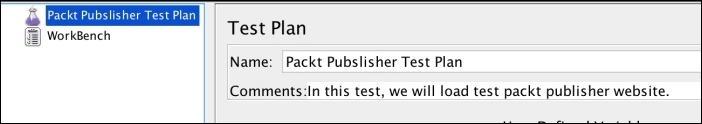
To run any kind of test, you need to first create a test plan. A test plan has all the components required to execute this test. By default, JMeter has a test plan called Test Plan. Let's name it to our own plan, Packt Publisher Test Plan, as shown in the following screenshot:
Now, save the test plan, and JMeter we will create a .jmx file. Save it in an appropriate place.
The next step is to add a thread group. A thread group defines some basic properties for the test plan, which can be common among all types of tests. To add a thread group, right-click on the plan in the left panel, then navigate to Add | Threads (Users) | Thread Group. The following window will be displayed:
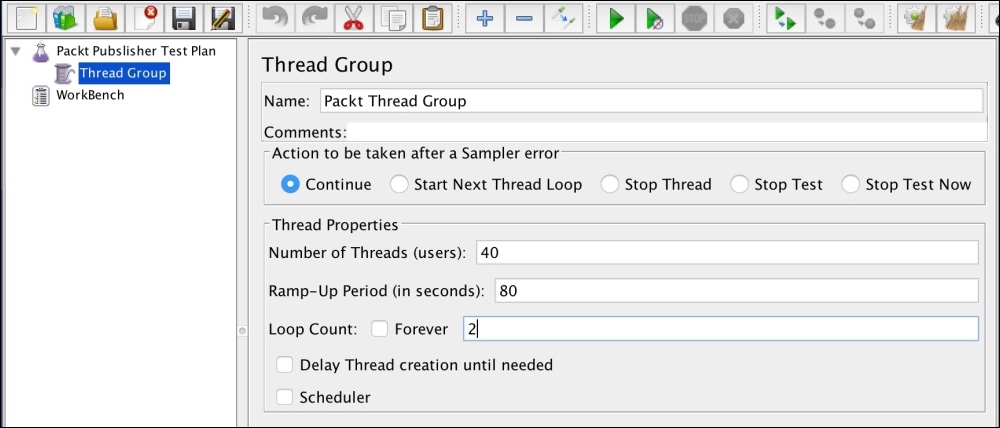
The thread group has the following important properties:
- Number of Threads: This is the number of virtual users.
- The Ramp-Up period: This tells JMeter how long it should take to ramp up to the full capacity of the number of threads. For example, in the preceding screenshot, we have 40 threads and 80 seconds of ramp-up time; here, J Meter will take 80 seconds to completely fire up 40 threads, and it will take 2 seconds for each of the thread to start.
- Loop Count: This tells JMeter how much time it should take to run this thread group.
- Scheduler: This is used to schedule the execution of the thread group for a later time.
Now, we will need to add the HTTP request defaults. Right-click on Packt Thread Group and then go to Add | Config Element | HTTP Request Defaults. A window similar to the following will appear:
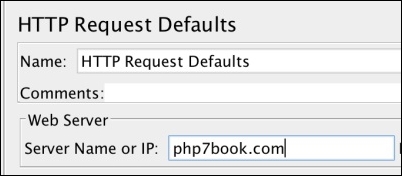
In the preceding window, we have to just enter the URL of the application or the IP address. If the web server uses cookies, we can add HTTP Cookie Manager too, in which we can add user-defined cookies with all the data, such as the name, value, domain, path, and so on.
Next, we will add an HTTP request by right-clicking and navigating to Packt Thread Group | Add | Sampler | HTTP Request, and the following window will appear:
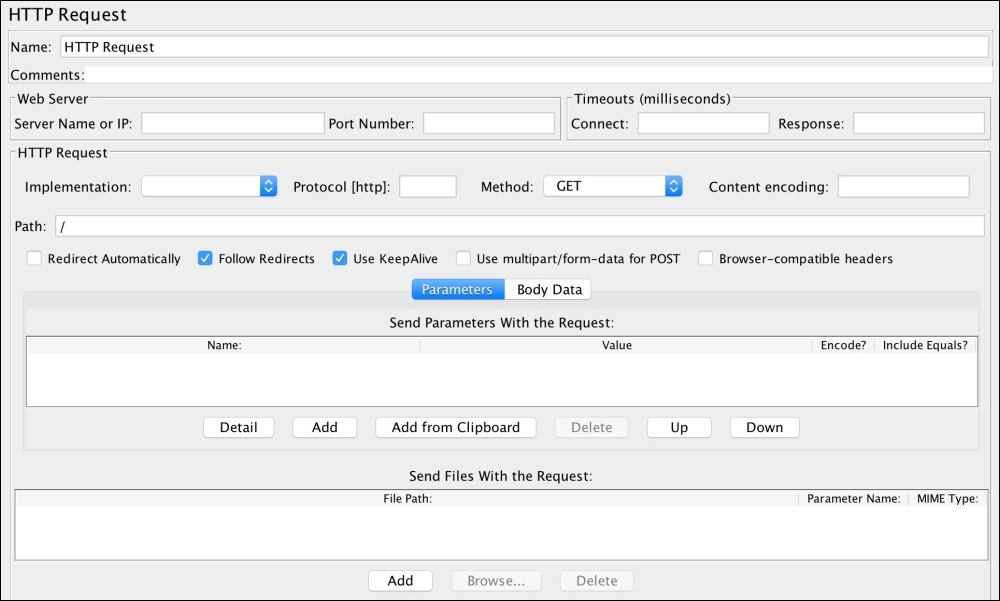
The important field here is Path. We want to run the test only against the home page, so for this HTTP request, we will just add a slash (/) in the Path field. If we want to test another path, such as "Contact us", we will need to add another HTTP request sampler, as in the preceding screenshot. Then, in the path, we will add path/contact-us.
The HTTP Request sampler can be used to test forms too, where POST requests can be sent to the URL by selecting the POST method in the Method field. Also, file upload can be simulated.
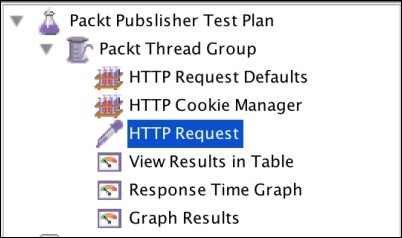
The next step is to add some listeners. Listeners provide some powerful views to display results. The results can be displayed in a table view and different kinds of graphs can be saved in a file. For this thread group, we will add three listeners: View Results in Table, Response Time Graph, and Graph Results. Each listener view displays a different kind of data. Add all the preceding listeners by right-clicking on Packt Thread Group and then navigating to Add | Listeners. We will have a complete list of all the available listeners. Add all the three listeners one by one. Our final Packt Publisher Test Plan panel on the left-hand side of JMeter will look similar to the following:
Now, we are ready to run our test plan by clicking on the Start button in the upper tool bar, as shown in the following screenshot:

As soon as we click on the Start button (the green arrow pointing to the right-hand side), JMeter will start our test plan. Now, if we click on the View Results in Table listener on the left panel, we will see data for each request in a table, as shown in the following screenshot:
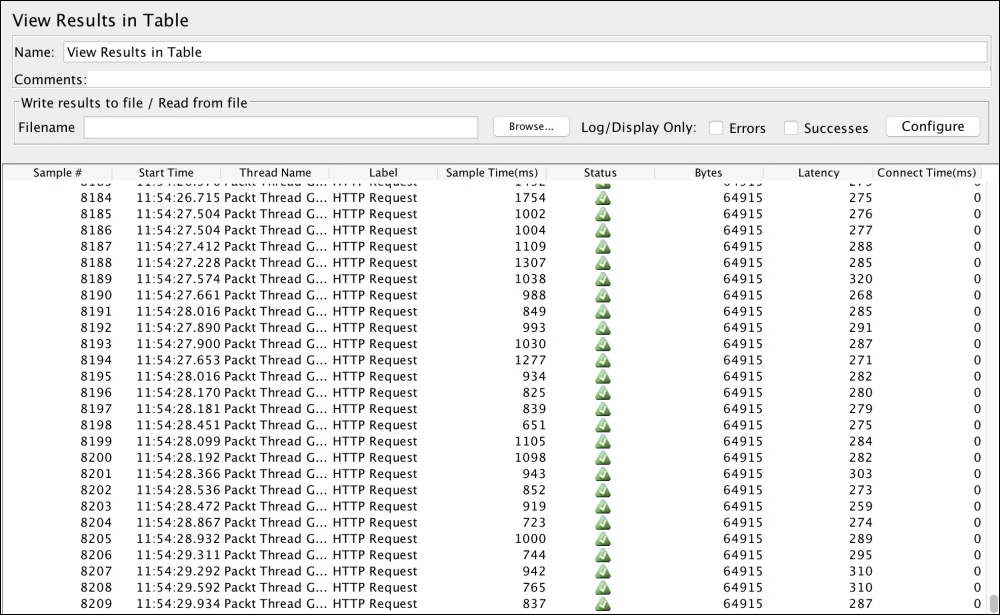
The preceding screenshot shows some interesting data, such as sample time, status, bytes, and latency.
Sample time is the number of milliseconds in which the server served the complete request. Status is the status of the request. It can be either a success, warning, or error. Bytes is the number of bytes received for the request. Latency is the number of milliseconds in which JMeter received the initial response from the server.
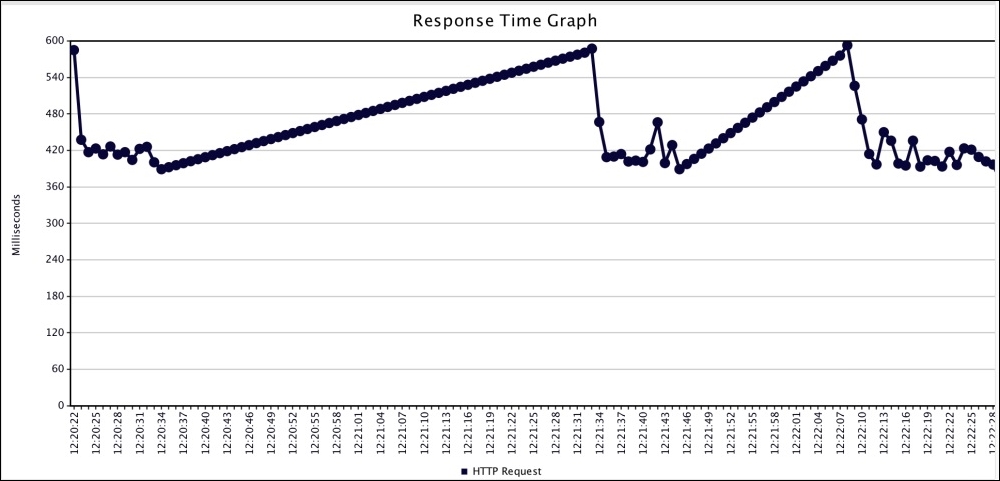
Now, if we click on Response Time Graph, we will see a visual graph for the response time, which is similar to the one that follows:
Now, if we click on Graph Results, we will see the response time data along with graphs for average, median, deviation, and throughput graphs, as shown in the following graph:
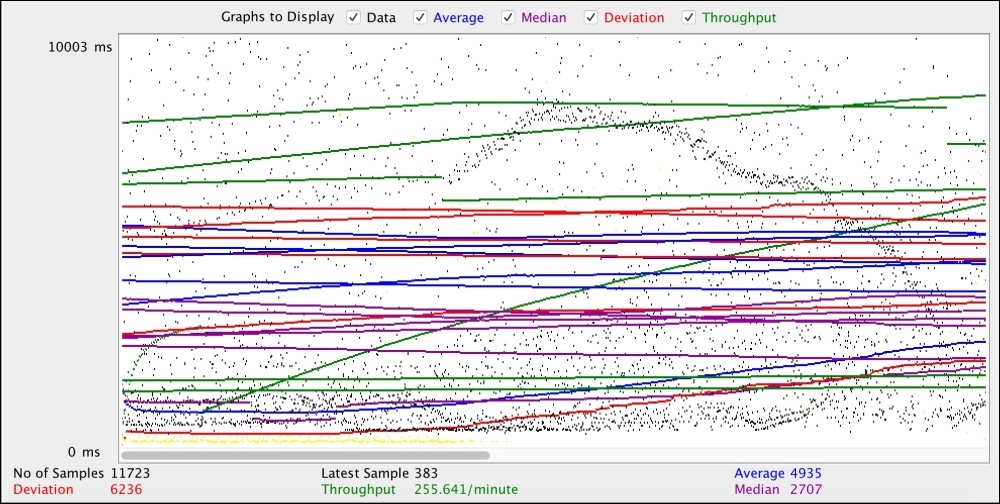
Apache JMeter provides very powerful tools to load test our web servers by simulating users. It can provide us with data regarding the amount of load that makes our web server's response slow, and using this data, we can optimize our web server and application.