Table of Contents for
PHP 7: Real World Application Development
 PHP 7: Real World Application Development
Published by
Packt Publishing, 2016
PHP 7: Real World Application Development
Published by
Packt Publishing, 2016
- Cover
- Table of Contents
- PHP 7: Real World Application Development
- PHP 7: Real World Application Development
- PHP 7: Real World Application Development
- Credits
- Preface
- What you need for this learning path
- Who this learning path is for
- Reader feedback
- Customer support
- 1. Module 1
- 1. Building a Foundation
- PHP 7 installation considerations
- Using the built-in PHP web server
- Defining a test MySQL database
- Installing PHPUnit
- Implementing class autoloading
- Hoovering a website
- Building a deep web scanner
- Creating a PHP 5 to PHP 7 code converter
- 2. Using PHP 7 High Performance Features
- Understanding the abstract syntax tree
- Understanding differences in parsing
- Understanding differences in foreach() handling
- Improving performance using PHP 7 enhancements
- Iterating through a massive file
- Uploading a spreadsheet into a database
- Recursive directory iterator
- 3. Working with PHP Functions
- Developing functions
- Hinting at data types
- Using return value data typing
- Using iterators
- Writing your own iterator using generators
- 4. Working with PHP Object-Oriented Programming
- Developing classes
- Extending classes
- Using static properties and methods
- Using namespaces
- Defining visibility
- Using interfaces
- Using traits
- Implementing anonymous classes
- 5. Interacting with a Database
- Using PDO to connect to a database
- Building an OOP SQL query builder
- Handling pagination
- Defining entities to match database tables
- Tying entity classes to RDBMS queries
- Embedding secondary lookups into query results
- Implementing jQuery DataTables PHP lookups
- 6. Building Scalable Websites
- Creating a generic form element generator
- Creating an HTML radio element generator
- Creating an HTML select element generator
- Implementing a form factory
- Chaining $_POST filters
- Chaining $_POST validators
- Tying validation to a form
- 7. Accessing Web Services
- Converting between PHP and XML
- Creating a simple REST client
- Creating a simple REST server
- Creating a simple SOAP client
- Creating a simple SOAP server
- 8. Working with Date/Time and International Aspects
- Using emoticons or emoji in a view script
- Converting complex characters
- Getting the locale from browser data
- Formatting numbers by locale
- Handling currency by locale
- Formatting date/time by locale
- Creating an HTML international calendar generator
- Building a recurring events generator
- Handling translation without gettext
- 9. Developing Middleware
- Authenticating with middleware
- Using middleware to implement access control
- Improving performance using the cache
- Implementing routing
- Making inter-framework system calls
- Using middleware to cross languages
- 10. Looking at Advanced Algorithms
- Using getters and setters
- Implementing a linked list
- Building a bubble sort
- Implementing a stack
- Building a binary search class
- Implementing a search engine
- Displaying a multi-dimensional array and accumulating totals
- 11. Implementing Software Design Patterns
- Creating an array to object hydrator
- Building an object to array hydrator
- Implementing a strategy pattern
- Defining a mapper
- Implementing object-relational mapping
- Implementing the Pub/Sub design pattern
- 12. Improving Web Security
- Filtering $_POST data
- Validating $_POST data
- Safeguarding the PHP session
- Securing forms with a token
- Building a secure password generator
- Safeguarding forms with a CAPTCHA
- Encrypting/decrypting without mcrypt
- 13. Best Practices, Testing, and Debugging
- Using Traits and Interfaces
- Universal exception handler
- Universal error handler
- Writing a simple test
- Writing a test suite
- Generating fake test data
- Customizing sessions using session_start parameters
- A. Defining PSR-7 Classes
- Implementing PSR-7 value object classes
- Developing a PSR-7 Request class
- Defining a PSR-7 Response class
- 2. Module 2
- 1. Setting Up the Environment
- Setting up Debian or Ubuntu
- Setting up CentOS
- Setting up Vagrant
- Summary
- 2. New Features in PHP 7
- New operators
- Uniform variable syntax
- Miscellaneous features and changes
- Summary
- 3. Improving PHP 7 Application Performance
- HTTP server optimization
- HTTP persistent connection
- Content Delivery Network (CDN)
- CSS and JavaScript optimization
- Full page caching
- Varnish
- The infrastructure
- Summary
- 4. Improving Database Performance
- Storage engines
- The Percona Server - a fork of MySQL
- MySQL performance monitoring tools
- Percona XtraDB Cluster (PXC)
- Redis – the key-value cache store
- Memcached key-value cache store
- Summary
- 5. Debugging and Profiling
- Profiling with Xdebug
- PHP DebugBar
- Summary
- 6. Stress/Load Testing PHP Applications
- ApacheBench (ab)
- Siege
- Load testing real-world applications
- Summary
- 7. Best Practices in PHP Programming
- Test-driven development (TDD)
- Design patterns
- Service-oriented architecture (SOA)
- Being object-oriented and reusable always
- PHP frameworks
- Version control system (VCS) and Git
- Deployment and Continuous Integration (CI)
- Summary
- A. Tools to Make Life Easy
- Git – A version control system
- Grunt watch
- Summary
- B. MVC and Frameworks
- Laravel
- Lumen
- Apigility
- Summary
- 3. Module 3
- 1. Ecosystem Overview
- Summary
- 2. GoF Design Patterns
- Structural patterns
- Behavioral patterns
- Summary
- 3. SOLID Design Principles
- Open/closed principle
- Liskov substitution principle
- Interface Segregation Principle
- Dependency inversion principle
- Summary
- 4. Requirement Specification for a Modular Web Shop App
- Wireframing
- Defining a technology stack
- Summary
- 5. Symfony at a Glance
- Creating a blank project
- Using Symfony console
- Controller
- Routing
- Templates
- Forms
- Configuring Symfony
- The bundle system
- Databases and Doctrine
- Testing
- Validation
- Summary
- 6. Building the Core Module
- Dependencies
- Implementation
- Unit testing
- Functional testing
- Summary
- 7. Building the Catalog Module
- Dependencies
- Implementation
- Unit testing
- Functional testing
- Summary
- 8. Building the Customer Module
- Dependencies
- Implementation
- Unit testing
- Functional testing
- Summary
- 9. Building the Payment Module
- Dependencies
- Implementation
- Unit testing
- Functional testing
- Summary
- 10. Building the Shipment Module
- Dependencies
- Implementation
- Unit testing
- Functional testing
- Summary
- 11. Building the Sales Module
- Dependencies
- Implementation
- Unit testing
- Functional testing
- Summary
- 12. Integrating and Distributing Modules
- Understanding GitHub
- Understanding Composer
- Understanding Packagist
- Summary
- Bibliography
- Index
Profiling gives us information about the cost of each script or task executed in an application. It helps to provide information about how much time a task takes, and hence we can optimize our code to consume less time.
Xdebug has a profiler that is disabled by default. To enable the profiler, open the configuration file and place the following two lines in it:
xdebug.profiler_enable=on
xdebug.profiler_output_dir=/var/xdebug/profiler/
The first line enables the profiler. The second line, where we defined the output directory for the profiler file, is important. In this directory, Xdebug will store the output file when the profiler is executed. The output file is stored with a name, such as cachegrind.out.id. This file contains all the profile data in a simple text format.
Now, we are set to profile a simple installation of the Laravel application home page. The installation is a fresh and clean one. Now, let's open the application in a browser and append ?XDEBUG_PROFILE=on at the end, as shown here:
http://application_url.com?XDEBUG_PROFILE=on
After this page is loaded, a cachegrind file will be generated at the specified location. Now, when we open the file in a text editor, we will just see some text data.
Note
The cachegrind file can be opened with different tools. One of the tools for Windows is WinCacheGrind. For Mac, we have qcachegrind. Any of these applications will view the file data in such a way that we will see all the data in an interactive form that can be easily analyzed. Also, PHP Storm has a nice analyzer for cachegrind. For this topic, we used PHP Storm IDE.
After opening the file in PHP Storm, we will get a window similar to the following screenshot:
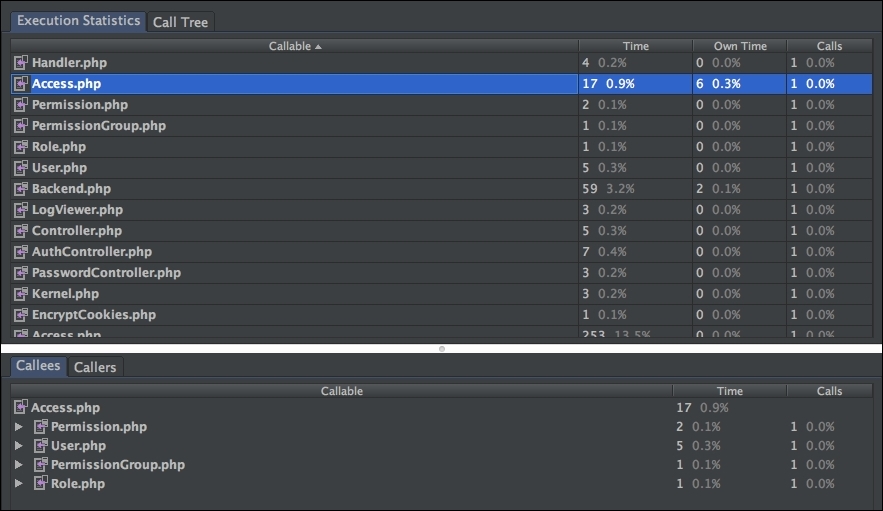
As shown in the preceding screenshot, we have execution statistics in the upper pane that shows the time (in ms) taken by each called script individually along with the number of times it is called. In the lower pane, we have the callees that called this script.
We can analyze which script takes more time, and we can optimize this script to reduce its execution time. Also, we can find out whether, at a certain point, we need to call a specific script or not. If not, then we can remove this call.