Table of Contents for
PHP 7: Real World Application Development
 PHP 7: Real World Application Development
Published by
Packt Publishing, 2016
PHP 7: Real World Application Development
Published by
Packt Publishing, 2016
- Cover
- Table of Contents
- PHP 7: Real World Application Development
- PHP 7: Real World Application Development
- PHP 7: Real World Application Development
- Credits
- Preface
- What you need for this learning path
- Who this learning path is for
- Reader feedback
- Customer support
- 1. Module 1
- 1. Building a Foundation
- PHP 7 installation considerations
- Using the built-in PHP web server
- Defining a test MySQL database
- Installing PHPUnit
- Implementing class autoloading
- Hoovering a website
- Building a deep web scanner
- Creating a PHP 5 to PHP 7 code converter
- 2. Using PHP 7 High Performance Features
- Understanding the abstract syntax tree
- Understanding differences in parsing
- Understanding differences in foreach() handling
- Improving performance using PHP 7 enhancements
- Iterating through a massive file
- Uploading a spreadsheet into a database
- Recursive directory iterator
- 3. Working with PHP Functions
- Developing functions
- Hinting at data types
- Using return value data typing
- Using iterators
- Writing your own iterator using generators
- 4. Working with PHP Object-Oriented Programming
- Developing classes
- Extending classes
- Using static properties and methods
- Using namespaces
- Defining visibility
- Using interfaces
- Using traits
- Implementing anonymous classes
- 5. Interacting with a Database
- Using PDO to connect to a database
- Building an OOP SQL query builder
- Handling pagination
- Defining entities to match database tables
- Tying entity classes to RDBMS queries
- Embedding secondary lookups into query results
- Implementing jQuery DataTables PHP lookups
- 6. Building Scalable Websites
- Creating a generic form element generator
- Creating an HTML radio element generator
- Creating an HTML select element generator
- Implementing a form factory
- Chaining $_POST filters
- Chaining $_POST validators
- Tying validation to a form
- 7. Accessing Web Services
- Converting between PHP and XML
- Creating a simple REST client
- Creating a simple REST server
- Creating a simple SOAP client
- Creating a simple SOAP server
- 8. Working with Date/Time and International Aspects
- Using emoticons or emoji in a view script
- Converting complex characters
- Getting the locale from browser data
- Formatting numbers by locale
- Handling currency by locale
- Formatting date/time by locale
- Creating an HTML international calendar generator
- Building a recurring events generator
- Handling translation without gettext
- 9. Developing Middleware
- Authenticating with middleware
- Using middleware to implement access control
- Improving performance using the cache
- Implementing routing
- Making inter-framework system calls
- Using middleware to cross languages
- 10. Looking at Advanced Algorithms
- Using getters and setters
- Implementing a linked list
- Building a bubble sort
- Implementing a stack
- Building a binary search class
- Implementing a search engine
- Displaying a multi-dimensional array and accumulating totals
- 11. Implementing Software Design Patterns
- Creating an array to object hydrator
- Building an object to array hydrator
- Implementing a strategy pattern
- Defining a mapper
- Implementing object-relational mapping
- Implementing the Pub/Sub design pattern
- 12. Improving Web Security
- Filtering $_POST data
- Validating $_POST data
- Safeguarding the PHP session
- Securing forms with a token
- Building a secure password generator
- Safeguarding forms with a CAPTCHA
- Encrypting/decrypting without mcrypt
- 13. Best Practices, Testing, and Debugging
- Using Traits and Interfaces
- Universal exception handler
- Universal error handler
- Writing a simple test
- Writing a test suite
- Generating fake test data
- Customizing sessions using session_start parameters
- A. Defining PSR-7 Classes
- Implementing PSR-7 value object classes
- Developing a PSR-7 Request class
- Defining a PSR-7 Response class
- 2. Module 2
- 1. Setting Up the Environment
- Setting up Debian or Ubuntu
- Setting up CentOS
- Setting up Vagrant
- Summary
- 2. New Features in PHP 7
- New operators
- Uniform variable syntax
- Miscellaneous features and changes
- Summary
- 3. Improving PHP 7 Application Performance
- HTTP server optimization
- HTTP persistent connection
- Content Delivery Network (CDN)
- CSS and JavaScript optimization
- Full page caching
- Varnish
- The infrastructure
- Summary
- 4. Improving Database Performance
- Storage engines
- The Percona Server - a fork of MySQL
- MySQL performance monitoring tools
- Percona XtraDB Cluster (PXC)
- Redis – the key-value cache store
- Memcached key-value cache store
- Summary
- 5. Debugging and Profiling
- Profiling with Xdebug
- PHP DebugBar
- Summary
- 6. Stress/Load Testing PHP Applications
- ApacheBench (ab)
- Siege
- Load testing real-world applications
- Summary
- 7. Best Practices in PHP Programming
- Test-driven development (TDD)
- Design patterns
- Service-oriented architecture (SOA)
- Being object-oriented and reusable always
- PHP frameworks
- Version control system (VCS) and Git
- Deployment and Continuous Integration (CI)
- Summary
- A. Tools to Make Life Easy
- Git – A version control system
- Grunt watch
- Summary
- B. MVC and Frameworks
- Laravel
- Lumen
- Apigility
- Summary
- 3. Module 3
- 1. Ecosystem Overview
- Summary
- 2. GoF Design Patterns
- Structural patterns
- Behavioral patterns
- Summary
- 3. SOLID Design Principles
- Open/closed principle
- Liskov substitution principle
- Interface Segregation Principle
- Dependency inversion principle
- Summary
- 4. Requirement Specification for a Modular Web Shop App
- Wireframing
- Defining a technology stack
- Summary
- 5. Symfony at a Glance
- Creating a blank project
- Using Symfony console
- Controller
- Routing
- Templates
- Forms
- Configuring Symfony
- The bundle system
- Databases and Doctrine
- Testing
- Validation
- Summary
- 6. Building the Core Module
- Dependencies
- Implementation
- Unit testing
- Functional testing
- Summary
- 7. Building the Catalog Module
- Dependencies
- Implementation
- Unit testing
- Functional testing
- Summary
- 8. Building the Customer Module
- Dependencies
- Implementation
- Unit testing
- Functional testing
- Summary
- 9. Building the Payment Module
- Dependencies
- Implementation
- Unit testing
- Functional testing
- Summary
- 10. Building the Shipment Module
- Dependencies
- Implementation
- Unit testing
- Functional testing
- Summary
- 11. Building the Sales Module
- Dependencies
- Implementation
- Unit testing
- Functional testing
- Summary
- 12. Integrating and Distributing Modules
- Understanding GitHub
- Understanding Composer
- Understanding Packagist
- Summary
- Bibliography
- Index
During development, every developer faces problems, and it becomes unclear what is really going on here and why the problem is generated. Most the time, these issues can be logical or with the data. It is always hard to find such issues. Debugging is a process to find such issues and problems and fix them. Similarly, we often need to know how many resources a script consumes, including memory consumption, CPU, and how much time it takes to execute.
In this chapter, we will cover the following topics:
- Xdebug
- Debugging with Sublime Text 3
- Debugging with Eclipse
- Profiling with Xdebug
- PHP DebugBar
Xdebug is an extension for PHP that provides both debugging and profiling information for PHP scripts. Xdebug displays a full-stake trace information for errors, including function names, line numbers, and filenames. Also, it provides the ability to debug scripts interactively using different IDEs, such as Sublime Text, Eclipse, PHP Storm, and Zend Studio.
To check whether Xdebug is installed and enabled on our PHP installation, we need to check the phpinfo() details. On the phpinfo details page, search for Xdebug, and you should see details similar to the following screenshot:

This means that our PHP installation has Xdebug installed. Now, we need to configure Xdebug. Either the Xdebug configuration will be in the php.ini file, or it will have its separate .ini file. At our installation, we will have a separate 20-xdebug.ini file placed at the /etc/php/7.0/fpm/conf.d/ path.
Note
For the purpose of this book, we will use the Homestead Vagrant box from Laravel. It provides complete tools on the Ubuntu 14.04 LTS installation, including PHP7 with Xdebug, NGINX, and MySQL. For the purpose of development, this Vagrant box is a perfect solution. More information can be found at https://laravel.com/docs/5.1/homestead.
Now, open the 20-xdebug.ini file and place the following configuration in it:
zend_extension = xdebug.so
xdebug.remote_enable = on
xdebug.remote_connect_back = on
xdebug.idekey = "vagrant"
The preceding are the minimum configurations we should use that enable remote debugging and set an IDE key. Now, restart PHP by issuing the following command in the terminal:
sudo service php-fpm7.0 restart
Now we are ready to debug some code.
The Sublime Text editor has a plugin that can be used to debug PHP code with Xdebug. First, let's install the xdebug package for Sublime Text.
First, go to Tools | Command Pallet. A popup similar to the following will be displayed:
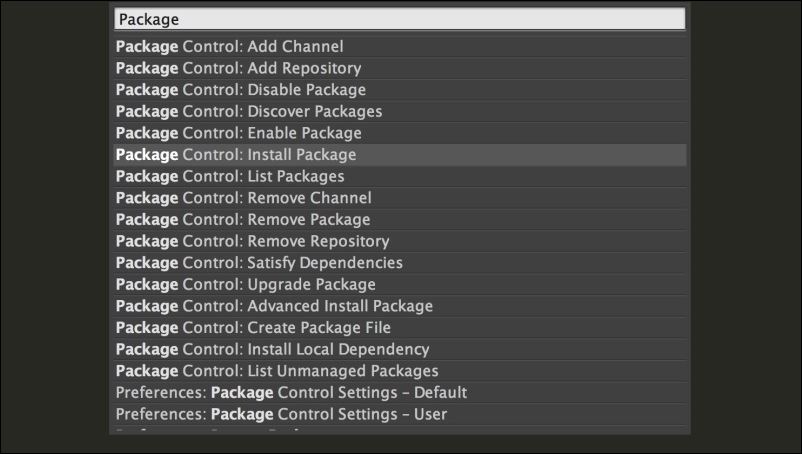
Select Package Control: Install Package, and a popup similar to the following screenshot will be displayed:
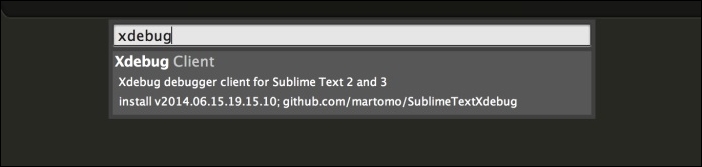
Type in xdebug, and the Xdebug Client package will be displayed. Click on it and wait for a while until it is installed.
Now, create a project in Sublime Text and save it. Open the Sublime Text project file and insert the following code in it:
{
  "folders":
  [
    {
    "follow_symlinks": true,
    "path": "."
  }
],

"settings": {
  "xdebug": {
    "path_mapping": {
    "full_path_on_remote_host" : "full_path_on_local_host"
    },
    "url" : http://url-of-application.com/,
    "super_globals" : true,
    "close_on_stop" : true,
    }
  }
}
The highlighted code is important, and it has to be entered for Xdebug. Path mapping is the most important part. It should have a full path to the root of the application on the remote host and a full path to the root of the application on the localhost.
Now, let's start debugging. Create a file at the project's root, name it index.php, and place the following code in it:
$a = [1,2,3,4,5];
$b = [4,5,6,7,8];

$c = array_merge($a, $b);
Now, right-click on a line in the editor and select Xdebug. Then, click on Add/Remove Breakpoint. Let's add a few breakpoints as shown in the following screenshot:
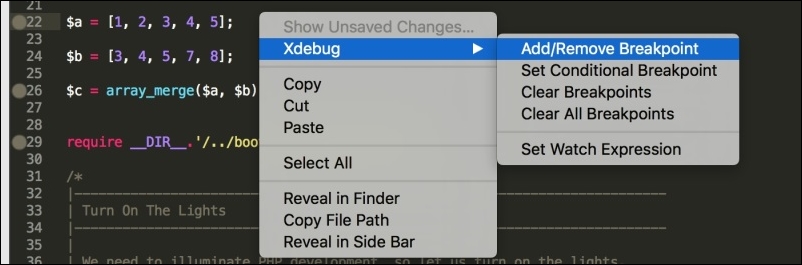
When a breakpoint is added to a line, a filled circle will be displayed on the left-hand side near the line number, as can be seen in the preceding screenshot.
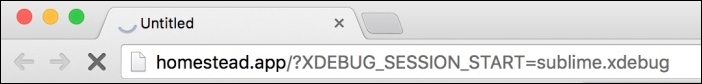
Now we are ready to debug our PHP code. Navigate to Tools | Xdebug | Start Debugging (Launch in Browser). A browser window will open the application along with a Sublime Text debug session parameter. The browser windows will be in the loading state because as soon as the first breakpoint is reached, the execution stops. The browser window will be similar to the following:
Some new small windows will also open in the Sublime Text editor that will display debugging information along with all the variables available, as in the following screenshot:
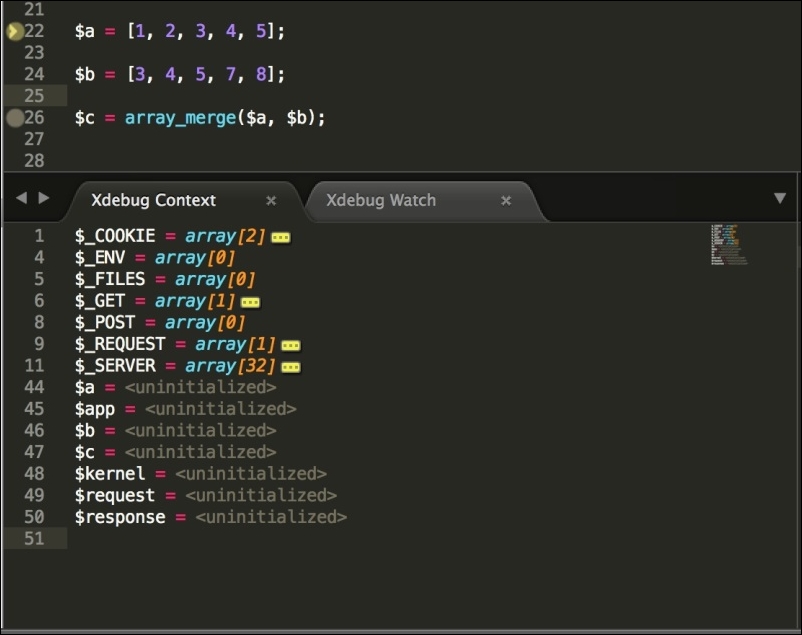
In the preceding screenshot, our $a, $b, and $c arrays are uninitialized because the execution cursor is at Line 22, and it has stopped there. Also, all server variables, cookies, environment variables, request data, and POST and GET data can be seen here. This way, we can debug all kind of variables, arrays, and objects and check what data each variable, object, or array holds at a certain point. This gives us the possibility to find out the errors that are very hard to detect without debugging.
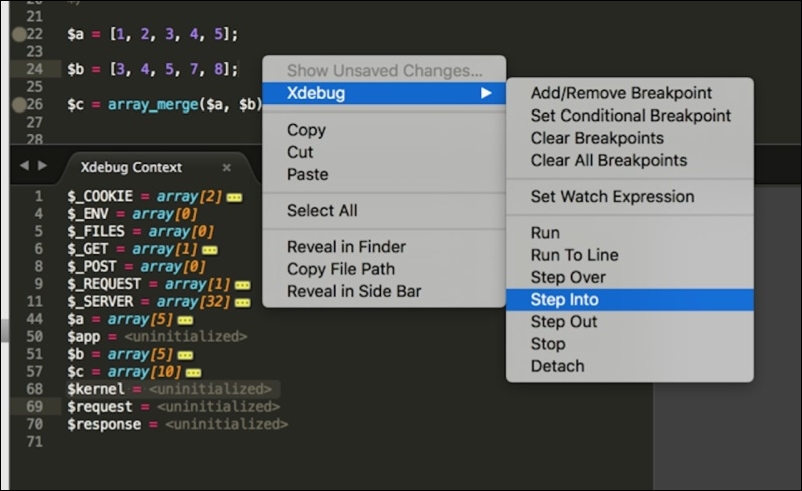
Now, let's move the execution cursor ahead. Right-click in the editor code section and go to Xdebug | Step Into. The cursor will move ahead, and the variables data may change according to the next line. This can be noted in the following screenshot:
Debugging can be stopped by clicking on Tools | Xdebug | Stop Debugging.
Eclipse is the most free and powerful IDE widely used. It supports almost all major programming languages, including PHP. We will discuss how to configure Eclipse to use Xdebug to debug.
First, open the project in Eclipse. Then, click on the down arrow to the right of the small bug icon in the tool bar, as shown in the following screenshot:
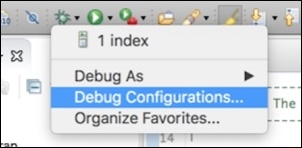
After this, click on the Debug Configuration menu, and the following windows will open:
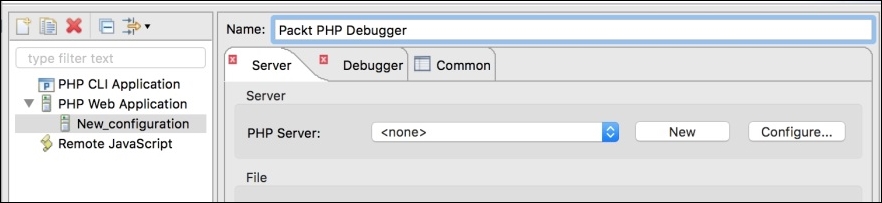
Select PHP Web Application on left panel and then click on the Add New icon in the top-left corner. This will add a new configuration, as shown in the preceding screenshot. Give the configuration a name. Now, we need to add a PHP server to our configuration. Click on the New button on the right-hand side panel, and the following window will open:
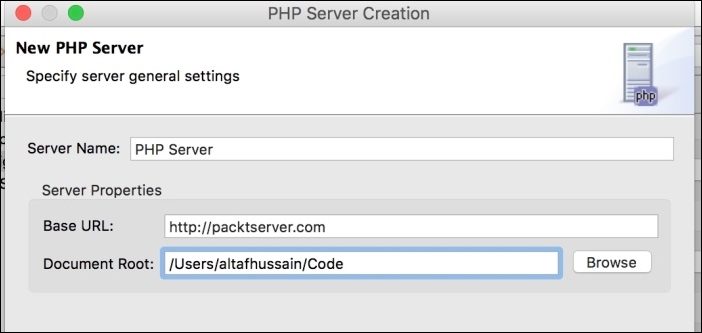
We will enter the server name as PHP Server. The server name can be anything as long as it is user-friendly and can be recognized for later use. In the Base URL field, enter the complete URL of the application. Document Root should be the local path of the root of the application. After entering all the valid data, click on the Next button, and we will see the following window:
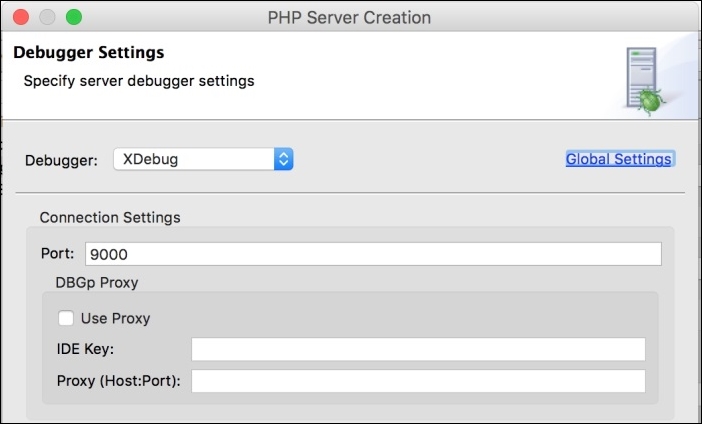
Select XDebug in the Debugger drop-down list and leave rest of the fields as they are. Click on the Next button, and we will have the path mapping window. It is very important to map the correct local path to the correct remote path. Click on the Add button, and we will have the following window:
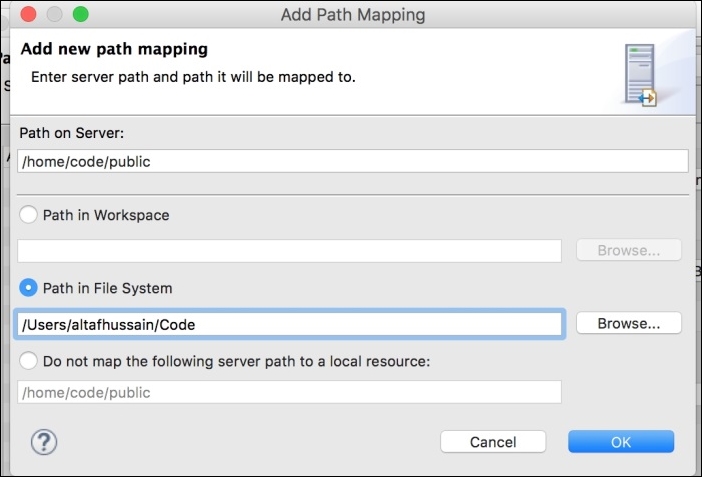
Enter the full path to the document root of the application on the remote server. Then, select Path in File System and enter the local path of the application's document root. Click on OK and then click on the Finish button in the path mapping window. Then, click on Finish in the next window to complete adding a PHP server.
Now, our configuration is ready. First, we will add some breakpoints to our PHP file by clicking on the line number bar and a small blue dot will appear there, as shown in the following screenshot. Now, click on the small bug icon on the tool bar, select Debug As, and then click on PHP Web Application. The debug process will start, and a window will be opened in the browser. It will be in the loading state, same as we saw in Sublime Text debugging. Also, the Debug perspective will be opened in Eclipse, as shown here:
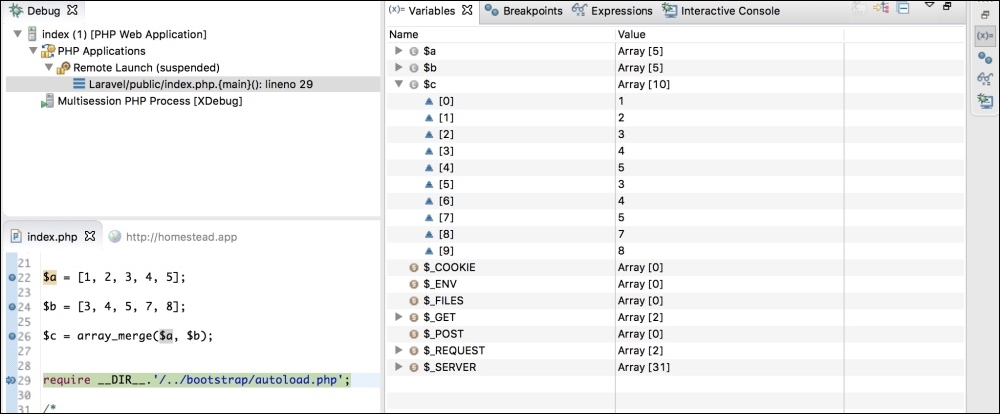
When we click on the small (X)= icon in the right-hand side bar, we will see all the variables there. Also, it is possible to edit any variable data, even the element values of any array, object properties, and cookie data. The modified data will be retained for the current debug session.
To step into the next line, we will just press F5, and the execution cursor will be moved to the next line. To step out to the next breakpoint, we will press F6.