Table of Contents for
PHP 7: Real World Application Development
 PHP 7: Real World Application Development
Published by
Packt Publishing, 2016
PHP 7: Real World Application Development
Published by
Packt Publishing, 2016
- Cover
- Table of Contents
- PHP 7: Real World Application Development
- PHP 7: Real World Application Development
- PHP 7: Real World Application Development
- Credits
- Preface
- What you need for this learning path
- Who this learning path is for
- Reader feedback
- Customer support
- 1. Module 1
- 1. Building a Foundation
- PHP 7 installation considerations
- Using the built-in PHP web server
- Defining a test MySQL database
- Installing PHPUnit
- Implementing class autoloading
- Hoovering a website
- Building a deep web scanner
- Creating a PHP 5 to PHP 7 code converter
- 2. Using PHP 7 High Performance Features
- Understanding the abstract syntax tree
- Understanding differences in parsing
- Understanding differences in foreach() handling
- Improving performance using PHP 7 enhancements
- Iterating through a massive file
- Uploading a spreadsheet into a database
- Recursive directory iterator
- 3. Working with PHP Functions
- Developing functions
- Hinting at data types
- Using return value data typing
- Using iterators
- Writing your own iterator using generators
- 4. Working with PHP Object-Oriented Programming
- Developing classes
- Extending classes
- Using static properties and methods
- Using namespaces
- Defining visibility
- Using interfaces
- Using traits
- Implementing anonymous classes
- 5. Interacting with a Database
- Using PDO to connect to a database
- Building an OOP SQL query builder
- Handling pagination
- Defining entities to match database tables
- Tying entity classes to RDBMS queries
- Embedding secondary lookups into query results
- Implementing jQuery DataTables PHP lookups
- 6. Building Scalable Websites
- Creating a generic form element generator
- Creating an HTML radio element generator
- Creating an HTML select element generator
- Implementing a form factory
- Chaining $_POST filters
- Chaining $_POST validators
- Tying validation to a form
- 7. Accessing Web Services
- Converting between PHP and XML
- Creating a simple REST client
- Creating a simple REST server
- Creating a simple SOAP client
- Creating a simple SOAP server
- 8. Working with Date/Time and International Aspects
- Using emoticons or emoji in a view script
- Converting complex characters
- Getting the locale from browser data
- Formatting numbers by locale
- Handling currency by locale
- Formatting date/time by locale
- Creating an HTML international calendar generator
- Building a recurring events generator
- Handling translation without gettext
- 9. Developing Middleware
- Authenticating with middleware
- Using middleware to implement access control
- Improving performance using the cache
- Implementing routing
- Making inter-framework system calls
- Using middleware to cross languages
- 10. Looking at Advanced Algorithms
- Using getters and setters
- Implementing a linked list
- Building a bubble sort
- Implementing a stack
- Building a binary search class
- Implementing a search engine
- Displaying a multi-dimensional array and accumulating totals
- 11. Implementing Software Design Patterns
- Creating an array to object hydrator
- Building an object to array hydrator
- Implementing a strategy pattern
- Defining a mapper
- Implementing object-relational mapping
- Implementing the Pub/Sub design pattern
- 12. Improving Web Security
- Filtering $_POST data
- Validating $_POST data
- Safeguarding the PHP session
- Securing forms with a token
- Building a secure password generator
- Safeguarding forms with a CAPTCHA
- Encrypting/decrypting without mcrypt
- 13. Best Practices, Testing, and Debugging
- Using Traits and Interfaces
- Universal exception handler
- Universal error handler
- Writing a simple test
- Writing a test suite
- Generating fake test data
- Customizing sessions using session_start parameters
- A. Defining PSR-7 Classes
- Implementing PSR-7 value object classes
- Developing a PSR-7 Request class
- Defining a PSR-7 Response class
- 2. Module 2
- 1. Setting Up the Environment
- Setting up Debian or Ubuntu
- Setting up CentOS
- Setting up Vagrant
- Summary
- 2. New Features in PHP 7
- New operators
- Uniform variable syntax
- Miscellaneous features and changes
- Summary
- 3. Improving PHP 7 Application Performance
- HTTP server optimization
- HTTP persistent connection
- Content Delivery Network (CDN)
- CSS and JavaScript optimization
- Full page caching
- Varnish
- The infrastructure
- Summary
- 4. Improving Database Performance
- Storage engines
- The Percona Server - a fork of MySQL
- MySQL performance monitoring tools
- Percona XtraDB Cluster (PXC)
- Redis – the key-value cache store
- Memcached key-value cache store
- Summary
- 5. Debugging and Profiling
- Profiling with Xdebug
- PHP DebugBar
- Summary
- 6. Stress/Load Testing PHP Applications
- ApacheBench (ab)
- Siege
- Load testing real-world applications
- Summary
- 7. Best Practices in PHP Programming
- Test-driven development (TDD)
- Design patterns
- Service-oriented architecture (SOA)
- Being object-oriented and reusable always
- PHP frameworks
- Version control system (VCS) and Git
- Deployment and Continuous Integration (CI)
- Summary
- A. Tools to Make Life Easy
- Git – A version control system
- Grunt watch
- Summary
- B. MVC and Frameworks
- Laravel
- Lumen
- Apigility
- Summary
- 3. Module 3
- 1. Ecosystem Overview
- Summary
- 2. GoF Design Patterns
- Structural patterns
- Behavioral patterns
- Summary
- 3. SOLID Design Principles
- Open/closed principle
- Liskov substitution principle
- Interface Segregation Principle
- Dependency inversion principle
- Summary
- 4. Requirement Specification for a Modular Web Shop App
- Wireframing
- Defining a technology stack
- Summary
- 5. Symfony at a Glance
- Creating a blank project
- Using Symfony console
- Controller
- Routing
- Templates
- Forms
- Configuring Symfony
- The bundle system
- Databases and Doctrine
- Testing
- Validation
- Summary
- 6. Building the Core Module
- Dependencies
- Implementation
- Unit testing
- Functional testing
- Summary
- 7. Building the Catalog Module
- Dependencies
- Implementation
- Unit testing
- Functional testing
- Summary
- 8. Building the Customer Module
- Dependencies
- Implementation
- Unit testing
- Functional testing
- Summary
- 9. Building the Payment Module
- Dependencies
- Implementation
- Unit testing
- Functional testing
- Summary
- 10. Building the Shipment Module
- Dependencies
- Implementation
- Unit testing
- Functional testing
- Summary
- 11. Building the Sales Module
- Dependencies
- Implementation
- Unit testing
- Functional testing
- Summary
- 12. Integrating and Distributing Modules
- Understanding GitHub
- Understanding Composer
- Understanding Packagist
- Summary
- Bibliography
- Index
There is always a need to monitor the performance of database servers. For this purpose, there are many tools available that make it easy to monitor MySQL servers and performance. Most of them are open source and free, and some provide a GUI. The command-line tools are more powerful and the best to use, though it takes a little time to understand and get used to them. We will discuss a few here.
This is the most famous, web-based, open source, and free tool available to manage MySQL databases. Despite managing a MySQL server, it also provides some good tools to monitor a MySQL server. If we log in to phpMyAdmin and then click on the Status tab at the top, we will see the following screen:
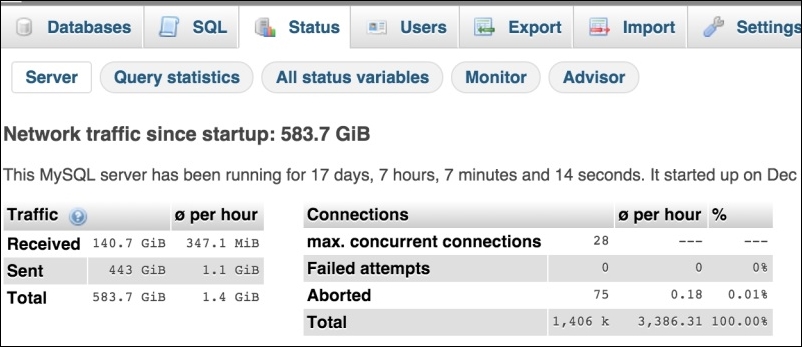
The Server tab shows us basic data about the MySQL server, such as when it started, how much traffic is handled from the last start, information about connections, and so on.
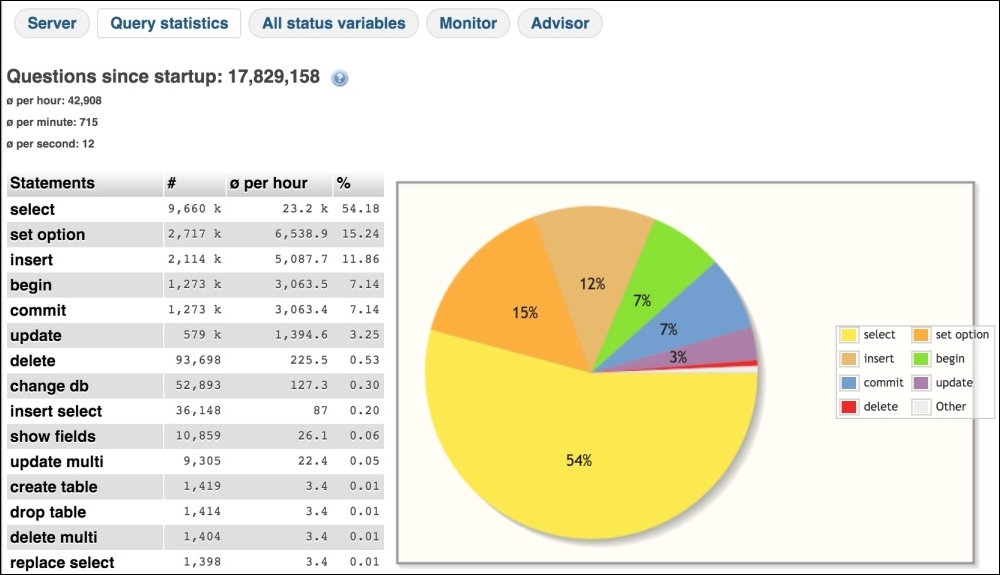
The next is Query Statistics. This section provides full stats about all of the queries executed. It also provides a pie chart, which visualizes the percentage of each query type, as shown in the following screenshot.
If we carefully look at the chart, we can see that we have 54% of the SELECT queries running. If we use some kind of cache, such as Memcached or Redis, these SELECT queries should not be this high. So, this graph and statistics information provides us with a mean to analyze our cache systems.
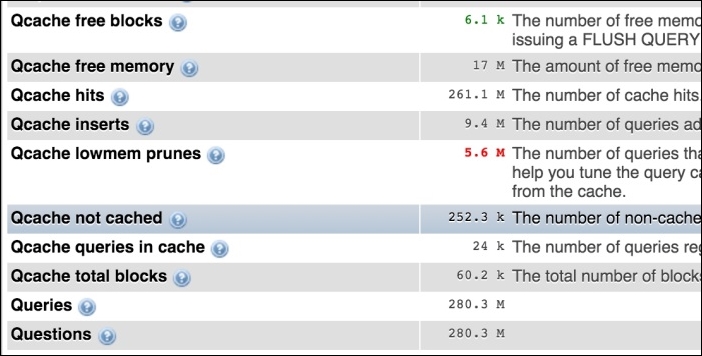
The next option is All Status Variables, which lists all of the MySQL variables and their current values. In this list, one can easily find out how MySQL is configured. In the following screenshot, our query cache variables and their values are shown:
The next option that phpMyAdmin provides is Monitor. This is a very powerful tool that displays the server resources and their usages in real time in a graphical way.
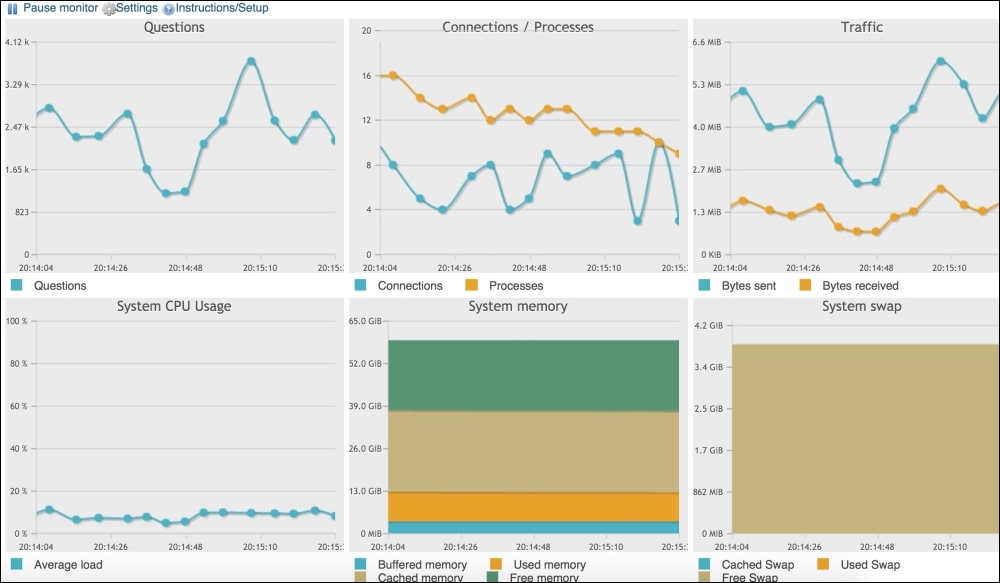
As shown in the preceding screenshot, we can see Questions, Connections/Processes, System CPU Usage, Traffic, System Memory, and System swap in a nice graphical interface.
The last important section is Advisor. This gives us advice regarding the settings for performance. It gives you as many details as possible so that the MySQL server can be tuned for performance. A small section from the advisor section is shown in the following screenshot:
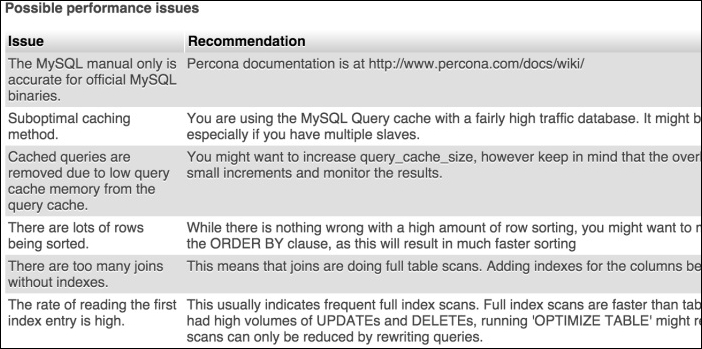
If all these advices are applied, some performance can be gained.
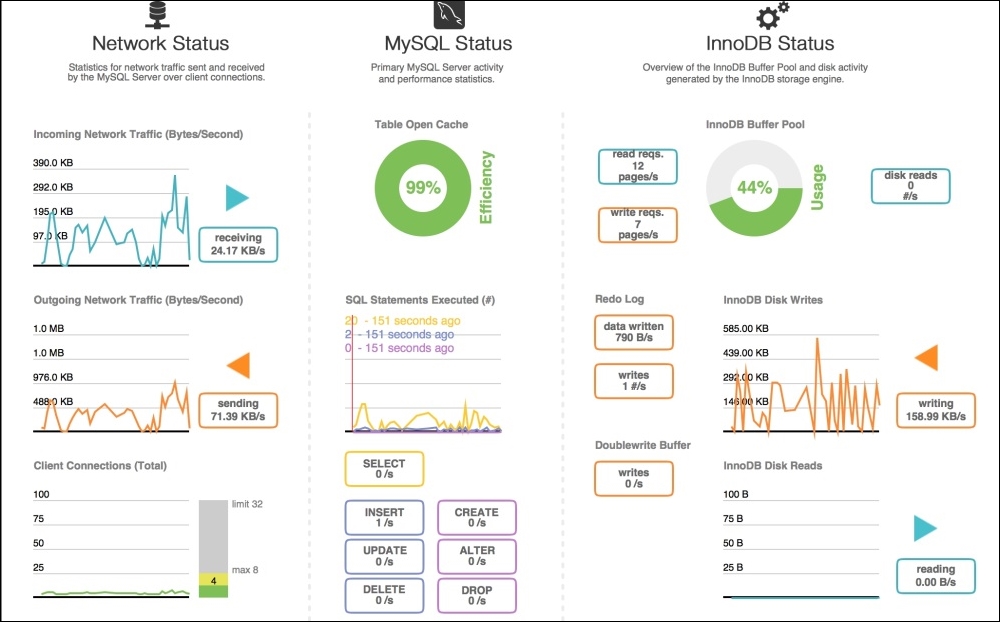
This is a desktop application from MySQL and is fully equipped with tools to manage and monitor the MySQL server. It provides us with a dashboard for performance in which all the data related to the server can be seen in a beautiful and graphical way, as shown in the screenshot that follows:
All the tools mentioned before are good and provide some visual information about our database server. However, they are not good enough to show us some more useful information or provide more features that can make our lives easy. For this purpose, another command-line toolkit is available, which is called Percona Toolkit.
Percona Toolkit is a set of more than 30 command-line tools, which includes those used to do an analysis of slow queries, archive, optimize indices and many more.
Note
Percona Toolkit is free and open source and is available under GPL. Most of its tools run on Linux/Unix-based systems, but some can run on Windows too. An installation guide can be found at https://www.percona.com/doc/percona-toolkit/2.2/installation.html. A complete set of tools can be found at https://www.percona.com/doc/percona-toolkit/2.2/index.html.
Now, let's discuss a few tools in the subsections to follow.
This tool analyzes queries from slow, general, and binary log files. It generates a sophisticated report about the queries. Let's run this tool for slow queries using the following command:
Pt-query-digest /var/log/mysql/mysql-slow.log
After entering the preceding command in the terminal, we will see a long report. Here, we will discuss a short part of the report, as shown in the following screenshot:
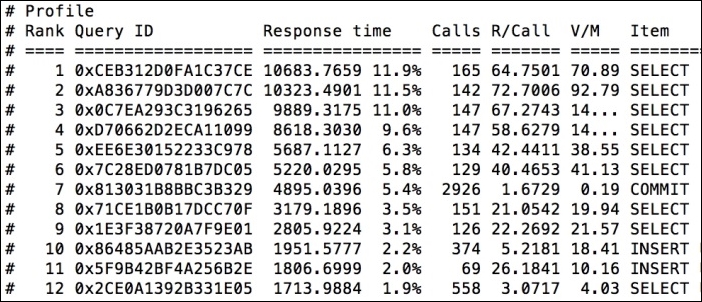
In the preceding screenshot, slow queries are listed with the slowest at the top. The first query, which is a SELECT query, takes the most time, which is about 12% of the total time. The second query, which is also a SELECT query, takes 11.5% of the total time. From this report, we can see which queries are slow so that we can optimize them for the best performance.
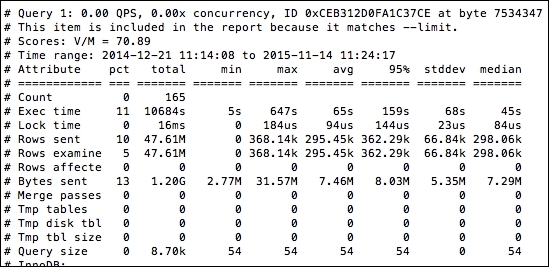
Also, pt-query-digest displays information for each query, as shown in the following screenshot. In the screenshot, data about the first query is mentioned, including the total timing; percentage (pct) of time; min, max, and average time; bytes sent; and some other parameters:
This tool finds duplicate indices and duplicate foreign keys either in a set of specified tables or in a complete database. Let's execute this tool again in a large database using the following command in the terminal:
Pt-duplicate-key-checker –user packt –password dbPassword –database packt_pub
When executed, the following output is printed:
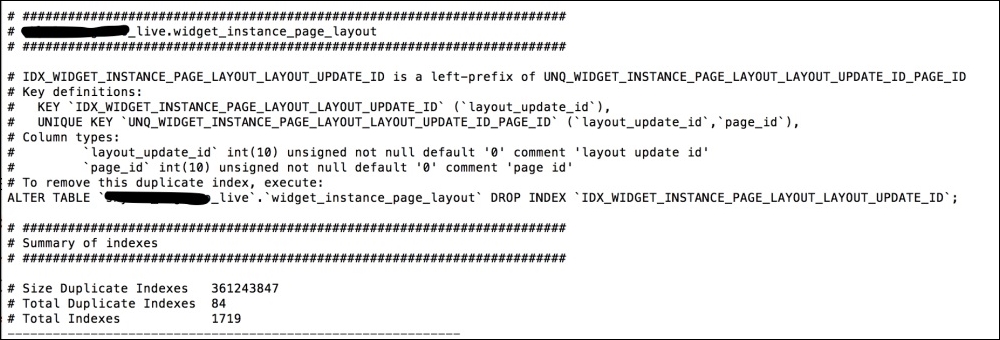
At the end of the report, a summary of the indices is displayed, which is self-explanatory. Also, this tool prints out an ALTER query for each duplicate index that can be executed as a MySQL query to fix the index, as follows:
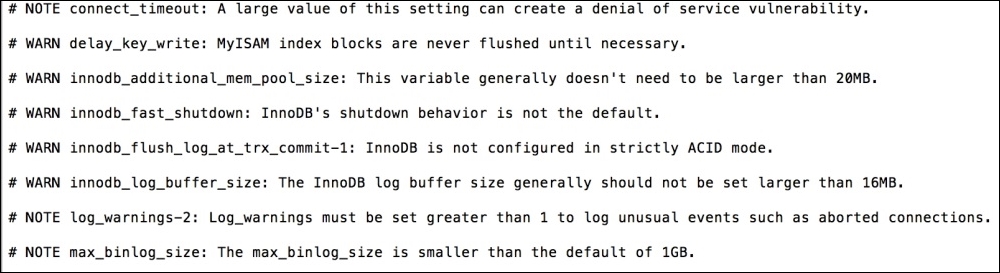
Pt-variable-advisor
This tool displays MySQL config information and advice for each query. This is a good tool that can help us set up MySQL configurations properly. We can execute this tool by running the following command:
Pt-variable-advisor –user packt –password DbPassword localhost
After execution, the following output will be displayed:
There are many other tools provided by Percona Toolkit that are out of the scope of this book. However, the documentation at https://www.percona.com/doc/percona-toolkit/2.2/index.html is very helpful and easy to understand. It provides complete details for each tool, including its description and risks, how to execute it, and other options if there are any. This documentation is worth reading if you wish to understand any tool in Percona Toolkit.