Our first example renders a Window with an OpenLayers map inside. We add three layers to the map - all of them exposed via GeoServer. We need to create a map with the following code:
/**
 * Create map
 * @param mapContainerId
 */
createMap: function(mapContainerId) {

    var proj = ol.proj.get('EPSG:4326');

    this.map = new ol.Map({
        layers: this.createLayers(),
        target: mapContainerId,
        controls: ol.control.defaults({
            attributionOptions: {
                collapsible: false
            }
        }).extend([
            new ol.control.ScaleLine(),
            new ol.control.MousePosition({
                projection: proj,
                coordinateFormat: function(coords) {
                    var output = '';
                    if (coords) {
                        output = coords[0].toFixed(5) + ' : ' +
                            coords[1].toFixed(5);
                    }
                    return output;
                }
            })
        ]),

        view: new ol.View({
            projection: proj,
            extent: proj.getExtent(),

            center: [155, -15], //Australian Great Coral Reef
            zoom: 5
        })
    });
},
The preceding code creates a map with some simple controls and the layers specified by the following method:
/**
 * creates layers for the map
 * @returns {[*]}
 */
createLayers: function() {
    var proj = ol.proj.get('EPSG:4326');
    return [
        new ol.layer.Tile({
            source: new ol.source.TileWMS({
                url: 'http://localhost:8080/geoserver/wms',
                params: {
                    'LAYERS': 'mastering_postgis:ne_coastline,
                    mastering_postgis: ne_reefs ',
                    'VERSION': '1.1.1'
                },
                projection: proj,
                extent: proj.getExtent(),
                attributions: [
                    new ol.Attribution({
                        html: 'Mastering PostGIS - GeoServer vector'
                    })
                ]
            })
        })
    ];
}
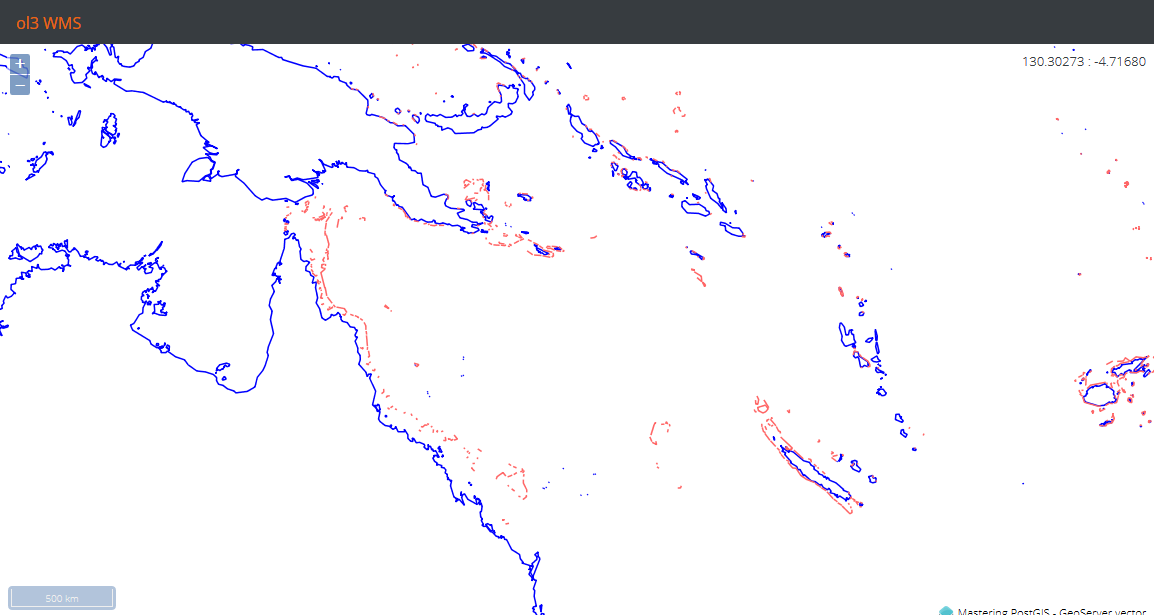
We now need to navigate to the example's folder, run sencha app watch, and navigate to http://localhost:1841/apps/02_ol3_wms/. You should see a simple map of the Australian Great Barrier Reef:
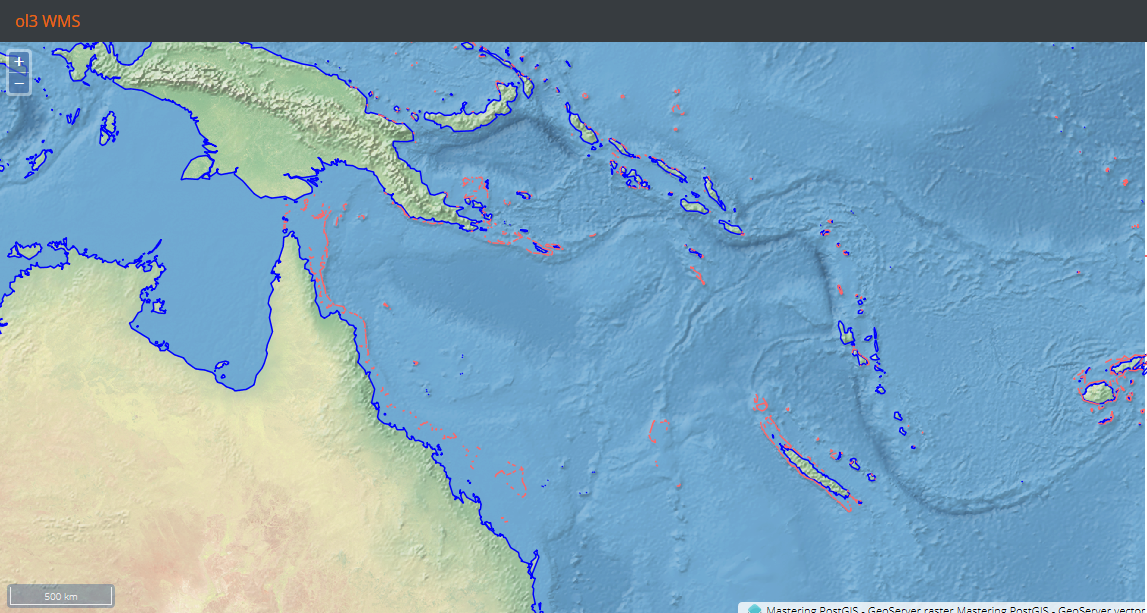
Let's add a bit of life to our map and also display the raster that we loaded using the ImageMosaicJDBC plugin:
new ol.layer.Tile({
    source: new ol.source.TileWMS({
        url: 'http://localhost:8080/geoserver/wms',
        params: {
            'LAYERS': 'mastering_postgis:ne_raster',
            'VERSION': '1.1.1'
        },
        projection: proj,
        extent: proj.getExtent(),
        attributions: [
            new ol.Attribution({
                html: 'Mastering PostGIS - GeoServer raster'
            })
        ]
    })
}),
The preceding code is just a layer definition that pulls data for our raster layer. When we add it above the WMS layer reading vector data, we should get the following output: