We will start with configuring a workspace for the data sources we are about to expose. A workspace can be treated as a form of data encapsulation, so it is possible to keep the data in order.
In order to create a workspace, click Workspaces under the Data section. Once in the Workspaces section, click the Add new workspace link. You will be presented with a form to fill in, so simply type mastering_postgis in the Name and Namespace URI fields, and then click Submit.
In order to expose data from a PostgreSQL database, we need to configure a datasource first. In order to do so, navigate to the Stores menu in the Data section.
Once in the Stores section, click the Add new Store link and then choose the PostGIS link. You will be presented with a data source configuration form, where you will provide a database connection string as well as some other settings:
- For the workspace, pick the newly created mastering_postgis workspace
- Name your data source webgis
- Tick Expose primary keys, and make sure to connect to the webgis schema
Once you submit the form, provided all the parameters were valid, you should be presented with the layer creation view:
Instead of creating a layer straight away, we will do it the harder way so the process is described in detail and can be repeated without having to create a data store first. In order to expose a PostGIS table as a WMS service, navigate to the Layers menu in the Data section.
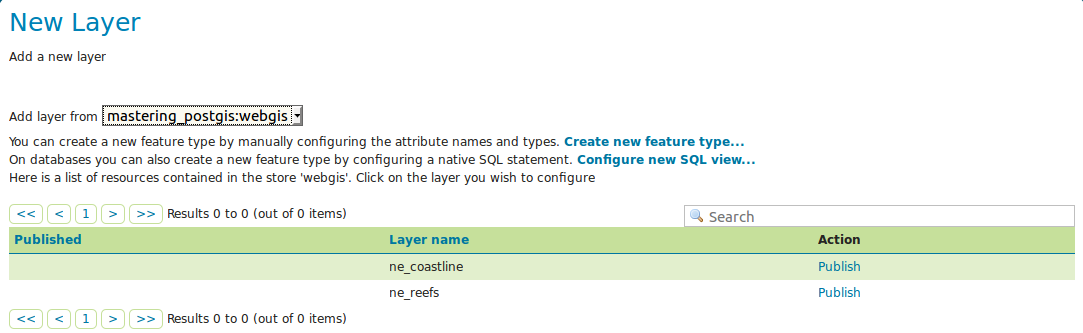
Once in the Layers section, click the Add a new layer link; you will be asked to choose a store - pick mastering_postgis:webgis. You should be presented with the New Layer screen that we have already seen.
Click Publish link next to the name of the table you are about to publish; in this scenario, let's publish the ne_coastline table. You will be presented with a Layer creation screen, where you should make sure to:
- Data tab:
- Set the declared SRS to EPSG:4326
- Set SRS handling to Force declared
- Compute Bounding Boxes using the appropriate links
- Publishing tab:
- Pick the default style for a line - it is a blueish line
Once the previous things have been set, save the layer by clicking the Save button. If all the settings were correct, you should be presented with the Layers screen, and a newly created layer should be present in the list of configured layers.
Let's make sure our layer has been defined properly. In order to do so, navigate to Layer Preview in the Data section, locate the layer, and click the link that opens a preview in OpenLayers. You should see a screen similar to the following:
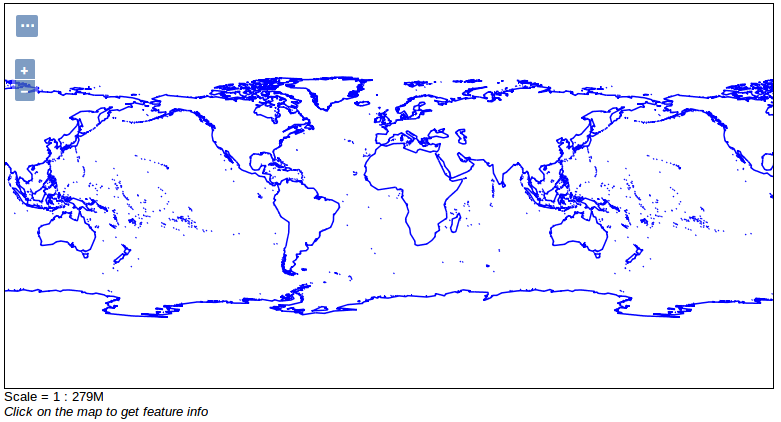
Feel free to play a bit with the layer preview; especially take a closer look at some options available to you when you click the triple dot button. You should see a simple interface that allows you to change WMS layer configurations such as: WMS version, single tile/tiled, format, and antialiasing; you can even use CQL to query the dataset. When you click a feature, you will see some feature - related data.
I strongly encourage you to have a closer look at the requests issued by the browser in order to fetch WMS data. There are many tools to do this, but since we are about to write some WebGIS examples, I suggest using either the Chrome console, or if you happen to prefer Firefox, Firebug will be the choice. For example, the following URL extracts a tile with Northeast Australia, Papua New Guinea, and the northern part of the Solomon Islands:
http://localhost:8080/geoserver/mastering_postgis/wms?SERVICE=WMS&VERSION=1.1.1&REQUEST=GetMap&FORMAT=image%2Fpng&TRANSPARENT=true&tiled=true&STYLES&LAYERS=mastering_postgis%3Ane_coastline&tilesOrigin=-180%2C-90&WIDTH=256&HEIGHT=256&SRS=EPSG%3A4326&BBOX=135%2C-22.5%2C157.5%2C0