Map declaration in Leaflet is very similar to what we did with OpenLayers:
/**
 * Create map
 * @param mapContainerId
 */
createMap: function(mapContainerId){
    this.map = new L.Map(mapContainerId, {
        crs: L.CRS.EPSG4326,
        layers: this.createLayers()
    }).setView([-15,155], 4);

    L.control.scale().addTo(this.map);
}
The preceding code creates a Leaflet Map instance and renders it into the specified container. Layers are declared in another method:
/**
 * creates layers for the map
 * @returns {[*]}
 */
createLayers: function(){
    return [
        L.tileLayer.wms('http://localhost:8081', {
            layers: 'ne_raster',
            version: '1.1.1',
            format: 'image/png',
            transparent: true,
            maxZoom: 8,
            minZoom: 0,
            continuousWorld: true,
            attribution: 'Mastering PostGIS - NodeJs WMS handler reading
            pgraster'
        }),
        L.tileLayer.wms('http://localhost:8080/geoserver/wms?', {
            layers:
            'mastering_postgis:ne_coastline,mastering_postgis:ne_reefs',
            version: '1.1.1',
            format: 'image/png',
            transparent: true,
            maxZoom: 8,
            minZoom: 0,
            continuousWorld: true,
            attribution: 'Mastering PostGIS - GeoServer vector'
        })
    ];
}
Once again, we add two WMS layers to a map: first a layer reading raster data, and next a layer rendering vector data. This time though we made a little change: our raster data WMS endpoint is now the Node.js- powered service.
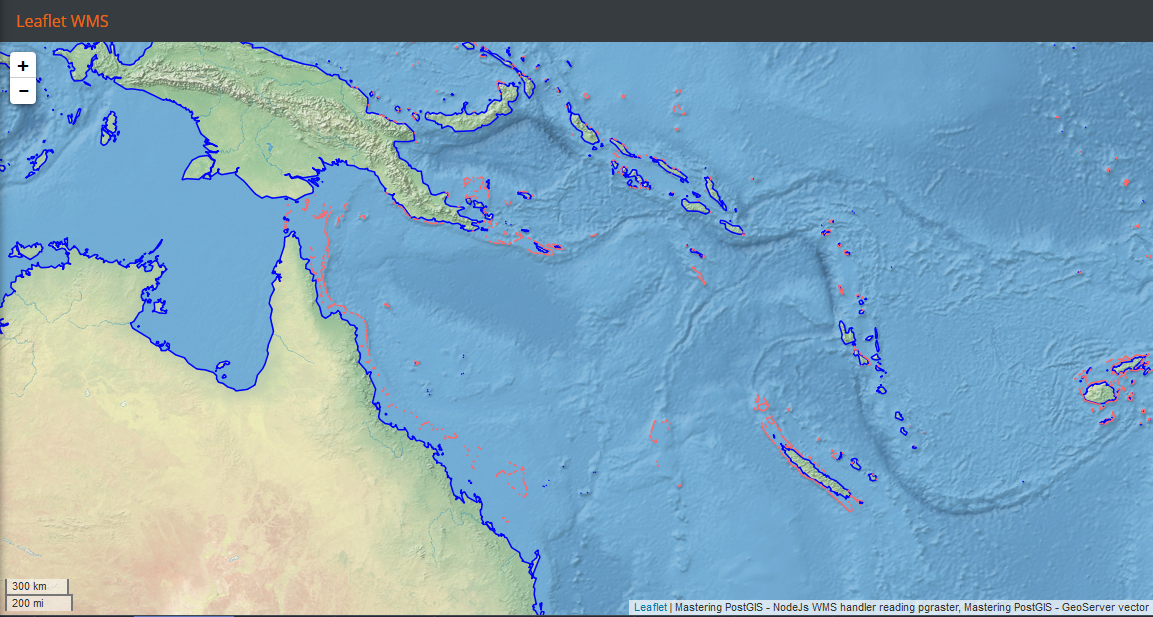
We now need to navigate to the example's folder, run sencha app watch, and navigate to http://localhost:1841/apps/03_leaflet_wms/.
As expected, the image is very similar to the one we saw already rendered by ol3. Basically, the only noticeable difference is the map controls and the panel title: