Since we have our corporate database ready, we can focus on the defined problem. Let's try to define the steps we need to take in order to complete our task:
- Obtain the weather forecast.
- Process the weather data and put it into the database.
- Assign the weather forecasts to the administrative boundaries.
- List the administrative units that meet a hypothetical alert watch.
Our company has decided to use a weather data provider called OpenWeatherMap. One can access the data via an API, and quite a lot of information is accessible with free accounts. One can also obtain data in bulk, though this requires a paid service subscription. We are not forcing you to use a commercial account, of course; we will use some data examples that are provided free of charge so potential users can familiarize themselves with the output that is provided by the service.
In this example, we will play with a weather forecast with a 3 hour interval and a 4 day timespan. The service provides fresh data every 3 hours, so it is easy to imagine how absurd it would be to process this data manually.
An example dataset can be obtained from http://bulk.openweathermap.org/sample/hourly_14.json.gz.
Let's install some node modules used by this example:
npm install pg --save
npm install line-by-line --save
We saw how to download and unzip an archive in a previous example, so these steps are skipped as there is no point in repeating them here (the source code does include the download and unzip code, though).
If you happen to experience problems downloading the data, you should find it under the data/06_processing_json directory.
Once we have downloaded and unzipped the data, we should have a look at what's inside. Basically, each line is a JSON string with the following data (based on the actual content of the JSON):
{
    city: {
        coord: {
            lat: 27.716667,
            lon: 85.316666
        },
        country: "NP",
        id: 1283240
        name: "Kathmandu",
        data: [
            ...
        ],
        time: 1411447617
    }
}
The data property contains the array of weather forecasts we are after. The weather forecast object looks like this:
{
    clouds: {...},
    dt: 1411441200,
    dt_txt: '2014-09-23 03:00:00'
    main: {...},
    rain: {...},
    sys: {...},
    weather: {...},
    wind: {
        deg: 84.0077,
        speed: 0.71
    }
}
In our scenario, we will focus on the wind speed, which is why the other properties in the preceding code are not detailed. The wind speed is expressed in m/s. We want to alert our customers whenever the forecasted wind speed exceeds level 6 on the Beaufort scale (10.8 m/s).
We already mentioned that each line of the file is a valid JSON string. This means that we can read the data line by line, without having to load all the file content to memory.
Let's read the data for Poland first:
/**
 * reads weather forecast json line by line
 */
const readJson = function(jsonFile){
    return new Promise((resolve, reject) => {
        console.log(`Reading JSON data from ${jsonFile}...`);

        let recCount = 0;
        let data = [];

        //use the line reader to read the data
        let lr = new lineReader(jsonFile);

        lr.on('error', function (err) {
            reject(err.message);
        });

        lr.on('line', function (line) {

            recCount ++;

            //we're spinning through over 10k recs, so updating
            progress every 100 seems a good choice
            if(recCount % 100 === 0){
                progressIndicator.next();
            }

            //parse string to json
            var json = JSON.parse(line);

            //and extract only records for Poland
            if(json.country === 'PL'){
                data.push(json);
            }
        });

        lr.on('end', function () {
            console.warn(`Extracted ${data.length} records out of
            ${recCount}.`)
            progressIndicator.reset();
            resolve(data);
        });
    });
}
At this stage, we have the records prefiltered, so we're ready to load them to a database. We will load the data into two tables: one will hold the forecast pinpoint - basically this is the city we obtained the forecast for, and the other table will hold the actual forecasts per city:
/**
 * loads weather forecast data to database
 */
const loadData = function(data){
    return new Promise((resolve, reject) => {
        console.log('Loading data to database...');

        let client = new pg.Client(dbCredentials);

        client.connect((err) => {
            if(err){
                reject(err.message);
                return;
            }

            //prepare querries - this will hold all of the sql so we
            can execute it in one go; the content will not be strings
            though but functions to execute
            let querries = [];

            //Table setup SQL - drop (so we're clean) and (re)create
            let tableSetup = executeNonQuery(client, `DROP TABLE IF
            EXISTS ${schemaName}.${tblWeatherPoints};
            DROP TABLE IF EXISTS ${schemaName}.${tblWeatherForecasts};
            CREATE TABLE ${schemaName}.${tblWeatherPoints} (id serial
            NOT NULL, station_id numeric, name character varying, geom
            geometry);
            CREATE TABLE ${schemaName}.${tblWeatherForecasts} (id
            serial NOT NULL, station_id numeric, dt numeric, dt_txt
            character varying(19), wind_speed numeric);
            `);

            querries.push(tableSetup);

            //data preparation - query functions with params to be applied
            to the executed sql commands
            for(let d of data){
                //weather forecast point
                querries.push(
                    executeNonQuery(
                        client,
                        `INSERT INTO  ${schemaName}.${tblWeatherPoints}
                        (station_id, name, geom) VALUES($1,$2,
                        ST_Transform(ST_SetSRID(ST_Point($3, $4), 4326),2180))`,
                        [d.city.id, d.city.name, d.city.coord.lon,
                        d.city.coord.lat]
                    )
                );

                //weather forecasts
                let forecasts = [];
                let params = [];
                let pCnt = 0;
                for(let f of d.data){
                    forecasts.push(`SELECT $${++pCnt}::numeric,
                    $${++pCnt}::numeric, $${++pCnt}, $${++pCnt}::numeric`);
                    params.push(d.city.id, f.dt, f.dt_txt, (f.wind || {})
                    .speed || null);
                }

                querries.push(
                    executeNonQuery(
                        client,
                        `INSERT INTO ${schemaName}.${tblWeatherForecasts}
                        (station_id, dt, dt_txt, wind_speed)
                        ${forecasts.join(' UNION ALL ')}`,
                        params
                    )
                );
            }

            //finally execute all the prepared query functions and wait for
            all to finish
            Promise.all(querries)
                .then(()=> {
                    client.end();
                    resolve();
                })
                .catch(err=>{
                    try{
                        client.end();
                    }
                    catch(e){}
                    reject(typeof err === 'string' ? err : err.message);
                });
        });

    });
}
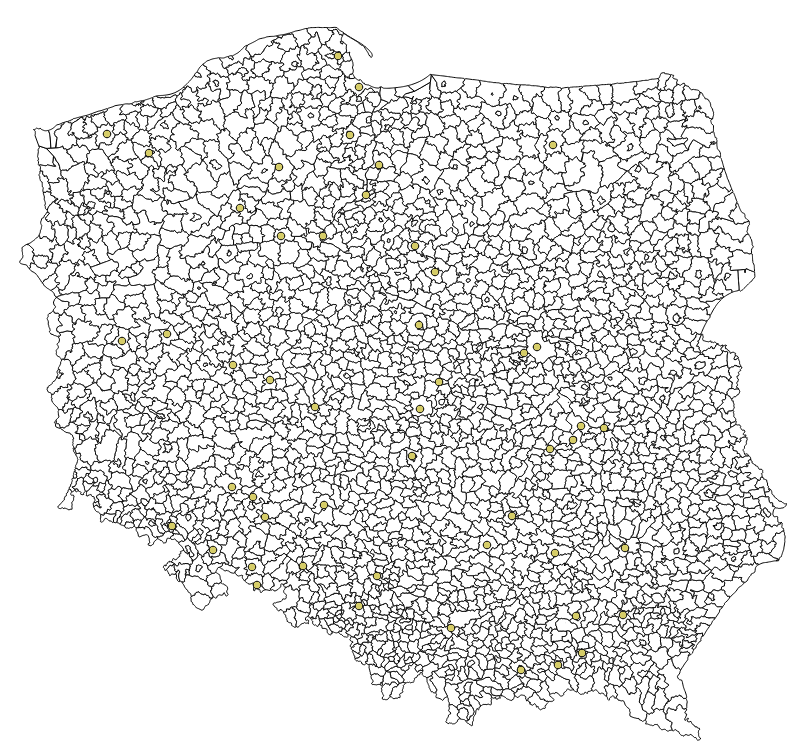
If you happened to load the data in QGIS, then at this stage, our imported datasets should look like the following:
Our final step is getting the actual wind alerts. We'll do a bit more PostGIS stuff and use Node.js to execute our query. Basically, the wind speed forecasts we downloaded are not bad at all. However, there are some records with a wind speed greater than 10.8 m/s, and this is will be our cut off wind speed (wind over 10.8 falls into level 6 of the Beaufort scale and means strong breeze; this is when handling an umbrella becomes a challenge).
So let's think for a moment about what we have to do:
- For each administrative unit, we need to assign the nearest weather station
- We have to filter out stations with wind speed forecasts that fall into the Beaufort 6 category
- We need to select the affected administrative units
We'll initially code the query in pure SQL, as it will be much easier to digest than the same code expressed as a string in Node.js.
First, let's get a list of weather station IDs where the wind speed is forecasted to exceed our cut off point:
select
   distinct on (station_id)
   station_id,
   dt,
   dt_txt,
   wind_speed
from
   weather_alerts.weather_forecasts
where
   wind_speed > 10.8
order by
   station_id, dt;
The preceding query selects the weather forecasts with wind speeds greater than the mentioned 10.8 m/s and orders them by timestamp. Thanks to that, we can use distinct on distinct on to pick the single station IDs with the more recent forecast.
Now, let's find out the nearest weather station for each administrative unit:
select
   distinct on (adm_id)
   g.jpt_kod_je as adm_id, p.station_id, ST_Distance(g.geom, p.geom) as distance
from
   weather_alerts.gminy g, weather_alerts.weather_points p
where
   ST_DWithin(g.geom, p.geom, 200000)
order by
   adm_id, distance;
We use ST_Distance to calculate the distance between administrative units and weather stations, and then order the dataset by distance. This query gets very slow the more data is processed, so a limiting clause is used to discard weather stations that are farther than 200 km from an administrative unit (it is obvious that 200 km is way too large a range to generate sensible weather alerts, but the idea remains similar and so we will use the test data).
Finally, we need to join both queries in order to get a list of the affected administrative units:
select
   f.*,
   adm.*
from
   (select
         distinct on (station_id)
         station_id,
         dt,
         dt_txt,
         wind_speed
   from
         weather_alerts.weather_forecasts
   where
         wind_speed > 10.8
   order by
         station_id, dt
   ) as f
   left join (select
         distinct on (adm_id)
               g.jpt_kod_je as adm_id, g.jpt_nazwa_ as adm_name,
               p.station_id, p.name as station_name, ST_Distance(g.geom,
               p.geom) as distance
         from
               weather_alerts.gminy g, weather_alerts.weather_points p
         where
               ST_DWithin(g.geom, p.geom, 200000)
         order by
               adm_id, distance
   ) as adm
   on adm.station_id in (select distinct f.station_id);
Once our SQL is operational, we need the final piece of code, and then we should be good to go:
/**
 * generates wind alerts
 */
const generateAlerts = function(){
    return new Promise((resolve, reject) => {
        console.log('Generating alerts...');

        let client = new pg.Client(dbCredentials);

        client.connect((err) => {
            if(err){
                reject(err.message);
                return;
            }

            let query = `
select
   f.*,
   adm.*
from
   (select
         distinct on (station_id)
         station_id,
         dt,
         dt_txt,
         wind_speed
   from
         ${schemaName}.${tblWeatherForecasts}
   where
         wind_speed > 10.8
   order by
         station_id, dt
   ) as f

   left join (select
         distinct on (adm_id)
               g.jpt_kod_je as adm_id, g.jpt_nazwa_ as adm_name,
               p.station_id, p.name as station_name, ST_Distance(g.geom,
               p.geom) as distance
         from
               ${schemaName}.${tblAdm} g, ${schemaName}.${tblWeatherPoints}
               p
         where
               ST_DWithin(g.geom, p.geom, 200000)
         order by
               adm_id, distance
   ) as adm
   on adm.station_id in (select distinct f.station_id);`

            client.query(query, (err, result)=>{
                if(err){
                    reject(err.message);
                }
                else {
                    client.end();
                    console.log(`Wind alerts generated for
                    ${result.rows.length} administrative units!`);
                    if(result.rows.length > 0){
                        let r = result.rows[0];
                        console.log(`The first one is:
                        ${JSON.stringify(r)}`);
                    }
                    resolve();
                }
            });

        });

    });
}
Let's assemble the calls to the methods we have written and execute them:
//chain all the stuff together
download(downloadUrl, path.join(downloadDir, fileName))
    .then(gunzipFile)
    .then(readJson)
    .then(loadData)
    .then(generateAlerts)
    .catch(err => console.log(`uups, an error has occured: ${err}`));
The output should be similar to the following:
Downloading http://bulk.openweathermap.org/sample/hourly_14.json.gz to F:\mastering_postgis\chapter07\hourly_14.json.gz...
File downloaded!
Unzipping 'F:\mastering_postgis\chapter07\hourly_14.json.gz'...
Unzipped!
Reading JSON data from F:\mastering_postgis\chapter07\hourly_14.json...
Extracted 50 records out of 12176.
Loading data to database...
Generating alerts...
Wind alerts generated for 92 administrative units!
The first one is: {"station_id":"3081368","dt":"1411441200","dt_txt":"2014-09-23 03:00:00","wind_speed":"10.87","adm_id":"0204022","adm_name":"Jemielno","station_name":"Wroclaw","distance": 53714.3452816274}
We have managed to transform a JSON weather forecast into a dataset with alerts for administrative units. The next steps could be exposing weather alerts via a web service, or perhaps sending out e-mails, or even SMSs.