Table of Contents for
Linux Essentials for Cybersecurity, First Edition
 Linux Essentials for Cybersecurity, First Edition
Published by
Pearson IT Certification, 2018
Linux Essentials for Cybersecurity, First Edition
Published by
Pearson IT Certification, 2018
- Cover Page
- Title Page
- Copyright Page
- Contents at a Glance
- Table of Contents
- About the Author
- Dedication
- Acknowledgments
- About the Technical Reviewers
- We Want to Hear from You!
- Reader Services
- Introduction
- Part I: Introducing Linux
- Chapter 1: Distributions and Key Components
- Chapter 2: Working on the Command Line
- Chapter 3: Getting Help
- Chapter 4: Editing Files
- Chapter 5: When Things Go Wrong
- Part II: User and Group Accounts
- Chapter 6: Managing Group Accounts
- Chapter 7: Managing User Accounts
- Chapter 8: Develop an Account Security Policy
- Part III: File and Data Storage
- Chapter 9: File Permissions
- Chapter 10: Manage Local Storage: Essentials
- Chapter 11: Manage Local Storage: Advanced Features
- Chapter 12: Manage Network Storage
- Chapter 13: Develop a Storage Security Policy
- Part IV: Automation
- Chapter 14: Crontab and At
- Chapter 15: Scripting
- Chapter 16: Common Automation Tasks
- Chapter 17: Develop an Automation Security Policy
- Part V: Networking
- Chapter 18: Networking Basics
- Chapter 19: Network Configuration
- Chapter 20: Network Service Configuration: Essential Services
- Chapter 21: Network Service Configuration: Web Services
- Chapter 22: Connecting to Remote Systems
- Chapter 23: Develop a Network Security Policy
- Part VI: Process and Log Administration
- Chapter 24: Process Control
- Chapter 25: System Logging
- Part VII: Software Management
- Chapter 26: Red Hat–Based Software Management
- Chapter 27: Debian-Based Software Management
- Chapter 28: System Booting
- Chapter 29: Develop a Software Management Security Policy
- Part VIII: Security Tasks
- Chapter 30: Footprinting
- Chapter 31: Firewalls
- Chapter 32: Intrusion Detection
- Chapter 33: Additional Security Tasks
- Appendix A: Answers to Review Questions
- Appendix B: Resource Guide
- Glossary
Chapter 30 Footprinting
Footprinting, or reconnaissance, is the process of discovering information about a network or system with the intent to use this information to compromise security measures. A large variety of footprinting techniques and tools can provide useful information. This information is then used in conjunction with other hacking tactics to gain unauthorized access to a network or system.
In this chapter, you learn about a variety of tools that perform footprinting operations.
After reading this chapter and completing the exercises, you will be able to do the following:
Use probing tools, such as nmap
Scan the local network
Understanding Footprinting
You may be wondering why you should learn about footprinting because it certainly sounds like something that only a hacker should do. The fact that footprinting is something that a hacker would use to attack your systems is exactly why you want to learn how to perform these tasks.
Think of it this way: You have decided to make your house as secure as possible, and part of that goal is to make sure all doors leading to the outside have very secure locks. You research different locks and discover three that are considered by experts to be difficult to compromise. But, which of these three is the best? One way of determining this is to find someone who knows how to bypass locks and have them test out each one. You could learn this skill yourself, but it does not make sense for this specific situation.
However, what if you had to choose door locks on a regular basis? Perhaps you were responsibility for the security of several office buildings. In that case, it may benefit you to learn more about the art of bypassing the security of locked doors. Not because you want to break into buildings, but because you want to be able to test each lock to determine the best one to use in any given situation.
The security of your systems is much like the security of a building, but much more complex. Consider that most systems already have “open doors” that allow users to access the system. For example, a web server has an open door provided by the network ports where the web server is listening. Not only do you need to know how to close these doors to unauthorized users (which will be covered in Chapter 31, “Firewalls”), but you also need to know how to determine if someone can gain information that will allow them to circumvent your security measures.
A hacker first needs information in order to begin the process of bypassing your security tactics. If a hacker can gain useful information, such as a user account name or password, then all of your efforts to secure the system may become worthless.
How do you know if a hacker can discover this information? You learn how to perform footprinting operations and use these methods on your own systems. Think like a hacker and use the same tools they use in order to probe for weaknesses in your systems.
Security Highlight
Always make sure you have written consent to perform footprinting actions on any system in an organization. Just because you work for a company does not mean you are authorized to perform these actions. In most countries, the act of performing footprinting actions is illegal, and many organizations have prosecuted their own employees who were not authorized to perform these actions.
Common Footprinting Tools
The tools covered in this section are well-known utilities that are typically used for generic reconnaissance. Note that some footprinting commands were covered in previous chapters. For example, the ping and traceroute commands are useful to determine which systems are active and the routers that are used to connect to the systems. Because routers often act as firewalls, this information could tell a hacker which systems to focus on to access more systems within your network.
The nmap Command
The nmap command is used to probe a remote system to determine which network ports are reachable from the local system. This is useful for many reasons:
• Determining what services are available on the remote system.
• Testing security features on the remote system, such as TCP wrappers.
• If the nmap command is executed from a remote network, the output could verify the effectiveness of your network’s firewall.
To use the nmap command, provide either the IP address or hostname of the system you want to scan. For example, see the output in Example 30-1 for a scan performed on a router.
root@onecoursesource ~]# nmap 192.168.1.1
Starting Nmap 5.51 ( http://nmap.org ) at 2019-10-31 23:22 PDT
Nmap scan report for 192.168.1.1
Host is up (2.9s latency).
Not shown: 987 closed ports
PORT     STATE SERVICE
23/tcp   open  telnet
25/tcp   open  smtp
53/tcp   open  domain
80/tcp   open  http
110/tcp  open  pop3
119/tcp  open  nntp
143/tcp  open  imap
465/tcp  open  smtps
563/tcp  open  snews
587/tcp  open  submission
993/tcp  open  imaps
995/tcp  open  pop3s
5000/tcp open  upnp
Nmap done: 1 IP address (1 host up) scanned in 4.89 seconds
The lines that describe the open ports start with the port number/protocol (23/tcp, for example) and end with the corresponding service (telnet, for example).
By default, only TCP (Transmission Control Protocol) ports are scanned. To scan UDP (User Datagram Protocol) ports, use the -sU option combination, as demonstrated in Example 30-2.
Example 30-2 Scanning UDP Ports
[root@onecoursesource ~]# nmap -sU 192.168.1.1
Starting Nmap 5.51 ( http://nmap.org ) at 2019-10-31  23:36 PDT
Nmap scan report for 192.168.1.1
Host is up (0.0011s latency).
Not shown: 999 open|filtered ports
PORT   STATE SERVICE
53/udp open  domain
Nmap done: 1 IP address (1 host up) scanned in 4.09 seconds
By default, only certain common ports (about 2000) are scanned. To scan all ports, use the command shown in Example 30-3 (and then take a coffee break, because this could take a while).
Example 30-3 Scanning All Ports
[root@onecoursesource ~]# nmap -p 1-65535 192.168.1.1
Starting Nmap 5.51 ( http://nmap.org ) at 2015-11-01 00:26 PDT
Nmap scan report for 192.168.1.1
Host is up (1.0s latency).
Not shown: 65521 closed ports
PORT     STATE SERVICE
23/tcp   open  telnet
25/tcp   open  smtp
53/tcp   open  domain
80/tcp   open  http
110/tcp  open  pop3
119/tcp  open  nntp
143/tcp  open  imap
465/tcp  open  smtps
563/tcp  open  snews
587/tcp  open  submission
993/tcp  open  imaps
995/tcp  open  pop3s
1780/tcp open  unknown
5000/tcp open  upnp
Nmap done: 1 IP address (1 host up) scanned in 5731.44 seconds
Typically a port has an associated local service. The nmap command can also probe these services to determine what version of the service is available. This feature is not available for all services, but for those that it is available for, it can provide useful information. Use the -sV option combination to see service version information, as shown in Example 30-4.
Example 30-4 Scanning Service Version Information
[root@onecoursesource ~]# nmap -sV 192.168.1.1
Starting Nmap 5.51 ( http://nmap.org ) at 2019-11-01 09:41 PST
Nmap scan report for 192.168.1.1
Host is up (1.0s latency).
Not shown: 987 closed ports
PORT     STATE SERVICE     VERSION
23/tcp   open  telnet?
25/tcp   open  smtp?
53/tcp   open  domain      dnsmasq 2.15-OpenDNS-1
###Remaining output omitted
You discover a machine with an IP address of 192.168.1.11 on your network, but you do not know what sort of system it is. One of the benefits of the nmap command is it might provide a clue as to what sort of system this is by probing it. For example, executing the nmap command on that IP address can provide you with an idea of what sort of system a machine is, as demonstrated in Example 30-5.
Example 30-5 Probing a Machine
[root@onecoursesource ~]# nmap -sU 192.168.1.11
Starting Nmap 5.51 ( http://nmap.org ) at 2019-10-31  23:38 PDT
Nmap scan report for 192.168.1.11
Host is up (0.00045s latency).
Not shown: 992 filtered ports
PORT     STATE         SERVICE
67/udp   open|filtered dhcps
137/udp  open          netbios-ns
138/udp  open|filtered netbios-dgm
443/udp  open|filtered https
1900/udp open|filtered upnp
4500/udp open|filtered nat-t-ike
5353/udp open|filtered zeroconf
5355/udp open|filtered llmnr
Nmap done: 1 IP address (1 host up) scanned in 52.23 seconds
Given that netbios-ns and some of the other services listed are Microsoft Windows–based services, it is likely that the operating system of this unknown system is a version of Microsoft Windows.
In some cases, you might be able to use the -O option to determine the operating system type, but this is not always successful, as demonstrated next:
[root@onecoursesource ~]# nmap -O 192.168.1.11
###Output omitted
Aggressive OS guesses: QEMU user mode network gateway (91%), Bay Networks
BayStack 450 switch (software version 3.1.0.22) (85%), Bay Networks
BayStack 450 switch (software version 4.2.0.16) (85%), Cabletron ELS100-
24TXM Switch or Icom IC-7800 radio transceiver (85%), Cisco Catalyst 1900
switch or RAD IPMUX-1 TDM-over-IP multiplexer (85%), Sanyo PLC-XU88
digital video projector (85%), 3Com SuperStack 3 Switch 4300, Dell
PowerEdge 2650 remote access controller, Samsung ML-2571N or 6555N
printer, or Xerox Phaser 3125N printer (85%), Dell 1815dn printer (85%)
No exact OS matches for host (test conditions non-ideal).
OS detection performed. Please report any incorrect results at
http://nmap.org/submit/ .
Nmap done: 1 IP address (1 host up) scanned in 15.37 seconds
So, how did you discover that a system with an IP address of 192.168.1.11 existed in the first place? Another useful feature of the nmap command is its capability to scan an entire network to determine which IP addresses are in use. To perform this operation, use the -sP option combination, as demonstrated in Example 30-6.
Example 30-6 Probing a Network
[root@onecoursesource ~]# nmap -sP 192.168.1.0/24
Starting Nmap 5.51 ( http://nmap.org ) at 2019-10-31  23:51 PDT
Nmap scan report for 192.168.1.0
Host is up (0.00043s latency).
Nmap scan report for 192.168.1.1
Host is up (0.0026s latency).
Nmap scan report for 192.168.1.2
Host is up (0.70s latency).
Nmap scan report for 192.168.1.3
Host is up (0.045s latency).
Nmap scan report for 192.168.1.4
Host is up (0.043s latency).
Nmap scan report for 192.168.1.7
Host is up (0.00011s latency).
Nmap scan report for 192.168.1.11
Host is up (0.0020s latency).
Nmap scan report for 192.168.1.12
Host is up (0.00013s latency).
Nmap scan report for 192.168.1.14
Host is up (3.7s latency).
Nmap scan report for 192.168.1.16
Host is up (0.00088s latency).
You can see information about your own system, including a list of network interfaces and the routing table, by using the --iflist option, as shown in Example 30-7.
Example 30-7 Listing Network Interfaces
[root@onecoursesource ~]# nmap --iflist

Starting Nmap 5.51 ( http://nmap.org ) at 2019-11-01 09:39 PST
************************INTERFACES************************
DEV  (SHORT) IP/MASK      TYPE     UP MTU   MAC
lo   (lo)    127.0.0.1/8  loopback up 65536
eth0 (eth0)  10.0.2.15/24 ethernet up 1500  08:00:27:E0:E2:DE

**************************ROUTES**************************
DST/MASK    DEV  GATEWAY
10.0.2.0/24 eth0
0.0.0.0/0   eth0 10.0.2.2
The netstat Command
The netstat command can be used to view activity of local network information, as opposed to scanning remote network ports with the nmap command.
Security Highlight
To run the netstat command, the user first needs to gain local access to the system; however, this access can be a regular user account (root access is not required). This highlights the need to make sure regular accounts are secure.
For example, the netstat -s command displays a summary of network packet information broken down by protocol, as shown in Example 30-8.
Example 30-8 The netstat -s Command
[root@onecoursesource ~]# netstat -s
Ip:
    170277 total packets received
    2 with invalid addresses
    0 forwarded
    0 incoming packets discarded
    168563 incoming packets delivered
    370967 requests sent out
    293 dropped because of missing route
Icmp:
    9223 ICMP messages received
    1000 input ICMP message failed.
    ICMP input histogram:
        destination unreachable: 1231
        echo replies: 7992
    10072 ICMP messages sent
    0 ICMP messages failed
    ICMP output histogram:
        destination unreachable: 1507
        echo request: 8001
IcmpMsg:
        InType0: 7992
        InType3: 1231
        OutType3: 1507
        OutType8: 8001
        OutType69: 564
Tcp:
    348 active connections openings
    1 passive connection openings
    8 failed connection attempts
    0 connection resets received
    2 connections established
    158566 segments received
    80619 segments send out
    552 segments retransmited
    0 bad segments received.
    96 resets sent
Udp:
    774 packets received
    6 packets to unknown port received.
    0 packet receive errors
    903 packets sent
UdpLite:
TcpExt:
    130 TCP sockets finished time wait in fast timer
    107 delayed acks sent
    5 delayed acks further delayed because of locked socket
    30284 packets header predicted
    272 acknowledgments not containing data received
    51589 predicted acknowledgments
    0 TCP data loss events
    69 other TCP timeouts
    69 connections aborted due to timeout
IpExt:
    InOctets: 17393378
    OutOctets: 17585203
The netstat command can also display the routing table, similar to the route command:
[root@onecoursesource ~]# netstat -r
Kernel IP routing table
Destination     Gateway         Genmask         Flags   MSS Window  irtt Iface
10.0.2.0        *               255.255.255.0   U         0 0          0 eth0
default         10.0.2.2        0.0.0.0         UG        0 0          0 eth0
There will be times when you want to see network statistics for each interface. Using the netstat -i command, you can see data broken down in this manner:
[root@onecoursesource ~]# netstat -i
Kernel Interface table
Iface    MTU Met   RX-OK RX-ERR RX-DRP RX-OVR    TX-OK TX-ERR TX-DRP TX-OVR Flg
eth0    1500   0   93957      0      0      0   294652      0      0      0 BMRU
lo     65536   0   77198      0      0      0    77198      0      0      0 LRU
The output of the netstat -i command includes many columns of information (which is common for most of the netstat command options). Here are the important columns for this command:
• RX-OK and TX-OK: Received and transmitted packets with no error
• RX-ERR and TX-ERR: Received and transmitted packets that had an error
• RX-DRP and TX-DRP: Received and transmitted packets that were dropped
• RX-OVR and TX-OVR: Received and transmitted packets that were not receivable by this interface
Normally the RX-OK and TX-OK values are considerably higher than the rest. If the other values appear to be too high when compared to the OK values, there could be a problem with your network. It may be useful to watch these values as they change over time. It is useful to include this information with the baselines for the network for future comparison. This can be accomplished by using the -c option: netstat -ci.
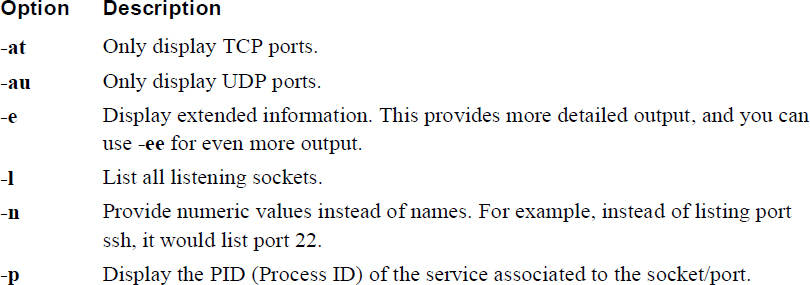
The netstat command has a huge number of options. Table 30-1 provides details about some of the more useful ones.
Table 30-1 Useful netstat Options
Note
If you look at the man page for the netstat command on most modern Linux distributions, you will likely see a message like the following:
NOTE
       This  program is obsolete. Replacement for netstat is ss.
Replacement for netstat -r is ip route. Replacement for net-stat -i
is ip -s link. Replacement for netstat -g is ip maddr.
As a result, you may wonder why the authors of this book chose to describe the netstat command instead of the ip or ss command. There are a few reasons:
• Although the ip and ss commands are very useful tools, the netstat command provides many of the same features.
• Many existing shell scripts make use of the netstat command, and the assumption here is that you will explore these scripts, so you should understand what this command does.
• Although netstat may be listed as obsolete, it still exists on just about all Linux distributions by default. In fact, is has been listed as obsolete for many years now and yet it is still used on a regular basis by many administrators. In other words, it is highly unlikely that it will be “going away” any time soon.
The lsof Command
The lsof command is designed to list open files. When you first learned about Linux, you were likely told that everything in Linux is a file. This is definitely true because network sockets are files from the kernel’s perspective.
Conversational Learning™ — Port vs. Socket
Gary: Hey, Julia. I have a question about ports and sockets.
Julia: OK, what’s the question?
Gary: I am having a hard time understanding the difference between the two. The two terms are often used interchangeably, but are they actually two different things?
Julia: Yes, they are. A port is like a door. If a door is open, you can enter a room. If the door is locked, you can’t enter the room. So, if port 22 is open on a remote system, you can “enter that room,” meaning you can establish a connection via SSH to the remote system.
Gary: So, what is a socket?
Julia: The socket is part of the connection. There are two sockets per connection; these are the endpoints of the connection on each system. A socket is partly defined by the port because that is the “door” that the communication must travel through, but they are not the same thing. A socket is also associated with a process that is handling the connection on the software side of the equation.
Gary: Hmm… I’m not sure I am getting it.
Julia: Here’s another way to think about it: Your system can have an open port but can’t have a corresponding socket if there is no active connection. You can’t have a socket without an open port.
Gary: OK, so having a port is like having a telephone number. But, just because my phone has a telephone number, doesn’t mean I am always making a call.
Julia: Right, but when you make or receive a call…
Gary: Then I have created a socket for my telephone!
Julia: You got it!
To list open network sockets with the lsof command, use the -i option, as shown in Example 30-9.
Example 30-9 The lsof -i Command
[root@onecoursesource ~]# lsof -i
COMMAND    PID    USER   FD   TYPE DEVICE SIZE/OFF NODE NAME
iscsid    1303    root    8u  IPv4  22642      0t0  TCP localhost:48897->localhost:iscsi-target (ESTABLISHED)
rpcbind   1559     rpc    6u  IPv4  12739      0t0  UDP *:sunrpc
rpcbind   1559     rpc    7u  IPv4  12741      0t0  UDP *:iclcnet-locate
rpcbind   1559     rpc    8u  IPv4  12742      0t0  TCP *:sunrpc (LISTEN)
rpcbind   1559     rpc    9u  IPv6  12744      0t0  UDP *:sunrpc
rpcbind   1559     rpc   10u  IPv6  12746      0t0  UDP *:iclcnet-locate
rpcbind   1559     rpc   11u  IPv6  12747      0t0  TCP *:sunrpc (LISTEN)
rpc.statd 1616 rpcuser    5u  IPv4  12988      0t0  UDP localhost:944
rpc.statd 1616 rpcuser    8u  IPv4  12994      0t0  UDP *:51463
rpc.statd 1616 rpcuser    9u  IPv4  12998      0t0  TCP *:45982 (LISTEN)
rpc.statd 1616 rpcuser   10u  IPv6  13002      0t0  UDP *:41413
rpc.statd 1616 rpcuser   11u  IPv6  13006      0t0  TCP *:46716 (LISTEN)
cupsd     1656    root    6u  IPv6  13155      0t0  TCP localhost:ipp (LISTEN)
cupsd     1656    root    7u  IPv4  13156      0t0  TCP localhost:ipp (LISTEN)
cupsd     1656    root    9u  IPv4  13159      0t0  UDP *:ipp
tgtd      1939    root    4u  IPv4  14111      0t0  TCP *:iscsi-target (LISTEN)
tgtd      1939    root    5u  IPv6  14112      0t0  TCP *:iscsi-target (LISTEN)
tgtd      1939    root   10u  IPv4  22647      0t0  TCP localhost:iscsi-target->localhost:48897 (ESTABLISHED)
tgtd      1942    root    4u  IPv4  14111      0t0  TCP *:iscsi-target (LISTEN)
tgtd      1942    root    5u  IPv6  14112      0t0  TCP *:iscsi-target (LISTEN)
sshd      1993    root    3u  IPv4  15292      0t0  TCP *:ssh (LISTEN)
sshd      1993    root    4u  IPv6  15303      0t0  TCP *:ssh (LISTEN)
clock-app 2703    root   22w  IPv4  62027      0t0  TCP localhost:54295->184.180.124.66:http (ESTABLISHED)
dhclient  2922    root    6u  IPv4  22552      0t0  UDP *:bootpc
There are several ways to limit the output, including by port number (lsof -i:22), by service name (lsof -i:ssh), and by host (lsof -i @onecoursesource.com).
Here are two options to the lsof command that can speed up the command:
• -n: This option tells the lsof command to not resolve IP addresses to hostnames.
• -P: This option tells the lsof command to not resolve port numbers to port names.
The nc Command
The man page of the nc command provides an excellent summary of the nc command:
“The nc (or netcat) utility is used for just about anything under the sun involving TCP or UDP. It can open TCP connections, send UDP packets, listen on arbitrary TCP and UDP ports, do port scanning, and deal with both IPv4 and IPv6. Unlike telnet(1), nc scripts nicely, and separates error messages onto standard error instead of sending them to standard output, as telnet(1) does with some.”
There are quite a few uses for the nc command. For example, suppose you want to know if a specific port was being blocked by your company firewall before you bring a service online that makes use of this port. On the internal server, you can have the nc command listen for connections on that port:
[root@server ~]# nc -l 3333
The result should be a blank line below the nc command. Next, on a remote system outside your network, you could run the following nc command to connect (replace server with the resolvable hostname or IP address of the local system):
[root@client Desktop]# nc server 3333
If the connection is established, you see a blank line under the nc command line. If you type something on this blank line and press the Enter key, then what you typed appears below the nc command on the server. Actually, the communication works both ways: What you type on the server below the nc command appears on the client as well.
Here are some useful options to the nc command:
• -w: This option is used on the client side to close a connection automatically after a timeout value is reached. For example, nc -w 30 server 333 closes the connection 30 seconds after it has been established.
• -6: Use this option to enable IPv6 connections.
• -k: Use this option to keep server processes active, even after the client disconnects. The default behavior is to stop the server process when the client disconnects.
• -u: Use UDP connections rather than TCP connections (the default). This is important for correctly testing firewall configurations as a UDP port might not be blocked while the TCP port is blocked.
You can also use the nc command to display open ports, similar to the netstat command:
[root@onecoursesource Desktop]# nc -z localhost 1000-4000
Connection to localhost 3260 port [tcp/iscsi-target] succeeded!
Connection to localhost 3333 port [tcp/dec-notes] succeeded!
The -z option can also be used to port-scan a remote host.
There is one feature of the nc command that is a useful technique to transfer all sorts of data. The format that you use, assuming the transfer is from the client to the server, is shown here (replace cmd with an actual command):
• On the server: nc -l 3333 | cmd
• On the client: cmd | nc server 3333
For example, you can transfer an entire /home directory structure from the client to the server using the tar command by first executing the following on the server:
nc -l 333 | tar xvf -
Then on the client, execute the following command:
tar cvf - /home | nc server 333
The client merges the contents of the /home directory structure into a tar ball. The - tells the tar command to send this output to standard output. The data is sent to the server via the client’s nc command, and then the server’s nc command sends this data to the tar command. The result is the /home directory from the client is now copied into the current directory of the server.
Security Highlight
This is just one technique of many that uses this powerful feature of the nc command. It also highlights how a hacker could use the nc command to transfer data, even if you have blocked other network ports and disabled file sharing software such as Secure Shell and FTP. Remember that all of the tools covered in this chapter are tools used by hackers to compromise systems.
The tcpdump Command
When you’re troubleshooting network issues or performing network security audits, it can be helpful to view the network traffic, including traffic that is not related to the local machine. The tcpdump command is a “packet sniffer” that allows you to view local network traffic.
By default, the tcpdump command displays all network traffic to standard output until you terminate the command. This could result in a dizzying amount of data flying by on your screen. You can limit the output to a specific number of network packets by using the -c option, as shown in Example 30-10.
Example 30-10 The tcpdump Command
[root@onecoursesource ~]# tcpdump -c 5
tcpdump: verbose output suppressed, use -v or -vv for full protocol decode
listening on eth0, link-type EN10MB (Ethernet), capture size 65535 bytes
11:32:59.630873 IP localhost.43066 > 192.168.1.1.domain: 16227+ A? onecoursesource.com. (37)
11:32:59.631272 IP localhost.59247 > 192.168.1.1.domain: 2117+ PTR? 1.1.168.192.in-addr.arpa. (42)
11:32:59.631387 IP localhost.43066 > 192.168.1.1.domain: 19647+ AAAA? onecoursesource.com. (37)
11:32:59.647932 IP 192.168.1.1.domain > localhost.59247: 2117 NXDomain* 0/1/0 (97)
11:32:59.717499 IP 192.168.1.1.domain > localhost.43066: 16227 1/0/0 A 38.89.136.109 (53)
5 packets captured
5 packets received by filter
0 packets dropped by kernel
More likely you want to capture the output based on some sort of criteria. For example, you can have the tcpdump command only capture packets available on a specific interface by using the -i option:
[root@onecoursesource ~]# tcpdump -i eth0
To limit packets to only a specific protocol, indicate the protocol name as an argument:
[root@onecoursesource ~]# tcpdump -i eth0 tcp
To only display packets associated with a specific port, use the port argument:
[root@onecoursesource ~]# tcpdump -i eth0 port 80
You can also limit the packets based on the source IP or destination IP:
[root@onecoursesource ~]# tcpdump -i src 192.168.1.100
[root@onecoursesource ~]# tcpdump -i dst 192.168.1.100
In many case, you will likely want to leave the tcpdump command running for a short period of time and view the data at some later date. In this case, it is best to use the -c option to limit the output and place the data into a file by using the -w option:
[root@onecoursesource ~]# tcpdump -c 5000 -w output-tcpdump
This file contains binary data. To read its contents, use the -r option to the tcpdump command:
[root@onecoursesource ~]# tcpdump -r output-tcpdump
Additional Utilities
We have just started to scratch the surface when it comes to commonly used footprinting tools. Here are some additional utilities you should consider exploring:
• ping: The ping command is discussed in Chapter 19, “Network Configuration,” and is used to determine if a system is reachable via the network.
• traceroute: The traceroute command is also discussed in Chapter 19. It is used to see the routers used to “get to” a system.
• whois: The whois command provides information about domain registration. Hackers will use this information to gather intelligence about the register, including names, email address, addresses, and phone numbers. This information may then be used to perform additional exploits.
• nslookup and dig: These commands are discussed in Chapter 19. They are used to perform queries on DNS servers to discover systems that might be exploited. For example, a DNS query could return the IP address and hostname of a domain’s mail server, providing a hacker with the ability to execute attacks designed to work on email servers.
Kali Linux Utilities
Kali Linux has a large selection of footprinting-based tools—well over 60 tools. Some are designed to probe specific types of software, such as Samba or mail servers. In some cases, these tools will provide easier-to-use frontend interfaces to utilities or commands that we have previously discussed. For example, the SPARTA tool uses the nmap command to probe systems and generate reports.
Other utilities provide similar functions (although normally with more features) to commands we have already covered. For example, the fping utility sends ICMP echo requests to hosts like the ping command, but it has more features than the ping command provides.
There are so many footprinting tools on Kali Linux that it is impossible to cover all of them in this book. Instead of providing specifics of each of these utilities, this section focuses on providing an overview of some of the categories of tools so that you can explore them on your own.
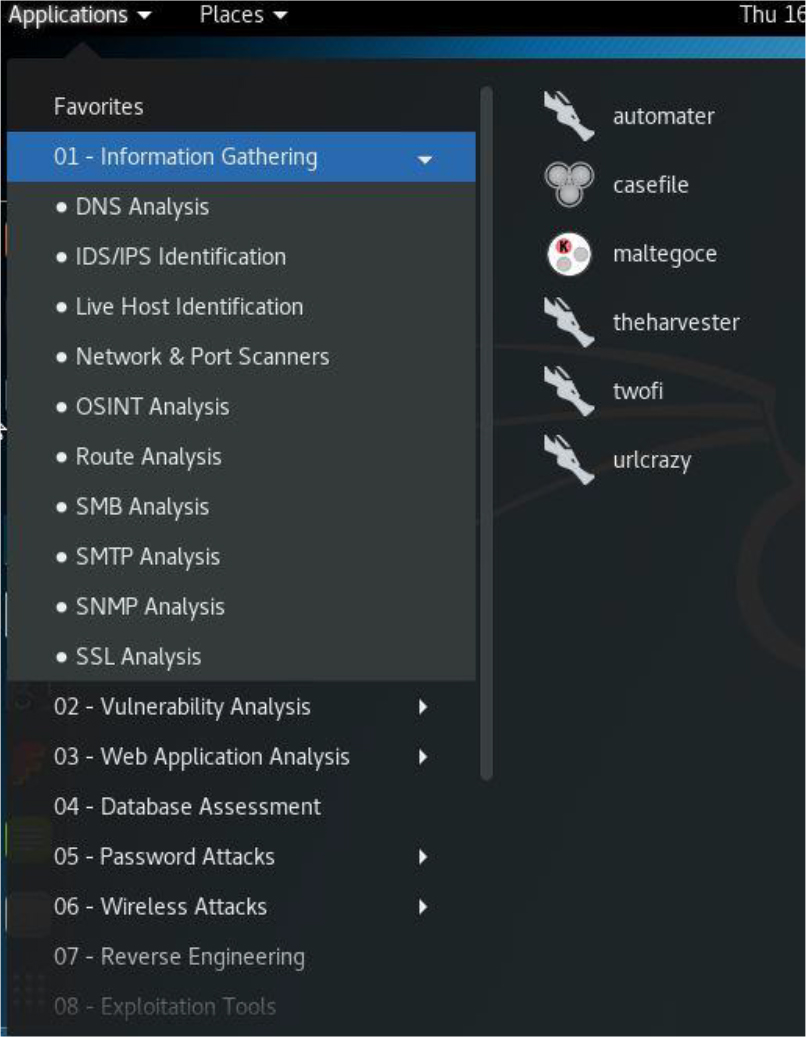
Essential Information Gathering
While in Kali Linux, click Applications and then point to 01 – Information Gathering. The list provided should be similar to Figure 30-1.
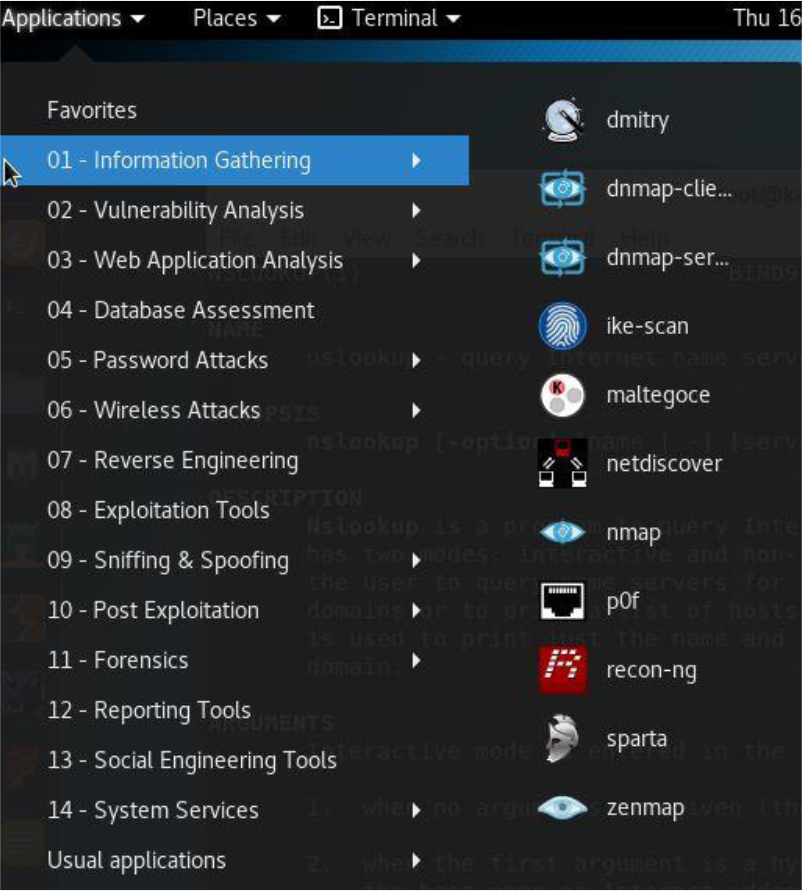
Figure 30-1 Information-Gathering Tools
The tools in this category are primarily used to perform basic scans on systems.
DNS Analysis Tools
While in Kali Linux, click Applications, click 01 – Information Gathering, and then point to DNS Analysis. The list provided should be similar to Figure 30-2.
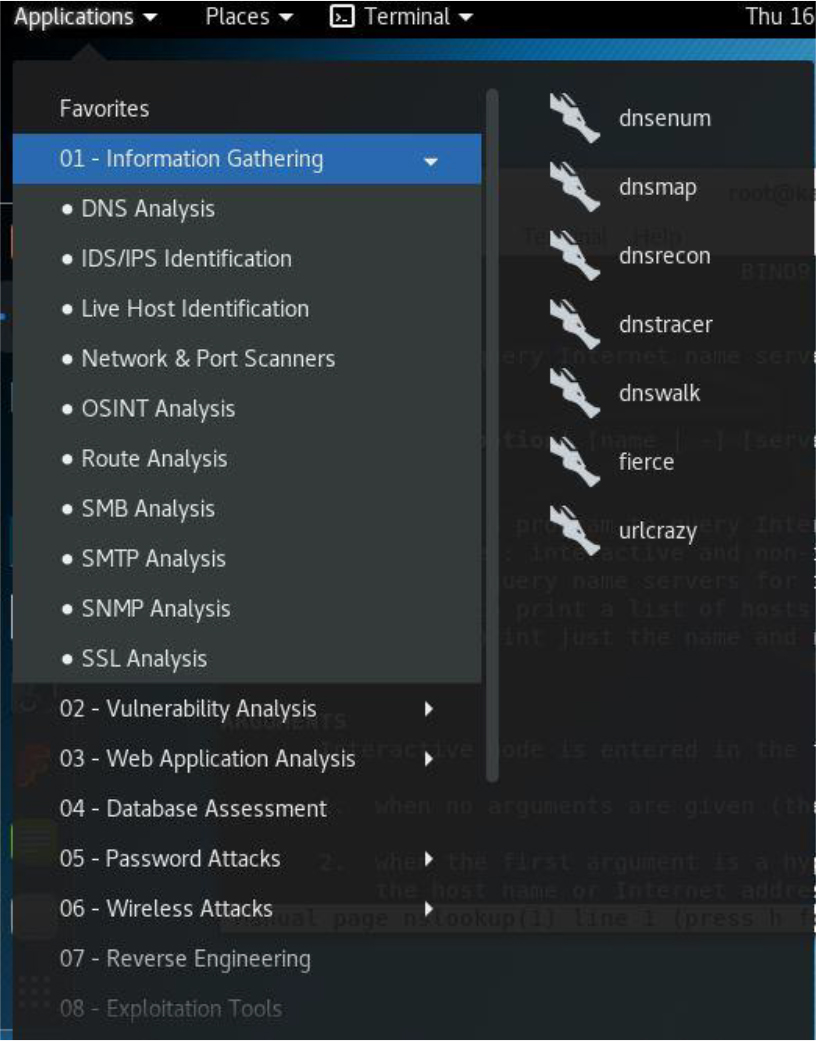
Figure 30-2 DNS Analysis Tools
The tools in this category are primarily used to gather DNS information, much like the nslookup and dig commands, but with more options and features.
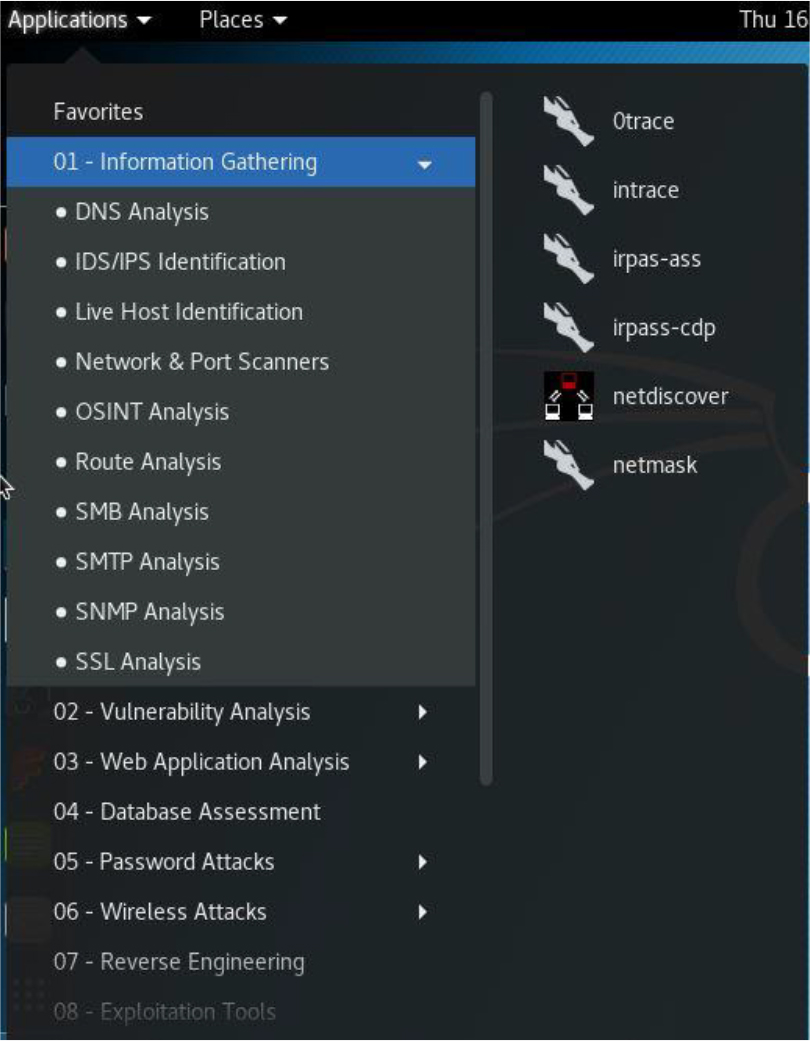
Host Identification Tools
While in Kali Linux, click Applications, click 01 – Information Gathering, and then point to Live Host Identification. The list provided should be similar to Figure 30-3.
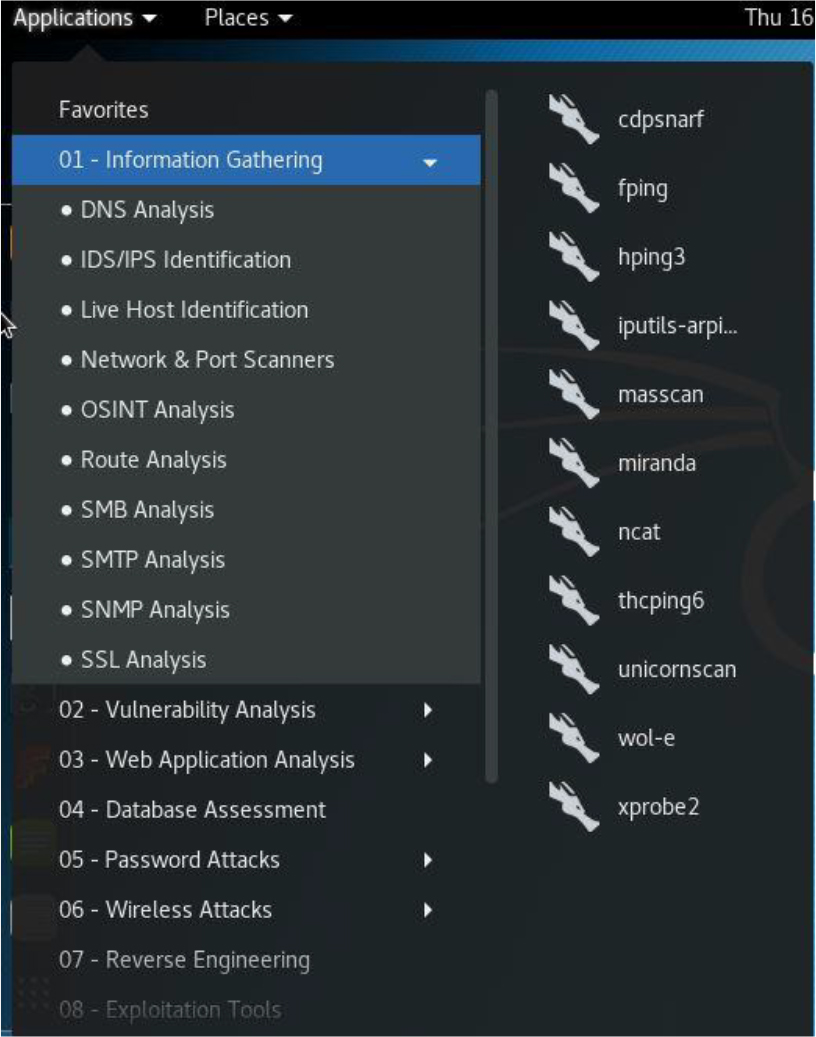
Figure 30-3 Host Identification
The tools in this category are primarily used to probe systems to determine if the systems are currently “alive” and reachable via the network.
OSINT Tools
While in Kali Linux, click Applications, click 01 – Information Gathering, and then point to OSINT Analysis. The list provided should be similar to Figure 30-4.
The tools in this category primarily use OSINT techniques to gather intelligence about a target. OSINT stands for open source intelligence, which refers to using data that is publicly available (hence the term “open”) about organizations and systems, similar to the whois command.
Route Analysis Tools
While in Kali Linux, click Applications, click 01 – Information Gathering, and then point to Route Analysis. The list provided should be similar to Figure 30-5.
The tools in this category are designed to determine the route that is taken to get to a specific host or network, similar to the traceroute command.
Summary
In this chapter, you learned about several different techniques for performing footprinting analysis. This included probing systems and networks for critical information.
Key Terms
Review Questions
1. To only scan for open UDP ports using the nmap command, what option or options would you use?
a. -sP
b. -sU
c. -sT
d. -sD
2. The _____ option to the nmap command attempts to determine the operating system type of a remote system.
3. Which option to the netstat command displays the routing table?
a. -r
b. -n
c. -t
d. None of the above
4. Which option to the netstat command displays numeric values instead of names?
a. -r
b. -n
c. -t
d. None of the above
5. The _____ command lists open files on the local system.
6. The endpoint of a network communication is called a _____.
7. You can open an arbitrary TCP or UDP connection to a remote system by using which command?
a. netstat
b. lsof
c. ping
d. nc
8. The _____ option to the tcpdump command limits the display to include packets available only on a specific interface.