
Kapacitor is a real-time data processing engine. It can process stream and batch data from InfluxDB. Similar to Telegraf, it has a plugin-driven design. This makes Kapacitor very flexible. It can easily integrate with many open source libraries and engines. The user can define their own plugins. It is used to publish the subscribed event-driven design pattern, which helps Kapacitor to easily handle streaming real-time data.
Consider the upcoming example.
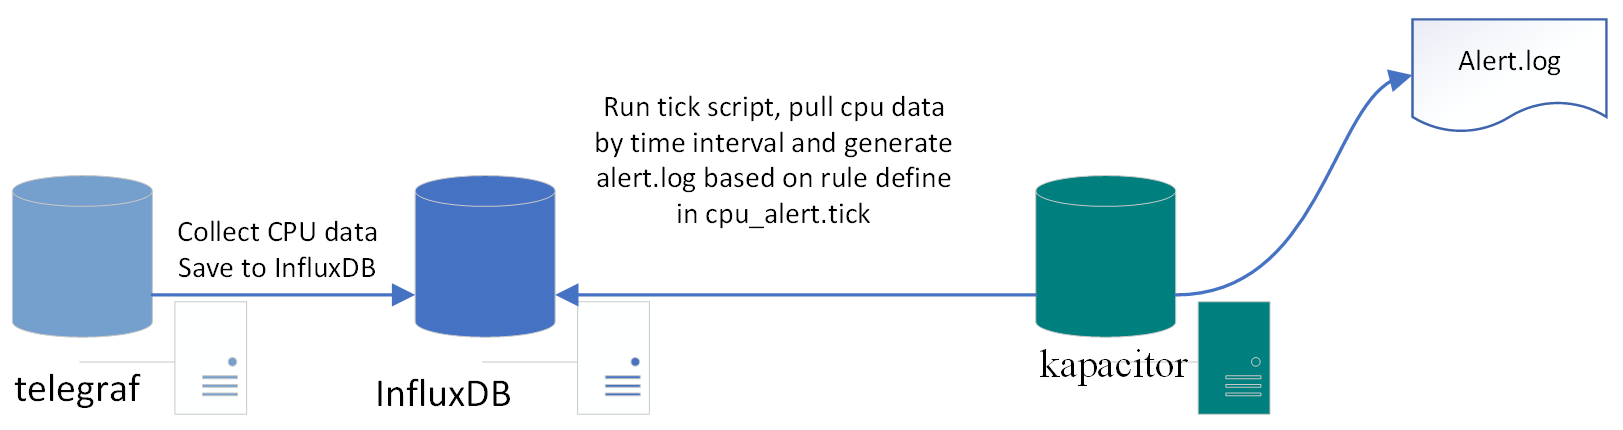
Use Kapacitor triggering alerts and set up an alert on high CPU usage.
We use the previous telegraf example and send the CPU data to InfluxDB. Then Kapacitor pulls the data from InfluxDB using ticker script, which defines the rules and tells Kapacitor to generate the alert log:
Install Kapacitor using the following command:
wget https://dl.influxdata.com/kapacitor/releases/kapacitor_1.3.3_amd64.deb
sudo dpkg -i kapacitor_1.3.3_amd64.deb
For other environments, refer to the following installation link:
https://portal.influxdata.com/downloads
Once the install is successful, start Telegraf using the following command:
sudo systemctl start telegraf
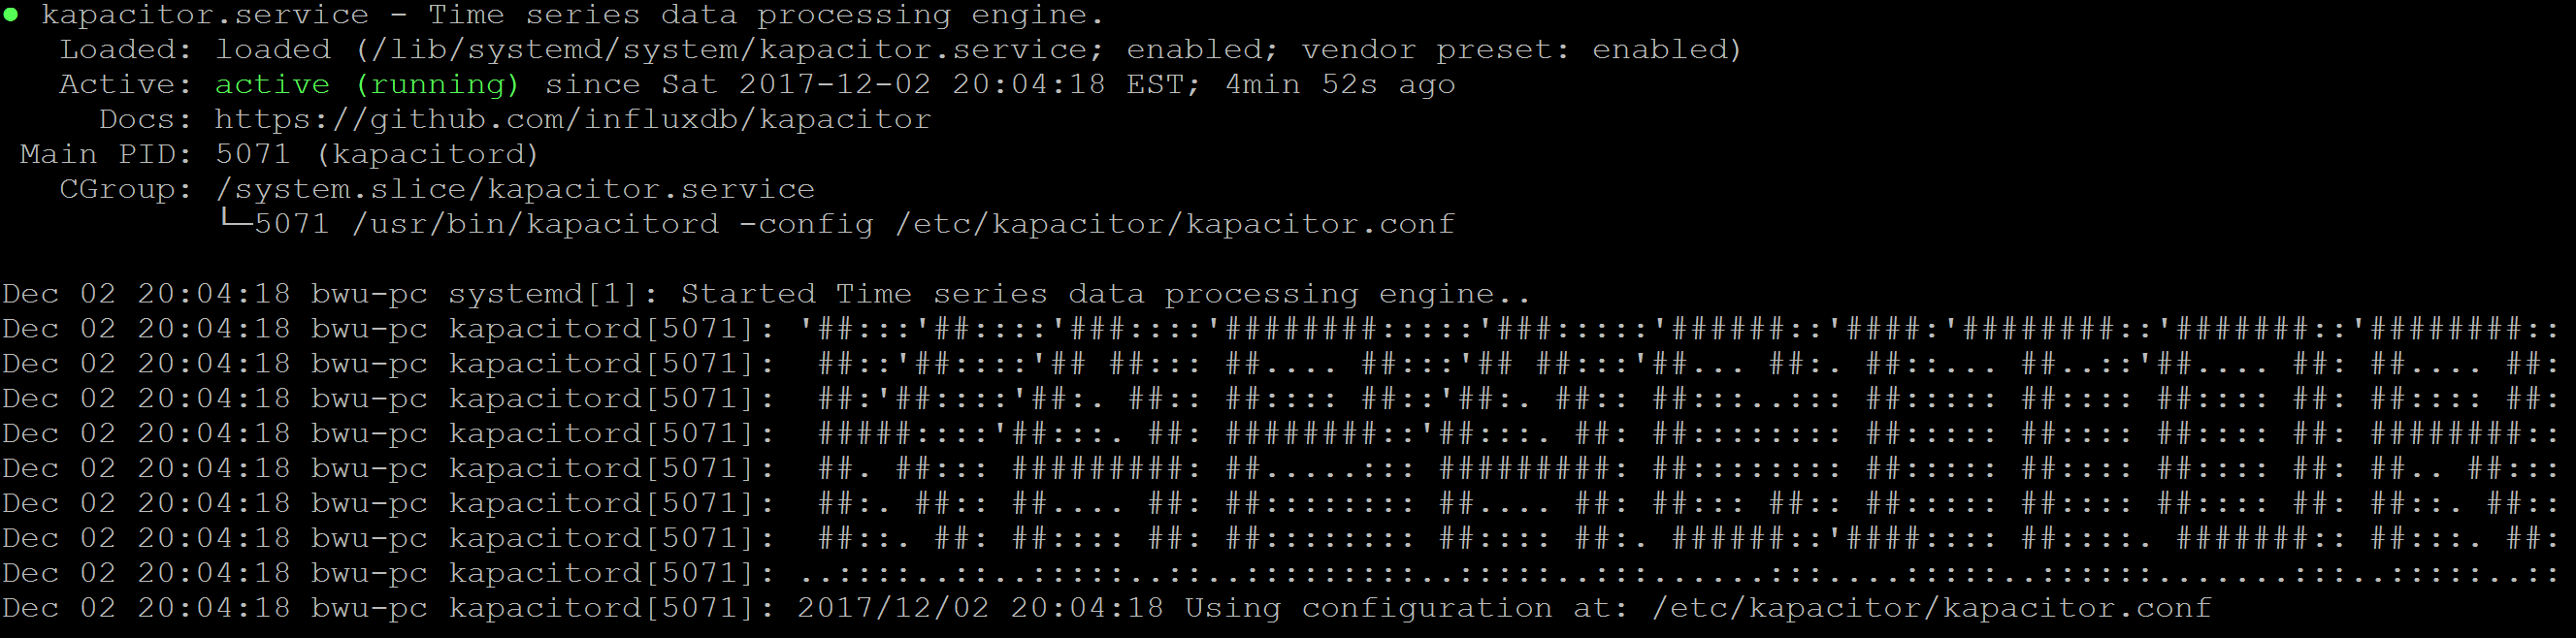
Start Kapacitor and check the status using the following command:
sudo systemctl start kapacitor
sudo systemctl status kapacitor
View the Kapacitor logs using the following command:
sudo tail -f -n 128 /var/log/kapacitor/kapacitor.log
Define a TICKscript. A TICKscript is a domain-specific language (DSL) that defines the tasks. It tells Kapacitor how to process the pipeline. Create a file by the name cpu_alert.tick:
stream
// Select just the cpu measurement from our example database.
|from()
.measurement('cpu')
|alert()
.crit(lambda: int("usage_idle") < 100)
// Whenever we get an alert write it to a file.
.log('/tmp/alerts.log')
Use Kapacitor's CLI tool to define the cpu_alert task and provide the stream type, tick file, database, and RP:
$ kapacitor define cpu_alert
> -type stream
> -tick cpu_alert.tick
> -dbrp telegraf.autogen
Enable the cpu_alert task using the following command:
$ kapacitor enable cpu_alert
Verify that the cpu_alert task is created and enabled in the tasks list:
$ kapacitor list tasks
ID Type Status Executing Databases and Retention Policies
cpu_alert stream enabled true ["telegraf"."autogen"]
Now, we have set up the task; it is time to record the stream data using the cpu_alert task. We set up the duration as 60 s; it will return the task ID:
$ kapacitor record stream -task cpu_alert -duration 60s
f5943f37-bb49-4431-8ab1-fd27a772a7de
Check the task recording status by returning the task ID using the following command:
f5943f37-bb49-4431-8ab1-fd27a772a7de:
$ kapacitor list recordings f5943f37-bb49-4431-8ab1-fd27a772a7de
ID Type Status Size Date
f5943f37-bb49-4431-8ab1-fd27a772a7de stream finished 1.1 kB 02 Dec 17 21:00 EST
Check the end point InfluxDB send data to Kapacitor:
$ curl -G 'http://localhost:8086/query?db=telegraf' --data-urlencode 'q=SHOW SUBSCRIPTIONS'
{"results":[{"statement_id":0,"series":[{"name":"_internal","columns":["retention_policy","name","mode","destinations"],"values":[["monitor","kapacitor-736ab512-4d00-408a-b852-c3a17dc5ffd1","ANY",["http://localhost:9092"]]]},{"name":"market","columns":["retention_policy","name","mode","destinations"],"values":[["autogen","kapacitor-736ab512-4d00-408a-b852-c3a17dc5ffd1","ANY",["http://localhost:9092"]]]},{"name":"market_watch","columns":["retention_policy","name","mode","destinations"],"values":[["autogen","kapacitor-736ab512-4d00-408a-b852-c3a17dc5ffd1","ANY",["http://localhost:9092"]]]},{"name":"testdb","columns":["retention_policy","name","mode","destinations"],"values":[["autogen","kapacitor-736ab512-4d00-408a-b852-c3a17dc5ffd1","ANY",["http://localhost:9092"]]]},{"name":"telegraf","columns":["retention_policy","name","mode","destinations"],"values":[["autogen","kapacitor-736ab512-4d00-408a-b852-c3a17dc5ffd1","ANY",["http://localhost:9092"]]]}]}]}
From InfluxDB log, we can see Kapacitor start recording the data:
[InfluxDB] 2017/12/03 01:37:56 D! linking subscriptions for cluster localhost
[httpd] 127.0.0.1 - - [03/Dec/2017:01:38:00 -0500] "POST /write?consistency=&db=telegraf&precision=ns&rp=autogen HTTP/1.1" 204 0 "-" "InfluxDBClient" 81766872-d7f4-11e7-8a93-000000000000 294[cpu_alert:alert2] 2017/12/03 01:38:00 D! CRITICAL alert triggered id:cpu:nil msg:cpu:nil is CRITICAL data:&{cpu map[cpu:cpu0 host:bwu-pc] [time usage_guest usage_guest_nice usage_idle usage_iowait usage_irq usage_nice usage_softirq usage_steal usage_system usage_user] [[2017-12-03 06:38:00 +0000 UTC 0 0 95.97989949747311 0.10050251256280458 0 0 0 0 0.3015075376884316 3.618090452262322]]}
Finally, check /tmp/alert.logs. The ones defined as critical events are flushed into alert.log as follows:
$ tail -f -n 100 /tmp/alert.logs
We just completed the end-to-end integration between Telegraf, InfluxDB, and Kapacitor!