InfluxDB supports a powerful HTTP API that runs by default on port 8086 with reading and writing capabilities. Since InfluxDB does not require a schema-defined upfront, this allows applications client store data and pulls data through HTTP API. It is very useful in many use cases, such as DevOps. It can automatically pull data from Jenkins to InfluxDB.
InfluxDB has four end points for interaction with, /ping, /debug/requests, /query, and /write.
The /ping command provides a simple way to verify that a source computer can communicate over the network with a remote InfluxDB instance. It can check the status and version information. It also supports both GET and HEAD HTTP requests.
Consider the upcoming example:
If you are in the same instance of InfluxDB, try this curl -sl -I http://localhost:8086/ping:
curl -sl -I http://localhost:8086/ping
HTTP/1.1 204 No Content
Content-Type: application/json
Request-Id: 91306baa-d710-11e7-800b-000000000000
X-InfluxDB-Version: 1.5
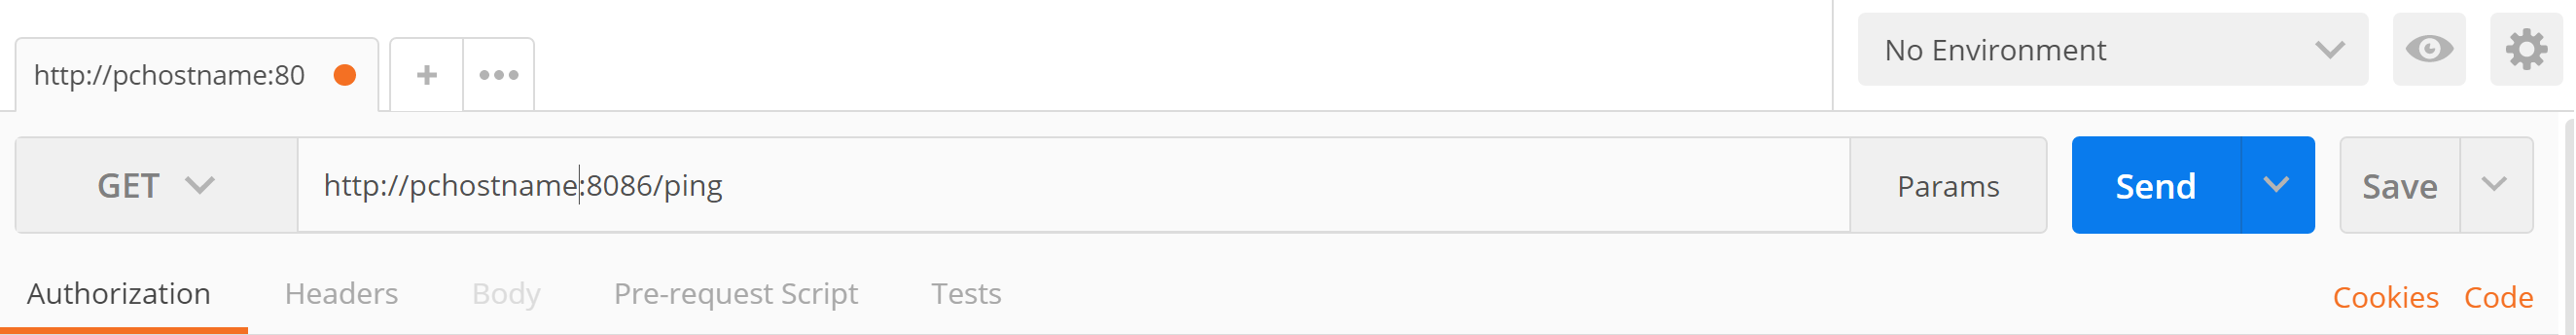
204 mean success status. If you are in the window client, you can use Postman (HTTP RESTful tool) to send HTTP rest APIs to InfluxDB. You will get the same 204 response from the InfluxDB instance.
Postman can be downloaded from here https://www.getpostman.com/apps.
When you send the request from the client, you need to get the IP address or hostname to replace the localhost: http://yourInstanceDBHostnameOrIPaddress:8086/ping.
In the following example, we will use the command-line tool to test:
/debug/requests
This request checks the user request information.
Consider the upcoming example.
Open two Unix Terminals. In one Terminal, enter debugs/request.
http://localhost:8086/debug/requests?seconds=60
It will show all the user requests in the past 60 seconds. The other Terminal runs the following query command a few times:
curl -G 'http://localhost:8086/query?db=market' --data-urlencode 'q=SELECT * FROM tickers limit 5'
The following is the result for debug/request after 60 seconds:
curl http://localhost:8086/debug/requests?seconds=60
{
"127.0.0.1": {"writes":0,"queries":3}
}
It shows that there are three query requests sent from a user and zero write requests. The sender IP address is 127.0.0.1.
If the query seconds is equal to 60, the parameter is not added to the URL and the default 10 seconds will be used.
In the previous example, we have a demo of a simple /query request, which is used to get data from tickers measurement in the market database. /query is very powerful. You can use this to retrieve data points, handle retention points, users, and even manage the database. /query supports the GET and POST HTTP methods. SELECT and show keywords can run under the /query GET method.
The POST method handles cluster admin functions, ALTER, CREATE, DELETE, DROP, GRANT, KILL, and REVOKE.
Therefore, we need to be very careful when we use POST to handle database DDL operations. This kind of request must be as a cluster admin.
Let's look at an example of creating a database for a better understanding:
$ curl -i -XPOST http://localhost:8086/query --data-urlencode "q=CREATE DATABASE testdb"
HTTP/1.1 200 OK
...
Verify that the testdb database is created by running the SHOW command:
~$ curl -G 'http://localhost:8086/query' --data-urlencode 'q=SHOW DATABASES '
{"results":[{"statement_id":0,"series":[{"name":"databases","columns":["name"],"values ":[["_internal"],["market"],["market_watch"],["testdb"]]}]}]}
Let's look at an example of deleting a database for a better understanding:
~$ curl -i -XPOST http://localhost:8086/query --data-urlencode "q=DROP DATABASE testdb"
..
~$ curl -G 'http://localhost:8086/query' --data-urlencode 'q=SHOW DATABASES'
{"results":[{"statement_id":0,"series":[{"name":"databases","columns":["name"],"values":[["_internal"],["market"],["market_watch"]]}]}]}
To run multiple queries, just use a semicolon to separate out these queries:
~$ curl -G 'http://localhost:8086/query?pretty=true' --data-urlencode "db=market" --data-urlencode "q=SELECT c ount(*) FROM tickers WHERE ticker='JPM';SELECT MEAN(close) FROM tickers WHERE ticker='GOOGL'"
{
"results": [
{
"statement_id": 0,
"series": [
{
"name": "tickers",
"columns": [
"time",
"count_close",
"count_company",
...
],
"values": [
[
"1970-01-01T00:00:00Z",
1172,
1172,
..
]
]
}
]
},
{
"statement_id": 1,
"series": [
{
"name": "tickers",
"columns": [
"time",
"mean"
],
"values": [
[
"1970-01-01T00:00:00Z",
1056.9267642857149
]
]
}
]
}
]
}
/write : The write end point is used to write data to the database measurement through the POST method.
Consider the upcoming example.
Let's create a sample database testdb used in the previous example and then run the write command to insert two data points for weather data under testdb and separate each point data with a new line:
$ curl -i -XPOST 'http://localhost:8086/write?db=testdb' --data-binary 'weather_report,city=NYC temp=44.1,windchill=42.5,humidity="58%",pressure="30.59 in",winddir="variable",windspeed="3.5 mph" 1511361000000000000
weather_report,city=NYC temp=41.3,windchill=39.2,humidity="62%",pressure="30.65 in",winddir="NE",windspeed="Calm" 1511361060000000000'
HTTP/1.1 204 No Content
..
Two data points are loaded to the weather_report measurements:
> select * from weather_report
name: weather_report
time city humidity pressure temp windchill winddir windspeed
---- ---- -------- -------- ---- --------- ------- ---------
2017-11-22T14:30:00Z NYC 58% 30.59 in 44.1 42.5 variable 3.5 mph
2017-11-22T14:31:00Z NYC 62% 30.65 in 41.3 39.2 NE Calm