Table of Contents for
The Modern Web
 The Modern Web
Published by
No Starch Press, 2013
The Modern Web
Published by
No Starch Press, 2013
- The Modern Web
- Cover
- The Modern Web
- Advance Praise for
- Praise for Peter Gasston’s
- Dedication
- About the Author
- About the Technical Reviewer
- Acknowledgments
- Introduction
- The Device Landscape
- The Multi-screen World
- Context: What We Don’t Know
- What You’ll Learn
- A. Further Reading
- 1. The Web Platform
- A Quick Note About Terminology
- Who You Are and What You Need to Know
- Getting Our Terms Straight
- The Real HTML5
- CSS3 and Beyond
- Browser Support
- Test and Test and Test Some More
- Summary
- B. Further Reading
- 2. Structure and Semantics
- New Elements in HTML5
- WAI-ARIA
- The Importance of Semantic Markup
- Microformats
- RDFa
- Microdata
- Data Attributes
- Web Components: The Future of Markup?
- Summary
- C. Further Reading
- 3. Device-Responsive CSS
- Media Queries
- Media Queries in JavaScript
- Adaptive vs. Responsive Web Design
- Viewport-Relative Length Units
- Responsive Design and Replaced Objects
- Summary
- D. Further Reading
- 4. New Approaches to CSS Layouts
- Multi-columns
- Flexbox
- Grid Layout
- The Further Future
- Summary
- E. Further Reading
- 5. Modern JavaScript
- New in JavaScript
- JavaScript Libraries
- Polyfills and Shims
- Testing and Debugging
- Summary
- F. Further Reading
- 6. Device Apis
- Geolocation
- Orientation
- Fullscreen
- Vibration
- Battery Status
- Network Information
- Camera and Microphone
- Web Storage
- Drag and Drop
- Interacting with Files
- Mozilla’s Firefox OS and WebAPIs
- PhoneGap and Native Wrappers
- Summary
- G. Further Reading
- 7. Images and Graphics
- Comparing Vectors and Bitmaps
- Scalable Vector Graphics
- The canvas Element
- When to Choose SVG or Canvas
- Summary
- H. Further Reading
- 8. New Forms
- New Input Types
- New Attributes
- Datalists
- On-Screen Controls and Widgets
- Displaying Information to the User
- Client-side Form Validation
- The Constraint Validation API
- Forms and CSS
- Summary
- I. Further Reading
- 9. Multimedia
- The Media Elements
- Media Fragments
- The Media API
- Media Events
- Advanced Media Interaction
- Summary
- J. Further Reading
- 10. Web Apps
- Web Apps
- Hybrid Apps
- TV Apps
- Webinos
- Application Cache
- Summary
- K. Further Reading
- 11. The Future
- Web Components
- The Future of CSS
- Summary
- L. Further Reading
- M. Browser Support as of March 2013
- The Browsers in Question
- Enabling Experimental Features
- Chapter 1: The Web Platform
- Chapter 2: Structure and Semantics
- Chapter 3: Device-Responsive CSS
- Chapter 4: New Approaches to CSS Layouts
- Chapter 5: Modern JavaScript
- Chapter 6: Device APIs
- Chapter 7: Images and Graphics
- Chapter 8: New Forms
- Chapter 9: Multimedia
- Chapter 10: Web Apps
- Chapter 11: The Future
- N. Further Reading
- Introduction
- Chapter 1: The Web Platform
- Chapter 2: Structure and Semantics
- Chapter 3: Device-Responsive CSS
- Chapter 4: New Approaches to CSS Layouts
- Chapter 5: Modern JavaScript
- Chapter 6: Device APIs
- Chapter 7: Images and Graphics
- Chapter 8: New Forms
- Chapter 9: Multimedia
- Chapter 10: Web Apps
- Chapter 11: The Future
- Index
- About the Author
- Copyright
Displaying Information to the User
As well as accepting input from users, sometimes displaying information back to users is helpful, perhaps to show their progress through filling out a long form or the results of a measurement. A new set of elements defined in HTML5 is aimed at exactly that purpose.
progress
Progress bars show movement toward a set goal and are commonly used in operating systems and on the Web, such as when loading data into a web application or installing software. The progress element gives you a standardized method for implementing progress bars in your own pages. In its simplest form, it shows progress between 0 and 1, using the value attribute to show the current position:
<progress value="0.5">0.5</progress>
Although this element is displayed as a bar in most browsers—as you can see in Figure 8-9—including the value inside the element is also good practice, as it serves as a fallback for browsers that don’t have a graphical widget.
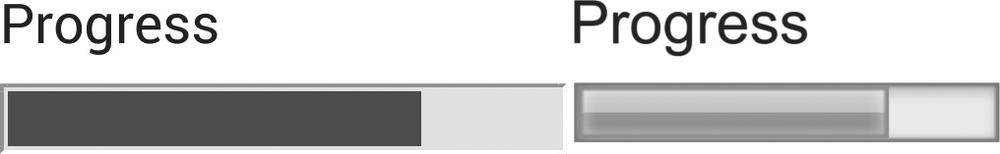
progress element: Firefox for Android (left) and Opera for Ubuntu (right)
If the values you want to use can’t be simply divided into a range of 0 to 1, you can set a different range with the max and min attributes:
<progress max="20" min="10" value="15">15</progress>
Updating the bar using script is easy, requiring only a change of the value attribute, perhaps in a function somewhat like this one, where any value supplied as an argument to the updateProgress function updates the progress bar accordingly:
var progressBar = document.querySelector('progress'),
  updateProgress = function (newValue) {
    progressBar.value = newValue;
};
You can get the current progress toward the target by using the position property, which returns the result of dividing the current value by that of the maximum value; in the case of the previous example, the max attribute is 20 and the value is 15, so the position is 0.75:
var currentProgress = progressBar.position;
meter
At first glance, the meter element seems superficially the same as progress, and indeed, some browsers style the two in the same way. They differ semantically, however; where progress shows movement toward a goal, meter shows a scalar measurement, such as a rating or a poll result. At its most simple, meter shows a value between 0 and 1.0, just like progress:
<meter value="0.5">0.5 of 1</meter>
The similarities to progress continue, as you should add a text child for browsers that don’t represent this graphically, and max and min attributes are also available if you want to change the scale:
<meter max="20" min="10" value="15">15 of 20</meter>
Where meter differs significantly from progress is in displaying ranges of low, medium, and high values, using three new attributes: low sets the upper limit of the low range, high sets the lower limit of the high range, and optimum sets the ideal value. If these attributes are present, the meter’s current value is either displayed as being within acceptable bounds or flagged as being outside them.
The following code example illustrates this. Here, any value less than or equal to 0.2 is considered low and will be displayed with a warning color (often yellow) in many browsers, whereas a value greater than or equal to 0.8 is considered high and will be likewise flagged (most commonly in red); any number between those two will be marked in the standard color (usually green) for the average range:
<meter low="0.2" high="0.8" value="0.65">0.65 of 1</meter>
Introducing the optimum attribute changes the behavior slightly, as it can introduce a third level of “acceptability” depending on where it’s positioned. For example, given the meter element in the previous example, you could say there are three ranges: low for any value of 0.2 or less, high for any 0.8 or greater, and average for any greater than 0.2 but less than 0.8. If you were to set the optimum to be 0.9, any value in the high range would be optimal and colored green, any in the average range less optimal and colored yellow, and any in the low range less optimal still and colored red. Conversely, if the optimum value were 0.1, those ranges of optimality would be reversed.
If that all sounds a little complex, the following markup shows a few different examples, which you can see for yourself in the example file input-types-meter.html and illustrated in Figure 8-10; I advise you to view this example as it relies on color, which is hard to convey in a black-and-white book! I’ll annotate this code and then explain it subsequently.
1 <meter low="0.2" high="0.8" value="0.85">0.85 of 1</meter>
2 <meter low="0.2" high="0.8" optimum="0.9" value="0.85">0.85 of 1</meter>
3 <meter low="0.2" high="0.8" optimum="0.1" value="0.85">0.85 of 1</meter>
In all three examples, the low range is 0 to 0.2, the medium range is 0.21 to 0.79, the high range is 0.8 to 1, and the value of the meter is 0.85. The numerals correspond to the examples in Figure 8-10 in vertical order. In 1 no optimum value is given, so the optimum range is medium (neither high nor low). The value of the meter is in the high range, one range away from optimum, so it’s colored yellow. In 2 the optimum value is 0.9, so the high range becomes optimum; as the value is 0.85, this value is within optimum range and colored green. In 3 the optimum value is 0.1, so the low range becomes optimum; the value is 0.85, which is two ranges away from optimum, so colored red.
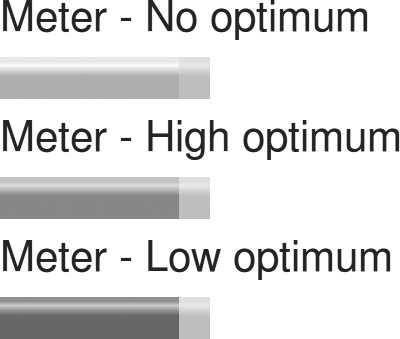
As I said, this concept is a little hard to convey in black and white, so try the example for yourself. Once you see it, the concept is quite simple and easily grasped.
output
The output element displays the result of a calculation or user input and is especially handy for showing the result of interactions in other fields. A purely semantic element, output has no widget or on-screen presence if no value is supplied. At its most basic, it requires no attributes:
<output></output>
The output element becomes more useful when interacted with using JavaScript. Its key properties are value, which gets or sets the value, and defaultValue, which gets or sets a default value (if none is supplied). To show how this works, I’ve written a short script that updates the output element when a range input is changed. Here’s the markup:
<label for="output">Output</label>
<input type="range" id="range">
<output id="output" for="range"></output>
The following script first selects the elements I’ll interact with, sets a default value of 50 for the output element, and then adds an event listener to the range input, which fires whenever the value is changed. This listener runs an anonymous function to get the value of the input and set the value of the output. Here’s the final script, which you can try for yourself in input-types-output.html:
var range = document.getElementById('range'), output = document.getElementById('output');
output.defaultValue = 50;
range.addEventListener('change', function (e) {
  var newValue = e.currentTarget.value;
  output.value = newValue;
}, false);