Table of Contents for
Python: Penetration Testing for Developers
 Python: Penetration Testing for Developers
Published by
Packt Publishing, 2016
Python: Penetration Testing for Developers
Published by
Packt Publishing, 2016
- Cover
- Table of Contents
- Python: Penetration Testing for Developers
- Python: Penetration Testing for Developers
- Python: Penetration Testing for Developers
- Credits
- Preface
- What you need for this learning path
- Who this learning path is for
- Reader feedback
- Customer support
- 1. Module 1
- 1. Understanding the Penetration Testing Methodology
- Understanding what penetration testing is not
- Assessment methodologies
- The penetration testing execution standard
- Penetration testing tools
- Summary
- 2. The Basics of Python Scripting
- Python – the good and the bad
- A Python interactive interpreter versus a script
- Environmental variables and PATH
- Understanding dynamically typed languages
- The first Python script
- Developing scripts and identifying errors
- Python formatting
- Python variables
- Operators
- Compound statements
- Functions
- The Python style guide
- Arguments and options
- Your first assessor script
- Summary
- 3. Identifying Targets with Nmap, Scapy, and Python
- Understanding Nmap
- Nmap libraries for Python
- The Scapy library for Python
- Summary
- 4. Executing Credential Attacks with Python
- Identifying the target
- Creating targeted usernames
- Testing for users using SMTP VRFY
- Summary
- 5. Exploiting Services with Python
- Understanding the chaining of exploits
- Automating the exploit train with Python
- Summary
- 6. Assessing Web Applications with Python
- Identifying hidden files and directories with Python
- Credential attacks with Burp Suite
- Using twill to walk through the source
- Understanding when to use Python for web assessments
- Summary
- 7. Cracking the Perimeter with Python
- Understanding the link between accounts and services
- Cracking inboxes with Burp Suite
- Identifying the attack path
- Gaining access through websites
- Summary
- 8. Exploit Development with Python, Metasploit, and Immunity
- Understanding the Windows memory structure
- Understanding memory addresses and endianness
- Understanding the manipulation of the stack
- Understanding immunity
- Understanding basic buffer overflow
- Writing a basic buffer overflow exploit
- Understanding stack adjustments
- Understanding the purpose of local exploits
- Understanding other exploit scripts
- Reversing Metasploit modules
- Understanding protection mechanisms
- Summary
- 9. Automating Reports and Tasks with Python
- Understanding how to create a Python class
- Summary
- 10. Adding Permanency to Python Tools
- Understanding the difference between multithreading and multiprocessing
- Building industry-standard tools
- Summary
- 2. Module 2
- 1. Python with Penetration Testing and Networking
- Approaches to pentesting
- Introducing Python scripting
- Understanding the tests and tools you'll need
- Learning the common testing platforms with Python
- Network sockets
- Server socket methods
- Client socket methods
- General socket methods
- Moving on to the practical
- Summary
- 2. Scanning Pentesting
- What are the services running on the target machine?
- Summary
- 3. Sniffing and Penetration Testing
- Implementing a network sniffer using Python
- Learning about packet crafting
- Introducing ARP spoofing and implementing it using Python
- Testing the security system using custom packet crafting and injection
- Summary
- 4. Wireless Pentesting
- Wireless attacks
- Summary
- 5. Foot Printing of a Web Server and a Web Application
- Introducing information gathering
- Information gathering of a website from SmartWhois by the parser BeautifulSoup
- Banner grabbing of a website
- Hardening of a web server
- Summary
- 6. Client-side and DDoS Attacks
- Tampering with the client-side parameter with Python
- Effects of parameter tampering on business
- Introducing DoS and DDoS
- Summary
- 7. Pentesting of SQLI and XSS
- Types of SQL injections
- Understanding the SQL injection attack by a Python script
- Learning about Cross-Site scripting
- Summary
- 3. Module 3
- 1. Gathering Open Source Intelligence
- Gathering information using the Shodan API
- Scripting a Google+ API search
- Downloading profile pictures using the Google+ API
- Harvesting additional results from the Google+ API using pagination
- Getting screenshots of websites with QtWebKit
- Screenshots based on a port list
- Spidering websites
- 2. Enumeration
- Performing a ping sweep with Scapy
- Scanning with Scapy
- Checking username validity
- Brute forcing usernames
- Enumerating files
- Brute forcing passwords
- Generating e-mail addresses from names
- Finding e-mail addresses from web pages
- Finding comments in source code
- 3. Vulnerability Identification
- Automated URL-based Directory Traversal
- Automated URL-based Cross-site scripting
- Automated parameter-based Cross-site scripting
- Automated fuzzing
- jQuery checking
- Header-based Cross-site scripting
- Shellshock checking
- 4. SQL Injection
- Checking jitter
- Identifying URL-based SQLi
- Exploiting Boolean SQLi
- Exploiting Blind SQL Injection
- Encoding payloads
- 5. Web Header Manipulation
- Testing HTTP methods
- Fingerprinting servers through HTTP headers
- Testing for insecure headers
- Brute forcing login through the Authorization header
- Testing for clickjacking vulnerabilities
- Identifying alternative sites by spoofing user agents
- Testing for insecure cookie flags
- Session fixation through a cookie injection
- 6. Image Analysis and Manipulation
- Hiding a message using LSB steganography
- Extracting messages hidden in LSB
- Hiding text in images
- Extracting text from images
- Enabling command and control using steganography
- 7. Encryption and Encoding
- Generating an MD5 hash
- Generating an SHA 1/128/256 hash
- Implementing SHA and MD5 hashes together
- Implementing SHA in a real-world scenario
- Generating a Bcrypt hash
- Cracking an MD5 hash
- Encoding with Base64
- Encoding with ROT13
- Cracking a substitution cipher
- Cracking the Atbash cipher
- Attacking one-time pad reuse
- Predicting a linear congruential generator
- Identifying hashes
- 8. Payloads and Shells
- Extracting data through HTTP requests
- Creating an HTTP C2
- Creating an FTP C2
- Creating an Twitter C2
- Creating a simple Netcat shell
- 9. Reporting
- Converting Nmap XML to CSV
- Extracting links from a URL to Maltego
- Extracting e-mails to Maltego
- Parsing Sslscan into CSV
- Generating graphs using plot.ly
- A. Bibliography
- Index
The Windows Operating System (OS) memory structure has a number of sections that can be broken down into high level components. To understand how to write exploits and take advantages of poor programming practices, we first have to understand these sections. The following details break this information down into manageable chunks. The following figure provides a representative diagram of the Windows memory structure for an executable.
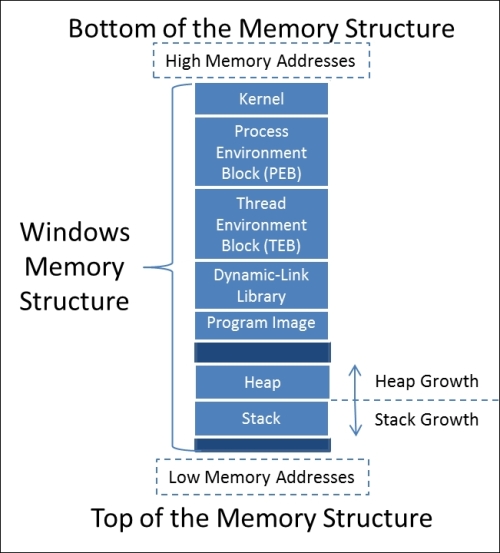
Now, each of these components is important, but the pieces we use with most exploit writing are the stack and the heap.
The stack is used for short term local storage in an ordered manner. Each time a function is called, or a thread, a unique stack is assigned of a fixed size for that function or thread. Once the function or thread has finished the operations, the stack is destroyed.
The heap, on the other hand, is where global variables and values are assigned in a relatively disorganized manner. The heap is shared by applications and the areas of memory are actually managed by the application or process. Once the application terminates that specific region of memory is freed. In this example, we are attacking the stack, not the heap.
Tip
Keep in mind that the exploit examples here are often written in Perl, though you can easily convert the code to Python, as highlighted in Chapter 2, The Basics of Python Scripting.
To better understand the difference between the heap and the stack movement, see the following figure, which shows the adjustment as memory is allocated for global and local resources.
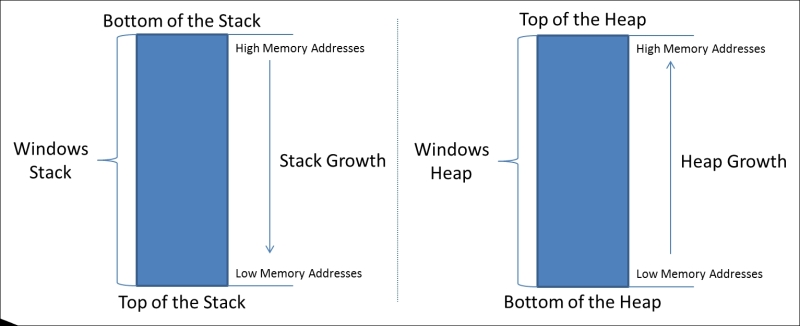
The stack builds up the data from bottom of the stack to the top. The growth goes from high memory addresses to low memory addresses. The heap is opposite of the stack as it grows in the other direction, toward the higher addresses.
To understand the way a program would be loaded onto the stack, we create a sample code snippet. With this code, you can see how the main function calls function1 and the local variables as they are placed onto the stack. Pay attention to the way that the program would normally flow with calls to function1 and how the data is placed on the stack.
int function1(int a, int b, int c)
{
    diffa - b - c;
    sum = a + b + c;
    return sum;
}
int main()
{
    return function1(argv[1], argv[2], argv[3]);
}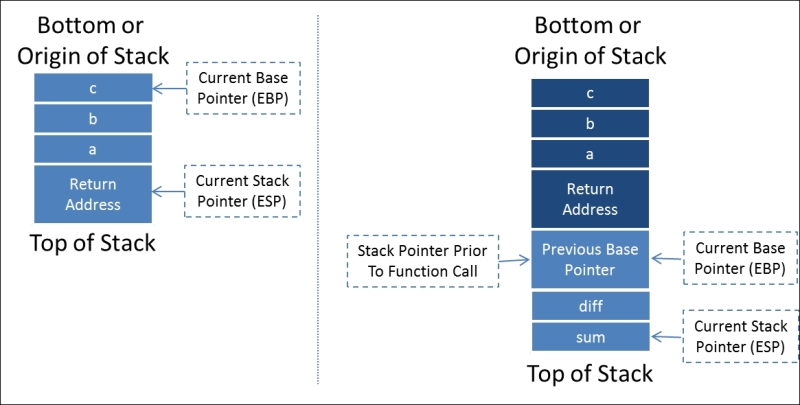
The code loaded on the stack would look similar to this, which highlights how the information components are presented. As you can see, the old Base Pointer is loaded on to the stack for storage and the new EBP is the old Stack Pointer value, since the top of the stack has shifted to its new location.
Items that are put onto the stack are pushed onto it, and items that are run or removed from the stack are popped off of it. A stack is a programmable concept known as a Last In First Out (LIFO) structure. Think of it as a stack of dishes; to effectively remove dishes you have to take them off the top by one or by sets, otherwise you risk breaking things. The safest way, of course, is one at a time, which takes longer, but it is traceable and effective. With an understanding of the most dynamic parts of the memory structure that we will be using to inject our code into, you need to understand the remaining areas of Windows memory that will function as the building blocks, which we will manipulate to get from injection to shell. Specifically, we are speaking of the program image and Dynamic Link Libraries (DLL).
Simply put, the program image is where the actual executable is stored in memory. Portable Executable (PE) is the defined format for the executable, which contains the executable and the DLL. Within the program image component of the memory, the following items are defined.
PE header: This contains the definitions for the rest of the PE..text: This component contains the code segment or the executable instructions..rdata: This is the read-only data segment, which contains static constants rather than variables..data: When the executable is loaded into memory, this area contains the static variables after they have been initialized, the global variables and static local variables. This area is readable and writeable, but the size does not change at runtime, it is determined at execution..rsrc: This section is where the resources for the executable are stored. This includes the icons, menus, dialogs, version information, fonts, and so forth.
Note
Many penetration testers manipulate the .rsrc component of an executable to change the format of payloads so that it appears as something else. This is often done to change the way a malicious payload appears on a Universal Serial Bus (USB) drive. Think about when you do a USB drop when you change your payload from looking like an executable to a folder. Most people would want to see what is in the folder and would be more likely to double click a fake folder than a suspicious executable. Tools like resource tuner make the manipulation of this section of the PE very easy.
The final component to understand here for the PE is the DLL, which encompasses Microsoft's concept of shared libraries. DLLs are similar to executables, but they cannot be called directly, and instead they have to be called by an executable. At its core, the idea of DLLs is to provide a method for the capabilities to upgrade without requiring the entire program to be recompiled when OS is updated.
Because of this, many of the basic building blocks for system operations need to be referenced regardless of start-up cycle. This means that even if other components are going to be in different memory locations, many core DLLs will stay in the same referenced locations. Remember, programs require specific callable instructions and many of the foundational DLLs are loaded into the same regions of memory.
What you need to understand is that we will use these DLLs to find an instruction that is reliably put into the same location so that we can reference it. This means that across the systems and the reboots, the memory reference will work as long as the OS and Service Pack (SP) version are the same if you use OS DLLs. If you use DLLs that are completely native to the program, you will be able to use this exploit across OS versions. For this example, though, we are going to use OS DLLs. The discovered instruction will enable us to tell the system to jump to our shell code, and in turn, execute it.
The reason we have to do a reference code in DLL is because we will be unsure of the exact location that our code will be loaded into memory each time we initiate this attack, so we cannot tell the system our exact memory address to jump to. So, instead, we are going to load the stack with our code and then tell the program to jump to the top of it by referencing the position.
Remember that this may change each time we execute the program and/or each reboot. The stack memory addresses are served as required per program, and we are attempting to inject our code directly into this running function's stack. So, we have to take advantage of the known and repeatable target instruction sets. We will explain the exact process of this in detail, but for now, just know that we use DLLs known instruction sets to jump to our shell code. From this area of memory, the other components are less important for our exploitation techniques highlighted here, but you need to understand them as they are referenced in your debuggers.
Note
The PE can be better understood from the following two older articles, Peering Inside the PE: A Tour of the Win32 Portable Executable File Format, found here https://msdn.microsoft.com/en-us/magazine/ms809762.aspx, and An In-Depth Look into the Win32 Portable Executable File Format, found here https://msdn.microsoft.com/en-us/magazine/cc301805.aspx.
The Process Environment Block (PEB) is where nonkernel components of a running process are stored. Information that is needed by systems that should not have access to kernel components is stored in memory. Some Host Intrusion Prevention Systems (HIPS) monitor activities in this memory region to see if malicious activities are taking place. The PEB contains details related to the loaded DLLs, executables, access restrictions, and so on.
A Thread Environment Block (TEB) is spawned for each thread that a process has established. The first thread is known as the primary thread and each thread after that has its own TEB. Each TEB share the memory allocations of the process that initiated them, but they can execute instructions in a manner that makes task completion more efficient. Since writeable access is required, this environment resides in the nonkernel block of the memory.
This is the area of memory reserved for device drivers, the Hardware Access Layer (HAL), the cache and other components that programs do not need direct access to. The best way to understand the kernel is that this is the most critical component of the OS. All communication is brokered as necessary through OS features. The attacks we are highlighting here do not depend on a deep understanding of the kernel. Additionally, a deep understanding of the Windows kernel would take a book of its own. After defining the memory locations, we have to understand how data is addressed within it.