There is no algorithm that actually derives the exact value of k to be used in a k-means algorithm. The user runs the k-means for various values of k and finds the one that is optimum. An accurate estimate for k can be made with the following method.
Here, the mean distance is computed between the cluster elements and the cluster centroid. By logic, if we increase the value of k, that is, increase the number of clusters in the data, the number of data points within a cluster decreases. Hence, if the value of k is equal to the number of total data points, the sum squared error is 0, as the centroid is the same as the data point.
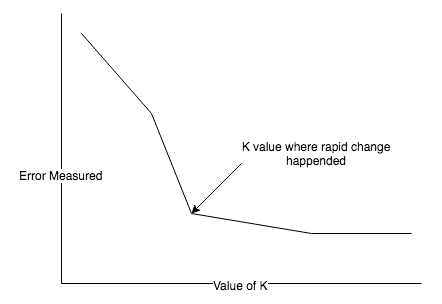
Hence, in the elbow method, the errors are plotted for every value of the chosen k and generated error generated. When the plot sees a sharp shift in the rate of decrease in the error, we know we have gone too far.
The following graph shows how the elbow method works:
Apart from the preceding, there are other methods of detecting the value of k, such as the k-cross validation method, the silhouette method, and the G-means algorithm.
We will be using the elbow method to detect the number of clusters:
k_values = range(5, 126, 20)
def clustering_error_Score(thedata, k):
k_clusters = KMeans.train(thedata, k, maxIterations=10, runs=10, initializationMode="random")
# WSSSE = thedata.map(lambda point: error(k_clusters, point)).reduce(add)
WSSSE = k_clusters.computeCost(thedata)
return WSSSE
k_scores = [clustering_error_Score(thedata, k) for k in k_values]
for score in k_scores:
print(k_score)
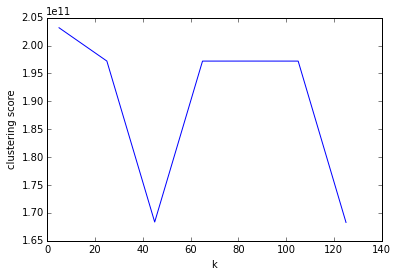
plt.scatter(k_values, k_scores)
plt.xlabel('k')
plt.ylabel('k_clustering score')
The output plot appears as follows: