Matplotlib is a package used for plotting and graphing purposes. This helps create visualizations in 2D space. Matplotlib can be used from the Jupyter Notebook, from web application server, or from the other user interfaces.
Let's plot a small sample of the iris data that is available in the sklearn library. The data has 150 data samples and the dimensionality is 4.
We import the sklearn and matplotlib libraries in our Python environment and check the data and the features, as shown in the following code:
import matplotlib.pyplot as plt
from sklearn import datasets
iris = datasets.load_iris()
print(iris.data.shape) # gives the data size and dimensions
print(iris.feature_names)
The output can be seen as follows:
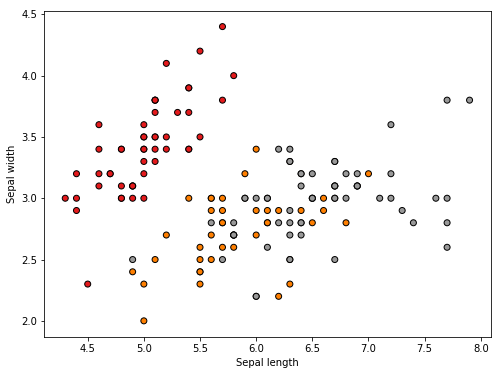
We extract the first two dimensions and plot it on an X by Y plot as follows:
X = iris.data[:, :2] # plotting the first two dimensions
y = iris.target
x_min, x_max = X[:, 0].min() - .5, X[:, 0].max() + .5
y_min, y_max = X[:, 1].min() - .5, X[:, 1].max() + .5
plt.figure(2, figsize=(8, 6))
plt.clf()plt.scatter(X[:, 0], X[:, 1], c=y, cmap=plt.cm.Set1,
 edgecolor='k')
plt.xlabel('Sepal length')
plt.ylabel('Sepal width')
We get the following plot: