
In this example, we will want to use binary data where 1 will represent a not-normal attack:
from sklearn.model_selection import train_test_split
y_binary = y != 'normal.'
y_binary.head()
The output can be seen as follows:
Out[43]:

0    True
 1    True
 2    True
 3    True
 4    True
 dtype: bool
We divide the data into train and test sets and perform the following actions:
X_train, X_test, y_train, y_test = train_test_split(X, y_binary)

y_test.value_counts(normalize=True) # check our null accuracy
The output looks as follows:
True     0.803524
 False    0.196476
 dtype: float64
On using the isolation forest model, we get this:
model = IsolationForest()
 model.fit(X_train)  # notice that there is no y in the .fit
We can see the output here:
Out[61]:

IsolationForest(bootstrap=False, contamination=0.1, max_features=1.0,
max_samples='auto', n_estimators=100, n_jobs=1, random_state=None,
        verbose=0)
We make a prediction as follows:
y_predicted = model.predict(X_test)
pd.Series(y_predicted).value_counts()
Out[62]:
1    111221
 -1     12285
 dtype: int64
The input data is given as follows:
In [63]:
y_predicted = np.where(y_predicted==1, 1, 0) # turn into 0s and 1s
pd.Series(y_predicted).value_counts() # that's better
Out[63]:
1 111221
0 12285
dtype: int64
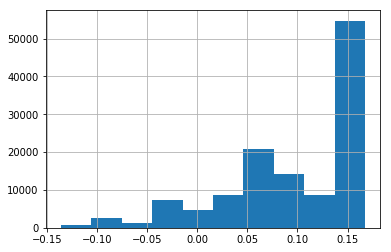
scores = model.decision_function(X_test)
scores # the smaller, the more anomolous
Out[64]:
array([-0.06897078,  0.02709447, 0.16750811, ..., -0.02889957,
       -0.0291526,  0.09928597])
This is how we plot the series:
pd.Series(scores).hist()
The graph can be seen as follows:
We get the output as seen in the following snippet:
from sklearn.metrics import accuracy_score
 preds = np.where(scores < 0, 0, 1)  # customize threshold
 accuracy_score(preds, y_test)
0.790868459831911
for t in (-2, -.15, -.1, -.05, 0, .05):
    preds = np.where(scores < t, 0, 1)  # customize threshold
    print t, accuracy_score(preds, y_test)
-2 0.8035237154470228
 -0.15 0.8035237154470228
 -0.1 0.8032889090408564
 -0.05 0.8189480673003741
 0 0.790868459831911
 0.05 0.7729260116917397
-0.05 0.816988648325 gives us better than null accuracy, without ever needing the testing set. This shows how we can can achieve predictive results without labelled data.
This is an interesting use case of novelty detection, because generally when given labels, we do not use such tactics.