The following the code for investigating precision-recall curve:
from itertools import cycle
lr = LogisticRegression(C = 0.01, penalty = 'l1')
lr.fit(X_train_undersample,y_train_undersample.values.ravel())
y_pred_undersample_proba = lr.predict_proba(X_test_undersample.values)
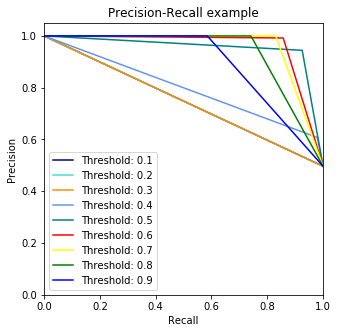
thresholds = [0.1,0.2,0.3,0.4,0.5,0.6,0.7,0.8,0.9]
colors = cycle(['navy', 'turquoise', 'darkorange', 'cornflowerblue', 'teal', 'red', 'yellow', 'green', 'blue','black'])
plt.figure(figsize=(5,5))
j = 1
for i,color in zip(thresholds,colors):
y_test_predictions_prob = y_pred_undersample_proba[:,1] > i
precision, recall, thresholds = precision_recall_curve(y_test_undersample,y_test_predictions_prob)
# Plot Precision-Recall curve
plt.plot(recall, precision, color=color,
label='Threshold: %s'%i)
plt.xlabel('Recall')
plt.ylabel('Precision')
plt.ylim([0.0, 1.05])
plt.xlim([0.0, 1.0])
plt.title('Precision-Recall example')
plt.legend(loc="lower left")