Table of Contents for
Node.js 8 the Right Way
 Node.js 8 the Right Way
Published by
Pragmatic Bookshelf, 2018
Node.js 8 the Right Way
Published by
Pragmatic Bookshelf, 2018
- Title Page
- Node.js 8 the Right Way
- Node.js 8 the Right Way
- Node.js 8 the Right Way
- Node.js 8 the Right Way
- Acknowledgments
- Preface
- Why Node.js the Right Way?
- What’s in This Book
- What This Book Is Not
- Code Examples and Conventions
- Online Resources
- Part I. Getting Up to Speed on Node.js 8
- 1. Getting Started
- Thinking Beyond the web
- Node.js’s Niche
- How Node.js Applications Work
- Aspects of Node.js Development
- Installing Node.js
- 2. Wrangling the File System
- Programming for the Node.js Event Loop
- Spawning a Child Process
- Capturing Data from an EventEmitter
- Reading and Writing Files Asynchronously
- The Two Phases of a Node.js Program
- Wrapping Up
- 3. Networking with Sockets
- Listening for Socket Connections
- Implementing a Messaging Protocol
- Creating Socket Client Connections
- Testing Network Application Functionality
- Extending Core Classes in Custom Modules
- Developing Unit Tests with Mocha
- Wrapping Up
- 4. Connecting Robust Microservices
- Installing ØMQ
- Publishing and Subscribing to Messages
- Responding to Requests
- Routing and Dealing Messages
- Clustering Node.js Processes
- Pushing and Pulling Messages
- Wrapping Up
- Node.js 8 the Right Way
- Part II. Working with Data
- 5. Transforming Data and Testing Continuously
- Procuring External Data
- Behavior-Driven Development with Mocha and Chai
- Extracting Data from XML with Cheerio
- Processing Data Files Sequentially
- Debugging Tests with Chrome DevTools
- Wrapping Up
- 6. Commanding Databases
- Introducing Elasticsearch
- Creating a Command-Line Program in Node.js with Commander
- Using request to Fetch JSON over HTTP
- Shaping JSON with jq
- Inserting Elasticsearch Documents in Bulk
- Implementing an Elasticsearch Query Command
- Wrapping Up
- Node.js 8 the Right Way
- Part III. Creating an Application from the Ground Up
- 7. Developing RESTful Web Services
- Advantages of Express
- Serving APIs with Express
- Writing Modular Express Services
- Keeping Services Running with nodemon
- Adding Search APIs
- Simplifying Code Flows with Promises
- Manipulating Documents RESTfully
- Emulating Synchronous Style with async and await
- Providing an Async Handler Function to Express
- Wrapping Up
- 8. Creating a Beautiful User Experience
- Getting Started with webpack
- Generating Your First webpack Bundle
- Sprucing Up Your UI with Bootstrap
- Bringing in Bootstrap JavaScript and jQuery
- Transpiling with TypeScript
- Templating HTML with Handlebars
- Implementing hashChange Navigation
- Listing Objects in a View
- Saving Data with a Form
- Wrapping Up
- 9. Fortifying Your Application
- Setting Up the Initial Project
- Managing User Sessions in Express
- Adding Authentication UI Elements
- Setting Up Passport
- Authenticating with Facebook, Twitter, and Google
- Composing an Express Router
- Bringing in the Book Bundle UI
- Serving in Production
- Wrapping Up
- Node.js 8 the Right Way
- 10. BONUS: Developing Flows with Node-RED
- Setting Up Node-RED
- Securing Node-RED
- Developing a Node-RED Flow
- Creating HTTP APIs with Node-RED
- Handling Errors in Node-RED Flows
- Wrapping Up
- A1. Setting Up Angular
- A2. Setting Up React
- Node.js 8 the Right Way
Developing a Node-RED Flow
When you develop a program in Node-RED, it’s called a flow. The Hello World of Node-RED flows consists of a button that, when clicked, outputs a timestamp to the debug console. We’ll start with this simple flow so you can get comfortable with the Node-RED interface before we move on to developing an HTTP API.
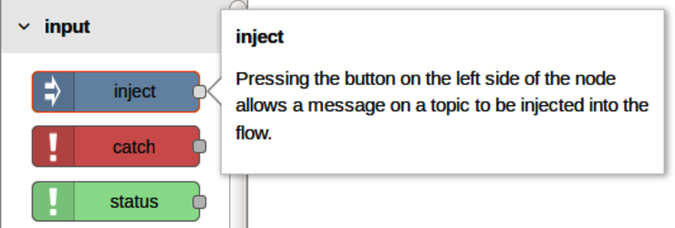
To begin, take a look at the left pane of the Node-RED interface. This shows the kinds of nodes you’ll use to construct flows, categorized by their purposes.
Input nodes act as sources of events into the system. You can tell an input node visually by the tiny gray rectangle protruding from its right-hand side. This gray rectangle is an output port.
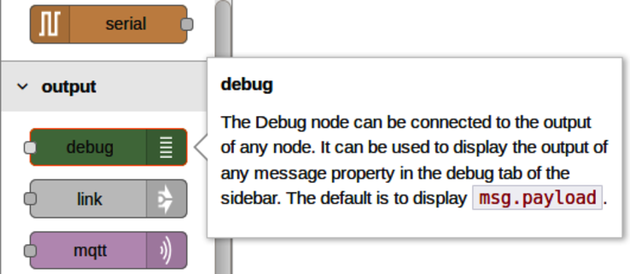
If you hover over a node, a tooltip will pop up to give you more information about that node.
Click and drag an inject node from the left pane onto the flow pane. This will create an inject node in your flow (as shown in the figure).
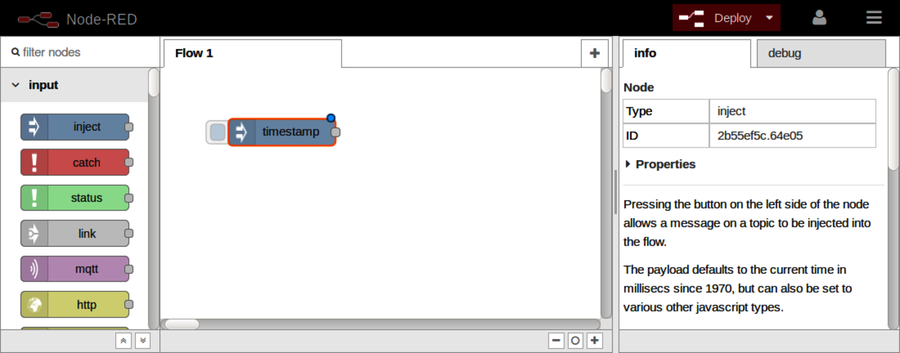
Take a look at the node you just created. It will have an orange border to indicate that it’s the currently selected node, and a description of the node will appear in the Info tab of the right-side pane.
The node will also have a blue dot in its upper-right corner. This signals that the node has not yet been deployed.
When you make changes to a flow in the editor, these changes do not take effect immediately. To get them to take effect, you have to deploy your flow by clicking the red Deploy button.
There are three different deployment options, ranging from a full deploy down to just the changed nodes. In this chapter, we’ll always perform a full deploy.
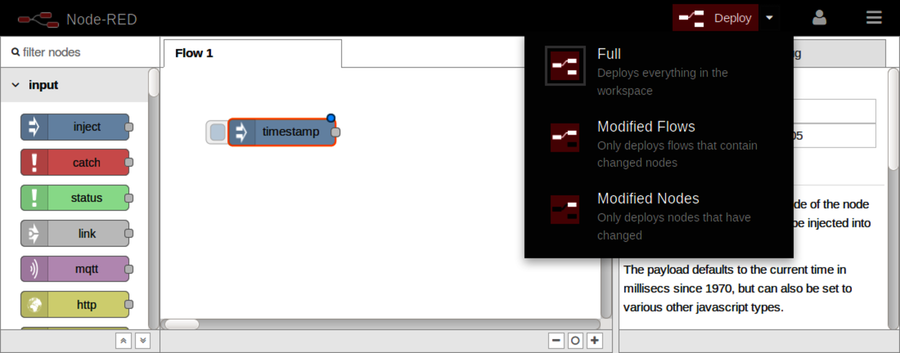
If you haven’t done so already, click the Deploy button now. A Successfully deployed message should appear briefly at the top of the screen and the blue dot should disappear from your inject node.
When you deploy a flow, this is just like starting a server in regular Node.js code. It may not look like it’s doing anything, but it’s waiting for events to respond to.
Now, if you click the little square button protruding from the left side of the inject node, you should see the message Successfully injected: timestamp appear briefly (as shown in the figure).
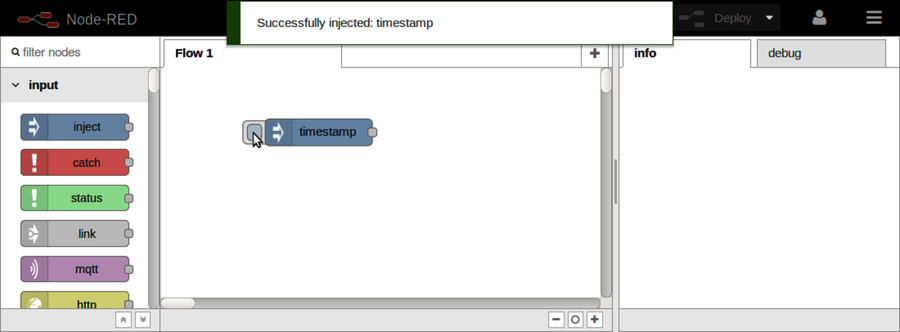
When you click the Inject button, a Node-RED event is injected into the flow. Right now nothing is set up to receive that event, so let’s add a destination for it.
In the nodes pane on the left, scroll down to the output nodes. These nodes have input ports—little gray rectangles protruding from their left sides.
The first one in the list should be the debug node.
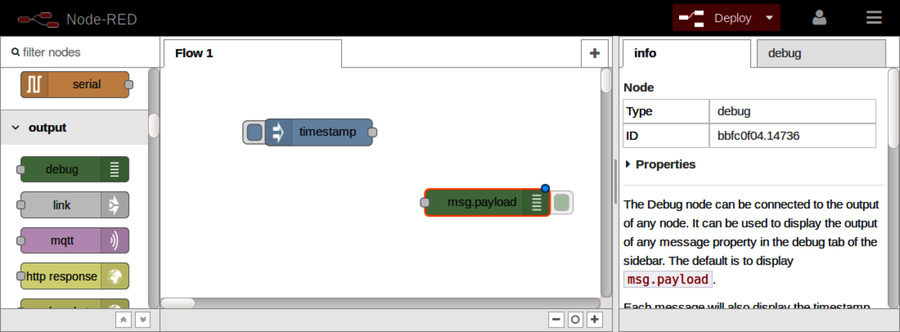
Click and drag a debug node onto the flow workspace, somewhere to the right of the inject node you added previously.
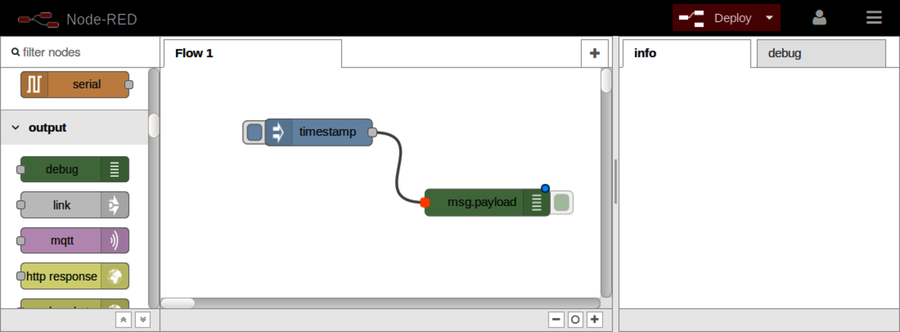
To connect the nodes, click and drag the output port of the inject node and join it to the debug node’s input port (or vice versa). You should see a curvy gray line appear between the nodes.
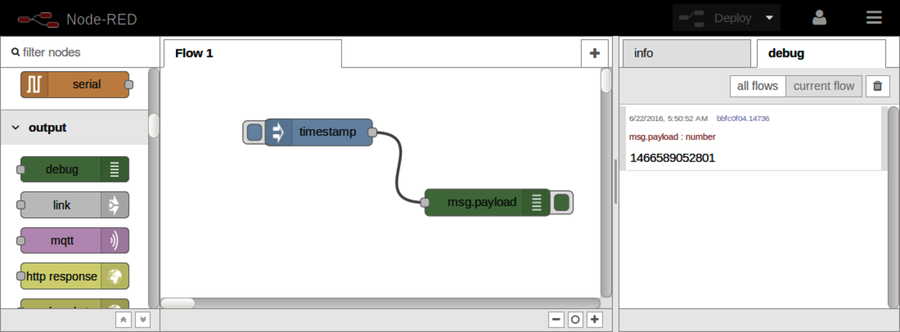
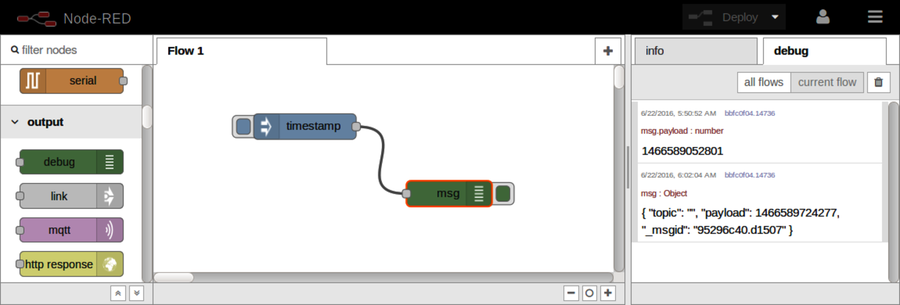
The debug node writes its output to the Debug tab of the right-side pane. Select that tab by clicking it, then deploy the flow.
Now when you click the inject node’s left-side button, you should see a JavaScript timestamp logged to the Debug tab.
The green button hanging off of the right-hand side of the debug node toggles whether it is active. Toggling it takes effect immediately (no need to redeploy). This is convenient during development because it allows you to leave the debug nodes in your flow without having them always log to the Debug tab.
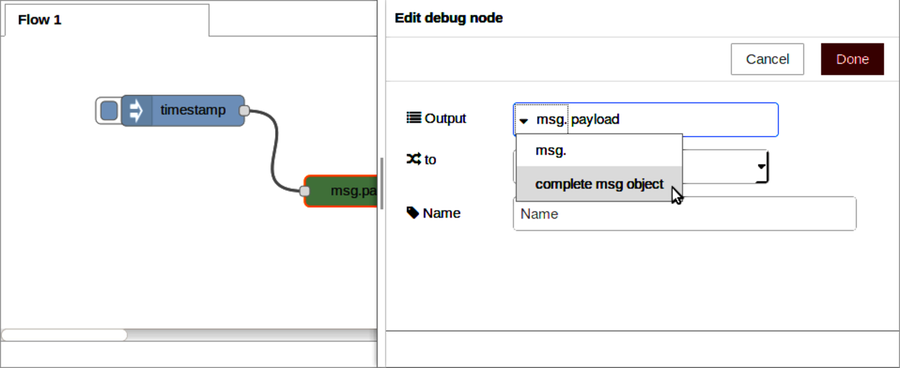
When you double-click any node, this opens the node editor, allowing you to make changes to the node’s settings. Double-click the debug node now, then choose “complete msg object” from the drop-down for the Output setting (as shown in the figure).
Click the Done button to close the editor. Now when you click the Inject button, you’ll see the whole JSON object that it produced in the Debug tab.
And that’s it—you’ve made your first flow! Admittedly, this flow doesn’t do much—it waits for you to click the Inject button and then logs information to the Debug tab.
So let’s move on to something more intricate: using Node-RED to develop an HTTP API.