Table of Contents for
Node.js 8 the Right Way
 Node.js 8 the Right Way
Published by
Pragmatic Bookshelf, 2018
Node.js 8 the Right Way
Published by
Pragmatic Bookshelf, 2018
- Title Page
- Node.js 8 the Right Way
- Node.js 8 the Right Way
- Node.js 8 the Right Way
- Node.js 8 the Right Way
- Acknowledgments
- Preface
- Why Node.js the Right Way?
- What’s in This Book
- What This Book Is Not
- Code Examples and Conventions
- Online Resources
- Part I. Getting Up to Speed on Node.js 8
- 1. Getting Started
- Thinking Beyond the web
- Node.js’s Niche
- How Node.js Applications Work
- Aspects of Node.js Development
- Installing Node.js
- 2. Wrangling the File System
- Programming for the Node.js Event Loop
- Spawning a Child Process
- Capturing Data from an EventEmitter
- Reading and Writing Files Asynchronously
- The Two Phases of a Node.js Program
- Wrapping Up
- 3. Networking with Sockets
- Listening for Socket Connections
- Implementing a Messaging Protocol
- Creating Socket Client Connections
- Testing Network Application Functionality
- Extending Core Classes in Custom Modules
- Developing Unit Tests with Mocha
- Wrapping Up
- 4. Connecting Robust Microservices
- Installing ØMQ
- Publishing and Subscribing to Messages
- Responding to Requests
- Routing and Dealing Messages
- Clustering Node.js Processes
- Pushing and Pulling Messages
- Wrapping Up
- Node.js 8 the Right Way
- Part II. Working with Data
- 5. Transforming Data and Testing Continuously
- Procuring External Data
- Behavior-Driven Development with Mocha and Chai
- Extracting Data from XML with Cheerio
- Processing Data Files Sequentially
- Debugging Tests with Chrome DevTools
- Wrapping Up
- 6. Commanding Databases
- Introducing Elasticsearch
- Creating a Command-Line Program in Node.js with Commander
- Using request to Fetch JSON over HTTP
- Shaping JSON with jq
- Inserting Elasticsearch Documents in Bulk
- Implementing an Elasticsearch Query Command
- Wrapping Up
- Node.js 8 the Right Way
- Part III. Creating an Application from the Ground Up
- 7. Developing RESTful Web Services
- Advantages of Express
- Serving APIs with Express
- Writing Modular Express Services
- Keeping Services Running with nodemon
- Adding Search APIs
- Simplifying Code Flows with Promises
- Manipulating Documents RESTfully
- Emulating Synchronous Style with async and await
- Providing an Async Handler Function to Express
- Wrapping Up
- 8. Creating a Beautiful User Experience
- Getting Started with webpack
- Generating Your First webpack Bundle
- Sprucing Up Your UI with Bootstrap
- Bringing in Bootstrap JavaScript and jQuery
- Transpiling with TypeScript
- Templating HTML with Handlebars
- Implementing hashChange Navigation
- Listing Objects in a View
- Saving Data with a Form
- Wrapping Up
- 9. Fortifying Your Application
- Setting Up the Initial Project
- Managing User Sessions in Express
- Adding Authentication UI Elements
- Setting Up Passport
- Authenticating with Facebook, Twitter, and Google
- Composing an Express Router
- Bringing in the Book Bundle UI
- Serving in Production
- Wrapping Up
- Node.js 8 the Right Way
- 10. BONUS: Developing Flows with Node-RED
- Setting Up Node-RED
- Securing Node-RED
- Developing a Node-RED Flow
- Creating HTTP APIs with Node-RED
- Handling Errors in Node-RED Flows
- Wrapping Up
- A1. Setting Up Angular
- A2. Setting Up React
- Node.js 8 the Right Way
Debugging Tests with Chrome DevTools
The examples so far in this chapter may have given you an overly harmonious view of what it’s like to develop a data-transformation program in Node.js. The reality is that as you learn the APIs and explore the data, you’ll frequently make mistakes and want to track down where you went wrong.
Fortunately, it’s possible to attach Chrome’s DevTools to Node.js, bringing the full power of Chrome’s debugging features with it. If you’ve done any serious web programming, then you’re probably already familiar with Chrome’s DevTools—if so, this will be a refresher on how to use them.
In this section, you’ll learn how to start up your continuous test suite with Mocha in such a way that you can attach Chrome DevTools and step through the code at your own pace. You’ll also be able to execute commands interactively through the console, set breakpoints, and expect variables.
Running Mocha in Debug Mode with npm
So far, to run Mocha tests we’ve used npm test and npm run test:watch, both of which trigger scripts defined in the project’s package.json. Now we’ll add a new script called test:debug that runs Mocha in a way that allows the Chrome DevTools to become attached.
Unfortunately, the mocha command we’ve been using doesn’t make it easy, because it spawns a child Node.js process to carry out the tests. So we need to go one level deeper.
When you use npm to install Mocha, it puts two command-line programs into node_modules/mocha/bin: mocha (which we’ve been using) and _mocha (note the leading underscore). The former invokes the latter in a newly spawned child Node.js process when you use mocha from the command line or through npm.
To attach the Node.js debugger, we have to cut out the middleman and invoke _mocha directly. Open your package.json, and add the following test:debug script to the scripts section.
| | "scripts": { |
| | "test": "mocha", |
| | "test:watch": "mocha --watch --reporter min", |
| » | "test:debug": |
| » | "node --inspect node_modules/mocha/bin/_mocha --watch --no-timeouts" |
| | }, |
The --inspect flag tells Node.js that we intend to run in debug mode, which will output a special URL you can open in Chrome to attach DevTools to the process. The --watch flag you’re already familiar with—it tells Mocha to watch files for changes and rerun the tests when they happen.
Finally, the --no-timeouts flag tells Mocha that we don’t care how long tests take to complete. By default, Mocha will time out asynchronous tests and call them failing after two seconds. But if you’re engaged in step-through debugging, it may take significantly longer.
After you save the file, try out npm run test:debug to see what happens.
| | $ npm run test:debug |
| | |
| | > databases@1.0.0 test:debug ./code/databases |
| | > node --inspect node_modules/mocha/bin/_mocha --watch --no-timeouts |
| | |
| | Debugger listening on ws://127.0.0.1:9229/06a172b5-2bee-475d-b069-0da65d1ea2af |
| | For help see https://nodejs.org/en/docs/inspector |
| | |
| | |
| | |
| | parseRDF |
| | ✓ should be a function |
| | ✓ should parse RDF content |
| | |
| | |
| | 2 passing (35ms) |
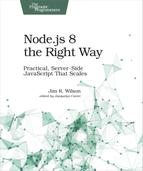
The special URL beginning with ws:// is a WebSocket that Chrome can connect to for debugging. Open a Chrome browser and navigate to chrome://inspect. This will take you to the Devices page of Chrome DevTools.
Under the heading Remote Target #LOCALHOST, you should see an entry for your Node.js process running Mocha. Click the blue inspect link to launch the debugger.
Using Chrome DevTools to Step Through Your Code
At this point, you should have your Chrome browser running, with a DevTools window open and connected to your Node.js debugging session. When you press Enter, Chrome should bring up Chrome DevTools attached to your process. Then make sure you have the Sources tab selected.
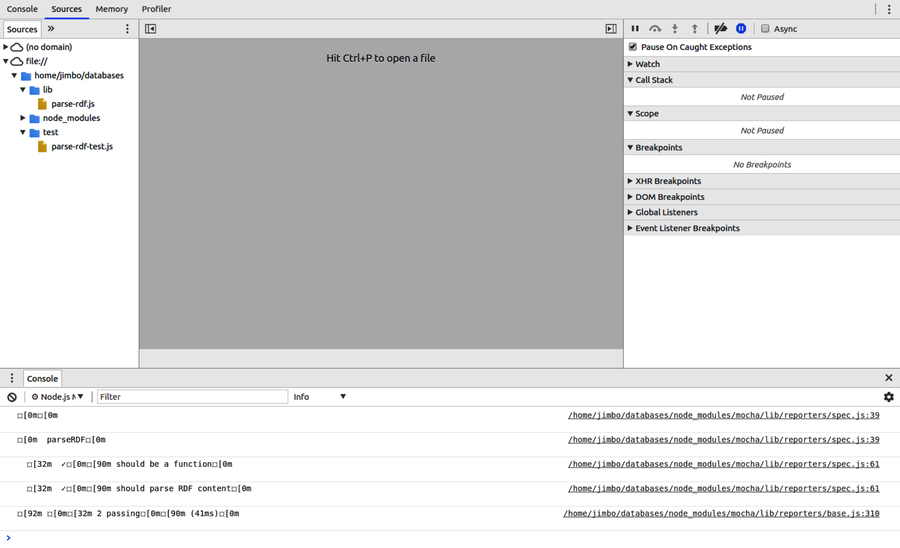
In the left pane, under the file:// heading, you will find the hierarchy of directories and files we have been working on. Under the lib directory you should see parse-rdf.js, and under test there should be the parse-rdf-test.js file.
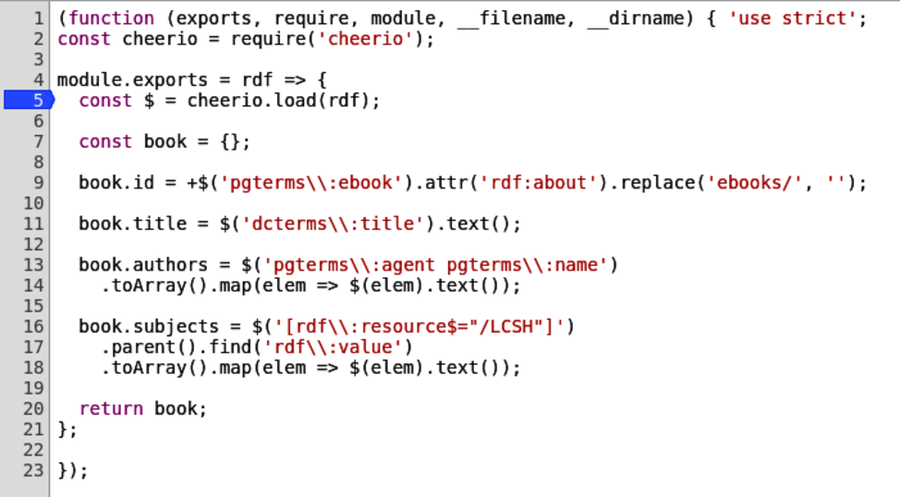
Select the parse-rdf.js file to bring up its contents in the center panel. You can set breakpoints by clicking on the line numbers. Set one now, inside but near the top of the module’s exported function (as shown in the first figure).
Since Mocha is running in watch mode, any time a file changes it will rerun the tests, hitting the breakpoint. So to trigger a test run, open a terminal to your databases project directory and touch either file.
| | $ touch test/parse-rdf-test.js |
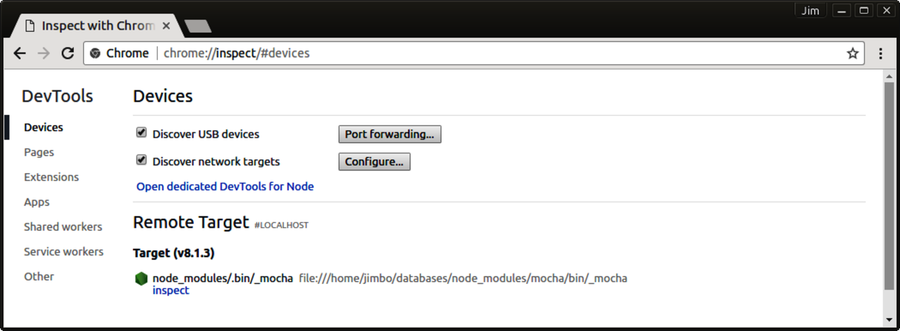
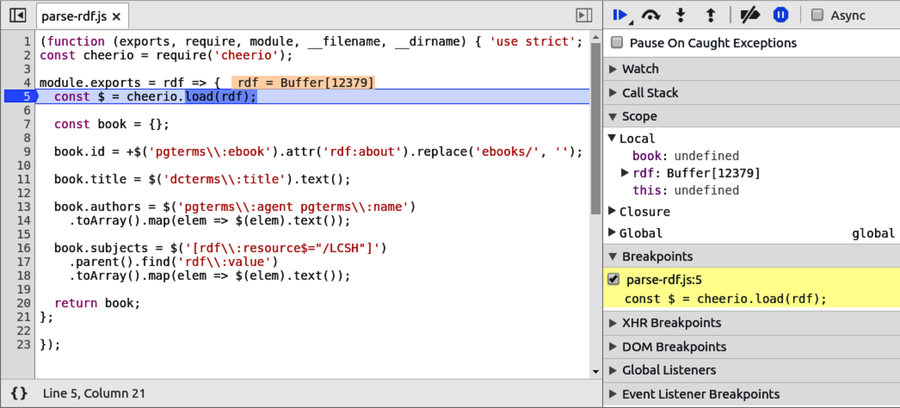
Back in Chrome DevTools, the test run should now be paused at your breakpoint (as shown in the second figure).
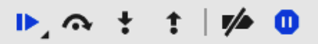
You can use the clickable icons at the top of the right-hand sidebar to step through your code.
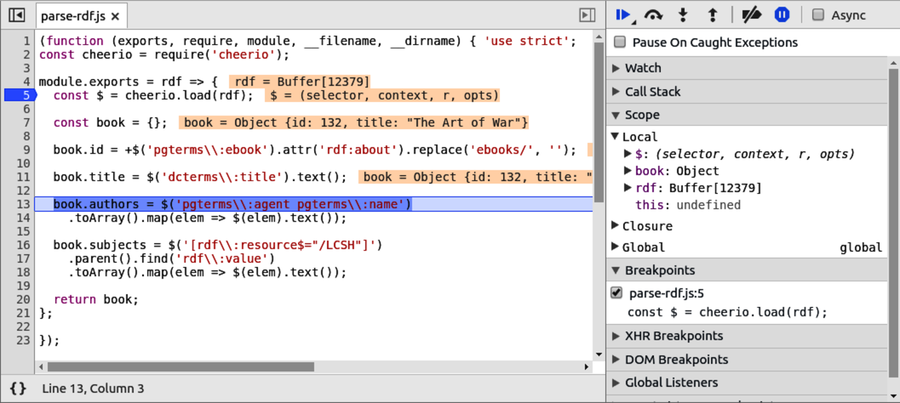
As you step forward through the code, DevTools will decorate the source view with information about the current state. You can also explore the available variables and their contents in the Scope section of the right-hand sidebar (as shown in the figure).
At the time of this writing, a few important features are missing from the Node.js DevTools experience. Most notably, although DevTools appears to allow you to make changes to the source files locally in the browser, it doesn’t give you a way to save those changes to disk. And without the ability to save, your Node.js process (Mocha) won’t be able to see the changes and run the tests.