Table of Contents for
Web Mapping Illustrated
 Web Mapping Illustrated
Published by
O'Reilly Media, Inc., 2005
Web Mapping Illustrated
Published by
O'Reilly Media, Inc., 2005
- Web Mapping Illustrated
- Cover
- Web Mapping Illustrated
- A Note Regarding Supplemental Files
- Foreword
- Preface
- Youthful Exploration
- The Tools in This Book
- What This Book Covers
- Organization of This Book
- Conventions Used in This Book
- Safari Enabled
- Comments and Questions
- Acknowledgments
- 1. Introduction to Digital Mapping
- 1.1. The Power of Digital Maps
- 1.2. The Difficulties of Making Maps
- 1.3. Different Kinds of Web Mapping
- 2. Digital Mapping Tasks and Tools
- 2.1. Common Mapping Tasks
- 2.2. Common Pitfalls, Deadends, and Irritations
- 2.3. Identifying the Types of Tasks for a Project
- 3. Converting and Viewing Maps
- 3.1. Raster and Vector
- 3.2. OpenEV
- 3.3. MapServer
- 3.4. Geospatial Data Abstraction Library (GDAL)
- 3.5. OGR Simple Features Library
- 3.6. PostGIS
- 3.7. Summary of Applications
- 4. Installing MapServer
- 4.1. How MapServer Applications Operate
- 4.2. Walkthrough of the Main Components
- 4.3. Installing MapServer
- 4.4. Getting Help
- 5. Acquiring Map Data
- 5.1. Appraising Your Data Needs
- 5.2. Acquiring the Data You Need
- 6. Analyzing Map Data
- 6.1. Downloading the Demonstration Data
- 6.2. Installing Data Management Tools: GDAL and FWTools
- 6.3. Examining Data Content
- 6.4. Summarizing Information Using Other Tools
- 7. Converting Map Data
- 7.1. Converting Map Data
- 7.2. Converting Vector Data
- 7.3. Converting Raster Data to Other Formats
- 8. Visualizing Mapping Data in a Desktop Program
- 8.1. Visualization and Mapping Programs
- 8.2. Using OpenEV
- 8.3. OpenEV Basics
- 9. Create and Edit Personal Map Data
- 9.1. Planning Your Map
- 9.2. Preprocessing Data Examples
- 10. Creating Static Maps
- 10.1. MapServer Utilities
- 10.2. Sample Uses of the Command-Line Utilities
- 10.3. Setting Output Image Formats
- 11. Publishing Interactive Maps on the Web
- 11.1. Preparing and Testing MapServer
- 11.2. Create a Custom Application for a Particular Area
- 11.3. Continuing Education
- 12. Accessing Maps Through Web Services
- 12.1. Web Services for Mapping
- 12.2. What Do Web Services for Mapping Do?
- 12.3. Using MapServer with Web Services
- 12.4. Reference Map Files
- 13. Managing a Spatial Database
- 13.1. Introducing PostGIS
- 13.2. What Is a Spatial Database?
- 13.3. Downloading PostGIS Install Packages and Binaries
- 13.4. Compiling from Source Code
- 13.5. Steps for Setting Up PostGIS
- 13.6. Creating a Spatial Database
- 13.7. Load Data into the Database
- 13.8. Spatial Data Queries
- 13.9. Accessing Spatial Data from PostGIS in Other Applications
- 14. Custom Programming with MapServer’s MapScript
- 14.1. Introducing MapScript
- 14.2. Getting MapScript
- 14.3. MapScript Objects
- 14.4. MapScript Examples
- 14.5. Other Resources
- 14.6. Parallel MapScript Translations
- A. A Brief Introduction to Map Projections
- A.1. The Third Spheroid from the Sun
- A.2. Using Map Projections with MapServer
- A.3. Map Projection Examples
- A.4. Using Projections with Other Applications
- A.5. References
- B. MapServer Reference Guide for Vector Data Access
- B.1. Vector Data
- B.2. Data Format Guide
- ESRI Shapefiles (SHP)
- PostGIS/PostgreSQL Database
- MapInfo Files (TAB/MID/MIF)
- Oracle Spatial Database
- Web Feature Service (WFS)
- Geography Markup Language Files (GML)
- VirtualSpatialData (ODBC/OVF)
- TIGER/Line Files
- ESRI ArcInfo Coverage Files
- ESRI ArcSDE Database (SDE)
- Microstation Design Files (DGN)
- IHO S-57 Files
- Spatial Data Transfer Standard Files (SDTS)
- Inline MapServer Features
- National Transfer Format Files (NTF)
- About the Author
- Colophon
- Copyright
MapScript Examples
MapServer map files are still a key component to writing a MapScript-based application. If you have a map file ready to use, you can start accessing and manipulating it right away. However, a powerful feature of MapScript is the ability to create maps on the fly without having a map file. In this case, you can build your map from scratch.
In the first two examples, a simple map file is used, as shown in Example 14-1. In the third example, a custom map file is created using MapScript. To keep the example short and simple, I’ve removed optional components like the scale bar, legend, and reference map.
MAP
  SIZE 600 300
  EXTENT -180 -90 180 90
  IMAGECOLOR 180 180 250
  IMAGETYPE PNG

  UNITS DD
  WEB
    IMAGEPATH "/srv/www/htdocs/tmp/"
    IMAGEURL "/tmp/"
  END

  LAYER
    NAME countries
    TYPE POLYGON
    STATUS DEFAULT
    DATA countries_simpl
    CLASS
      NAME 'Countries'
      OUTLINECOLOR 100 100 100
      COLOR 200 200 200
    END
  END
END
Tip
You can download the country boundary data in shapefile format from http://ftp.intevation.de/freegis/worlddata/freegis_worlddata-0.1_simpl.tar.gz.
This compressed file contains a shapefile called countries_simpl. The map file example assumes that the countries_simpl.* files are in the same folder as the map file. This dataset is used elsewhere in this book.
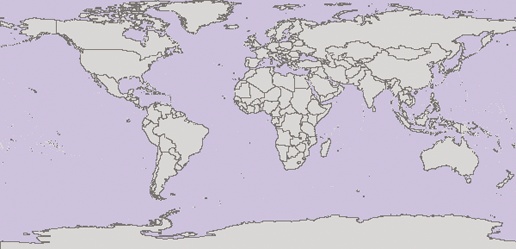
The map file shown in Example 14-1 produces the map shown in Figure 14-2.
Multiple programming languages can be used with MapScript. The examples in this chapter use the Python programming language. To show how Python and other languages compare, the same MapScript example is shown in Python, Perl, PHP, Java, and Ruby at the end of this chapter.
Warning
To keep these examples as simple as possible, no error checking, optimization, or modularization is included. These examples aren’t intended to be used as-is in a production environment.
Opening the Map File and Drawing the Map
The most basic functionality of MapServer is its ability to read in a map file and create an image showing the map. This can be done with MapScript in only a few short steps, as shown in Example 14-2.
# map1.py
# Python MapScript Example 1

import mapscript

# Set the map file to use
mapfile = "global.map"

# Create a mapObj, initialized with the mapfile above
mapobject = mapscript.mapObj(mapfile)

# Create an imgObj that has an image of the map
mapimage = mapobject.draw()

# Save the mapimage to a file
mapimage.save("worldmap.png")
In Example 14-2,
the lines starting with the pound #
symbol are comments that help describe the process. In other
languages, comments may be coded differently. As you can see, this is
a very short example. Here’s a description of each line of
code.
mapfile = "global.map"
This line doesn’t use MapScript at all; rather it sets the
mapfile variable to a string that
points to the global.map map file
it loads in the next step.
mapobject = mapscript.mapObj(mapfile)
This line creates an object that becomes the core of the
application, the map object or mapObj. Just like a map file (which includes
the map object and has layers, projections, and other settings in it),
so mapObj is the highest level in
the MapScript object hierarchy. All the other objects used in this
example are taken from it.
Many attributes and methods are available for the mapObj. In this example, only one method is
used.
mapimage = mapobject.draw()
The draw method of the mapobject returns an image object or
imgObj. This object is stored in
the variable mapimage.
mapimage.save("worldmap.png")The final step uses the save() method to take the map image and save
it to a file. The output filename for the image is given as a string
directly in the method, but can also be assigned as a separate string
variable like mapfile was
earlier.
Tip
If you provide an empty string for the filename in the
save() method, MapScript prints
the image to stdout. Depending on
the language and how the application is being run, stdout may be a terminal, interpreter
shell, web page, etc.
That’s it! Now you can take this basic example and incorporate some mapping capabilities into your own application.
Manipulating Map Settings
Example 14-3 demonstrates Python MapScript interacting with the map object. It shows how to create a new class that uses a class expression to highlight a certain country.
# map2.py # Python MapScript Example 2 import mapscript # Set the map file to use mapfile = "global.map" # Create a mapObj, initialized with the mapfile above mapobject = mapscript.mapObj(mapfile)# Get the first layer and set a classification attribute layer1 = mapobject.getLayer(0) layer1.classitem = "NAME"# Get the first Class in the layer and duplicate it classCanada = layer1.getClass(0) layer1.insertClass(classCanada)# Give the class a meaningful name classCanada.name = "Canada"# Set the expression used to limit the features drawn classCanada.setExpression("Canada")# Get the Style and modify the Color used canadaStyle = classCanada.getStyle(0) canadaStyle.color.setRGB(250, 250, 125)# Create an imgObj that has an image of the map mapimage = mapobject.draw() # Save the mapimage to a file mapimage.save("worldmap.png")
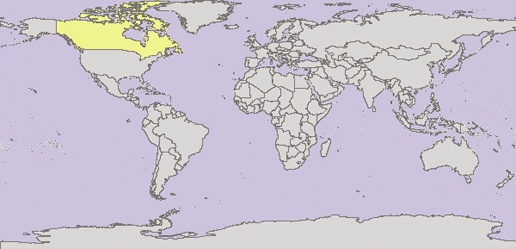
This example modifies the properties of the layer, adds a new class, and changes its color. Perhaps the most powerful feature it demonstrates is the ability to create or modify expressions that limit what features are drawn. The map produced is shown in Figure 14-3.
The following is a closer examination of Example 14-3.
layer1 = mapobject.getLayer(0)
layer1.classitem = "NAME"
The setting of the classitem
layer property is really the first new line added to this example.
Just like setting a CLASSITEM
property in the map file, this setting allows the use of an expression
that filters the features shown in a class. In this case, the
attribute called "NAME" is queried
using the value of the expression. This won’t be used until the
setExpression() function later
on.
classCanada = layer1.getClass(0)
layer1.insertClass(classCanada)
This may look a little obscure. The first line gets the first
class (0) defined for the layer. In
the map file there is only one CLASS object defined. The insertclass() function creates a second
class by copying the original. The purpose of this example is to show
Canada highlighted on the world map, therefore we keep the first class
in place without modifying and then make a copy of it and filter out
all countries other than Canada.
classCanada.name = "Canada"
classCanada.setExpression("Canada")
Setting the .name property
for a class allows it to be used when drawing a legend. In this case,
a legend isn’t being drawn, but it is a good habit to always name your
classes for future reference.
The setExpression() function
is the heart of this example. You may have been expecting to see some
kind of logical statement such as an SQL clause like:
...where country = 'Canada'
That style of statement is possible, but this example shows a
simple way of doing the same thing. The value set in the expression
here is used along with the classitem property for the layer. Therefore,
behind the scenes, the statement: [NAME] =
"Canada" is used to exclude
features that don’t meet this criteria.
You can set statements like this in setExpression() too, without having a
classitem set for the layer, but
getting the syntax right can be tricky and varies depending on the
type of data source. The more simple you can keep it, the better. For
more information on using expressions with MapServer, see the "Understanding Operators"
section in Chapter 10.
canadaStyle = classCanada.getStyle(0)
canadaStyle.color.setRGB(250, 250, 125)
These final new lines simply change the color of the features (those that meet the expression logic) to a highlighting yellow. The value (250, 250, 125) represents the proportion of red, green, and blue color values to shade the features with.
Creating a Map File from Scratch
The next example, Example 14-4, doesn’t use an existing map file but creates its own. The map file it creates is similar to that shown in Example 14-1. The sections are laid out to mimic the structure of the map file in Example 14-1 so that you can easily follow the logic of the program.
# custommapfile.py
# Build a custom map file using Python MapScript
import mapscript
# Create the map object, set properties
map = mapscript.mapObj()
map.name = "CustomMap"
map.setSize(600,300)
map.setExtent(-180.0,-90.0,180.0,90.0)
map.imagecolor.setRGB(180, 180, 250)
map.units = mapscript.MS_DD
# Set the web object image properties
map.web.imagepath = "/srv/www/htdocs/tmp/"
map.web.imageurl = "/tmp/"
# Create the layer object, as a child of the map
layer = mapscript.layerObj(map)
layer.name = "countries"
layer.type = mapscript.MS_LAYER_POLYGON
layer.status = mapscript.MS_DEFAULT
layer.data = "countries_simpl"
layer.template = "template.html"
# Create the class object as a child of the layer
class1 = mapscript.classObj(layer)
class1.name = "Countries"
# Create a style object as a child of the class
style = mapscript.styleObj(class1)
style.outlinecolor.setRGB(100, 100, 100)
style.color.setRGB(200, 200, 200)
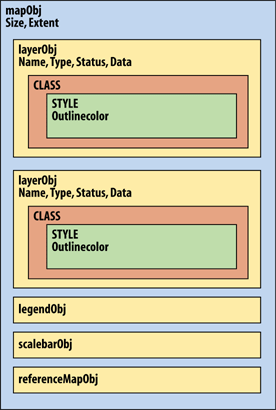
# Write the map object into a map file
map.save("custom.map")The map file that this script creates doesn’t look identical to Example 14-1 because MapScript creates several other default values. However, the map file functions in the same manner and produces the same map image as a result.
Warning
The object names used in this example are simple but not
necessarily recommended because they are so close to the names of
actual MapScript objects. This isn’t a problem in this example, but
would be a problem if the class1
object had been named class.
Because class is a reserved
keyword for many programming languages, it produces an error if used
as a object name.