Table of Contents for
Web Mapping Illustrated
 Web Mapping Illustrated
Published by
O'Reilly Media, Inc., 2005
Web Mapping Illustrated
Published by
O'Reilly Media, Inc., 2005
- Web Mapping Illustrated
- Cover
- Web Mapping Illustrated
- A Note Regarding Supplemental Files
- Foreword
- Preface
- Youthful Exploration
- The Tools in This Book
- What This Book Covers
- Organization of This Book
- Conventions Used in This Book
- Safari Enabled
- Comments and Questions
- Acknowledgments
- 1. Introduction to Digital Mapping
- 1.1. The Power of Digital Maps
- 1.2. The Difficulties of Making Maps
- 1.3. Different Kinds of Web Mapping
- 2. Digital Mapping Tasks and Tools
- 2.1. Common Mapping Tasks
- 2.2. Common Pitfalls, Deadends, and Irritations
- 2.3. Identifying the Types of Tasks for a Project
- 3. Converting and Viewing Maps
- 3.1. Raster and Vector
- 3.2. OpenEV
- 3.3. MapServer
- 3.4. Geospatial Data Abstraction Library (GDAL)
- 3.5. OGR Simple Features Library
- 3.6. PostGIS
- 3.7. Summary of Applications
- 4. Installing MapServer
- 4.1. How MapServer Applications Operate
- 4.2. Walkthrough of the Main Components
- 4.3. Installing MapServer
- 4.4. Getting Help
- 5. Acquiring Map Data
- 5.1. Appraising Your Data Needs
- 5.2. Acquiring the Data You Need
- 6. Analyzing Map Data
- 6.1. Downloading the Demonstration Data
- 6.2. Installing Data Management Tools: GDAL and FWTools
- 6.3. Examining Data Content
- 6.4. Summarizing Information Using Other Tools
- 7. Converting Map Data
- 7.1. Converting Map Data
- 7.2. Converting Vector Data
- 7.3. Converting Raster Data to Other Formats
- 8. Visualizing Mapping Data in a Desktop Program
- 8.1. Visualization and Mapping Programs
- 8.2. Using OpenEV
- 8.3. OpenEV Basics
- 9. Create and Edit Personal Map Data
- 9.1. Planning Your Map
- 9.2. Preprocessing Data Examples
- 10. Creating Static Maps
- 10.1. MapServer Utilities
- 10.2. Sample Uses of the Command-Line Utilities
- 10.3. Setting Output Image Formats
- 11. Publishing Interactive Maps on the Web
- 11.1. Preparing and Testing MapServer
- 11.2. Create a Custom Application for a Particular Area
- 11.3. Continuing Education
- 12. Accessing Maps Through Web Services
- 12.1. Web Services for Mapping
- 12.2. What Do Web Services for Mapping Do?
- 12.3. Using MapServer with Web Services
- 12.4. Reference Map Files
- 13. Managing a Spatial Database
- 13.1. Introducing PostGIS
- 13.2. What Is a Spatial Database?
- 13.3. Downloading PostGIS Install Packages and Binaries
- 13.4. Compiling from Source Code
- 13.5. Steps for Setting Up PostGIS
- 13.6. Creating a Spatial Database
- 13.7. Load Data into the Database
- 13.8. Spatial Data Queries
- 13.9. Accessing Spatial Data from PostGIS in Other Applications
- 14. Custom Programming with MapServer’s MapScript
- 14.1. Introducing MapScript
- 14.2. Getting MapScript
- 14.3. MapScript Objects
- 14.4. MapScript Examples
- 14.5. Other Resources
- 14.6. Parallel MapScript Translations
- A. A Brief Introduction to Map Projections
- A.1. The Third Spheroid from the Sun
- A.2. Using Map Projections with MapServer
- A.3. Map Projection Examples
- A.4. Using Projections with Other Applications
- A.5. References
- B. MapServer Reference Guide for Vector Data Access
- B.1. Vector Data
- B.2. Data Format Guide
- ESRI Shapefiles (SHP)
- PostGIS/PostgreSQL Database
- MapInfo Files (TAB/MID/MIF)
- Oracle Spatial Database
- Web Feature Service (WFS)
- Geography Markup Language Files (GML)
- VirtualSpatialData (ODBC/OVF)
- TIGER/Line Files
- ESRI ArcInfo Coverage Files
- ESRI ArcSDE Database (SDE)
- Microstation Design Files (DGN)
- IHO S-57 Files
- Spatial Data Transfer Standard Files (SDTS)
- Inline MapServer Features
- National Transfer Format Files (NTF)
- About the Author
- Colophon
- Copyright
Identifying the Types of Tasks for a Project
Just like carpenters, map makers know the value of using the right tool for the job. The digital map maker has a variety of tools to choose from, and each tool is designed for a certain task. Many tools can do one or two tasks well, and other tasks moderately well or not at all. There are five different types of tools used in digital mapping and its related disciplines. These are general categories which often overlap.
Viewing and Mapping
Viewing and mapping data aren’t necessarily the same thing. Some applications are intended only for visualizing data, while others target map production. Map production is more focused on a high-quality visual product intended for print. In the case of this book, viewing tools are used for visually gathering information about the map data—how the data is laid out, where (geographically) the data covers, comparing it to other data, etc.
Mapping tools are used to publish data to the Internet through web mapping applications or web services. They can also be used to print a paper map. The concepts of viewing and mapping can be grouped together because they both involve a graphic output/product. They tend to be the final product after the activities in the following categories are completed.
Analysis
Just viewing maps or images isn’t usually the final goal of a project. Certain types of analysis are often required to make data visualization more understandable or presentable. This includes data classification (where similar features are grouped together into categories), spatial proximity calculations (features within a certain distance of another), and statistical summary (grouping data using statistical functions such as average or sum). Analysis tends to summarize information temporarily, whereas manipulating data can change or create new data.
Creating and Manipulating
This category can include creating features, which uses a process often referred to as digitizing. These features may be created as a result of some sort of analysis. For example, you might keep features that are within a certain study area.
You can manipulate data with a variety of tools from command-line programs to drag and drop-style graphical manipulation. Many viewing applications can’t edit features. Those that can edit often create new data only by drawing on screen (a.k.a. digitizing) or moving features. Some products have the ability to do more, such as performing buffering and overlap analysis or grouping features into fewer, larger pieces. Though these are common in many commercial products, open source desktop GIS products with these capabilities are just starting to appear.
Conversion
Certain applications require data to be in certain file or database formats. This is particularly the case in the commercial world where most vendors support their own proprietary formats with marginal support for others. This use of proprietary data formats has led to a historic dependency upon a vendor’s product. Fortunately, recent advances in the geomatics software industry have led to cross-application support for more competitor formats. This, in turn, has led to interoperable vendor-neutral standards through cooperative organizations such as the Open Geospatial Consortium (OGC). The purpose of the OGC and their specifications are discussed in more detail in Chapter 12.
Source data isn’t always in the format required by viewing or manipulating applications. If you receive data from someone who uses a different mapping system, it’s more than likely that conversion will be necessary. Output data that may be created by manipulation processes isn’t always in the format that an end user or client may require. Enter the role of data conversion tools that convert one format into another.
Data conversion programs help make data available in a variety of formats. There are some excellent tools available, and there are also support libraries for applications, making data conversion unnecessary. Data access libraries allow an application to access data directly instead of converting the data before using it with the application.
Some examples of these libraries are discussed later in this chapter. For an excellent commercial conversion tool, see Safe Software’s Feature Manipulation Engine (FME) at http://safe.com.
Sharing
You are probably reading this book because you desire to share maps and mapping data. There is a certain pleasure in creating and publishing a map of your own. Because of the variety of free tools and data now available, this is no longer just a dream.
This book addresses two aspects of that sharing. First, sharing maps (static or interactive) through web applications and second, using web service specifications for sharing data between applications.
The term web mapping covers a wide range of applications and processes. It can mean a simple web page that shows a satellite image or a Flash-based application with high levels of interaction, animations, and even sound effects. But, for the most part, web mapping implies a web page that has some sort of interactive map component. The web page may present a list of layers to the user who can turn them on or off, changing the map as he sees fit. The page may also have viewing tools that allow a user to zoom in to the map and view more detail.
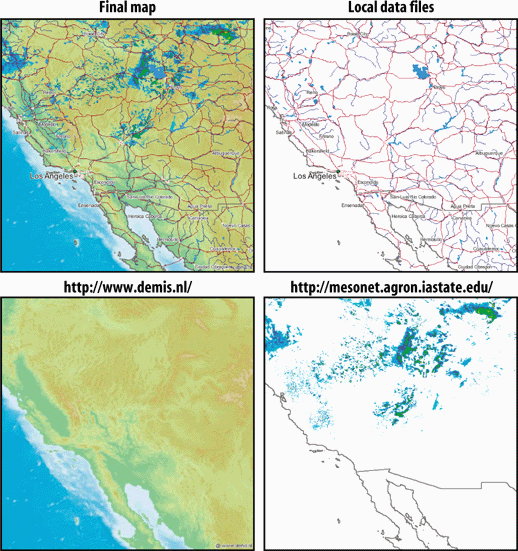
The use of Open Geospatial Consortium (OGC) web services (OWS) standards allow different web mapping applications to share data with each other or with other applications. In this case, an application can be web-enabled but have no graphical mapping interface component riding on top of it. Instead, using Internet communication standards other applications can make a request for data from the remote web service. This interoperability enables different pieces of software to talk to each other without needing to know what kind of server is providing the information. These abilities are still in their infancy, particularly with commercial vendors, but several organizations are already depending on them. Standardized web services allows organizations to avoid building massive central repositories, as well as access data from the source. They also have more freedom when purchasing software, with many more options to choose from. OWS is an open standard for sharing and accessing information; therefore organizations are no longer tied to a particular vendor’s data format. The software needs only to support OWS. For example, Figure 2-3 shows a map created from multiple data sources. Several layers are from a copy of map data that the mapping program accesses directly. The other two layers are from OWS data sources: one from a company in The Netherlands (elevation shading), and the other (weather radar imagery) from a university in the United States.