Table of Contents for
Web Mapping Illustrated
 Web Mapping Illustrated
Published by
O'Reilly Media, Inc., 2005
Web Mapping Illustrated
Published by
O'Reilly Media, Inc., 2005
- Web Mapping Illustrated
- Cover
- Web Mapping Illustrated
- A Note Regarding Supplemental Files
- Foreword
- Preface
- Youthful Exploration
- The Tools in This Book
- What This Book Covers
- Organization of This Book
- Conventions Used in This Book
- Safari Enabled
- Comments and Questions
- Acknowledgments
- 1. Introduction to Digital Mapping
- 1.1. The Power of Digital Maps
- 1.2. The Difficulties of Making Maps
- 1.3. Different Kinds of Web Mapping
- 2. Digital Mapping Tasks and Tools
- 2.1. Common Mapping Tasks
- 2.2. Common Pitfalls, Deadends, and Irritations
- 2.3. Identifying the Types of Tasks for a Project
- 3. Converting and Viewing Maps
- 3.1. Raster and Vector
- 3.2. OpenEV
- 3.3. MapServer
- 3.4. Geospatial Data Abstraction Library (GDAL)
- 3.5. OGR Simple Features Library
- 3.6. PostGIS
- 3.7. Summary of Applications
- 4. Installing MapServer
- 4.1. How MapServer Applications Operate
- 4.2. Walkthrough of the Main Components
- 4.3. Installing MapServer
- 4.4. Getting Help
- 5. Acquiring Map Data
- 5.1. Appraising Your Data Needs
- 5.2. Acquiring the Data You Need
- 6. Analyzing Map Data
- 6.1. Downloading the Demonstration Data
- 6.2. Installing Data Management Tools: GDAL and FWTools
- 6.3. Examining Data Content
- 6.4. Summarizing Information Using Other Tools
- 7. Converting Map Data
- 7.1. Converting Map Data
- 7.2. Converting Vector Data
- 7.3. Converting Raster Data to Other Formats
- 8. Visualizing Mapping Data in a Desktop Program
- 8.1. Visualization and Mapping Programs
- 8.2. Using OpenEV
- 8.3. OpenEV Basics
- 9. Create and Edit Personal Map Data
- 9.1. Planning Your Map
- 9.2. Preprocessing Data Examples
- 10. Creating Static Maps
- 10.1. MapServer Utilities
- 10.2. Sample Uses of the Command-Line Utilities
- 10.3. Setting Output Image Formats
- 11. Publishing Interactive Maps on the Web
- 11.1. Preparing and Testing MapServer
- 11.2. Create a Custom Application for a Particular Area
- 11.3. Continuing Education
- 12. Accessing Maps Through Web Services
- 12.1. Web Services for Mapping
- 12.2. What Do Web Services for Mapping Do?
- 12.3. Using MapServer with Web Services
- 12.4. Reference Map Files
- 13. Managing a Spatial Database
- 13.1. Introducing PostGIS
- 13.2. What Is a Spatial Database?
- 13.3. Downloading PostGIS Install Packages and Binaries
- 13.4. Compiling from Source Code
- 13.5. Steps for Setting Up PostGIS
- 13.6. Creating a Spatial Database
- 13.7. Load Data into the Database
- 13.8. Spatial Data Queries
- 13.9. Accessing Spatial Data from PostGIS in Other Applications
- 14. Custom Programming with MapServer’s MapScript
- 14.1. Introducing MapScript
- 14.2. Getting MapScript
- 14.3. MapScript Objects
- 14.4. MapScript Examples
- 14.5. Other Resources
- 14.6. Parallel MapScript Translations
- A. A Brief Introduction to Map Projections
- A.1. The Third Spheroid from the Sun
- A.2. Using Map Projections with MapServer
- A.3. Map Projection Examples
- A.4. Using Projections with Other Applications
- A.5. References
- B. MapServer Reference Guide for Vector Data Access
- B.1. Vector Data
- B.2. Data Format Guide
- ESRI Shapefiles (SHP)
- PostGIS/PostgreSQL Database
- MapInfo Files (TAB/MID/MIF)
- Oracle Spatial Database
- Web Feature Service (WFS)
- Geography Markup Language Files (GML)
- VirtualSpatialData (ODBC/OVF)
- TIGER/Line Files
- ESRI ArcInfo Coverage Files
- ESRI ArcSDE Database (SDE)
- Microstation Design Files (DGN)
- IHO S-57 Files
- Spatial Data Transfer Standard Files (SDTS)
- Inline MapServer Features
- National Transfer Format Files (NTF)
- About the Author
- Colophon
- Copyright
Common Pitfalls, Deadends, and Irritations
Many maps can now be created in the safety of a home or office without the need to sail the seas to chart new territories. The traditional, nondigital methods of surveying to produce maps held certain dangers that are quite different from those of today. However, digital mapping has its own problems and irritations. The pitfalls today may not involve physical danger but instead involve poor quality, inappropriate data, or restricted access to the right kind of information.
Finding Good Source Data
A bad map isn’t much better than a blank map. This book doesn’t discuss good map design (the art of cartography), but an equally important factor plays into digital mapping: the quality of source data. Because maps are based on some sort of source data, it is imperative to have good quality information at the beginning. The maxim garbage in, garbage out definitely applies; bad data makes for bad maps and analysis. This is discussed in more detail in Chapter 5.
Dependency on Digital Tools
With the advent of digital mapping has come the loss of many traditional mapping skills. While digital tools can make maps, there are some traditional skills that are helpful. You might think that training in digital mapping would include the theory and techniques of traditional mapping processes, but it often doesn’t. Today, many who do digital mapping are trained to use only a specific piece of software. Take away that software or introduce a large theoretical problem, and they may be lost. Map projection problems are a good example. If you don’t understand how projections work, you can severely degrade the quality of your data when reprojecting and merging datasets as described in Chapter 8 and discussed in Appendix A.
Another example would be the ignorance of geometric computations. It was quite humiliating to realize that I didn’t know how to calculate the area of an irregular polygon; nor was it even common knowledge to my most esteemed GIS colleagues. Figure 2-2 shows a range of common shapes and the formulae used to calculate their area.
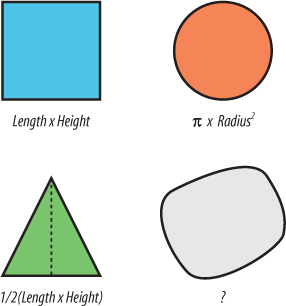
Many of the calculations were taught in elementary school but not for the irregular polygon. It doesn’t use a simple formula, and there are multiple ways to calculate the area. One method is to triangulate all the vertices that make up the polygon boundary and then calculate and sum the area of all those triangles. You can see why we let the computer do this kind of task!
It was rather amusing to realize that we used digital tools to calculate areas of polygons all the time but had little or no idea of how it was done. On the other hand it was disconcerting to see how much of our thinking was relegated to the computer. Most of us could not even verify computed answers if we wanted to!
Digital mapping and GIS need to become more than just a tool for getting to the end goal. More theory and practice of manual skills would better enable the map maker and analyst to use digital tools in a wise manner. It goes without saying that our dependency on digital tools doesn’t necessarily make us smarter. Because this book doesn’t teach cartographic theory, I recommend you find other texts that do. There are many available, including:
M.J. Kraak and F.J. Ormeling. Cartography: Visualization of Spatial Data. London: Longman. 1996.
Alan M. MacEachren. Some Truth with Maps. Washington: Penn State. 1994.
Understanding Data Formats
There are many different mapping data formats in use today. In order to use map data effectively you must understand what format your data is in, and you must know what data format you need. If the current format isn’t suitable, you must be able to convert it to an intermediate format or store it in a different manner.
Warning
The range of different software and data formats is confusing. Many different vendors have created their own proprietary data formats. This has left users tied to a format as long as they use that product. Vendors are starting to work together to develop some independent standards, which will help those using data with their products.
Make sure you understand what task you are going to need the source data for. Will you be printing a customized map and combining it with other pieces of data, or will you simply view it on the screen? Will you need to edit the data or merge it with other data for analysis? Your answers to these questions will help you choose the appropriate formats and storage methods for your tasks.
Using the Right Tools
There are numerous digital mapping tools available. This makes the choice of any given tool difficult. Some think that the biggest, most expensive tools are the only way to go. They may secretly believe that the product is more stable or better supported (when, in fact, it may just be slick marketing). Choosing the right tool for the job is very difficult when you have so many (seemingly) comparable choices. For example, sometimes GIS tools are used when a simple drawing program may have been more effective, but this was never considered because the users were thinking in terms of a GIS software package.
Examples of extreme oversimplification and extreme complexity are frequently found when using mapping and GIS software. You can see the best example of this problem when comparing computer-aided design (CAD) technicians and GIS analysts. GIS analysts often maintain very modular, relatively simple pieces of data requiring a fair bit of work to make a nice visual product. CAD users have a lot of options for graphical quality, but often lack easy-to-use analytical tools. The complexity of trying to understand how to style, move, or edit lines, etc., makes many CAD programs difficult to use. Likewise, the complexities of data management and analytical tools make some GIS software daunting.