Table of Contents for
Web Mapping Illustrated
 Web Mapping Illustrated
Published by
O'Reilly Media, Inc., 2005
Web Mapping Illustrated
Published by
O'Reilly Media, Inc., 2005
- Web Mapping Illustrated
- Cover
- Web Mapping Illustrated
- A Note Regarding Supplemental Files
- Foreword
- Preface
- Youthful Exploration
- The Tools in This Book
- What This Book Covers
- Organization of This Book
- Conventions Used in This Book
- Safari Enabled
- Comments and Questions
- Acknowledgments
- 1. Introduction to Digital Mapping
- 1.1. The Power of Digital Maps
- 1.2. The Difficulties of Making Maps
- 1.3. Different Kinds of Web Mapping
- 2. Digital Mapping Tasks and Tools
- 2.1. Common Mapping Tasks
- 2.2. Common Pitfalls, Deadends, and Irritations
- 2.3. Identifying the Types of Tasks for a Project
- 3. Converting and Viewing Maps
- 3.1. Raster and Vector
- 3.2. OpenEV
- 3.3. MapServer
- 3.4. Geospatial Data Abstraction Library (GDAL)
- 3.5. OGR Simple Features Library
- 3.6. PostGIS
- 3.7. Summary of Applications
- 4. Installing MapServer
- 4.1. How MapServer Applications Operate
- 4.2. Walkthrough of the Main Components
- 4.3. Installing MapServer
- 4.4. Getting Help
- 5. Acquiring Map Data
- 5.1. Appraising Your Data Needs
- 5.2. Acquiring the Data You Need
- 6. Analyzing Map Data
- 6.1. Downloading the Demonstration Data
- 6.2. Installing Data Management Tools: GDAL and FWTools
- 6.3. Examining Data Content
- 6.4. Summarizing Information Using Other Tools
- 7. Converting Map Data
- 7.1. Converting Map Data
- 7.2. Converting Vector Data
- 7.3. Converting Raster Data to Other Formats
- 8. Visualizing Mapping Data in a Desktop Program
- 8.1. Visualization and Mapping Programs
- 8.2. Using OpenEV
- 8.3. OpenEV Basics
- 9. Create and Edit Personal Map Data
- 9.1. Planning Your Map
- 9.2. Preprocessing Data Examples
- 10. Creating Static Maps
- 10.1. MapServer Utilities
- 10.2. Sample Uses of the Command-Line Utilities
- 10.3. Setting Output Image Formats
- 11. Publishing Interactive Maps on the Web
- 11.1. Preparing and Testing MapServer
- 11.2. Create a Custom Application for a Particular Area
- 11.3. Continuing Education
- 12. Accessing Maps Through Web Services
- 12.1. Web Services for Mapping
- 12.2. What Do Web Services for Mapping Do?
- 12.3. Using MapServer with Web Services
- 12.4. Reference Map Files
- 13. Managing a Spatial Database
- 13.1. Introducing PostGIS
- 13.2. What Is a Spatial Database?
- 13.3. Downloading PostGIS Install Packages and Binaries
- 13.4. Compiling from Source Code
- 13.5. Steps for Setting Up PostGIS
- 13.6. Creating a Spatial Database
- 13.7. Load Data into the Database
- 13.8. Spatial Data Queries
- 13.9. Accessing Spatial Data from PostGIS in Other Applications
- 14. Custom Programming with MapServer’s MapScript
- 14.1. Introducing MapScript
- 14.2. Getting MapScript
- 14.3. MapScript Objects
- 14.4. MapScript Examples
- 14.5. Other Resources
- 14.6. Parallel MapScript Translations
- A. A Brief Introduction to Map Projections
- A.1. The Third Spheroid from the Sun
- A.2. Using Map Projections with MapServer
- A.3. Map Projection Examples
- A.4. Using Projections with Other Applications
- A.5. References
- B. MapServer Reference Guide for Vector Data Access
- B.1. Vector Data
- B.2. Data Format Guide
- ESRI Shapefiles (SHP)
- PostGIS/PostgreSQL Database
- MapInfo Files (TAB/MID/MIF)
- Oracle Spatial Database
- Web Feature Service (WFS)
- Geography Markup Language Files (GML)
- VirtualSpatialData (ODBC/OVF)
- TIGER/Line Files
- ESRI ArcInfo Coverage Files
- ESRI ArcSDE Database (SDE)
- Microstation Design Files (DGN)
- IHO S-57 Files
- Spatial Data Transfer Standard Files (SDTS)
- Inline MapServer Features
- National Transfer Format Files (NTF)
- About the Author
- Colophon
- Copyright
Walkthrough of the Main Components
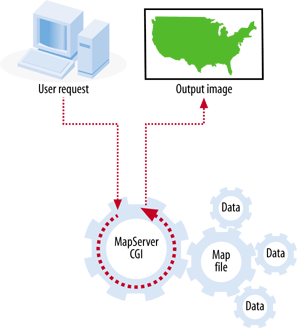
MapServer produces output graphic files based on the input requests from the user and how the map is defined. Key components include the MapServer executable or CGI program, a map file, data sources and output images. Figure 4-3 shows how all these components work together: after a user request, the MapServer CGI program accesses a map file, draws information from the data sources, and returns an image of the map.
MapServer Executable
The simplest form of MapServer runs as an executable CGI application on a web server. Technically, MapServer is considered an HTTP-based stateless process. Stateless means that it processes a request and then stops running. A CGI application receives requests from a web server, processes them, and then returns a response or data to the web server. CGI is by far the most popular due to its simplicity: no programming is required to get it working. You edit the text-based, runtime configuration file, create a web page, and then set them up to be served by a web server.
Tip
If you are a programmer, you don’t need to use MapServer in CGI mode. Instead, you can create custom applications that use the MapServer API. However, this is considered an advanced topic, and an overview is discussed in Chapter 14.
The MapServer CGI executable acts as a middle man between the mapping data files and the web server program requesting the map. The requests are passed in the form of CGI parameters from the web server to MapServer. The images that are created by MapServer are then fed back to the web server and, ultimately, to the user’s web browser. More on the MapServer executable and how to install it is discussed later in this chapter.
The focus of this chapter is on using MapServer to create a map image. MapServer can also create scale bars, legends, and reference/key maps for your application, as discussed in Chapters 10 and 11.
MapServer’s Map File
MapServer is like an engine that requires fuel to run and a fuel delivery system to get the fuel to the engine. The MapServer program needs to know what map layers to draw, how to draw them, and where the source data is located. The data is the fuel, and the map file—also known as the mapping file or .map file—serves as the delivery system. The map file is a text configuration file that lists the settings for drawing and interacting with the map. It includes information about what data layers to draw, where the geographic focus of the map is, what projection system is being used, and which output image format to use, and it sets the way the legends and scale bars are drawn. An extremely simple version of a map file is shown in Example 4-1.
MAP
  SIZE 600 300
  EXTENT -180 -90 180 90
  LAYER
    NAME countries
    TYPE POLYGON
    STATUS DEFAULT
    DATA countries.shp
    CLASS
      OUTLINECOLOR 100 100 100
    END
  END
END
When a request comes to a MapServer application, the request must specify what map file to use. Then MapServer creates the map based on the settings in the map file. This makes the map file the central piece of any MapServer application. Map files are covered in greater detail in Chapter 10, where the process of creating a MapServer application is discussed.
Data Sources
If the map file is the fuel delivery system, the data sources are the fuel. MapServer can use a vast array of data sources to create maps. Out-of-the-box support covers the most common formats. Optional data access add-ons open up access to dozens of vector and raster formats (formats supported by the GDAL and OGR libraries). These may be GIS data files, database connections, or even flat comma-separated text files using the Virtual Spatial Data format capabilities of OGR.
MapServer can also use the OGC web specifications to access and share data across the Internet. Map layers can be requested from remote servers that also use OGC specifications. More on data sources is discussed in Chapter 5. For more about the purpose and goals of the OGC and OGC web services, see Chapter 12.
Output Map Image
While the map file is the central part of any MapServer application, the map image that is generated is usually what the end user is after. After all the layers are processed and written to a web-friendly graphics file, the user’s web browser is then directed to load the image into the web page for viewing. Many first-time users experience problems with MapServer not returning the output map image. Chapter 11 covers in more detail how to set up MapServer to handle the map image.
The map isn’t the only image that can be created. Scale bars, graphic legends and reference maps can also be part of a MapServer application. These are handled in a similar manner as the map image. Chapters 10 and 11 show examples that use these.