Table of Contents for
Web Mapping Illustrated
 Web Mapping Illustrated
Published by
O'Reilly Media, Inc., 2005
Web Mapping Illustrated
Published by
O'Reilly Media, Inc., 2005
- Web Mapping Illustrated
- Cover
- Web Mapping Illustrated
- A Note Regarding Supplemental Files
- Foreword
- Preface
- Youthful Exploration
- The Tools in This Book
- What This Book Covers
- Organization of This Book
- Conventions Used in This Book
- Safari Enabled
- Comments and Questions
- Acknowledgments
- 1. Introduction to Digital Mapping
- 1.1. The Power of Digital Maps
- 1.2. The Difficulties of Making Maps
- 1.3. Different Kinds of Web Mapping
- 2. Digital Mapping Tasks and Tools
- 2.1. Common Mapping Tasks
- 2.2. Common Pitfalls, Deadends, and Irritations
- 2.3. Identifying the Types of Tasks for a Project
- 3. Converting and Viewing Maps
- 3.1. Raster and Vector
- 3.2. OpenEV
- 3.3. MapServer
- 3.4. Geospatial Data Abstraction Library (GDAL)
- 3.5. OGR Simple Features Library
- 3.6. PostGIS
- 3.7. Summary of Applications
- 4. Installing MapServer
- 4.1. How MapServer Applications Operate
- 4.2. Walkthrough of the Main Components
- 4.3. Installing MapServer
- 4.4. Getting Help
- 5. Acquiring Map Data
- 5.1. Appraising Your Data Needs
- 5.2. Acquiring the Data You Need
- 6. Analyzing Map Data
- 6.1. Downloading the Demonstration Data
- 6.2. Installing Data Management Tools: GDAL and FWTools
- 6.3. Examining Data Content
- 6.4. Summarizing Information Using Other Tools
- 7. Converting Map Data
- 7.1. Converting Map Data
- 7.2. Converting Vector Data
- 7.3. Converting Raster Data to Other Formats
- 8. Visualizing Mapping Data in a Desktop Program
- 8.1. Visualization and Mapping Programs
- 8.2. Using OpenEV
- 8.3. OpenEV Basics
- 9. Create and Edit Personal Map Data
- 9.1. Planning Your Map
- 9.2. Preprocessing Data Examples
- 10. Creating Static Maps
- 10.1. MapServer Utilities
- 10.2. Sample Uses of the Command-Line Utilities
- 10.3. Setting Output Image Formats
- 11. Publishing Interactive Maps on the Web
- 11.1. Preparing and Testing MapServer
- 11.2. Create a Custom Application for a Particular Area
- 11.3. Continuing Education
- 12. Accessing Maps Through Web Services
- 12.1. Web Services for Mapping
- 12.2. What Do Web Services for Mapping Do?
- 12.3. Using MapServer with Web Services
- 12.4. Reference Map Files
- 13. Managing a Spatial Database
- 13.1. Introducing PostGIS
- 13.2. What Is a Spatial Database?
- 13.3. Downloading PostGIS Install Packages and Binaries
- 13.4. Compiling from Source Code
- 13.5. Steps for Setting Up PostGIS
- 13.6. Creating a Spatial Database
- 13.7. Load Data into the Database
- 13.8. Spatial Data Queries
- 13.9. Accessing Spatial Data from PostGIS in Other Applications
- 14. Custom Programming with MapServer’s MapScript
- 14.1. Introducing MapScript
- 14.2. Getting MapScript
- 14.3. MapScript Objects
- 14.4. MapScript Examples
- 14.5. Other Resources
- 14.6. Parallel MapScript Translations
- A. A Brief Introduction to Map Projections
- A.1. The Third Spheroid from the Sun
- A.2. Using Map Projections with MapServer
- A.3. Map Projection Examples
- A.4. Using Projections with Other Applications
- A.5. References
- B. MapServer Reference Guide for Vector Data Access
- B.1. Vector Data
- B.2. Data Format Guide
- ESRI Shapefiles (SHP)
- PostGIS/PostgreSQL Database
- MapInfo Files (TAB/MID/MIF)
- Oracle Spatial Database
- Web Feature Service (WFS)
- Geography Markup Language Files (GML)
- VirtualSpatialData (ODBC/OVF)
- TIGER/Line Files
- ESRI ArcInfo Coverage Files
- ESRI ArcSDE Database (SDE)
- Microstation Design Files (DGN)
- IHO S-57 Files
- Spatial Data Transfer Standard Files (SDTS)
- Inline MapServer Features
- National Transfer Format Files (NTF)
- About the Author
- Colophon
- Copyright
Appraising Your Data Needs
What you need will vary greatly depending on your goal, so you should first determine the goal or final product of your work. Along with this comes the need to assess what kind of map information you want to portray and at what level of detail. The following sections are a guide to thinking through all your requirements before starting a project.
Vector Maps or Raster Maps?
If you want to make a custom map, you need to determine what kind of map data you require. There are two kinds of maps, each requiring different kinds of map data.
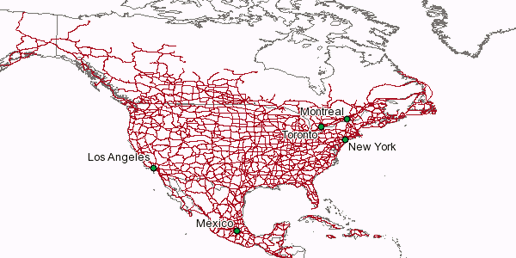
A vector map shows features made up of points, lines, or polygon areas, as in Figure 5-1. For instance, this can be a local road map or a global map showing locations of power stations and their respective countries.
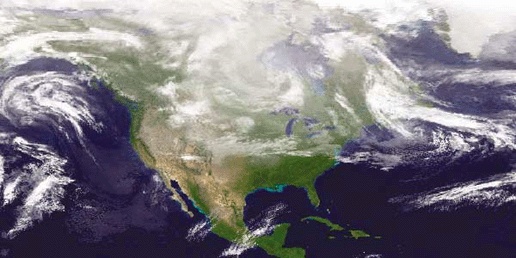
An image or raster map is made from data sources such as aerial photography, satellite imagery, or computer-generated images of Earth’s surface. Figure 5-2 shows an example of a raster map made from weather satellite data.
One variant of the raster map is the scanned map. When a paper map is scanned, it is converted into a digital raster map and can then be used as a layer on other maps. This is one way to make mapping data more readily available without having to recreate the maps using digital sources.
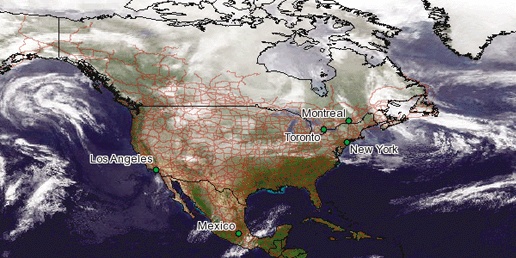
A map often combines vector and raster data to create a more effective map than either could produce in isolation, as in Figure 5-3. Pure vector maps and pure raster maps are at opposite ends of a continuum of map types; many maps include both kinds of data.
What Kind of Vector Data Do You Require?
Each of the three types of vector data (point, line, and polygon) can be used to show certain types of information on a map. Points can show the location of towns or the position of a radio tower. Lines can show travel routes or boundaries. Polygons can be shaded to show a lake or highlight a country on a world map. Each piece of vector
data can have other information associated with it that could, for example, be used to label a feature on the map.
When determining what kind of vector data you require, consider what you want to draw on your map. Will you need to draw text labels on top of line features? Are you planning to use a simple list of coordinates (e.g., in a spreadsheet) to show the point location of features, or do you need more complex boundary data to outline an area?
What Kind of Raster Data Do You Require?
Digital images, such as aerial photographs or satellite images, are part of the raster family of mapping data. A raster represents a continuous grid of data. The grid is made up of small squares, also known as cells or pixels. Each square can have one or more values associated with it. Values used in color images, like photographs, represent the levels of red, green, and blue in a cell. Values can also represent elevations when used in a digital elevation model (DEM) raster.
Decide what kind of raster data you need. Then, when you’ve found some data, you need to decide whether it is useful as is or if you need to modify or enhance it.
What Scale of Map Do You Require?
If you’ve ever looked for a small lake near your home on a map of the world, you’ll understand that maps can’t show every tiny feature. If you took a 12-inch map of the world and stretched it to fit the side of a house, you might be able to see some smaller features; they would be larger than they were before. This kind of map would be called large-scale because it makes features larger for the viewer. A smaller-scale map shrinks these features but can cover a greater area.
Tip
Geographers use map scales in a way that seems counter-intuitive, but really does make sense. The average map reader may assume that a scale of 1:1,000 is larger scale than 1:500, because 1,000 is a larger number than 500. This way of writing scales is called a representative fraction (RF). An RF is a fraction: 1:500 means 1/500 or 0.002. 1:1,000 means 1/1,000 or 0.001. Because 1/500 represents a larger value, we say it is a larger scale map.
The scale 1:500 also shows more detail because features are drawn larger than at 1:1,000. This is the second reason for calling 1:500 a larger scale than 1:1,000.
For further reading on map scales, see Sonoma University’s web page dedicated to this topic at http://www.sonoma.edu/geography/resources/mapscale.htm.
Understanding the size and scale of the map you want to create is very important because it will dictate the precision of data you require. For example, if you want to make a map of your neighborhood, basic world map data may not be detailed enough to even show your street. Likewise, if you want to create a global map that shows the distribution of weather patterns, highly detailed road line data is probably going to be irrelevant.
Most data is created to be viewed at a specific scale. If you try to use the data at a different scale than it was intended for, it may not look right and might not align with other features properly. Decide on the size of map you want to create, especially if you plan to print the map onto paper. Then decide what you want to fit onto that map—something showing your country or your city? How big do you really want it to end up being drawn? If it is only going to be a digital map, how much of the map do you want to see on the screen? This will help you know what scale of information to hunt down. Of course, if it is a digital map, you will have a lot more flexibility than if you are looking to print the final product.
Do You Need Three Dimensions?
Sometimes you want to create a map that can give a three dimensional (3D) perspective to your data. This type of analysis can be complex.
Three-dimensional perspectives simulate what an area of land looks like from above looking down or from the ground looking up. These maps are used in areas where a good view of the physical relief is required, such as when planning a hike up a mountain range or planning a hydroelectric dam project. A traditional 2D map is still quite useful, but there is nothing like creating a map that makes information look more like the real world.
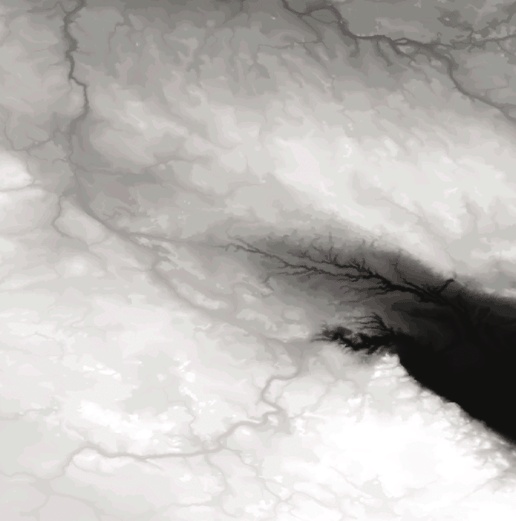
If you want to try 3D mapping, you need to keep a few things in mind. First, you need to decide how you are going to represent the elevation data. An elevation model is often represented by a 2D raster that shows the changes in elevation. In general, the raster is shaded from dark to light to represent these elevation changes, and each square on the raster is shaded to show a certain elevation. Figure 5-4 shows an elevation shaded raster where black is the lowest level, and white is the highest. In some programs, this type of raster is called a height field map or hillshade.
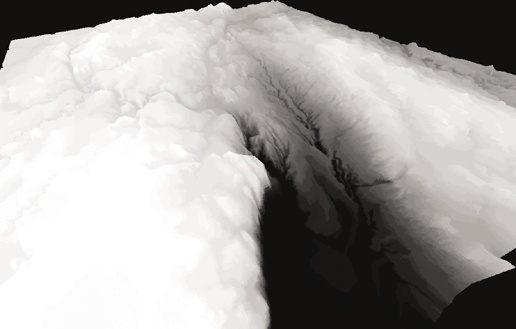
The other element to 3D mapping is the type of information you want to lay on top of the elevation model. Other images or vectors can be overlaid on top of the elevation model through a process known as draping. Draping is named after the concept of laying a piece of light fabric on a bumpy surface, like a bed sheet over a basketball. The draped layer takes the form of the underlying elevation model to give a unique perspective to the draped information. Figure 5-5 shows the same image as in Figure 5-4 but represented in 3D using OpenEV.
If you can’t find elevation model data or decide what types of information to drape over it, you will probably not be able to do 3D mapping. Specific examples of 3D mapping are given in Chapter 8.