Table of Contents for
Web Mapping Illustrated
 Web Mapping Illustrated
Published by
O'Reilly Media, Inc., 2005
Web Mapping Illustrated
Published by
O'Reilly Media, Inc., 2005
- Web Mapping Illustrated
- Cover
- Web Mapping Illustrated
- A Note Regarding Supplemental Files
- Foreword
- Preface
- Youthful Exploration
- The Tools in This Book
- What This Book Covers
- Organization of This Book
- Conventions Used in This Book
- Safari Enabled
- Comments and Questions
- Acknowledgments
- 1. Introduction to Digital Mapping
- 1.1. The Power of Digital Maps
- 1.2. The Difficulties of Making Maps
- 1.3. Different Kinds of Web Mapping
- 2. Digital Mapping Tasks and Tools
- 2.1. Common Mapping Tasks
- 2.2. Common Pitfalls, Deadends, and Irritations
- 2.3. Identifying the Types of Tasks for a Project
- 3. Converting and Viewing Maps
- 3.1. Raster and Vector
- 3.2. OpenEV
- 3.3. MapServer
- 3.4. Geospatial Data Abstraction Library (GDAL)
- 3.5. OGR Simple Features Library
- 3.6. PostGIS
- 3.7. Summary of Applications
- 4. Installing MapServer
- 4.1. How MapServer Applications Operate
- 4.2. Walkthrough of the Main Components
- 4.3. Installing MapServer
- 4.4. Getting Help
- 5. Acquiring Map Data
- 5.1. Appraising Your Data Needs
- 5.2. Acquiring the Data You Need
- 6. Analyzing Map Data
- 6.1. Downloading the Demonstration Data
- 6.2. Installing Data Management Tools: GDAL and FWTools
- 6.3. Examining Data Content
- 6.4. Summarizing Information Using Other Tools
- 7. Converting Map Data
- 7.1. Converting Map Data
- 7.2. Converting Vector Data
- 7.3. Converting Raster Data to Other Formats
- 8. Visualizing Mapping Data in a Desktop Program
- 8.1. Visualization and Mapping Programs
- 8.2. Using OpenEV
- 8.3. OpenEV Basics
- 9. Create and Edit Personal Map Data
- 9.1. Planning Your Map
- 9.2. Preprocessing Data Examples
- 10. Creating Static Maps
- 10.1. MapServer Utilities
- 10.2. Sample Uses of the Command-Line Utilities
- 10.3. Setting Output Image Formats
- 11. Publishing Interactive Maps on the Web
- 11.1. Preparing and Testing MapServer
- 11.2. Create a Custom Application for a Particular Area
- 11.3. Continuing Education
- 12. Accessing Maps Through Web Services
- 12.1. Web Services for Mapping
- 12.2. What Do Web Services for Mapping Do?
- 12.3. Using MapServer with Web Services
- 12.4. Reference Map Files
- 13. Managing a Spatial Database
- 13.1. Introducing PostGIS
- 13.2. What Is a Spatial Database?
- 13.3. Downloading PostGIS Install Packages and Binaries
- 13.4. Compiling from Source Code
- 13.5. Steps for Setting Up PostGIS
- 13.6. Creating a Spatial Database
- 13.7. Load Data into the Database
- 13.8. Spatial Data Queries
- 13.9. Accessing Spatial Data from PostGIS in Other Applications
- 14. Custom Programming with MapServer’s MapScript
- 14.1. Introducing MapScript
- 14.2. Getting MapScript
- 14.3. MapScript Objects
- 14.4. MapScript Examples
- 14.5. Other Resources
- 14.6. Parallel MapScript Translations
- A. A Brief Introduction to Map Projections
- A.1. The Third Spheroid from the Sun
- A.2. Using Map Projections with MapServer
- A.3. Map Projection Examples
- A.4. Using Projections with Other Applications
- A.5. References
- B. MapServer Reference Guide for Vector Data Access
- B.1. Vector Data
- B.2. Data Format Guide
- ESRI Shapefiles (SHP)
- PostGIS/PostgreSQL Database
- MapInfo Files (TAB/MID/MIF)
- Oracle Spatial Database
- Web Feature Service (WFS)
- Geography Markup Language Files (GML)
- VirtualSpatialData (ODBC/OVF)
- TIGER/Line Files
- ESRI ArcInfo Coverage Files
- ESRI ArcSDE Database (SDE)
- Microstation Design Files (DGN)
- IHO S-57 Files
- Spatial Data Transfer Standard Files (SDTS)
- Inline MapServer Features
- National Transfer Format Files (NTF)
- About the Author
- Colophon
- Copyright
Chapter 2. Digital Mapping Tasks and Tools
Maps can be beautiful. Some antique maps, found today in prints, writing paper, and even greeting cards, are appreciated more for their aesthetic value than their original cartographic use. The aspiring map maker can be intimidated by these masterpieces of science and art. Fortunately, the mapping process doesn’t need to be intimidating or mystical.
Before you begin, you should know that all maps serve a specific purpose. If you understand that purpose, you’ve decoded the most important piece of a mapping project. This is true regardless of how the map is made. Traditional tools were pen and ink, not magic. Digital maps are just a drawing made up of points strung together into lines and shapes, or a mosaic of colored squares.
The purpose and fundamentals of digital mapping are no different and no more complex than traditional mapping. In the past, a cartographer would sit down, pull out some paper, and sketch a map. Of course, this took skill, knowledge, and a great deal of patience. Using digital tools, the computer is the canvas, and software tools do the drawing using geographic data as the knowledge base. Not only do digital tools make more mapping possible, in most cases digital solutions make the work ridiculously easy.
This chapter explores the common tasks, pitfalls, and issues involved in creating maps using computerized methods. This includes an overview of the types of tasks involved with digital mapping—the communication of information using a variety of powerful media including maps, images, and other sophisticated graphics. The goals of digital mapping are no different than that of traditional mapping: they present geographic or location-based information to a particular audience for a particular purpose. Perhaps your job requires you to map out a proposed subdivision. Maybe you want to show where the good fishing spots are in the lake by your summer cabin. Different reasons yield the same desired goal: a map.
For the most part, the terms geographic information and maps can be used interchangeably, but maps usually refer to the output (printed or digital) of the mapping process. Geographic information refers to digital data stored in files on a computer that’s used for a variety of purposes.
When the end product of a field survey is a hardcopy map, the whole process results in a paper map and nothing more. The map might be altered and appended as more information becomes available, but the hardcopy map is the final product with a single purpose.
Digital mapping can do this and more. Computerized tools help collect and interact with the map data. This data is used to make maps, but it can also be analyzed to create new data or produce statistical summaries. The same geographic data can be applied to several different mapping projects. The ability to render the same information without compiling new field notes or tracing a paper copy makes digital mapping more efficient and more fun.
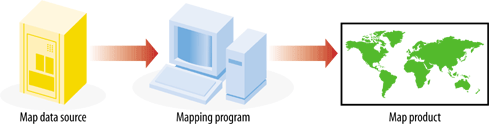
Digital mapping applies computer-assisted techniques to a wide range of tasks that traditionally required large amounts of manual labor. The tasks that were performed are no different than those of the modern map maker, though the approach and tools vary greatly. Figure 2-1 shows a conceptual diagram of the digital mapping process.