Table of Contents for
Web Mapping Illustrated
 Web Mapping Illustrated
Published by
O'Reilly Media, Inc., 2005
Web Mapping Illustrated
Published by
O'Reilly Media, Inc., 2005
- Web Mapping Illustrated
- Cover
- Web Mapping Illustrated
- A Note Regarding Supplemental Files
- Foreword
- Preface
- Youthful Exploration
- The Tools in This Book
- What This Book Covers
- Organization of This Book
- Conventions Used in This Book
- Safari Enabled
- Comments and Questions
- Acknowledgments
- 1. Introduction to Digital Mapping
- 1.1. The Power of Digital Maps
- 1.2. The Difficulties of Making Maps
- 1.3. Different Kinds of Web Mapping
- 2. Digital Mapping Tasks and Tools
- 2.1. Common Mapping Tasks
- 2.2. Common Pitfalls, Deadends, and Irritations
- 2.3. Identifying the Types of Tasks for a Project
- 3. Converting and Viewing Maps
- 3.1. Raster and Vector
- 3.2. OpenEV
- 3.3. MapServer
- 3.4. Geospatial Data Abstraction Library (GDAL)
- 3.5. OGR Simple Features Library
- 3.6. PostGIS
- 3.7. Summary of Applications
- 4. Installing MapServer
- 4.1. How MapServer Applications Operate
- 4.2. Walkthrough of the Main Components
- 4.3. Installing MapServer
- 4.4. Getting Help
- 5. Acquiring Map Data
- 5.1. Appraising Your Data Needs
- 5.2. Acquiring the Data You Need
- 6. Analyzing Map Data
- 6.1. Downloading the Demonstration Data
- 6.2. Installing Data Management Tools: GDAL and FWTools
- 6.3. Examining Data Content
- 6.4. Summarizing Information Using Other Tools
- 7. Converting Map Data
- 7.1. Converting Map Data
- 7.2. Converting Vector Data
- 7.3. Converting Raster Data to Other Formats
- 8. Visualizing Mapping Data in a Desktop Program
- 8.1. Visualization and Mapping Programs
- 8.2. Using OpenEV
- 8.3. OpenEV Basics
- 9. Create and Edit Personal Map Data
- 9.1. Planning Your Map
- 9.2. Preprocessing Data Examples
- 10. Creating Static Maps
- 10.1. MapServer Utilities
- 10.2. Sample Uses of the Command-Line Utilities
- 10.3. Setting Output Image Formats
- 11. Publishing Interactive Maps on the Web
- 11.1. Preparing and Testing MapServer
- 11.2. Create a Custom Application for a Particular Area
- 11.3. Continuing Education
- 12. Accessing Maps Through Web Services
- 12.1. Web Services for Mapping
- 12.2. What Do Web Services for Mapping Do?
- 12.3. Using MapServer with Web Services
- 12.4. Reference Map Files
- 13. Managing a Spatial Database
- 13.1. Introducing PostGIS
- 13.2. What Is a Spatial Database?
- 13.3. Downloading PostGIS Install Packages and Binaries
- 13.4. Compiling from Source Code
- 13.5. Steps for Setting Up PostGIS
- 13.6. Creating a Spatial Database
- 13.7. Load Data into the Database
- 13.8. Spatial Data Queries
- 13.9. Accessing Spatial Data from PostGIS in Other Applications
- 14. Custom Programming with MapServer’s MapScript
- 14.1. Introducing MapScript
- 14.2. Getting MapScript
- 14.3. MapScript Objects
- 14.4. MapScript Examples
- 14.5. Other Resources
- 14.6. Parallel MapScript Translations
- A. A Brief Introduction to Map Projections
- A.1. The Third Spheroid from the Sun
- A.2. Using Map Projections with MapServer
- A.3. Map Projection Examples
- A.4. Using Projections with Other Applications
- A.5. References
- B. MapServer Reference Guide for Vector Data Access
- B.1. Vector Data
- B.2. Data Format Guide
- ESRI Shapefiles (SHP)
- PostGIS/PostgreSQL Database
- MapInfo Files (TAB/MID/MIF)
- Oracle Spatial Database
- Web Feature Service (WFS)
- Geography Markup Language Files (GML)
- VirtualSpatialData (ODBC/OVF)
- TIGER/Line Files
- ESRI ArcInfo Coverage Files
- ESRI ArcSDE Database (SDE)
- Microstation Design Files (DGN)
- IHO S-57 Files
- Spatial Data Transfer Standard Files (SDTS)
- Inline MapServer Features
- National Transfer Format Files (NTF)
- About the Author
- Colophon
- Copyright
The Difficulties of Making Maps
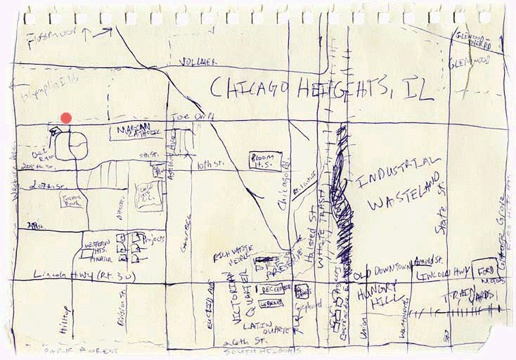
If you’ve worked with maps, digital or conventional, you’ll know that despite my enthusiasm, mapping isn’t always easy. Why do we often find it so difficult to make maps of the world around us? How well could you map out the way you normally drive to the supermarket? Usually, it’s easier to describe your trip than it is to draw a map. Perhaps we have a perception of what a map must look like and therefore are afraid to draw our own, thinking it might look silly in comparison. Yet some maps drawn by a friend on a napkin might be of more use than any professional city map could ever be.
Personal Maps
The element of personal knowledge, rather than general knowledge, is what can make a somewhat useful map into one that is very powerful. When words fail to describe the location of something that isn’t general knowledge, a map can round out the picture for you. Maps can be used to supplement a verbal description, but because creating a map involves drawing a perspective from your head, it can be very intimidating. That intimidation and lack of ownership over maps has created an interesting dilemma. In our minds, maps are something that professionals create, not the average person. Yet a map like the one shown in Figure 1-1 can have much more meaning to someone than a professional map of the same area. So what are the professional maps lacking? They show mostly common information and often lack personal information that would make the map more useful or interesting to you.
Technology Barriers
Digital mapping isn’t a new topic. Ever since computers could create graphic representations of the earth, people have been creating maps with them. In early computing, people used to draw with ASCII text-based maps. (I remember creating ASCII maps for role-playing games on a Tandy color computer.) However, designing graphics with ASCII symbols wasn’t pretty. Thankfully, more sophisticated graphic techniques on personal computers allow you to create your own high-quality maps.
You might already be creating your own maps but aren’t satisfied with the tools. For some, the cost of commercial tools can be prohibitive, especially if you just want to play around for a while to get a feel for the craft. Open source software alleviates the need for immediate, monetary payback on investment.
For others, cost may not be an issue but capabilities are. Just like proprietary software, open source mapping products vary in their features. Improved features might include ease of use or quality of output. One major area of difference is in how products communicate with other products. This is called interoperability and refers to the ability of a program to share data or functions with another program. These often adhere to open standards—protocols for communication between applications. The basic idea is to define standards that aren’t dependent on one particular software package; they would depend instead on the communication process a developer decided to implement. An example of these standards in action is the ability of your program to request maps from another mapping program over the Internet. The real power of open standards is evident when your program can communicate with a program developed by a different group/vendor. This is a crucial issue for many large organizations, especially government agencies, where sharing data across departments can make or break the efficiency in that organization. Products that implement open standards will help to ensure the long-term viability of applications you build. Be warned, however, that some products claim to be interoperable yet stop
short of implementing the full standards. Some companies modify the standards for their product, defeating the purpose of those standards. Interoperability standards are also relatively young and in a state of flux.
Costs and capabilities may not be the main barrier for you. Maybe you want to create your own maps but don’t know how. Maybe you don’t know what tools are available. This book describes some of the free tools available to you, to get you moving toward your end goal of map production.
Another barrier might be that you lack the technical know-how required for digital mapping. While conventional mapping techniques cut out most of the population, digital mapping techniques also prohibit people who aren’t very tech-savvy. This is because installing and customizing software is beyond the scope of many computer users. The good news is that those who are comfortable with the customization side of computerized mapping can create easy-to-use tools for others. This provides great freedom for both parties. Those who have mastered the computer skills involved gain by helping fill other’s needs. New users gain by being able to view mapping information with minimal effort through an existing mapping application.
Technological barriers exist, but for those who can use a computer and want to do mapping with that computer, the possibilities are endless. The mapping tools described here aren’t necessarily easy to use: they require a degree of technical skill. Web mapping programs are more complicated than traditional desktop software. There are often no simple, automated installation procedures, and some custom configuration is required. But in general, once set up, the tools require minimal intervention.