Table of Contents for
ARM Assembly Language, 2nd Edition
 ARM Assembly Language, 2nd Edition
Published by
Chapman and Hall/CRC, 2016
ARM Assembly Language, 2nd Edition
Published by
Chapman and Hall/CRC, 2016
- Contents
- ARM Assembly Language: Fundamentals and Techniques, Second Edition
- Preliminaries
- To our families
- Preface
- Acknowledgments
- Authors
- Chapter 1 - An Overview of Computing Systems
- Chapter 2 - The Programmer’s Model
- Chapter 3 - Introduction to Instruction Sets: v4T and v7-M
- Chapter 4 - Assembler Rules and Directives
- Chapter 5 - Loads, Stores, and Addressing
- Chapter 6 - Constants and Literal Pools
- Chapter 7 - Integer Logic and Arithmetic
- Chapter 8 - Branches and Loops
- Chapter 9 - Introduction to Floating-Point: Basics, Data Types, and Data Transfer
- Chapter 10 - Introduction to Floating-Point: Rounding and Exceptions
- Chapter 11 - Floating-Point Data-Processing Instructions
- Chapter 12 - Tables
- Chapter 13 - Subroutines and Stacks
- Chapter 14 - Exception Handling: ARM7TDMI
- Chapter 15 - Exception Handling: v7-M
- Chapter 16 - Memory-Mapped Peripherals
- Chapter 17 - ARM, Thumb and Thumb-2 Instructions
- Chapter 18 - Mixing C and Assembly
- Appendix A: Running Code Composer Studio
- Appendix B: Running Keil Tools
- Appendix C: ASCII Character Codes
- Appendix D
- Glossary
- References
Appendix A: Running Code Composer Studio
A.1 Introduction
Code Composer Studio (CCS) is freely available from http://www.ti.com and provides a development environment for all of Texas Instruments’ ARM-based SoCs and microcontrollers, e.g., Sitara™, Hercules™, and Tiva™. Very inexpensive development platforms and evaluation modules (EVMs) can be found from distributors, so getting a real Cortex-M4 running code takes relatively little effort. A wide variety of microcontrollers are available from Texas Instruments, and their peripherals can be driven with inputs to exercise I/O pins, A/D converters, UARTs, etc. The Tiva Launchpad (shown earlier in Figure 1.6) contains a Cortex-M4-based microcontroller with floating-point hardware, and makes for a quick introduction to using the Code Composer Studio tools. At the time of this writing, there are both Stellaris and Tiva parts available on the Launchpad platform (Tiva is the supported product line now), and while the older LM4F230H5QR microcontroller on the Stellaris Launchpad is nearly identical to the new Tiva TM4C123GH6PM microcontroller, you can use either one. All descriptions in this Appendix will show the newer names.
Code Composer Studio does not generally support building projects in assembly only; however, there are now assembly-only options in the build choices. The tools are based on an Eclipse front-end, so students learning a high-level language like Java may already be familiar with Eclipse-based tools. Just as we’ll see with the Keil tools in Appendix B, writing assembly language on a Cortex-M4 will require breaking most industry programming practices. For starters, most of the exception vector table will be omitted to keep things simple. Second, conventional code would require handlers to be in place for dealing with Fault exceptions and interrupts, and we don’t really have to consider those just yet. We therefore create our program with handlers that just stay in an infinite loop. This is fine as long as we don’t require exception handling. To run a simple program, you first need to specify a particular device for which to assemble your code. You then create a project, write your assembly, and add it to your project. Finally, you build the project and start up the debugger to step through your code.
A.2 Running Code on the Cortex-M4
The CCS tools do not simulate a Tiva Launchpad, so you’ll want to attach the physical hardware to your development tools. You can find information about doing this in the documents provided with the board or on TI’s website. There are a couple of things to check before running your code on the Launchpad:
- When you install CCS for the first time, ensure that the Tiva products are added when the dialog appears asking which processor architectures you wish to support.
- Make sure you’ve got the in-circuit debugging interface driver loaded on the host computer.
A.2.1 Creating a Cortex-M4 Project and Selecting a Device
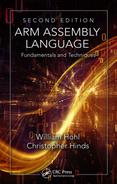
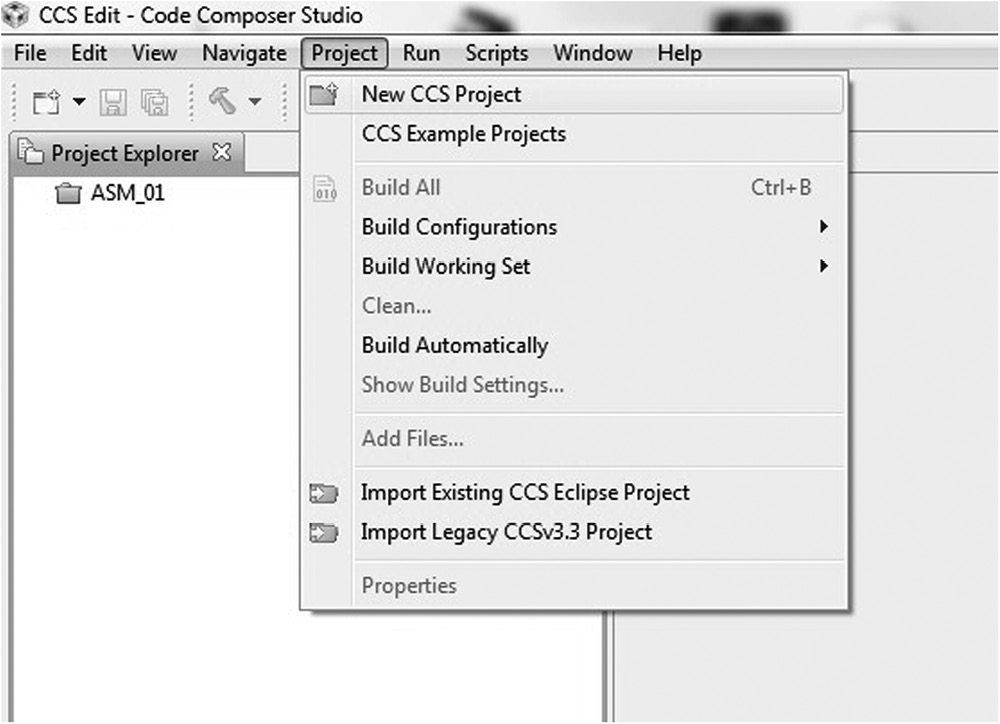
First we’ll create a new project file. Start the CCS tools and choose New CCS Project from the Project menu, as shown in Figure A.1. Give your project a name. As an example, you could call it Sample. The project file normally includes source files of code, including C, C++ and assembly, library files, header files, etc., along with a linker command file that tells the linker how to build your executable file. In our case, we will only have an assembly file and a linker command file. When the dialog box appears, select ARM from the Family drop-down menu. Choose Executable for the Output Type. In the Variant box, you should enter 123GH6PM, which will bring up TM4C123GH6PM (the chip on the Tiva Launchpad) in the parts drop-down box. Under Connection, make sure that you have the Stellaris In-Circuit Debug Interface chosen to talk to the Tiva Launchpad (newer versions of CCS may say Tiva In-Circuit Debug Interface). Under Project templates and examples, you will see an option to create an Empty Assembly-only Project, as shown in Figure A.2. Click on this option and then click on Finish. If you go to the Project Explorer pane on the left, and open the project you just created, you will find a list of files in the project. One of those will be a startup file with a “.c” ending. You should delete this file from the project by right-clicking on the name and then choosing Delete.
A.2.2 Creating Application Code
Now that the project has been created and a device chosen, you will need a source file. The easiest file to create is one that has only a few lines of actual code and a handful of directives to get the tools working. For example, the code below just adds two numbers together. Choose New -> Source File from the File menu, enter a name in the Source file box, such as Sample.asm, then carefully type the following code:
.global myStart, myStack, ResetISR, Vecs, _c_int00, _main
.sect “.myCode”
myStart:
MOV r2, #10
MOV r3, #5
ADD r1, r2, r3
B myStart
.text
; This is the Reset Handler
_c_int00:
B myStart
; This is the dummy NMI handler
NmiSR:
B $
; This is the dummy Fault handler
FaultISR:
B $
; Here we define the stack
myStack .usect “.stack”, 0x400
; Interrupt vector table (abbreviated)
.retain “.intvecs”
.sect “.intvecs”
Vecs: .wordmyStack ; initial stack pointer
.word _c_int00 ; the reset handler
.word NmiSR ; dummy NMI handler
.word FaultISR ; dummy Fault handler
.word 0 ; we don’t care about the rest
The four instructions at the top of the file simply move two values into register r2 and r3, adding them together and branching back to the top of the code when finished. The reset handler is normally a fairly comprehensive block of code enabling various peripherals and features on a microcontroller. For our case, we just want the handler to jump to our code, so the reset handler is just a branch instruction. There are two dummy handlers that follow, one for an NMI (Non-Maskable Interrupt) and one for a fault. Again, normally these handlers contain the proper code that either cleans up the exception or helps in dealing with one. Our handlers do nothing except spin in an infinite loop, so mind any exceptions that occur in your code—at the moment, there is no way to recover if you do something that causes a Fault exception. In Chapter 15, we’ll see ways to build simple handlers to cover these exceptions.
The stack is configured next, with 1,024 bytes reserved for it. The label myStack will eventually be converted into an address that will get stored in the vector table. The section called “.intvecs” is our vector table, and you can see that the individual vectors contain addresses. In the process of creating an executable file, the ELF linker will try to remove any code that isn’t actually used, and since it sees the vector table as a set of constants that are not referenced anywhere else in the main code, it will remove them. We therefore add a .retain directive to instruct the linker to keep our vector table. The stack pointer is stored at address 0x0 in memory, and the first value is the address of myStack. The reset handler’s address is stored at address 0x4 in memory, and so on. Since we don’t need to worry about exceptions yet, we’ll only define enough of the vectors to get our code up and running.
A.2.3 Building the Project and Running Code
We’re nearly finished. There are a few additional tools issues to deal with before trying to build the project. If you open the linker command file (the file in the project that ends in .cmd), you’ll find an equation involving __STACK_TOP. Just comment that out for now. Additionally, we should tell the linker where to put our code, so add an entry under .init_array for the section called .myCode. Your linker command file should now look like this:
SECTIONS
{
.intvecs : > 0x00000000
.text : > FLASH
.const : > FLASH
.cinit : > FLASH
.pinit : > FLASH
.init_array : > FLASH
.myCode : > FLASH
.vtable : > 0x20000000
.data : > SRAM
.bss : > SRAM
.sysmem : > SRAM
.stack : > SRAM
}
// __STACK_TOP = __stack + 512;
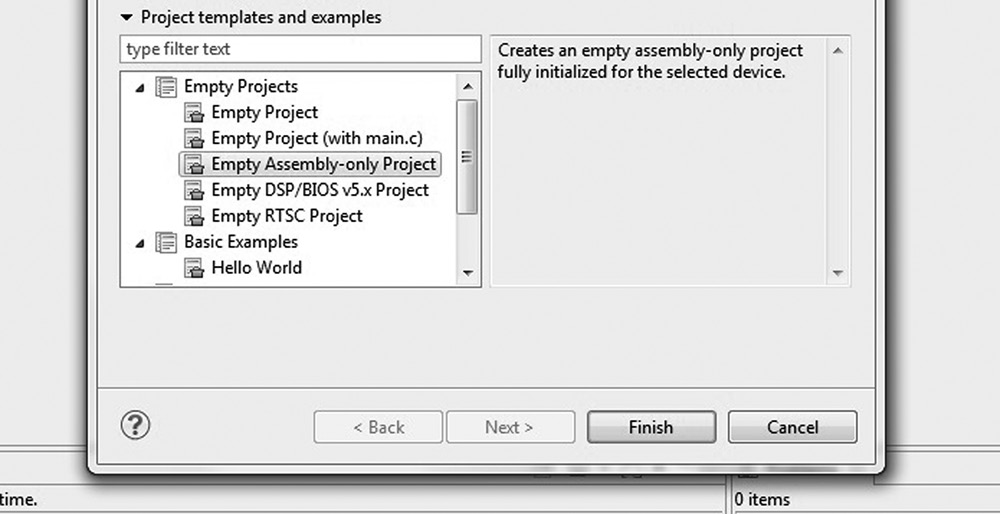
One last correction is needed. Right click on the project name in the Project Explorer pane, and then choose Properties. In the dialog box, click on the ARM Linker section under Build. You will see a subsection called File Search Path. Ensure that “libc.a” is not included in the File Search Path box on the right (see Figure A.3). If it is there, delete it using the delete button just above the line. If we were writing C code, this is an important library, but since we’re only making a small assembly file, this library isn’t necessary and the tools will generate a warning.
You can now build the project by either choosing Build Project from the Project menu or you can click on the hammer button in the toolbar.
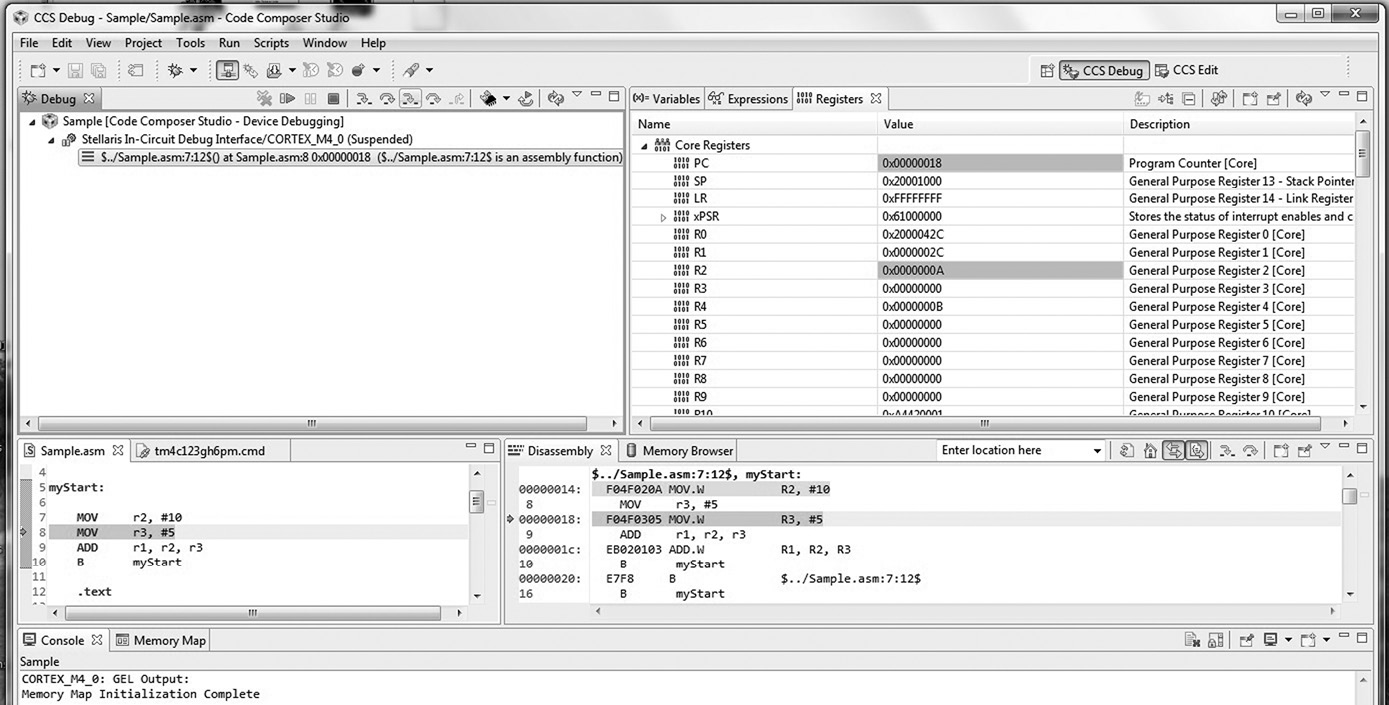
Launch the debugger by either choosing Debug from the Run menu or hitting the bug button on the toolbar. You should see the four panes shown in Figure A.4—your code is displayed in one pane, along with a disassembly of the code in another. You can open up the Core Registers display to show all of the internal registers when running your code. Use the Assembly Step Into button (the green buttons, which are labeled by mousing over the buttons) to single-step through your assembly code. Examine the contents of the registers for each instruction to ensure things are working well.
Once you’ve completed a simple example, go back and read the CCS User’s Guide, which is available in the Help menu. Many integrated development environments are similar, so if you have already used one from a different vendor, you may find this one very familiar.