Table of Contents for
The Rootkit Arsenal: Escape and Evasion in the Dark Corners of the System, 2nd Edition
 The Rootkit Arsenal: Escape and Evasion in the Dark Corners of the System, 2nd Edition
Published by
Jones & Bartlett Learning, 2012
The Rootkit Arsenal: Escape and Evasion in the Dark Corners of the System, 2nd Edition
Published by
Jones & Bartlett Learning, 2012
- Cover
- Title Page
- Copyright
- The Rootkit Arsenal: Escape and Evasion in the Dark Corners of the System
- Contents
- Preface
- Part I: Foundations
- Chapter 1 Empty Cup Mind
- Chapter 2 Overview of Anti-Forensics
- Chapter 3 Hardware Briefing
- Chapter 4 System Briefing
- Chapter 5 Tools of the Trade
- Chapter 6 Life in Kernel Space
- Part II: Postmortem
- Chapter 7 Defeating Disk Analysis
- Chapter 8 Defeating Executable Analysis
- Part III: Live Response
- Chapter 9 Defeating Live Response
- Chapter 10 Building Shellcode in C
- Chapter 11 Modifying Call Tables
- Chapter 12 Modifying Code
- Chapter 13 Modifying Kernel Objects
- Chapter 14 Covert Channels
- Chapter 15 Going Out-of-Band
- Part IV: Summation
- Chapter 16 The Tao of Rootkits
- Index
- Photo Credits
Chapter 4 System Briefing
In Chapter 2, we found that to engineer a rootkit, we must first decide:
 What part of the system we want the rootkit to interface with.
Where the code that manages this interface will reside.
We spent the previous chapter investigating the memory protection features offered by the IA-32 processor. In this chapter, we’ll see how Windows leverages these features to establish the boundary between user space and kernel space. This will give us the foundation we need to address these two issues.
As you’ll see, the mapping between Windows and Intel is not one to one. In other words, Microsoft doesn’t necessarily see Windows as being an Intel-based operating system (even though, for all intents and purposes, it is). Windows NT, the great grandfather of the current version of Windows, was first implemented to run on both the MIPS and Intel hardware platforms (and then ported shortly thereafter to run on Digital’s Alpha processor). Windows can support multiple hardware platforms by virtue of its multitiered design, which isolates chipset dependencies using a hardware abstraction layer (HAL). Thus, even though the market has crowned Intel as the king, and the competition has dwindled, Microsoft would prefer to keep its options open. In the minds of the core set of architects who walk the halls at Redmond, Windows transcends hardware. The multibillion dollar corporation named Intel is just another pesky chip vendor.
This mindset reflects the state of the market when NT was first introduced. Back then, most red-blooded geeks dreamt about a tricked out SGI Workstation running IRIX on 64-bit MIPS hardware (your author included). In the 1990s, the industry simply didn’t perceive the 80386 processor as a viable solution for enterprise-class servers. Relative to their RISC counterparts, Intel machines couldn’t handle heavy lifting. This left Intel as the purveyor of wannabe desktop systems. In the 1980s and early 1990s, the midrange was defined by UNIX variants, which ran on vendor-specific chipsets. The high end was owned (and still is owned) by the likes of IBM and their mainframe lines. Microsoft desperately wanted a foothold in this market, and the only way to do so was to demonstrate to corporate buyers that their OS ran on “grown-up” hardware.
ASIDE
To give you an idea of just how pervasive this mindset is, there’ve been instances where engineers from Intel found ways to increase substantially the performance of Microsoft applications, and the developers at Microsoft turned around and snubbed them. In Tim Jackson’s book, Inside Intel, the author describes how the Intel engineers approached the application guys at Microsoft with an improvement that would allow Excel to run eight times faster. The response that Intel received: “People buy our applications because of the new features.”
Then again, as a developer, there are valid reasons for distancing yourself from the hardware that your code is running on. Portability is a long-term strategic asset. In the software industry, dependency can be hazardous. If your hardware vendor, for whatever reason, takes a nosedive, you can rest assured that you’ll be next in line. Furthermore, hardware vendors (just like software vendors) can become pretentious and cop an attitude if they realize that they’re the only game in town. To protect itself, a software company has to be prepared to switch platforms, and this requires the product’s architecture to accommodate change.
Note: Throughout this chapter, I make frequent use of the Windows kernel debugger to illustrate concepts. If you’re not already familiar with this tool, please skip ahead to the next chapter and read through the pertinent material.
4.1 Physical Memory under Windows
To see the amount of physical memory installed on your machine’s motherboard, open a command prompt and issue the following statement:

If you’re so inclined, you can also crank up an instance of the Task Manager and select the Performance tab for a more visually appealing summary (Figure 4.1).
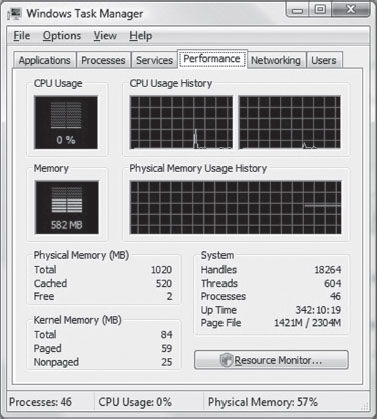
Figure 4.1
If you’re running a kernel debugging session, yet another way to determine the amount of physical memory available is through the !memusage extension command:

The number that we’re interested in is within the parentheses on the TOTAL line (e.g., 1,045,504 KB, or 1,021 MB). You can verify these results by rebooting your machine and observing the amount of RAM recognized by the BIOS setup program (the final authority on what is, and is not, installed in your rig).
Land of the Lost (Memory)
One thing that the previous examples fail to mention is that not all of the physical memory that’s reported is usable. This is because Windows also reserves space for device memory. You can see this by running the msinfo32 command and selecting the System Summary root node. On a system with 4 GB of physical memory, you might see something like:
Total Physical Memory: 4.00 GB
Available Physical Memory:3.50 GB
Ah ha! You can take a closer look at these reserved regions using msinfo32 by selecting the Memory child-node underneath the Hardware Resources node (Figure 4.2).
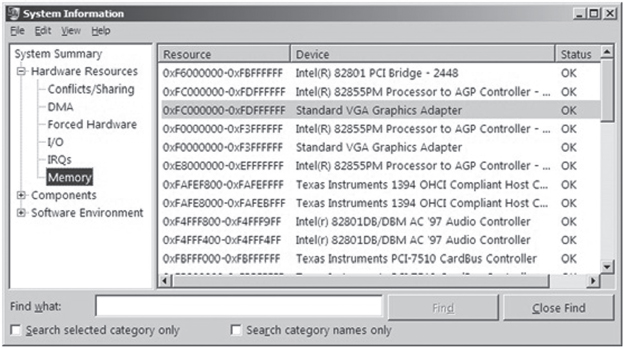
Figure 4.2
How Windows Uses Physical Address Extension
The amount of physical memory that can be accessed by Windows depends upon the version of Windows, the underlying hardware platform, and sometimes on how Windows is configured (see Table 4.1).1
Table 4.1 Memory Limits
| Operating System | 32-Bit Edition | 64-Bit Edition |
| Windows 7 Enterprise | 4 GB | 192 GB |
| Windows Server 2008 R2 Enterprise | Not available | 2 TB |
Physical address extension (PAE), as discussed in the previous chapter, is an extension to the system-level bookkeeping that allows a machine (via the paging mechanism) to increase the number of address lines that it can access from 32 to MAXPHYADDR. Windows 7 running on IA-32 hardware can only access at most 4 GB of memory, so activating PAE doesn’t necessarily buy us any additional memory. 64-bit operating systems have no use for PAE for the obvious reason that they normally use more than 32 bits to refer to an address.
ASIDE
Wait a minute! Why use PAE? In the case of Windows 7 it doesn’t seem to be offering a tangible benefit! As it turns out, PAE on 32-bit systems is required to support other features like data execution protection (which we’ll meet later on).
On contemporary systems, PAE can be enabled and disabled for the current operating system via the following BCDEdit.exe commands:

To see if your version of Windows supports PAE, check out which version of the kernel file exists in %SystemRoot%\System32 (see Table 4.2).
Table 4.2 Kernel Files
| PAE | Kernel File on Live System | Kernel File on Install DVD |
| Supported | Ntkrnlpa.exe | Ntkrpamp.exe |
| Not supported | Ntoskrnl.exe | Ntkrnlmp.exe |
Throughout this book, I will sometimes refer to the Windows executive (which implements both the kernel and the system call interface) as ntoskrnl. exe. This is just an arbitrary convention, so keep in mind that there are actually two versions for 32-bit systems.
The catch is that this only indicates if your system can support PAE, it doesn’t tell you if PAE support has been enabled. One way to determine if PAE has been enabled is to peek in the registry and hunt for the following key:
HKLM\System\CurrentControlSet\Control\Session Manager\Memory Management
Under this key, there will be a REG_DWORD value named PhysicalAddressExtension. If PAE has been enabled, this value will be set to 1.
Pages, Page Frames, and Page Frame Numbers
This point is important enough that I think it warrants repeating. The terms page, page frame, and page frame number are easy to get confused. A page is a contiguous region in a linear address space. In the context of the IA-32 processor, a page can be 4 KB, 2 MB, or 4 MB in size (although it’s almost always 4 KB). There is no physical location associated with a page. A page can reside in memory or on disk.
A page frame is a specific location in physical memory where a page is stored when it resides in RAM. The physical address of this location can be represented by a page frame number (PFN). This begs the question: “What’s a PFN?”
In the case where pages are 4 KB is size and PAE is not enabled, the PFN is a 20-bit value (i.e., 0x12345). This 20-bit unsigned integer value represents a 32-bit physical address by assuming that the 12 least significant bits are zero (i.e., 0x12345 is treated like 0x12345000). In other words, pages are aligned on 4-KB boundaries, such that the address identified by a PFN is always a multiple of 4,096.
4.2 Segmentation and Paging under Windows
The boundary between the operating system and user applications in Windows relies heavily on hardware-based mechanisms. The IA-32 processor implements memory protection through both segmentation and paging. As we’ll see, Windows tends to rely more on paging than it does segmentation. The elaborate four-ring model realized through segment privilege parameters (i.e., our old friends CPL, RPL, and DPL) is eschewed in favor of a simpler two-ring model where executable code in Windows is either running at the supervisor level (i.e., in kernel mode) or at the user level (i.e., in user mode). This distinction is based on the U/S bit in the system’s PDEs and PTEs. Whoever thought that a single bit could be so important?
Segmentation
System-wide segments are defined in the GDT. The base linear address of the GDT (i.e., the address of the first byte of the GDT) and its size (in bytes) are stored in the GDTR register. Using the kernel debugger in the context of a two-machine host–target setup, we can view the contents of the target machine’s descriptor registers using the register debugger command with the 0x100 mask:

This command formats the contents of the GDTR register so that we don’t have to. The first two entries (gdtr and gdtl) are what we’re interested in. Note that the same task can be accomplished by specifying the GDTR components explicitly:
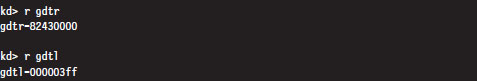
From the resulting output, we know that the GDT starts at address 0x82430000 and is 1,023 bytes (8,184 bits) in size. This means that the Windows GDT consists of approximately 127 segment descriptors, where each descriptor consumes 64 bits. This is a paltry amount when you consider that the GDT is capable of storing up to 8,192 descriptors (less than 2% of the possible descriptors are specified).
One way to view the contents of the GDT is simply to dump the contents of memory starting at 0x82430000.
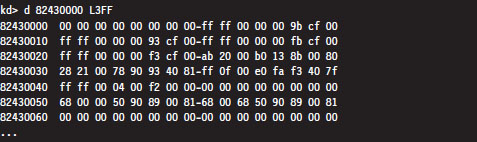
The problem with this approach is that now we’ll have to plow through all of this binary data and decode all of the fields by hand (hardly what I’d call an enjoyable way to spend a Saturday afternoon). A more efficient approach is to use the debugger’s dg command, which displays the segment descriptors corresponding to the segment selectors fed to the command.
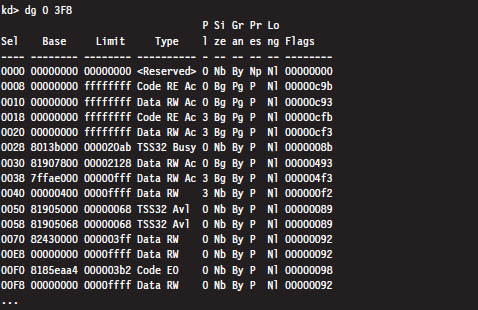
One thing you might notice in the previous output is that the privilege of each descriptor (specified by the fifth column) is set to either Ring 0 or Ring 3. In this list of descriptors, there are four that are particularly interesting:
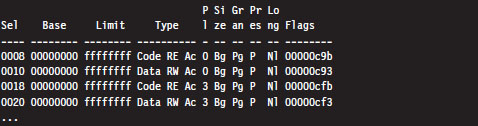
As you can see, these descriptors define code and data segments that all span the entire linear address space. Their base address starts at 0x00000000 and stops at 0xFFFFFFFF. Both Ring 0 (operating system) and Ring 3 (user application) segments occupy the same region. In essence, there is no segmentation because all of these segment descriptors point to the same segment.
This is exactly a scenario described in the chapter on IA-32 (Chapter 3) where we saw how a minimal segmentation scheme (one that used only Ring 0 and Ring 3) allowed protection to be implemented through paging. Once again, we see that Windows isn’t using all the bells and whistles afforded to it by the Intel hardware.
Paging
In Windows, each process is assigned its own dedicated CR3 control register value. Recall that this register stores the 20-bit PFN of a page directory. Hence, each process has its own page directory. The associated CR3 value is stored in the DirectoryTableBase field of the process’s KPROCESS structure, which is itself a substructure of the process’s EPROCESS structure. If this sentence just flew over your head, don’t worry. For the time being, just accept the fact that Windows has internal accounting structures that store the values that we plug into CR3. When the Windows kernel performs a task switch, it loads CR3 with the value belonging to the process that has been selected to run.
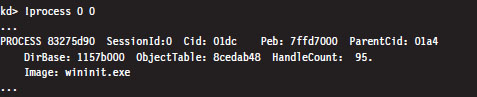
The following kernel-mode debugger extension command provides us with the list of every active process.
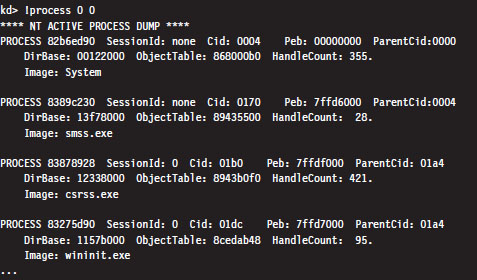
The !process command displays information about one or more processes. The first argument is typically either a process ID or the hexadecimal address of the EPROCESS block assigned to the process. If the first argument is zero, as in the case above, then information on all active processes is generated. The second argument specifies a 4-bit value that indicates how much information should be given (where 0x0 provides the least amount of detail and 0xF provides the most details).
The field named DirBase represents the physical address to be stored in the CR3 register (e.g., DirBase ≈ L Page Directory physical base address). Other items of immediate interest are the PROCESS field, which is followed by the linear address of the corresponding EPROCESS structure, and the Cid field, which specifies the Process ID (PID). Some kernel debugger commands take these values as arguments, and if you don’t happen to know what they are … the !process command is one way to get them.
During a live debugging session (i.e., you have a host machine monitoring a target machine via a kernel debugger), you can manually set the current process context using the .process meta-command followed by the address of the corresponding EPROCESS structure.

The !pte kernel-mode debugger extension command is a very useful tool for viewing both the PDE and PTE associated with a particular linear address. This command accepts a linear address as an argument and prints out a four-line summary:
This output contains everything we need to intuit how Windows implements memory protection through the paging facilities provided by the IA-32 processor. Let’s step through this in slow motion (e.g., one line at a time).

The first line merely restates the linear address fed to the command. Microsoft documentation usually refers to a linear address as a virtual address (VA). Note how the command pads the values with zeroes to reinforce the fact that we’re dealing with a 32-bit value.

The second line displays both the linear address of the PDE and the linear address of the PTE used to resolve the originally specified linear address. Although the address resolution process performed by the processor formally uses physical base addresses, these values are here in linear form so that we know where these structures reside from the perspective of the program’s linear address space.

The third line specifies the contents of the PDE and PTE in hex format. PDEs and PTEs are just binary structures that are 4 bytes in length (assuming a 32-bit physical address space where PAE has not been enabled).

The fourth line decomposes these hexadecimal values into their constituent parts: a physical base address and a status flag. Note that the base physical addresses stored in the PDE and PTE are displayed in the 20-bit page frame format, where least-significant 12 bits are not shown and assumed to be zero. Table 4.3 describes what these flag codes signify.
Table 4.3 PDE/PTE Flags
| Bit | Bit Set | Bit Clear | Meaning |
| 0 | V | — | Page/page table is valid (present in memory) |
| 1 | W | R | Page/page table writable (as opposed to being read-only) |
| 2 | U | K | Owner is user/kernel |
| 3 | T | — | Write-through caching is enabled for this page/page table |
| 4 | N | — | Page/page table caching is disabled |
| 5 | A | — | Page/page table has been accessed (read from, written to) |
| 6 | D | — | Page is dirty (has been written to) |
| 7 | L | — | Page is larger than 4 KB |
| 8 | G | — | Indicates a global page (related to TLBs*) |
| 9 | C | — | Copy on write has been enabled |
| E | — | The page being referenced contains executable code | |
| *TLBs = translation look-alike buffers | |||
As a useful exercise, let’s take an arbitrary set of linear addresses, ranging from 0x00000000 to 0xFFFFFFFF, and run the !pte command on them to see what conclusions we can make from investigating the contents of their PDEs and PTEs.
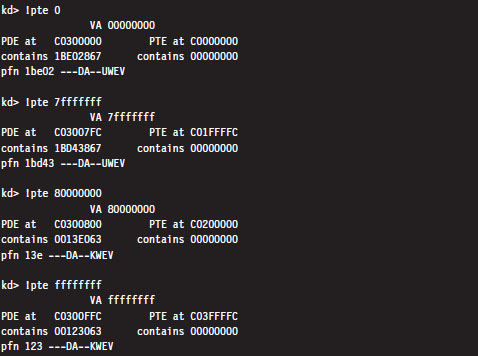
Even though the PTEs haven’t been populated for this particular process, there are several things we can glean from the previous output:
Page directories are loaded starting at linear address 0xC0300000.
Page tables are loaded starting at linear address 0xC0000000.
User-level pages end at linear address 0x80000000.
There is one caveat to be aware of: Above, we’re working on a machine that is using a 32-bit physical address space. For a machine that is running with PAE enabled, the base address of the page directory is mapped by the memory manager to linear address 0xC0600000.
By looking at the flag settings in the PDE entries, we can see a sudden shift in the U/S flag as we make the move from linear address 0x7FFFFFFF to 0x80000000. This is a mythical creature we’ve been chasing for the past couple of chapters. This is how Windows implements a two-ring memory protection scheme. The boundary separating us from the inner chambers is nothing more than a 1-bit flag in a collection of operating system tables.
Note: The page directory and page tables belonging to a process reside above the 0x8000000 divider that marks the beginning of supervisor-level code. This is done intentionally so that a process cannot modify its own address space.
Linear to Physical Address Translation
The best way to gain an intuitive grasp for how paging works on Windows is to trace through the process of mapping a linear address to a physical address. There are several different ways to do this. We’ll start with the most involved approach and then introduce more direct ways afterward. For illustrative purposes, we’ll assume that PAE has been enabled.
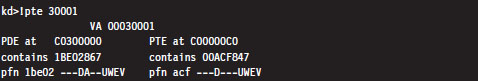
Consider the linear address 0x00030001. Using the .formats debugger meta-command, we can decompose this linear address into the three components used to resolve a physical address when paging has been enabled.
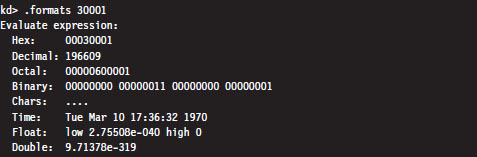
According to the PAE paging conventions of the IA-32 processor, the index into the page directory pointer table is the highest-order 2 bits (i.e., 00B), the index into the corresponding page directory is the next 9 bits (i.e., 000000000B), the index into the corresponding page table is the next 9 bits (i.e., 000110000B, or 0x30), and the offset into physical memory is the lowest-order 12 bits (i.e., 000000000001B).
We’ll begin by computing the linear address of the corresponding PTE. We know that page tables are loaded by the Windows memory manager into linear address space starting at address 0xC0000000. We also know that each PDE points to a page table that is 4 KB in size (i.e., 29 possible 8-byte entries). Given that each PTE is 64 bits in the case of PAE, we can calculate the linear address of the PTE as follows:
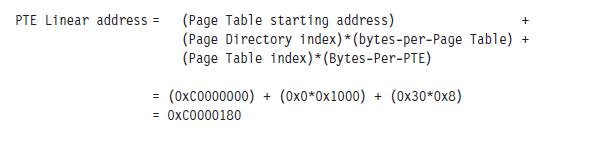
Next, we can dump the contents of the PTE:

The highest-order 20 bits (0x1a812) is the PFN of the corresponding page in memory. This allows us to compute the physical address corresponding to the original linear address.
Physical address = 0x1a812000 + 0x1 = 0x1a812001
A Quicker Approach
We can do the same thing with less effort using the !pte command:
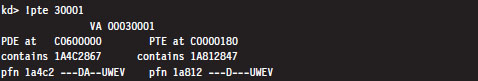
This instantly gives us the PFN of the corresponding page in physical memory (0x1a812). We can then add the offset specified by the lowest-order 12 bits in the linear address, which is just the last three hex digits (0x1), to arrive at the physical address (0x1a812001).
Comments on EPROCESS and KPROCESS
Each process in Windows is represented internally by a binary structure known as an executive process block (usually referred to as the EPROCESS block). This elaborate, heavily nested, mother of all structures contains pointers to other salient substructures like the kernel process block (KPROCESS block) and the process environment block (PEB).
As stated earlier, the KPROCESS block contains the base physical address of the page directory assigned to the process (the value to be placed in CR3), in addition to other information used by the kernel to perform scheduling at runtime.
The PEB contains information about the memory image of a process (e.g., its base linear address, the DLLs that it loads, the image’s version, etc.).
The EPROCESS and KPROCESS blocks can only be accessed by the operating system, whereas the PEB can be accessed by the process that it describes.
To view the constituents of these objects, use the following kernel debugger commands:
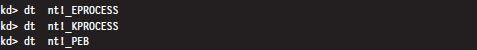
If you’d like to see the actual literal values that populate one of these blocks for a process, you can issue the same command followed by the linear address of the block structure.

As stated earlier, the !process 0 0 extension command will provide you with the address of each EPROCESS block (in the PROCESS field).
If you look closely, you’ll see that the listing produced also contains a Peb field that specifies the linear address of the PEB. This will allow you to see what’s in a given PEB structure.

If you’d rather view a human-readable summary of the PEB, you can issue the !peb kernel-mode debugger extension command followed by the linear address of the PEB.

If you read through a dump of the EPROCESS structure, you’ll see that the KPROCESS substructure just happens to be the first element of the EPROCESS block. Thus, its linear address is the same as the linear address of the EPROCESS block.

An alternative approach to dumping KPROCESS and PEB structures explicitly is to use the recursive switch (-r) to view the values that populate all of the substructures nested underneath an EPROCESS block.

4.3 User Space and Kernel Space
Microsoft refers to Intel’s linear address space as a virtual address space. This reflects the fact that Windows uses disk space to simulate physical memory, such that the 4-GB linear address doesn’t all map to physical memory.
Recall that in Windows, each process has its own value for the CR3 control register and thus its own virtual address space. As we saw in the last section, the mechanics of paging divide virtual memory into two parts:
User space (linear addresses 0x00000000 - 0x7FFFFFFF).
Kernel space (linear addresses 0x80000000 - 0xFFFFFFFF).
By default, user space gets the lower half of the address range, and kernel space gets the upper half. The 4-GB linear address space gets divided into 2-GB halves. Thus, the idea of submerging your code down into the kernel is somewhat of a misnomer.
4-Gigabyte Tuning (4GT)
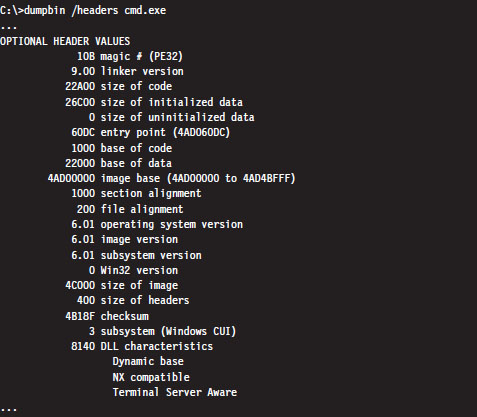
This allocation scheme isn’t required to be an even 50–50 split; it’s just the default setup. Using the BCDedit.exe command, the position of the dividing line can be altered to give the user space 3 GB of memory (at the expense of kernel space).

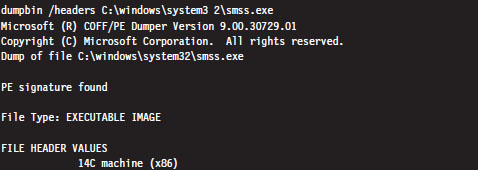
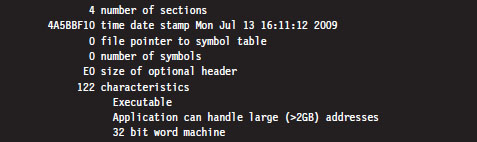
To allow an application to use this extra space, a special flag has to be set in the header section of the application’s binary (i.e., IMAGE_FILE_LARGE_ADDRESS_AWARE). This flag is normally set by the linker when the application is built. For example, the Visual Studio C++ linker has a /LARGEADDRESSAWARE switch to this end. You can use the dumpbin.exe utility that ships with the platform software development kit (SDK) to see if this flag has been enabled.
Note: Addresses in the vicinity of the 2-GB boundary are normally consumed by system DLLs. Therefore, a 32-bit process cannot allocate more than 2 GB of contiguous memory, even if the entire 4-GB address space is available.
To Each His Own
Though the range of linear addresses is the same for each process (0x00000000 - 0x7FFFFFFF), the bookkeeping conventions implemented by IA-32 hardware and Windows guarantee that the physical addresses mapped to this range are different for each process. In other words, even though two programs might access the same linear address, each program will end up accessing a different physical address. Each process has its own private user space.
This is why the !vtop kernel debugger command requires you to provide the physical base address of a page directory (in PFN format). For example, I could take the linear address 0x00020001 and, using two different page directories (one residing at physical address 0x06e83000 and the other residing at physical address 0x014b6000), come up with two different results.
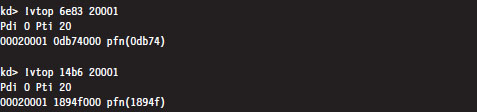
In the previous output, the first command indicates that the linear address 0x00020001 resolves to a byte located in physical memory in a page whose PFN is 0x0db74. The second command indicates that this same linear address resolves to a byte located in physical memory in a page whose PFN is 0x1894f.
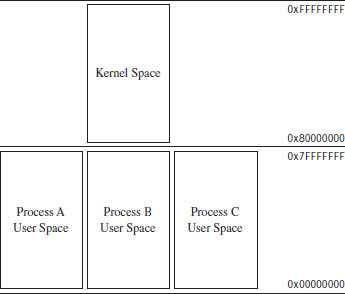
Figure 4.3
Another thing to keep in mind is that even though each process has its own private user space, they all share the same kernel space (see Figure 4.3). This is a necessity, seeing as how there can be only one operating system. This is implemented by mapping each program’s supervisor-level PDEs to the same set of system page tables (see Figure 4.4).
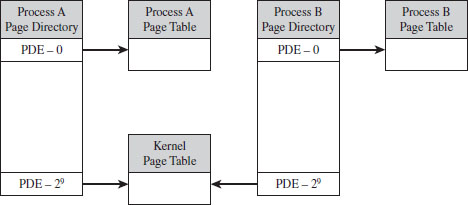
Figure 4.4
Jumping the Fence
Caveat emptor: The notion that code in user space and code in kernel space execute independently in their little confined regions of memory is somewhat incorrect. Sure, the kernel’s address space is protected, such that an application thread has to pass through the system call gate to access kernel space, but a thread may start executing in user space then jump to kernel space, via the SYSENTER instruction (or INT 0x2E), and then transition back to user mode. It’s the same execution path for the entire trip; it has simply acquired entry rights to the kernel space by executing special system-level machine instructions. A more realistic way to view the execution context of a machine is to envision a set of threads soaring through memory, making frequent transitions between user space and kernel space (see Figure 4.5).
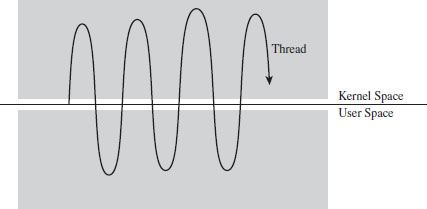
Figure 4.5
By the way, these special instructions (e.g., SYSENTER, INT 0x2E) and the system-level registers and data structures that they use to function are normally set up by the kernel during system startup. This prevents a user application from arbitrarily jumping into kernel space and executing privileged code on a whim. As in any household, it’s always a good idea for the adults to establish the rules that the children must follow (otherwise, everyone would have desert first at dinner and no one would eat their vegetables).
User-Space Topography
One way to get an idea of how components are arranged in user space is to use the !peb kernel debugger extension command. We start by using the !process extension command to find the linear address of the corresponding EPROCESS structure, then invoke the .process meta-command to set the current process context. Finally, we issue the !peb command to examine the PEB for that process.
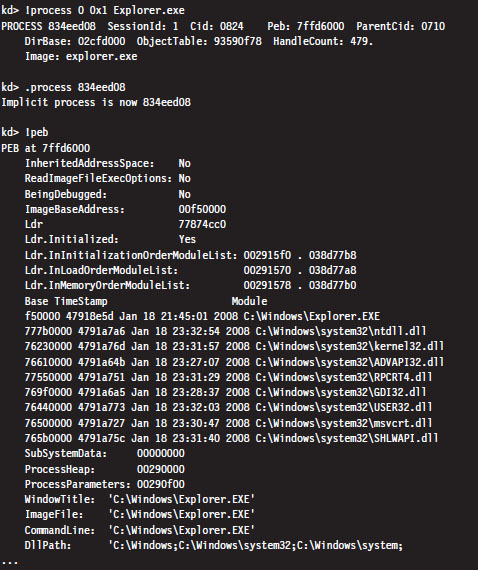
From this output, we can see the linear address that the program (Explorer. exe) is loaded at and where the DLLs that it uses are located. As should be expected, all of these components reside within the bounds of user space (e.g., 0x00000000 - 0x7FFFFFFF).
Another way to see where things reside in the user space of an application is with the Vmmap tool from Sysinternals. This will provide an exhaustive (and I do mean exhaustive) summary that uses color coding to help distinguish different components.
Kernel-Space Dynamic Allocation
In older versions of Windows (e.g., XP, Windows Server 2003), the size and location of critical system resources were often fixed. Operating system components like the system PTEs, the memory image of the kernel, and the system cache were statically allocated and anchored to certain linear addresses. With the release of Windows Vista and Windows Server 2008, the kernel can dynamically allocate and rearrange its internal structure to accommodate changing demands. What this means for a rootkit designer, like you, is that you should try to avoid hard-coding addresses if you can help it because you never know when the kernel might decide to do a little interior redecoration.
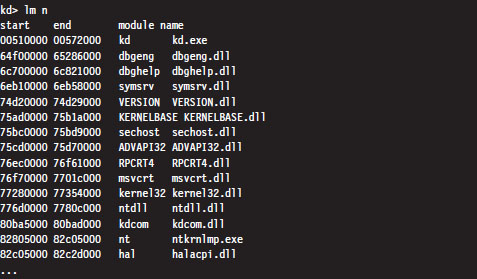
Nevertheless, that doesn’t mean you can’t get a snapshot of where things currently reside. For a useful illustration, you can dump a list of all of the loaded kernel modules as follows:
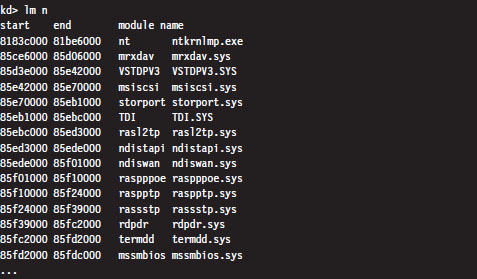
For the sake of brevity, I truncated the output that this command produced. The lm n command lists the start address and end address of each module in the kernel’s linear address space. As you can see, all of the modules reside within kernel space (0x80000000 - 0xFFFFFFFF).
Note: A module is the memory image of a binary file containing executable code. A module can refer to an instance of an .EXE, a .DLL, or a .SYS file.
Address Windowing Extension
Though 4GT allows us to allocate up to 3 GB for the user space of a process, sometimes it’s still not enough. For these cases, we can fall back on address windowing extension (AWE). AWE allows a 32-bit user application to access up to 64 GB of physical memory. This feature is based on an API, declared in winbase.h, which allows a program using the API to access an amount of physical memory that is greater than the limit placed on it by its linear address space (see Table 4.4).
Table 4.4 AWE API Routines
| API Function | Description |
| VirtualAlloc() | Reserves a region in the linear address space of the calling process |
| VirtualAllocEx() | Reserves a region in the linear address space of the calling process |
| AllocateUserPhysicalPages() | Allocate pages of physical memory to be mapped to linear memory |
| MapUserPhysicalPages() | Map allocated pages of physical memory to linear memory |
| MapUserPhysicalPagesScatter() | Like MapUserPhysicalPages() but with more bells and whistles |
| FreeUserPhysicalPages() | Release physical memory allocated for use by AWE |
AWE is called such because it uses a tactic known as windowing, where a set of fixed-size regions (i.e., windows) in an application’s linear address space is allocated and then mapped to a larger set of fixed-size windows in physical memory. Memory allocated through AWE is never paged.
Even though AWE is strictly a Microsoft invention, there is some cross-correlation, so to speak, with IA-32. AWE can be used without PAE. However, if an application using the AWE API is to access physical memory above the 4-GB limit, PAE will need to be enabled. In addition, the user launching an application that invokes AWE routines will need to have the “Lock Pages in Memory” privilege.
PAE Versus 4GT Versus AWE
PAE is a feature of Intel hardware that allows a 32-bit processor to work with a physical address space that exceeds 4 GB. Operating systems like Windows 7 don’t really use PAE for very much other than facilitating DEP.
4GT is a Windows-specific feature. It re-slices the 4-GB pie called the linear address space so that user applications get a bigger piece. 4GT doesn’t require PAE to be enabled. If a user application wants more real estate than 3 GB, it will need to leverage AWE. When an application using AWE needs to allocate more than 4 GB of physical memory, PAE will also need to be enabled.
4.4 User Mode and Kernel Mode
In the previous section, we saw how the linear address space of each process is broken into user space and kernel space. User space is like the kid’s table at a dinner party. Everyone is given plastic silverware. User space contains code that executes in a restricted fashion known as user mode. Code running in user mode can’t access anything in kernel space, directly communicate with hardware, or invoke privileged machine instructions.
Kernel space is used to store the operating system and its device drivers. Code in kernel space executes in a privileged manner known as kernel mode, where it can do everything that user-mode code cannot. Instructions running in kernel mode basically have free reign over the machine.
How Versus Where
User mode and kernel mode define the manner in which an application’s instructions are allowed to execute. In so many words, “mode” decides how code runs and “space” indicates location. Furthermore, the two concepts are related by a one-to-one mapping. Code located in user space executes in user mode. Code located in kernel space executes in kernel mode.
Note: This mapping is not necessarily absolute. It’s just how things are set up to work under normal circumstances. As we’ll see later on in the book, research has demonstrated that it’s possible to manipulate the GDT so that code in user space is able to execute with Ring 0 privileges, effectively allowing a user-space application to execute with kernel-mode superpowers.
In this section, we’ll discuss a subset of core operating system components, identify where they reside in memory, and examine the roles that they play during a system call invocation. A visual summary of the discussion that follows is provided by Figure 4.6. Take a few moments to digest this illustration and keep it in mind while you read about the different user-mode and kernel-mode elements.
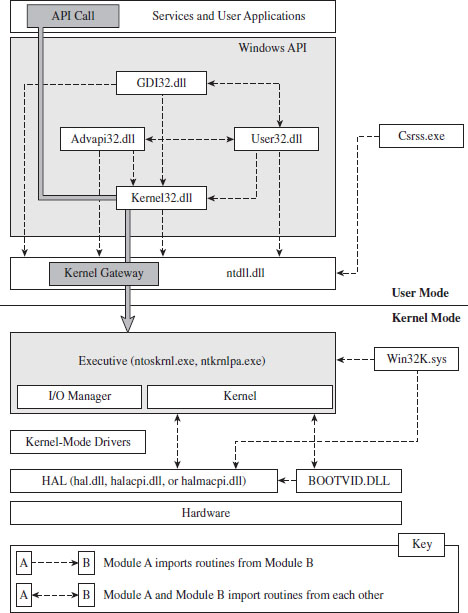
Figure 4.6
Kernel-Mode Components
Just above the hardware is the Windows hardware abstraction layer (HAL). The HAL is intended to help insulate the operating system from the hardware it’s running on by wrapping machine-specific details (e.g., managing interrupt controllers) with an API that’s implemented by the HAL DLL. Kernel-mode device drivers that are “well-behaved” will invoke HAL routines rather than interface to hardware directly, presumably to help make them more portable.
The actual DLL file that represents the HAL will vary depending upon the hardware that Windows is running on. For instance, the HAL that 64-bit machines use is deployed as a file named hal.dll. For 32-bit computers that provide an advanced configuration and power interface (ACPI), the HAL is implemented by a file named halacpi.dll. 32-bit ACPI machines that have multiple processors use a HAL implemented by a file named halmacpi.dll. Because we’re targeting desktop machines, the HAL will generally be realized as some file named hal*.dll located in the %windir%\system32 folder. You can use the lm kernel debugger command to see specifically which HAL version is being used:
Down at the very bottom, sitting next to the HAL is the BOOTVID.DLL file, which offers very primitive VGA graphics support during the boot phase. This driver’s level of activity can be toggled using the BCDEdit.exe quietboot option.
The core of the Windows operating system resides in nt*.exe binary. This executable implements its functionality in two layers: the executive and the kernel. This may seem a bit strange, seeing as how most operating systems use the term “kernel” to refer to these two layers in aggregate. In fact, I’ve even used this convention.
The executive implements the system call interface (which we will formally meet in the next section) and the major OS components (e.g., I/O manager, memory manager, process and thread manager). Kernel-mode device drivers will typically be layered between the HAL and the executive’s I/O manager.
The kernel implements low-level routines (e.g., related to synchronization, thread scheduling, and interrupt servicing) that the executive builds upon to provide higher-level services. As with the HAL, there are different binaries that implement the executive/kernel depending upon the features that are enabled (see Table 4.2). Notice how the output of the previous kernel debugger command displays the name of the executive/kernel binary as it exists on the install DVD (i.e., ntkrnlmp.exe). This is a result of the debugger using symbol information to resolve the name of modules.
Note: Both versions of the executive binary (e.g., Ntkrnlpa.exe and Ntoskrnl.exe) start with the “nt” prefix. Anyone who was in the industry in the early 1990s knows that this is a reference to Windows NT, the brainchild of Dave Cutler and great grandfather of Windows 7. If you look closely at the internals of Windows and meander in forgotten corners, you’ll see homage to the venerable NT: in file names, system calls, error messages, and header file contents.
The win32k.sys file is another major player in kernel space. This kernel-mode driver implements both USER and graphics device interface (GDI) services. User applications invoke USER routines to create GUI controls. The GDI is used for rendering graphics for display on output devices. Unlike other operating systems, Windows pushes most of its GUI code to the kernel for speed.
One way to see how these kernel-mode components are related is to use the dumpbin.exe tool that ships with the Windows SDK. Using dumpbin.exe, you can see the routines that one component imports from the others (see Table 4.5).

Table 4.5 Kernel Module Imports
| Component | Imports |
| hal*.dll | Nt*.exe, kdcom.dll, pshed.dll |
| BOOTVID.DLL | Nt*.exe, hal*.dll |
| Nt*.exe | hal*.dll, pshed.dll, bootvid.dll, kdcom.dll, clfs.sys, ci.dll |
| Win32k.sys | Nt*.exe, msrpc.sys, watchdog.sys, hal.dll, dxapi.sys |
Using dumpbin.exe, you can glean what sort of services a given binary offers its kernel-mode brethren. For the sake of keeping Figure 4.6 relatively simple, I displayed only a limited subset of the Windows API DLLs. This explains why you’ll see files referenced in Table 4.5 that you won’t see in Figure 4.6.
Note: For our purposes, most of the interesting stuff goes on in the executive, and this will be the kernel-mode component that we set our sights on. The remaining characters in kernel mode are really just supporting actors in the grand scheme of things.
User-Mode Components
An environmental subsystem is a set of binaries running in user mode that allow applications, written to utilize a particular environment/API, to run. Using the subsystem paradigm, a program built to run under another operating system (like OS/2) can be executed on a subsystem without significant alteration.
Understanding the motivation behind this idea will require a trip down memory lane. When Windows NT 4.0 was released in 1996, it supported five different environmental subsystems: the Win32 Subsystem, the Windows on Windows (WOW) Subsystem, the NT Virtual DOS Machine (NTVDM) Subsystem, the OS/2 Subsystem, and the POSIX Subsystem. At the time, you see, the market had a lot more players, and competition was still very real. By providing a variety of environments, Microsoft was hoping to lure users over to the NT camp.
The Win32 Subsystem supported applications conforming to the Win32 API, which was an interface used by applications that targeted Windows 95 and Windows NT. The WOW Subsystem provided an environment for older 16-bit Windows applications that were originally designed to run on Windows 3.1. The NTVDM Subsystem offered a command-line environment for legacy DOS applications. The OS/2 Subsystem supported applications written to run on IBM’s OS/2 operating system. The POSIX Subsystem was an attempt to silence those damn UNIX developers who, no doubt, saw NT as a clunky upstart. So there you have it; a grand total of five different subsystems:
Win32 (what Microsoft wanted people to use)
WOW (supported legacy Windows 3.1 apps)
NTVDM (supported even older MS-DOS apps)
OS/2 (an attempt to appeal to the IBM crowd)
POSIX (an attempt to appeal to the Unix crowd).
As the years progressed, the OS/2 and POSIX subsystems were dropped, reflecting the market’s demand for these platforms. As a replacement for the POSIX environment, Windows XP and Windows Server 2003 offered a subsystem known as Windows Services for UNIX (SFU). With the release of Vista, this is now known as the Subsystem for UNIX-based Applications (SUA). Windows 7 and Windows Server 2008 also support SUA. In your author’s opinion, SUA is probably a token gesture on Microsoft’s part. With more than 90 percent of the desktop market, and a growing share of the server market, catering to other application environments isn’t much of a concern anymore. It’s a Windows world now.
The primary environmental subsystem in Windows 7 and Windows Server 2008 is the Windows Subsystem. It’s a direct descendent of the Win32 Subsystem. Those clever marketing folks at Microsoft wisely decided to drop the “32” suffix when 64-bit versions of XP and Windows Server 2003 were released.
The Windows Subsystem consists of three basic components:
User-mode Client–Server Runtime SubSystem (Csrss.exe).
Kernel-mode device driver (Win32k.sys).
User-mode DLLs that implement the subsystem’s API.
The Client–Server Runtime Subsystem plays a role in the management of user-mode processes and threads. It also supports command-line interface functionality. It’s one of those executables that’s a permanent resident of user space. Whenever you examine running processes with the Windows Task Manager, you’re bound to see at least one instance of Csrss.exe.
The interface that the Windows subsystem exposes to user applications (i.e., the Windows API) looks a lot like the Win32 API and is implemented as a collection of DLLs (e.g., kernel32.dll, Advapi32.dll, User32.dll, Gdi.dll, shell32.dll, rpcrt4.dll, etc.). If a Windows API cannot be implemented entirely in user space and needs to access services provided by the executive, it will invoke code in the ntdll.dll library to re-route program control to code in the executive. In the next section, we’ll spell out the gory details of this whole process.
As in kernel mode, we can get an idea of how these user-mode components are related using the dumpbin.exe tool (see Table 4.6). For the sake of keeping Figure 4.6 relatively simple, I displayed only a limited subset of the Windows API DLLs. So you’ll see files referenced in Table 4.6 that you won’t see in Figure 4.6.
Table 4.6 User-Mode Imports
| Component | Imports |
| Advapi32.dll | msvcrt.dll, ntdll.dll, kernelbase.dll, api*.dll, kernel32.dll, rpcrt4.dll, cryptsp. dll, wintrust.dll, sspicli.dll, user32.dll, bcrypt.dll, pcwum.dll |
| User32.dll | ntdll.dll, gdi32.dll, kernel32.dll, advapi32.dll, cfgmgr32.dll, msimg32.dll, powrprof.dll, winsta.dll |
| GDI32.dll | ntdll.dll, api*.dll, kernel32.dll, user32.dll, lpk.dll |
| Csrss.exe | Nt*.exe, csrsrv.dll |
| Kernel32.dll | ntdll.dll, kernelbase.dll, api*.dll |
| Ntdll.dll | None |
One last thing that might be confusing: In Figure 4.6, you might notice the presence of user-mode “Services,” in the box located at the top of the diagram. From the previous discussion, you might have the impression that the operating system running in kernel mode is the only entity that should be offering services. This confusion is a matter of semantics more than anything else.
A user-mode service is really just a user-mode application that runs in the background, requiring little or no user interaction. As such, it is launched and managed through another user-mode program called the Service Control Manager (SCM), which is implemented by the services.exe file located in the %systemroot%\system32 directory. To facilitate management through the SCM, a user-mode service must conform to an API whose functions are declared in the Winsvc.h header file. We’ll run into the SCM again when we look at kernel-mode drivers.
4.5 Other Memory Protection Features
Aside from running applications in user mode, a result of the two-ring model that’s enabled by the U/S flag in PDEs and PTEs, there are other features that Windows implements to protect the integrity of a program’s address space.
Data execution prevention (DEP).
Address space layout randomization (ASLR).
/GS compiler option.
/SAFESEH linker option.
Data Execution Prevention
Data execution prevention (DEP) allows pages of memory to be designated as nonexecutable. This means that a page belonging to a stack, data segment, or heap can be safeguarded against exploits that try to sneak executable code into places where it should not be. If an application tries to execute code from a page that is marked as nonexecutable, it receives an exception with the status code STATUS_ACCESS_VIOLATION (e.g., 0xC0000005). If the exception isn’t handled by the application, it’s terminated.
DEP comes in two flavors:
Software-enforced.
Hardware-enforced.
Software-enforced DEP was a weaker implementation that Microsoft deployed years ago in lieu of hardware support. Now that most contemporary 32-bit systems have a processor that provides the requisite hardware-level support, we’ll focus on hardware-enforced DEP.
Hardware-enforced DEP requires the NXE flag of the IA32_EFER machine-specific register be set to 1. If this is the case, and if PAE has been enabled, the 64th bit of the PDEs and PTEs transforms into a special flag known as the XD flag (as in execute disable). If IA32_EFER = 1 and XD = 1, then instruction fetches from the page being referenced are not allowed.
Note: Hardware-enforced DEP can only function if PAE has also been enabled. The good news is that Windows will typically enable PAE automatically when hardware-enforced DEP is activated. You can verify this with the BCDedit.exe tool.
DEP is configured at boot time per the nx policy setting in the boot configuration data. You can view the current policy via the following command:

There are four system-wide policies that Windows can adhere to (see Table 4.7).
Table 4.7 DEP Policies
| Policy | Description |
| OptIn | DEP is enabled for system modules only, user applications must explicitly opt in |
| OptOut | DEP is enabled for all modules, user applications must explicitly opt out |
| AlwaysOn | Enables DEP for all applications and disables dynamic DEP configuration |
| AlwaysOff | Disables DEP for all applications and disables dynamic DEP configuration |
You can set DEP policy at the command line using BCDedit.exe:

You can also set DEP policy by opening the Performance Options window via Advanced System Properties (see Figure 4.7). This GUI interface, however, doesn’t let you specify the AlwaysOn or AlwaysOff policies. It only allows you to specify the OptIn or OptOut policies.
If dynamic DEP configuration has been enabled, an individual process can opt in or opt out of DEP using the following API call declared in Winbase.h:

If dwFlags is zero, DEP is disabled for the invoking process. If this input parameter is instead set to 1, it permanently enables DEP for the life of the process.
Note: Applications that are built with the /NXCOMPAT linker option are automatically opted in to DEP.
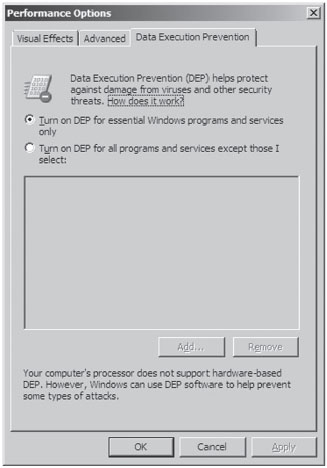
Figure 4.7
The bookkeeping entries related to DEP for a specific process are situated in the KEXECUTE_OPTIONS structure that lies in the corresponding KPROCESS structure. Recall that KPROCESS is the first element of the EPROCESS structure.
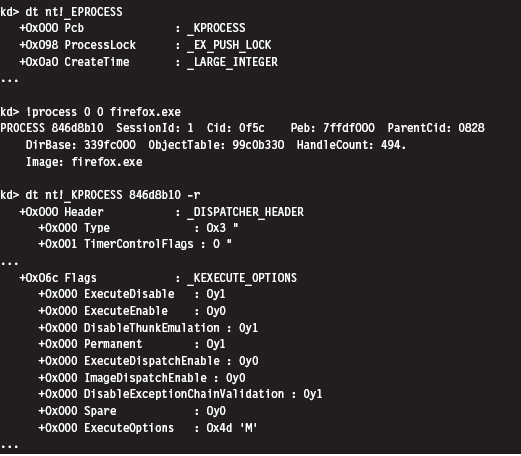
For the sake of this discussion, three fields in the KEXECUTE_OPTIONS structure are of interest (see Table 4.8).
Table 4.8 Fields in KEXECUTE_OPTIONS
| Policy | Description |
| ExecuteDisable | Set to 1 if DEP is enabled |
| ExecuteEnable | Set to 1 if DEP is disabled |
| Permanent | Set to 1 if DEP configuration cannot be altered dynamically by the process |
One way to examine the DEP status of a program without cranking up a kernel debugger is with the Sysinternals Process Explorer (see Figure 4.8). The View menu has a menu item named Select Columns that will allow you to view the DEP status of each process. This column can be set to one of three possible values (see Table 4.9).
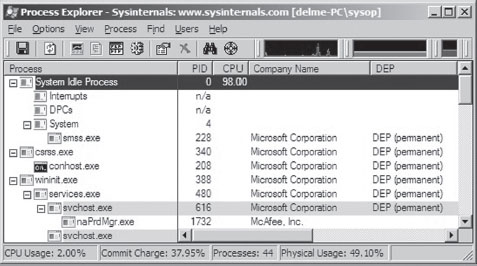
Figure 4.8
Table 4.9 DEP Process Status
| Policy | Description |
| DEP (permanent) | DEP is enabled because the module is a system binary |
| DEP | DEP is enabled due to the current policy or because the application opted in |
| Empty | DEP is disabled due to the current policy or because the application opted out |
There has been a significant amount of work done toward bypassing DEP protection. After years of cat-and-mouse between Microsoft and the attackers, people continue to successfully crack DEP. For example, at the 2010 Pwn2Own contest, a researcher from the Netherlands named Peter Vreugdenhil bypassed DEP and ASLR on Windows 7 in an attack that targeted Internet Explorer 8.0.2
Address Space Layout Randomization
In past versions of Windows, the memory manager would try to load binaries at the same location in the linear address space each time that they were loaded. The /BASE linker option supports this behavior by allowing the developer to specify a preferred base address for a DLL or executable. This preferred linear address is stored in the header of the binary.
If a preferred base address is not specified, the default load address for an .EXE application is 0×400000, and the default load address for a DLL is 0×10000000. If memory is not available at the default or preferred linear address, the system will relocate the binary to some other region. The /FIXED linker option can be used to prevent relocation. In particular, if the memory manager cannot load the binary at its preferred base address, it issues an error message and refuses to load the program.
This behavior made life easier for shell coders by ensuring that certain modules of code would always reside at a fixed address and could be referenced in exploit code using raw numeric literals.
Address space layout randomization (ASLR) is a feature that was introduced with Vista to deal with this issue. ASLR allows binaries to be loaded at random addresses. It’s implemented by leveraging the /DYNAMICBASE linker option. Although Microsoft has built its own system binaries with this link option, third-party products that want to use ASLR will need to “opt in” by re-linking their applications.
Modules that are ASLR capable will have the IMAGE_DLL_CHARACTERISTICS_DYNAMIC_BASE flag (0×0040) set in the DllCharacteristics field of their binary’s optional header. You can use dumpbin.exe to see if this flag has been set:
There’s a system-wide configuration parameter in the registry that can be used to enable or disable ASLR. In the following key:
HKLM\SYSTEM\CurrentControlSet\Control\Session Manager\Memory Management\
you can create a value named MoveImages. By default this value doesn’t exist, which means that ASLR has been enabled but only for modules that have the appropriate flag set (i.e., IMAGE_DLL_CHARACTERISTICS_DYNAMIC_BASE).
If you create the MoveImages registry value and set it to zero, you can effectively disable ASLR. If you set this value to O×FFFFFFFF, it enables ASLR regardless of the flags set in the DllCharacteristics field.
ASLR affects the offset in memory at which executable images, DLLs, stacks, and heaps begin. DLLs are a special case given that they’re set up to reside at the same address for each process that uses them (so that the processes can leverage code sharing). When the memory manager loads the first DLL that uses ASLR, it loads it into memory at some random address (referred to as an “image-load bias”) that’s established when the machine boots up. The loader then works its way toward higher memory, assigning load addresses to the remaining ASLR-capable DLLs (see Figure 4.9).
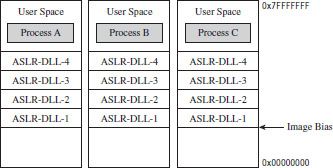
Figure 4.9
To see ASLR in action, crank up the Process Explorer tool from Sysinternals. Select the View menu, and toggle the Show Lower Pane option. Then select the View menu, again, and select the Lower Pane View submenu. Select the DLLs option. This will display all of the DLLs being used by the executable selected in the tool’s top pane. In this example, I selected the Explorer.exe image. This is a binary that ships with Windows and thus is ensured to have been built with ASLR features activated. In the lower pane, I also selected the ntdll.dll DLL as the subject for examination (see Figure 4.10).
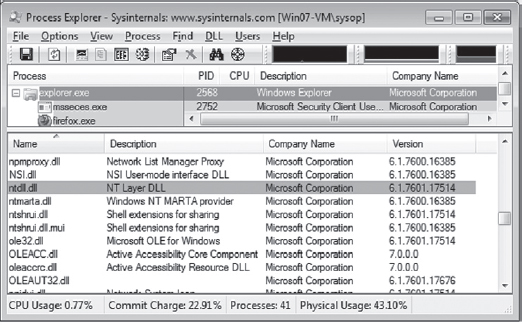
Figure 4.10
If you reboot your computer several times and repeat this whole procedure with the Process Explorer, you’ll notice that the load address of the ntdll. dll file changes. I did this several times and recorded the following load addresses: 0x77090000, 0x77510000, 0x776C0000, and 0x77240000.
ASLR is most effective when used in conjunction with DEP. For example, if ASLR is used alone, there is nothing to prevent an attacker from executing code off the stack via a buffer overflow exploit. Likewise, if DEP is used without ASLR, there’s nothing to prevent a hacker from modifying the stack to re-route program control to a known system call. As with ASLR, DEP requires software vendors to opt in.
/GS Compiler Option
The /GS compiler option can be thought of as software-enforced DEP. It attempts to protect against buffer overflows by sticking a special value on a program’s stack frame called a security cookie. In the event of a buffer overflow attack, the cookie will be overwritten. Before returning, a function that’s vulnerable to this sort of attack will check its stack to see if the security cookie has been modified. If the security cookie has changed, program control will be re-routed to special routines defined in seccook.c.
The best way to understand this technique is to look at an example. Take the following vulnerable routine:
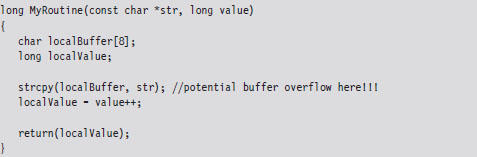
Unless you tell it otherwise, the C compiler will stick to what’s known as the __cdecl calling conventions. This means that:
Function arguments are pushed on the stack from right to left.
The code invoking this function (the caller) will clean arguments off the stack.
Function names are decorated with an underscore by the compiler.
In assembly code, the invocation of MyRoutine() would look something like:
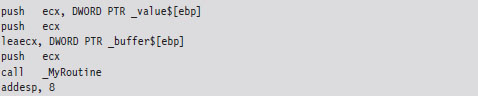
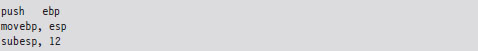
In the absence of stack frame checks, the prologue of MyRoutine() will save the existing stack frame pointer, set its value to the current top of the stack, and then allocate storage on the stack for local variables.
What we end up with is a stack frame as depicted in Figure 4.11.
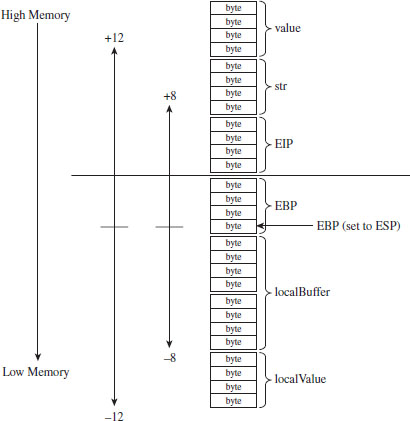
Figure 4.11
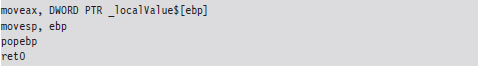
When MyRoutine() returns, it sticks the return value into the EAX register, frees the space on the stack used for local variables, and reinstates the saved stack frame pointer value.
Now let’s see what happens when the /GS switch has been specified and stack protection has been enabled. Most of the real action occurs in the routine’s prologue and epilogue. Let’s start with the prologue:
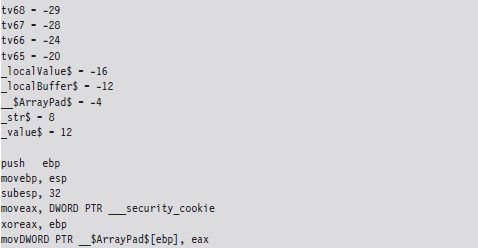
As before, we save the old stack frame pointer and set up a new one. Then we allocated space on the stack for local variables. But wait a minute, this time instead of allocating 12 bytes as we did before (8 bytes for the buffer and 4 bytes for the local integer variable), we allocate 32 bytes!
This extra storage space is needed to accommodate a 4-byte security cookie value. This extra storage also allows us to copy arguments and local variables below the vulnerable function’s buffer on the stack, so that they can be safeguarded from manipulation if a buffer overflow occurs. This practice is known as variable reordering. The compiler refers to these variable copies using the tv prefix (to indicate temporary variables, I suppose).
Once storage has been allocated on the stack, the complier fetches the __security_cookie value. This value is XORed with the stack frame pointer and then stored in a local variable named __$ArrayPad$ on the stack. Note that, in terms of its actual position on the stack, the __$ArrayPad$ value is at a higher address than the buffer so that it will be overwritten in the event of an overflow. Hence, the final stack frame looks something like that in Figure 4.12.
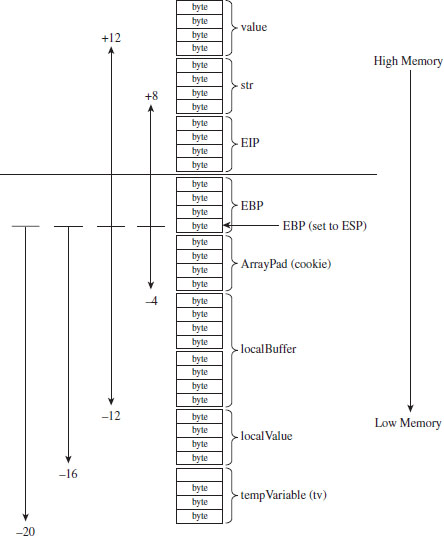
Figure 4.12
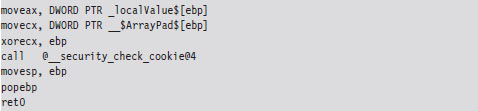
Once the routine has done what it needs to do, it places its return value into EAX, retrieves the security cookie stored in __$ArrayPad$ off the stack, and then calls a routine named __security_check_cookie to confirm that the cookie value hasn’t been altered by an overflow. If the security check routine discovers that the cookie has been changed, it invokes the report_failure() function, which in turn calls __security_error_handler().
By default, the Visual Studio compiler uses a heuristic algorithm to decide which routines need stack frame protection. To make the compiler more aggressive with respect to checking for buffer overflows, the following directives can be used:

If the strict_gs_check pragma is activated, the compiler injects a GS cookie to all routines that manipulate the address of a local variable.
/SAFESEH Linker Option
This linker option is intended to protect exception handler records on the stack from being overwritten. Attackers will sometimes use this tactic in an effort to redirect the path of execution. If the /SAFESEH option is specified on IA-32 systems, the linker will insert a special table into the binary’s header that contains a listing of the module’s valid exception handlers. At runtime, when an exception occurs, the code in ntdll.dll responsible for dispatching exceptions will confirm that the corresponding exception handler record currently on the stack is one of the handlers listed in the header’s table. If it’s not, the code in ntdll.dll will bring things to a grinding halt.
4.6 The Native API
The core services that an operating system offers to user-mode applications are defined by a set of routines called the system call interface. These are the building blocks used to create user-mode APIs like the ANSI C standard library. Traditionally, operating systems like UNIX have always had a well-documented, clearly defined set of system calls. The Minix operating system, for example, has a system call interface consisting of only 53 routines. Everything that the Minix operating system is capable of doing ultimately can be resolved into one or more of these system calls.
However, this is not the case with Windows, which refers to its system call interface as the Native API of Windows. Like the Wizard of Oz, Microsoft has opted to leave the bulk of its true nature behind a curtain. Rather than access operating system services through the system call interface, the architects in Redmond have decided to veil them behind yet another layer of code. Pay no attention to the man behind the curtain, booms the mighty Oz, focus on the ball of fire known as the Windows API.
Note: Old habits die hard. In this book, I’ll use the terms “system call interface” and “native API” interchangeably.
One can only guess the true motivation for this decision. Certain unnamed network security companies would claim that it’s Microsoft’s way of keeping the upper hand. After all, if certain operations can only be performed via the Native API, and you’re the only one who knows how to use it, you can bet that you possess a certain amount of competitive advantage. In contrast, leaving the Native API undocumented might also be Microsoft’s way of leaving room to accommodate change. This way, if a system patch involves updating the system call interface, developers aren’t left out in the cold because their code relies on the Windows API (which is less of a moving target).
In this section, I describe the Windows system call interface. I’ll start by looking at the kernel-mode structures that facilitate Native API calls and then demonstrate how they can be used to enumerate the API. Next, I’ll examine which of the Native API calls are documented and how you can glean information about a particular call even if you don’t have formal documentation. I’ll end the section by tracing the execution path of Native API calls as they make their journey from user mode to kernel mode.
The IVT Grows Up
In real-mode operating systems, like MS-DOS, the interrupt vector table (IVT) was the primary system-level data structure; the formal entryway to the kernel. Every DOS system call could be invoked by a software-generated interrupt (typically via the INT 0x21 instruction, with a function code placed in the AH register). In Windows, the IVT has been reborn as the interrupt dispatch table (IDT) and has lost some of its former luster. This doesn’t mean that the IDT isn’t useful (it can still serve as a viable entry point into kernel space); it’s just not the all-consuming focal structure it was back in the days of real mode.
A Closer Look at the IDT
When Windows starts up, it checks to see what sort of processor it’s running on and adjusts its system call invocations accordingly. Specifically, if the processor predates the Pentium II, the INT 0x2E instruction is used to make system calls. For more recent IA-32 processors, Windows relieves the IDT of this duty in favor of using the special-purpose SYSENTER instruction to make the jump to kernel-space code. Hence, most contemporary installations of Windows only use the IDT to respond to hardware-generated signals and handle processor exceptions.
Note: Each processor has its own IDTR register. Thus, it makes sense that each processor will also have its own IDT. This way, different processors can invoke different ISRs (interrupt service routines) if they need to. For instance, on a machine with multiple processors, all of the processors must acknowledge the clock interrupt. However, only one processor increments the system clock.
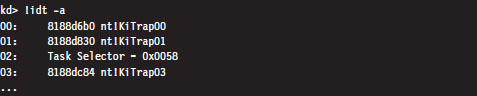
According to the Intel specifications, the IDT (which Intel refers to as the interrupt descriptor table) can contain at most 256 descriptors, each of which is 8 bytes in size. We can determine the base address and size of the IDT by dumping the descriptor registers.

This tells us that the IDT begins at linear address 0x82430400 and has 256 entries. The address of the IDT’s last byte is the sum of the base address in IDTR and the limit in IDTL.
If we wanted to, we could dump the values in memory from linear address 0x82430400 to 0x82430BFF and then decode the descriptors manually. There is, however, an easier way. The !ivt kernel-mode debugger extension command can be used to dump the name and addresses of the corresponding ISR routines.
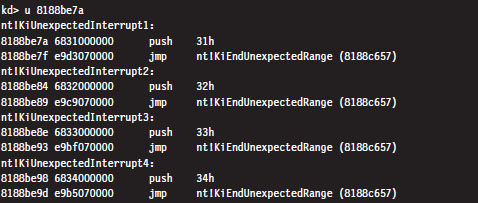
Of the 254 entries streamed to the console, less than a quarter of them reference meaningful routines. Most of the entries (roughly 200 of them) resembled the following ISR:

These KiUnexpectedInterrupt routines are arranged sequentially in memory, and they all end up calling a function called KiEndUnexpectedRange, which indicates to me that only a few of the IDT’s entries actually do something useful.
Even though contemporary hardware forces Windows to defer to the SYSENTER instruction when making jumps to kernel-space code, the IDT entry that implemented this functionality for older processors still resides in the IDT at entry 0x2E.
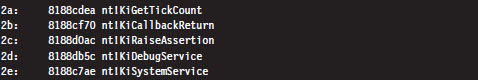
The ISR that handles interrupt 0x2E is a routine named KiSystemService. This is the system service dispatcher, which uses the information passed to it from user mode to locate the address of a Native API routine and invoke the Native API routine.
From the perspective of someone who’s implementing a rootkit, the IDT is notable as a way to access hardware ISRs or perhaps to create a back door into the kernel. We’ll see how to manipulate the IDT later on in the book. Pointers to the Windows Native API reside elsewhere in another table.
System Calls via Interrupt
When the INT 0x2E instruction is used to invoke a system call, the system service number (also known as the dispatch ID) that uniquely identifies the system call is placed in the EAX register. For example, back in the days of Windows 2000, when interrupt-driven system calls were the norm, an invocation of the KiSystemService routine would look like:
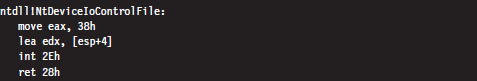
The previous assembly code is the user-mode proxy for the NtDeviceIoControlFile system call on Windows 2000. It resides in the ntdll.dll library, which serves as the user-mode liaison to the operating system. The first thing that this code does is to load the system service number into EAX. This is reminiscent of real mode, where the AH register serves an analogous purpose. Next, an address for a value on the stack is stored in EDX, and then the interrupt itself is executed.
The SYSENTER Instruction
Nowadays, most machines use the SYSENTER instruction to jump from user mode to kernel mode. Before SYSENTER is invoked, three 64-bit machine-specific registers (MSRs) must be populated so that the processor knows both where it should jump to and where the kernel-mode stack is located (in the event that information from the user-mode stack needs to be copied over). These MSRs (see Table 4.10) can be manipulated by the RDMSR and WRMSR instructions.
Table 4.10 Machine Specific Registers
| Policy | Address | Description |
| IA32_SYSENTER_CS | 0x174 | Specifies kernel-mode code and stack segment selectors |
| IA32_SYSENTER_ESP | 0x175 | Specifies the location of the kernel-mode stack pointer |
| IA32_SYSENTER_EIP | 0x176 | Specifies the kernel-mode code’s entry point |
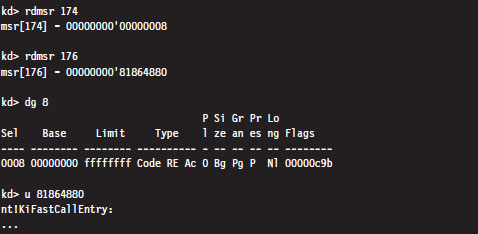
If we dump the contents of the IA32_SYSENTER_CS and IA32_SYSENTER_EIP registers, using the rdmsr debugger command, sure enough they specify an entry point residing in kernel space named KiFastCallEntry. In particular, the selector stored in the IA32_SYSENTER_CS MSR corresponds to a Ring 0 code segment that spans the entire address range (this can be verified with the dg kernel debugger command). Thus, the offset stored in the IA32_SYSENTER_EIP MSR is actually the full-blown 32-bit linear address of the KiFastCallEntry kernel mode routine.
If you disassemble the KiSystemService routine and follow the yellow brick road, you’ll see that eventually program control jumps to KiFastCallEntry. So ultimately both system call mechanisms lead to the same destination.
As in the case of INT 0x2E, before the SYSENTER instruction is executed the system service number will need to be stowed in the EAX register. The finer details of this process will be described shortly.
The System Service Dispatch Tables
Regardless of whether user-mode code executes INT0x2E or SYSENTER, the final result is the same: the kernel’s system service dispatcher ends up being invoked. It uses the system service number to index an entry in an address lookup table.
The system service number is a 32-bit value (see Figure 4.13). The first 12 bits (bits 0 through 11) indicate which system service call will ultimately be invoked. Bits 12 and 13 in this 32-bit value specify one of four possible service descriptor tables.
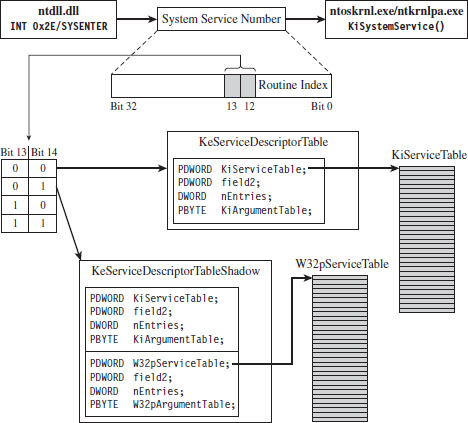
Figure 4.13
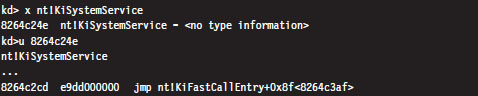
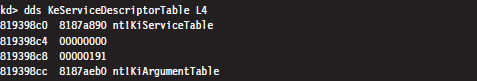
Even though four descriptor tables are possible (e.g., two bits can assume one of four values), it would seem that there are two service descriptor tables that have visible symbols in kernel space. You can see this for yourself by using the following command during a kernel debugging session:
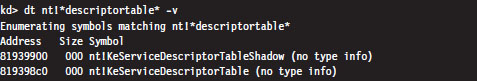
Of these two symbols, only KeServiceDescriptorTable is exported by ntoskrnl.exe (you can verify this with the dumpbin.exe tool). The other table is visible only within the confines of the executive.
If bits 12 and 13 of the system service number are 0x00 (i.e., the system service numbers lie in the range 0x0000 - 0x0FFF), then the KeServiceDescriptorTable is used. If bits 12 and 13 of the system service number are 0x01 (i.e., the system service numbers lie in the range 0x1000 - 0x1FFF), then the KeServiceDescriptorTableShadow is to be used. The ranges 0x2000-0x2FFF and 0x3000-0x3FFF don’t appear to be assigned to service descriptor tables.
These two service descriptor tables contain substructures known as system service tables (SSTs). An SST is essentially an address lookup table that can be defined in terms of the following C structure.
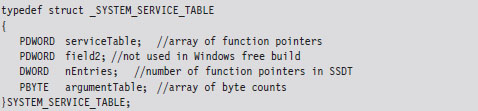
The serviceTable field is a pointer to the first element of an array of linear addresses, where each address is the entry point of a routine in kernel space. This array of linear addresses is also known as the system service dispatch table (SSDT; not to be confused with SST). An SSDT is like the real-mode IVT in spirit, except that it’s a Windows-specific data structure. You won’t find references to the SSDT in the Intel IA-32 manuals.
The third field, nEntries, specifies the number of elements in the SSDT array.
The fourth field is a pointer to the first element of an array of bytes, where each byte in the array indicates the amount of space (in bytes) allocated for function arguments when the corresponding SSDT routine is invoked. This last array is sometimes referred to as the system service parameter table (SSPT). As you can see, there are a lot of acronyms to keep straight here (SST, SSDT, SSPT, etc.). Try not to let it throw you.
The first 16 bytes of the KeServiceDescriptorTable is an SST that describes the SSDT for the Windows Native API. This is the core system data structure that we’ve been looking for. Under Windows 7, it consists of 401 routines (nEntries = 0x191).
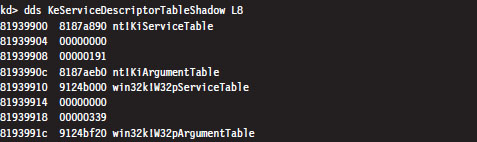
The first 32 bytes of the KeServiceDescriptorTableShadow structure includes two SSTs. The first SST is just a duplicate of the one in KeServiceDescriptorTable. The second SST describes the SSDT for the USER and GDI routines implemented by the Win32k.sys kernel-mode driver. These are all the functions that take care of the Windows GUI. There are quite of few of these routines, 772 to be exact, but we will be focusing most of our attention on the Native API.
ASIDE
Microsoft doesn’t seem to appreciate it when you broach the subject of service descriptor tables on their MSDN Forums. Just for grins, here’s a response that one of the employees at Microsoft gave to someone who had a question about KeServiceDescriptorTable.
“KeServiceDescriptorTable is not documented and what you are trying to do is a really bad idea, better ask the people who provided you with the definition of KeServiceDescriptorTable.”
Enumerating the Native API
Now that we know where the Native API SSDT is located and how big it is, dumping it to the console is a piece of cake.
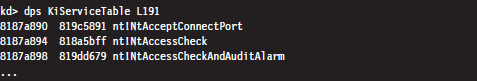
I truncated the output of this command for the sake of brevity. One thing you’ll notice is that all of the routine names begin with the prefix “Nt.” Hence, I will often refer to the Native API as Nt*() calls, where I’ve used the asterisk character as a wild-card symbol to represent the entire family of possible calls.
Can user-mode code access all 401 of these Native API routines? To answer this question, we can examine the functions exported by ntdll.dll, the user-mode front man for the operating system. Using the ever-handy dumpbin.exe, we find that ntdll.dll exports 1,981 routines. Of these, 407 routines are of the form Nt*(). This is because there are extra Nt*() routines exported by ntdll.dll that are implemented entirely in user space. One of these extra routines, NtCurrentTeb(), is particularly noteworthy.
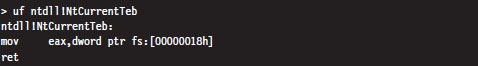
The disassembly of NtCurrentTEB() is interesting because it demonstrates that we can access thread execution blocks in our applications with nothing more than raw assembly code. We’ll use this fact again later on in the book.
Nt*() Versus Zw*() System Calls
Looking at the dump of exported functions from ntdll.dll, you’ll see what might appear to be duplicate entries.
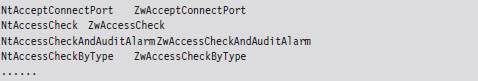
With a few minor exceptions, each Nt*() function has a matching Zw*() function. For example, NtCreateToken() can be paired with ZwCreateToken(). This might leave you scratching your head and wondering why there are two versions of the same function.
As it turns out, from the standpoint of a user-mode program, there is no difference. Both routines end up calling the same code. For example, take NtCreateProcess() and ZwCreateProcess(). Using CDB.exe, we can see that a call to NtCreateProcess() ends up calling the same code as a call to ZwCreateProcess().
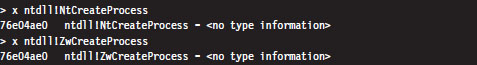
Note how these routines reside at the same linear address.
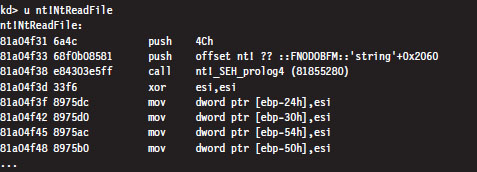
In kernel mode, however, there is a difference. Let’s use the NtReadFile() system call to demonstrate this. We’ll start by checking out the implementation of this call:
Now let’s disassemble ZwReadFile() to see what we can uncover:
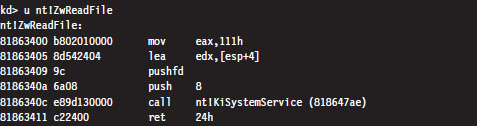
Notice how I specified the “nt!” prefix to ensure that I was dealing with symbols within the ntoskrnl.exe memory image. As you can see, calling the ZwReadFile() routine in kernel mode is not the same as calling NtReadFile(). If you look at the assembly code for ZwReadFile(), the routine loads the system service number corresponding to the procedure into EAX, sets up EDX as a pointer to the stack so that arguments can be copied during the system call, and then invokes the system service dispatcher.
In the case of NtReadFile(), we simply jump to the system call and execute it. This involves a direct jump from one kernel-mode procedure to another with a minimum amount of formal parameter checking and access rights validation. In the case of ZwReadFile(), because we’re going through the KiSystemService() routine to get to the system call, the “previous mode” of the code (the mode of the instructions calling the system service) is explicitly set to kernel mode so that the whole process checking parameters and access rights can proceed formally with the correct setting for the previous mode. In other words, calling a Zw*() routine from kernel mode is preferred because it guarantees that information travels through the official channels in the appropriate manner.
Microsoft sums up this state of affairs in the WDK Glossary:
NtXxx Routines
A set of routines used by user-mode components of the operating system to interact with kernel mode. Drivers must not call these routines; instead, drivers can perform the same operations by calling the ZwXxx Routines.
The Life Cycle of a System Call
So far, we’ve looked at individual pieces of the puzzle in isolation. Now we’re going to string it all together by tracing the execution path that results when a user-mode application invokes a routine that’s implemented in kernel space. This section is important because we’ll come back to this material later on when we investigate ways to undermine the integrity of the operating system.
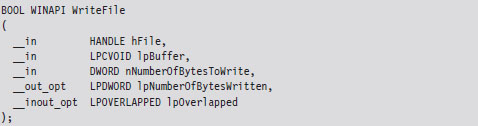
In this example, we’ll examine what happens when program control jumps to a system call implemented within the ntoskrnl.exe binary. Specifically, we’re going to look at what happens when we invoke the WriteFile() Windows API function. The prototype for this procedure is documented in the Windows SDK:
Let’s begin by analyzing the Winlogon.exe binary with cdb.exe. We can initiate a debugging session that targets this program via the following batch file:
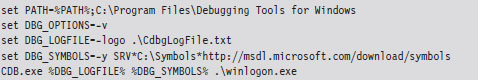
If some of the options in this batch file are foreign to you, don’t worry. I’ll discuss Windows debuggers in more detail later on. Now that we’ve cranked up our debugger, let’s disassemble the WriteFile() function to see where it leads us.
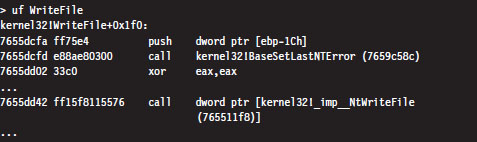
Looking at this listing (which I’ve truncated for the sake of brevity), the first thing you can see is that the WriteFile() API function has been implemented in the Kernel32.dll. The last line of this listing is also important. It calls a routine located at an address (0x765511f8) that’s stored in a lookup table.
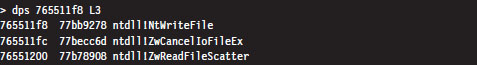
Hence, the WriteFile() code in kernel32.dll ends up calling a function that has been exported by ntdll.dll. Now we’re getting somewhere.
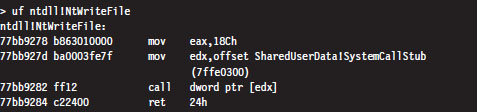
As you can see, this isn’t really the implementation of the NtWriteFile() Native API call. Instead, it’s just a stub routine residing in ntdll.dll that ends up calling the gateway in ntdll.dll that executes the SYSENTER instruction. Notice how the system service number for the NtWriteFile() Native call (i.e., 0x18C) is loaded into the EAX register in the stub code, well in advance of the SYSENTER instruction.
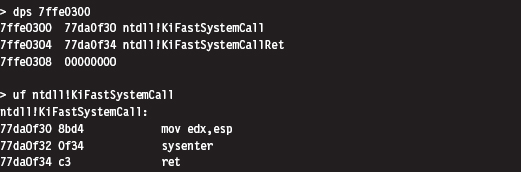
As discussed earlier, the SYSENTER instruction compels program control to jump to the KiFastCallEntry() routine in ntoskrnl.exe. This will lead to the invocation of the native NtWriteFile() procedure. This whole programmatic song-and-dance is best summarized by Figure 4.14.
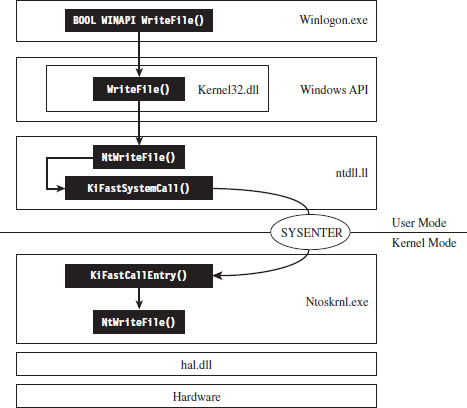
Figure 4.14
Other Kernel-Mode Routines
In addition to the Native API (which consists of more than 400 different system calls), the Windows executive exports hundreds of other routines. All told, the ntoskrnl.exe binary exports 2,184 functions. Many of these system-level calls can be grouped together under a particular Windows subsystem or within a common area of functionality (see Figure 4.15).
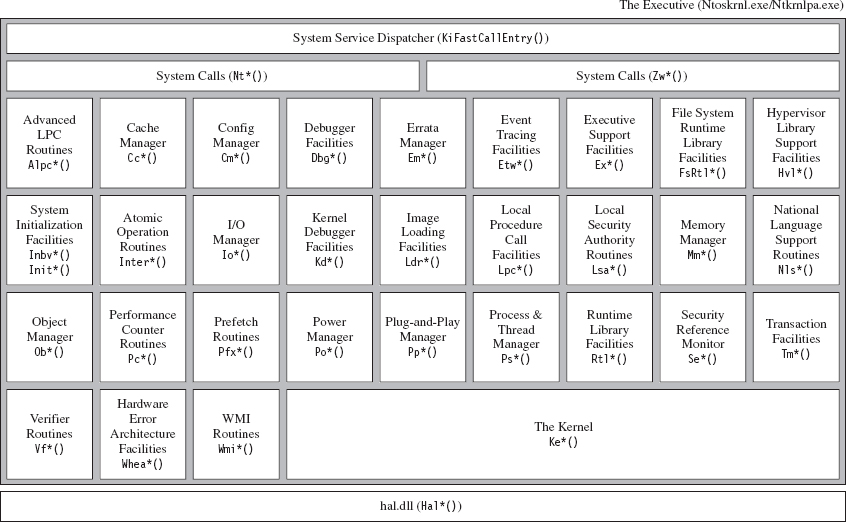
Figure 4.15
Not all of the constituents of ntoskrnl.exe in Figure 4.15 are full-blown executive subsystems. Some areas merely represent groups of related support functions. In some instances, I’ve indicated this explicitly by qualifying certain executive components in Figure 4.15 as facilities or simply a set of routines. Likewise, official subsystems have been labeled as managers. Although I’ve tried to arrange some elements to indicate their functional role in the greater scheme of things, most of the executive components have been arranged alphabetically from left to right and from top to bottom.
To make the association between these system-level routines and the role that they play more apparent, Microsoft has established a naming scheme for system-level functions (not just routines exported by ntoskrnl.exe). Specifically, the following convention has been adopted for identifiers:
Prefix-Operation-Object
The first few characters of the name consist of a prefix that denotes which subsystem or general domain of functionality the routine belongs to. The last few characters usually (but not always) specify an object that is being manipulated. Sandwiched between the prefix and object name is a verb that indicates what action is being taken. For example, ntoskrnl.exe file exports a routine named MmPageEntireDriver() that’s implemented within the memory manager and causes all of a driver’s code and data to be made pageable.
Table 4.11 provides a partial list of function prefixes and their associated kernel-mode components.
Table 4.11 Kernel-Mode Routine Prefixes
| Prefix | Kernel-Mode Component | Description |
| Alpc | Advanced LPC routines | Passes local messages between client and server software |
| Cc | Cache manager | Implements caching for all file system drivers |
| Cm | Configuration manager | Implements the Windows registry |
| Dbg | Debugging facilities | Implements break points, symbol loading, and debug output |
| Em | Errata manager | Offers a way to accommodate noncompliant hardware |
| Etw | Event tracing facilities | Helper routines for tracing events system-wide |
| Ex | Executive support facilities | Synchronization services and heap management |
| FsRtl | File system runtime library | Used by file system drivers and file system filter drivers |
| Hal | Hardware abstraction layer | Insulates the operating system and drivers from the hardware |
| Hvl | Hypervisor library routines | Kernel support for virtual machine operation |
| Invb | System initialization routines | Bootstrap video routines |
| Init | System initialization routines | Controls how the operating system starts up |
| Interlocked | Atomic operation facilities | Implements thread-safe variable manipulation |
| Io | Input/output manager | Controls communication with kernel-mode drivers |
| Kd | Kernel debugger facilities | Reports on, and manipulates, the state of the kernel debugger |
| Ke | The kernel proper | Implements low-level thread scheduling and synchronization |
| Ki | Internal kernel routines | Routines that support interrupt handling and spin locks |
| Ldr | Image loading facilities | Support the loading of executables into memory |
| Lpc | Local procedure call facilities | An IPC mechanism for local software components |
| Lsa | Local security authentication | Manages user account rights |
| Mm | Memory manager | Implements the system’s virtual address space |
| Nls | Native language support | Kernel support for multilingual environments |
| Nt | Native API calls | System call interface (the internal version) |
| Ob | Object manager | Implements an object model that covers all system resources |
| Pcw | Performance counter routines | Routines that allow performance data to be collected |
| Pf | Logical prefetcher | Optimizes load time for applications |
| Po | Power manager | Handles the creation and propagation of power events |
| Pp | Plug-and-play manager | Supports dynamically loading drivers for new hardware |
| Ps | Process and thread manager | Provides higher-level process/thread services |
| Rtl | Runtime library | General support routines for other kernel components |
| Se | Security reference monitor | Validates permissions at runtime when accessing objects |
| Tm | Transaction management | Support for the classic two-phase commit scheme |
| Vf | Verifier routines | Checks the integrity of kernel-mode code |
| Whea | Hardware error architecture | Defines a mechanism for reporting hardware errors |
| Wmi | Management instrumentation | Allows kernel-mode code to interact with the WMI service |
| Zw | Native call APIs | The safe (user-callable) versions of the Nt*() routines |
Kernel-Mode API Documentation
As mentioned earlier, the documentation for kernel-mode functions is lacking (for whatever reason, different people will feed you different stories). Thus, when you come across a kernel-mode routine that you don’t recognize, the following resources can be referenced to hunt for clues:
Official documentation.
Unofficial (non-Microsoft) documentation.
Header files.
Debug symbols.
Raw disassembly.
These sources are listed according to their degree of clarity and your level of desperation. In the optimal scenario, the routine will be described in the Windows Driver Kit (WDK) documentation. There are a number of kernel-mode functions documented in the WDK help file under the Driver Support Routines node (see Figure 4.16).
There’s also MSDN online at http://msdn.microsoft.com. You can visit their support page and perform a general search as part of your campaign to ferret out information. This website is hit or miss. You tend to get either good information immediately or nothing at all.
If you search the official Microsoft documentation and strike out, you can always try documentation that has been compiled by third-party sources. There are a number of books and articles that have appeared over the years that might be helpful. Table 4.12 offers a sample, chronological list of noteworthy attempts to document the undocumented.
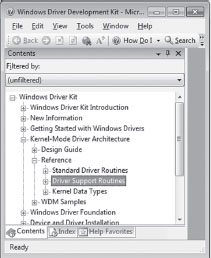
Figure 4.16
Table 4.12 Books on Undocumented Aspects of Windows
| Title | Author | Publisher |
| Undocumented Windows NT | Prasad Dabak Sandeep Thadke et al. | Hungry Minds, 1999 |
| Windows NT/2000 Native API Reference | Gary Nebbett | Sams, 2000 |
| Undocumented Windows 2000 Secrets | Sven Schreiber | Addison-Wesley, 2001 |
As you can see, the books in the table are more than a decade old. This speaks to the fact that the Native API is an elusive moving target. It refuses to sit still. Given the effort required to reverse call stacks, most authors can only sit and watch as all their hard work fades quickly into obsolescence (the alternative is to tread water forever). At Black Hat DC 2010, I remember listening to H.D. Moore describe how they foiled a publisher’s attempt to document Metasploit simply by coding faster than the authors could keep up.
If formal documentation fails you, another avenue of approach is to troll through the header files that come with the Windows Driver Kit (e.g., ntddk.h, ntdef.h) and the Windows SDK (e.g., Winternl.h). Occasionally, you’ll run into some embedded comments that shed light on what things represent.
Your final recourse, naturally, is to disassemble and examine debugger symbols. Disassembled code is the ultimate authority, there is no disputing it. Furthermore, I’d warrant that more than a handful of the discoveries about undocumented Windows features were originally gathered via this last option, so it pays to be familiar with a kernel debugger (see the next chapter for more on this). Just be warned that the engineers at Microsoft are also well aware of this and sometimes attempt to protect more sensitive regions of code through obfuscation and misdirection.
Here’s an example of what I’m talking about. If you look in the WDK online help for details on the EPROCESS structure, this is what you’ll find:
The EPROCESS structure is an opaque structure that serves as the process object for a process.
Okay, they told us that the structure was “opaque.” In other words, they’ve admitted that they aren’t going to give us any details outright. If you look in the wdm.h header file, you’ll see that we hit another dead end:

Though we’ve been stifled so far, the truth finally comes to light once we crank up a kernel debugger.
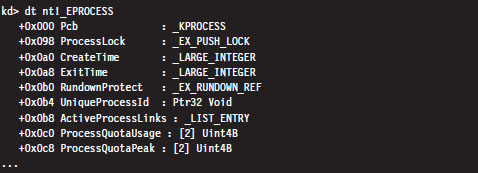
Thus, even when Microsoft refuses to spoon-feed us with information, there are ways to poke your head behind the curtain.
4.7 The BOOT Process
In very general terms, the Windows boot process begins with the boot manager being loaded into memory and executed. However, the exact nature of this sequence of events depends upon the type of firmware installed on the motherboard:
Is it a tried-and-true PC basic input/output system (BIOS)?
Or is it one of those new-fangled extensible firmware interface (EFI) deals?
Startup for BIOS Firmware
If the firmware is BIOS compatible, the machine starts with a power-on self-test (POST). The POST performs low-level hardware checks. For example, it determines how much onboard memory is available and then cycles through it. The POST also enumerates storage devices attached to the motherboard and determines their status.
Next, the BIOS searches its list of bootable devices for a boot sector. Typically, the order in which it does so can be configured so that certain bootable devices are always examined first. If the bootable device is a hard drive, this boot sector is a master boot record (MBR). The MBR is the first sector of the disk and is normally written there by the Windows setup program. It contains both instructions (i.e., boot code) and data (i.e., a partition table). The partition table consists of four entries, one for each of the hard drive’s primary partitions.
A primary partition can be specially formatted to contain multiple distinct storage regions, in which case it is called an extended partition, but this is somewhat beside the point. The MBR boot code searches the partition table for the active partition (i.e., the bootable partition, also known as the system volume) and then loads this partition’s boot sector into memory (see Figure 4.17). The active partition’s boot sector, known as the volume boot record (VBR), is the first sector of the partition, and it also contains a modest snippet of boot code.
Note: If the first bootable device encountered by the BIOS is not a hard disk (e.g., perhaps it’s a bootable DVD or a floppy diskette), the BIOS will load that device’s VBR into memory. Thus, regardless of what happens, one way or another a VBR ends up being executed.
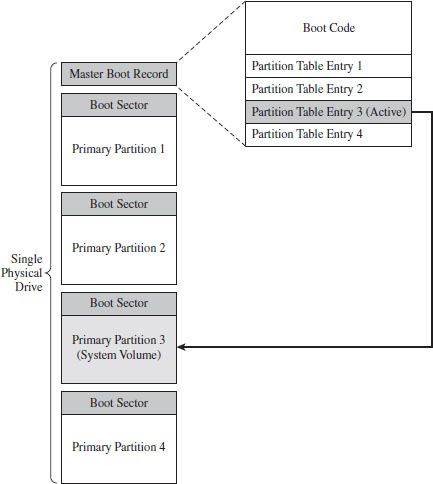
Figure 4.17
The boot code in the VBR can read the partition’s file system just well enough to locate a 16-bit boot manager program whose path is %System-Drive%\bootmgr. This 16-bit code has been grafted onto the front of a 32-bit boot manager such that the bootmgr binary is actually two executables that have been concatenated. If the version of Windows installed is 64 bit, the bootmgr will contain 64-bit machine instructions. The 16-bit stub executes in real mode, just like the code in the MBR and the VBR. It sets up the necessary data structures, switches the machine into protected mode, and then loads the protected mode version of the boot manager into memory.
Startup for EFI Firmware
If the firmware conforms to the EFI specification, things happen a little differently once the POST is complete. In a machine with EFI firmware, there is no need to rely on code embedded in an MBR or VBR. This is because boot code has been stashed in the firmware. This firmware can be configured using a standard set of EFI variables. One of these variables contains the path to the EFI executable program that Windows will use to continue the startup process. During the install process, the Windows setup program adds a single boot option entry to the appropriate EFI configuration variable that specifies the following EFI executable program:
%SystemDrive%\EFI\Microsoft\Boot\Bootmgfw.efi
The EFI firmware switches the machine to protected mode, using a flat memory model with paging disabled. This allows the 32-bit (or 64-bit) bootmgr.efi program to be executed without falling back on a 16-bit stub application.
The Windows Boot Manager
Both BIOS and EFI machines eventually load a boot manager (bootmgr or Bootmgfw.efi) into memory and execute it. The boot manager uses configuration data stored in a registry hive file to start the system. This hive file is named BCD (as in boot configuration data), and it is located in one of two places:
%SystemDrive%\Boot\ (for BIOS machines).
%SystemDrive%\EFI\Microsoft\Boot\ (for EFI machines).
You can examine the BCD file in its “naked” registry format with regedit. exe. In Windows, the BCD hive is mounted under HKLM\BCD00000000. For a friendlier user interface, however, the tool of choice for manipulating BCD is BCDEdit.exe. A BCD store will almost always have at least two elements:
A single Windows boot manager object.
One or more Windows boot loader objects.
The boot manager object (known as registry sub-key {9dea862c-5cdd-4e70-acc1-f32b344d4795}, or its BCDEdit.exe alias {bootmgr}) controls how the character-based boot manager screen is set up as a whole (e.g., the number of entries in the operating system menu, the entries for the boot tool menu, the default time-out, etc.).
The boot loader objects (which are stored in the BCD hive under random global unique identifiers (GUIDs)) represent different configurations of the operating system (i.e., one might be used for debugging, and another configuration might be used for normal operation, etc.). The boot manager can understand Windows file systems well enough to open and digest the BCD store. If the configuration store only contains a single boot loader object, the boot manager will not display its character-based user interface (UI).
You can view BCD objects with the /enum command:
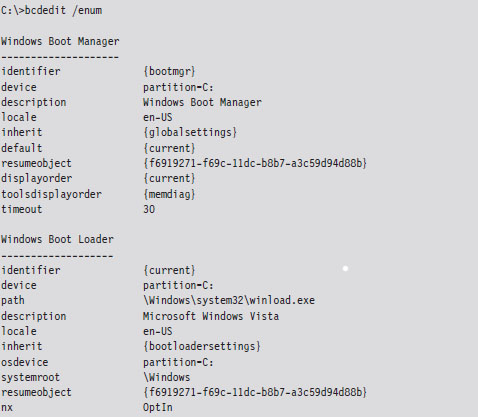
The Windows Boot Loader
If Windows is chosen as the operating system, the boot manager will load and execute the Windows boot loader (winload.exe, or Winload.efi on EFI systems), whose location is specified by the corresponding boot loader object. By default, it’s installed in the %SystemRoot%\System32 directory. The winload.exe program is the successor to the venerable NTLDR program, which was used to load the operating system in older versions of Windows.
ASIDE: BOOT VOLUME VERSUS SYSTEM VOLUME
The distinction between the system volume and the boot volume has always confused me because the two volumes seem to be inversely named. To help clarify things:
The system volume is the partition hosting the VBR. Both the boot manager and the boot manager configuration database reside on the system volume.
The boot volume is the volume hosting the Windows directory specified in the %System-Root% environmental variable. The boot volume also stores the Windows boot loader.
The Windows boot loader begins by loading the SYSTEM registry hive. This binary file that stores this hive is named SYSTEM and is located in the %System-Root%\System32\config directory. The SYSTEM registry hive is mounted in the registry under HKLM\SYSTEM.
Next, the Windows boot loader performs a test to verify the integrity of its own image. It does this by loading the digital signature catalogue file (nt5. cat), which is located in:
%SystemRoot%\System32\CatRoot\{F750E6C3-38EE-11D1-85E5-00C04FC295EE}\
The Windows boot loader compares the signature of its in-memory image against that in nt5.cat. If the signatures don’t match, things will come to a screeching halt. An exception to this rule exists if the machine is connected to a kernel-mode debugger (though Windows will still issue a stern warning to the debugger’s console).
After verifying its own image, the Windows boot loader will load ntoskrnl.exe and hal.dll into memory. If kernel debugging has been enabled, the Windows boot loader will also load the kernel-mode driver that corresponds to the debugger’s configured mode of communication:
kdcom.dll for communication via null modem cable.
kd1394.dll for communication via IEEE1394 (“FireWire”) cable.
kdusb.dll for communication via USB 2.0 debug cable.
If the integrity checks do not fail, the DLLs imported by ntoskrnl.exe are loaded, have their digital signatures verified against those in nt5.cat (if integrity checking has been enabled), and then initialized. These DLLs are loaded in the following order:
pshed.dll
bootvid.dll
clfs.sys
ci.dll
Once these DLLs have been loaded, the Windows boot loader scans through all of the sub-keys in the registry located under the following key (see Figure 4.18):
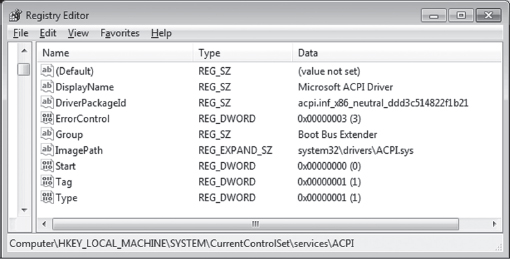
Figure 4.18
HKLM\SYSTEM\CurrentControlSet\Services
The many sub-keys of the key above (ac97intc, ACPI, adp94xx, etc.) specify both services and device drivers. The Windows boot loader looks for device drivers that belong in the boot class category. Specifically, these will be registry keys that include a REG_DWORD value named Start, which is equal to 0x00000000. According to the macros defined in the WinNT.h header file, this indicates a SERVICE_BOOT_START driver.
For example, in Figure 4.18, we have the advanced configuration and power interface (ACPI) driver in focus. By looking at the list of values in the right-hand pane, we can see that this is a “boot class” driver because the Start value is zero.
If integrity checks have been enabled, the Windows boot loader will require the digital signatures of these drivers to be verified against those in nt5.cat as the drivers are loaded. If an integrity check fails, the boot loader will halt unless kernel-mode debugging has been enabled (at which point it will issue a warning that will appear on the debugger’s console).
If you’d like to see the “what,” “when,” and “where” of module loading during system startup, the best source of information is a boot log. The following BCDEdit command will configure Windows to create a log file named Ntbtlog.txt in the %SystemRoot% directory.

The log file that gets generated will provide a chronological list of modules that are loaded during the boot process and where they are located in the Windows directory structure. Naturally, it will be easy to identify boot class drivers because they will appear earlier in the list.
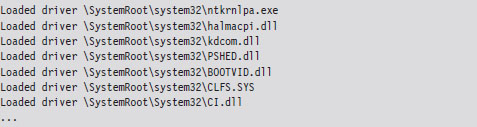
The last few steps that the Windows boot loader performs is to enable protected-mode paging (note, I said “enable” paging, not build the page tables), save the boot log, and transfer control to ntoskrnl.exe.
Initializing the Executive
Once program control is passed to ntoskrnl.exe via its exported KiSystem-Startup() function, the executive subsystems that reside within the address space of the ntoskrnl.exe executable are initialized, and the data structures they use are constructed. For example, the memory manager builds the page tables and other internal data structures needed to support a two-ring memory model. The HAL configures the interrupt controller for each processor, populates the IVT, and enables interrupts. The SSDT is built, and the ntdll.dll module is loaded into memory. Yada, yada, yada …
In fact, there’s so much that happens (enough to fill a couple of chapters) that, rather than try to cover everything in-depth, I’m going to focus on a couple of steps that might be of interest to someone building a rootkit.
One of the more notable chores that the executive performs during this phase of system startup is to scan the registry for system class drivers and services. As mentioned before, these sorts of items are listed in sub-keys under the HKLM\SYSTEM\CurrentControlSet\Services key. To this end, there are two REG_DWORD values in these sub-keys that are particularly important:
Start: which dictates when the driver/service is loaded.
Type: which indicates if the sub-key represents a driver or a service.
The integer literals that the Start and Type values can assume are derived from macro definitions in the WinNT.h header file. Hence, the executive searches through the services key for sub-keys where the Start value is equal to 0x00000001.
If driver-signing integrity checks have been enabled, the executive will use code integrity routines in the ci.dll library to vet the digital signature of each system class driver (many of these same cryptographic routines have been statically linked into winload.exe so that it can verify signatures without a DLL). If the driver fails the signature test, it is not allowed to load. I’ll discuss driver signing and code integrity facilities in more detail later on.
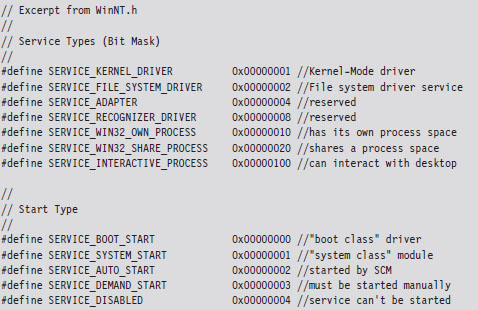
The Session Manager
One of the final things that the executive does, as a part of its startup initialization, is to initiate the session manager (%SystemRoot%\System32\smss.exe). One of the first things that the session manager does is to execute the program specified by the BootExecute value under the following registry key:
HKLM\SYSTEM\CurrentControlSet\Control\Session Manager\
By default, the BootExecute value specifies the autochk.exe program.
In addition to minor tasks, like setting up the system environmental variables, the session manager performs essential tasks, like starting the Windows Subsystem. This implies that the Smss.exe is a native application (i.e., it relies exclusively on the Native API) because it executes before the subsystem that supports the Windows API is loaded. You can verify this by viewing the imports of Smss.exe with the dumpbin.exe utility.
Recall that the Windows subsystem has two parts: a kernel-mode driver named Win32k.sys and a user-mode component named Csrss.exe. Smss.exe initiates the loading of the Windows Subsystem by looking for a value named KMode in the registry under the key:
HKLM\SYSTEM\CurrentControlSet\Control\Session Manager\SubSystems\
The KMode value could be any kernel-mode driver, but most of the time this value is set to \SystemRoot\System32\win32k.sys. When Smss.exe loads and initiates execution of the Win32K.sys driver, it allows Windows to switch from VGA mode that the boot video driver supports to the default graphic mode supported by Win32k.sys.
After loading the Win32K.sys driver, Smss.exe preloads “Known” DLLs. These DLLs are listed under the following registry key:
HKLM\SYSTEM\CurrentControlSet\Control\Session Manager\KnownDLLs\
These DLLs are loaded under the auspices of the local SYSTEM account. Hence, system administrators would be well advised to be careful what ends up under this registry key (… ahem).
Now, the session manager wouldn’t be living up to its namesake if it didn’t manage sessions. Hence, during startup, Smss.exe creates two sessions (0 and 1, respectively). Smss.exe does this by creating two new instances of itself that run in parallel, one for session 0 and one for session 1.
Session 0: hosts the init process (wininit.exe).
Session 1: hosts the logon process (winlogon.exe).
To this end, the new instances of Smss.exe must have Windows subsystems in place to support their sessions. Having already loaded the kernel-mode portion of the subsystem (Win32K.sys), Smss.exe looks for the location of the subsystem’s user-mode portion under the following registry key:
HKLM\SYSTEM\CurrentControlSet\Control\Session Manager\SubSystems\
Specifically, Smss.exe looks for a value named Required, which typically points to two other values under the same key named Debug and Windows. Normally, the Debug value is empty, and the Windows value identifies the Csrss.exe executable. Once Smss.exe loads and initiates Csrss.exe, it enables the sessions to support user-mode applications that make calls to the Windows API.
Next, the session 0 version of Smss.exe launches the wininit.exe process, and the session 1 version of Smss.exe launches the winlogon.exe process. Having done this, the initial instance of Smss.exe waits in a loop and listens for local procedure call (LPC) requests to spawn additional subsystems, create new sessions, or to shut down the system.
One way to view the results of this whole process is with SysInternal’s Process Explorer tool, as seen in Figure 4.19. I’ve included the session ID and process ID columns to help make things clearer. Notice how both wininit.exe and winlogon.exe reside directly under their own user-mode subsystem component, Csrss.exe.
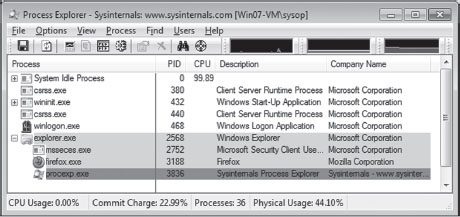
Figure 4.19
Wininit.exe
The Windows Init process creates three child processes: the local security authority subsystem (lsass.exe), the service control manager (services.exe), and the local session manager (lsm.exe). The local security authority subsystem sits in a loop listening for security-related requests via LPC. For example, lsass.exe plays a key role in performing user authentication, enforcing the local system security policy, and issuing security audit messages to the event log. The service control manager (SCM) loads and starts all drivers and services that are designated as SERVICE_AUTO_START in the registry. The SCM also serves as the point of contact for service-related requests originating from user-mode applications. The local session manager handles connections to the machine made via terminal services.
Winlogon.exe
The Winlogon.exe handles user logons. Initially, it runs the logon user interface host (logonui.exe), which displays the screen prompting the user to press CTRL+ALT_DELETE. The logonui.exe process, in turn, passes the credentials it receives to the local security authority (i.e., lsass.exe). If the logon is a success, winlogon.exe launches the applications specified by the UserInit and Shell values under the following key:
HKLM\SOFTWARE\Microsoft\Windows NT\CurrentVersion\Winlogon\
By default, the UserInit value identifies the userinit.exe program, and the Shell value identifies the explorer.exe program (Windows Explorer). The userinit.exe process has a role in the processing of group policy objects. It also cycles through the following registry keys and directories to launch startup programs and scripts.
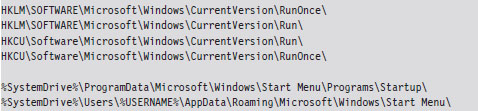
Boot Process Recap
In this section, we’ve run through dozens of binaries and configuration parameters. Unless you have an eidetic memory, like that Reid character from the television show Criminal Minds, much of what I presented may be lost in the ocean of details. Figure 4.20 depicts the general chain of events that occur, and Figure 4.21 displays the full file path of the major players. Take a minute or two to process these and then go back and re-read things.
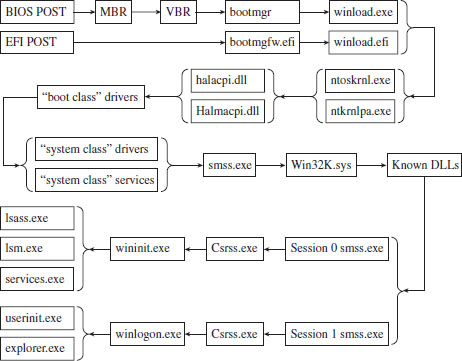
Figure 4.20
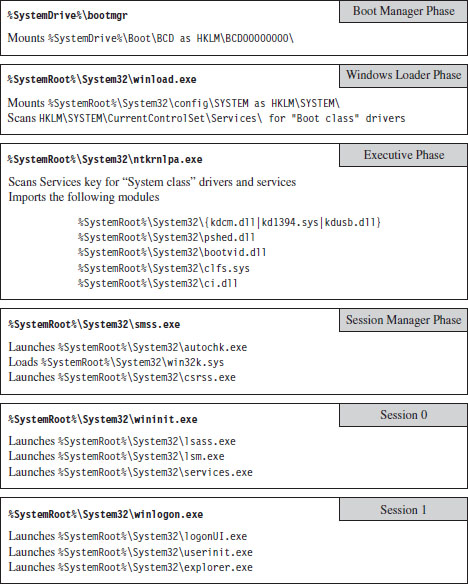
Figure 4.21
4.8 Design Decisions
Let’s rewind the film footage a bit to recall what led us to this point.
Earlier in this book, we saw how the goal of anti-forensics is to:
Leave behind as little useful evidence as possible.
Make the evidence that’s left behind difficult to capture and understand.
Plant misinformation to lure the investigator to predetermined conclusions.
In other words, we wish to minimize both the quantity and quality of forensic trace data.
Rootkit technology is a subset of AF that focuses on low-and-slow techniques to provide three services: C2, monitoring, and concealment. To implement a rootkit, you first need to decide:
What part of the system you want the rootkit to interface with.
Where the code that manages this interface will reside.
After studying the IA-32 family of processors, we know that segmentation provides four rings of privilege (Ring 0 through Ring 3) and that paging data structures support only two levels of access (user level and supervisor level). Though Windows relies almost exclusively on paging to implement the barrier between kernel space and user space, the segmentation terms Ring 0 and Ring 3 are often used to describe where code resides. I’ll fall back on this convention several times in this book as a matter of habit.
Now that we understand the distinction between user mode and kernel mode, we can address the previously stated design issues. The basic scheme that I’m going to use as a design framework was originally proposed by Joanna Rutkowska back in 2006.3 This taxonomy classifies offensive software into four categories (Type 0 through Type III) based on how it integrates itself into the target system (see Table 4.13).
Table 4.13 Types of Offensive Software
| Category | Interface to System | Location | Examples |
| Type 0 | Existing APIs | Rings 3, 0 | Filter driver, BHO, injected DLL/thread |
| Type I | Modified static components | Rings 3, 0 | Hooking, patching, bootkits |
| Type II | Modified dynamic component | Rings 3, 0 | DKOM, rogue callbacks |
| Type III | Outside of the system | Rings –1, –2, –3 | Rogue hypervisor, firmware mod |
Hiding in a Crowd: Type 0
At one end of the spectrum are rootkits that hide in plain sight by trying to blend in with the multitude of executing binaries. This is a classic strategy. It’s like a bad guy who tries to evade the cops on a foot chase down East 42nd Street by ducking into Grand Central Station during rush hour. In the roiling ocean of people, it’s easy to lose track of any one individual. God help you if the bad guy decides to hide in the restrooms in the East Wing of the terminal!
Type 0 rootkits rely exclusively on the existing system calls to function. This can speed up the development cycle significantly because you have access to all the bells and whistles of the Windows API and the driver support routines. They don’t alter any underlying system constructs, so this class of rootkits tends to be more stable and predictable.
Type 0 rootkits can thrive in an environment where harried system administrators are more focused on business needs than performing regular security assessments. The average Windows 7 install has more than a dozen instances of svchost.exe cranking away. The average SYSTEM process has somewhere in the range of 100 executive threads. There are plenty of hiding spots to leverage.
The downside to Type 0 rootkits is that standard forensic analysis was literally designed to smoke them out. Any code using the standard system APIs can be tracked and analyzed without much fuss. Relatively speaking, from the vantage point of an investigator it’s a cake walk. All it takes is sufficient familiarity with the target platform, a baseline snapshot, and the time necessary to do a thorough job. Once all of the known-good modules have been accounted for, Type 0 rootkits tend to stick out like a sore thumb.
Active Concealment: Type I and Type II
The efficacy of forensic analysis against the Type 0 approach forced rootkit architects to submerge themselves deeper. This led to Type I and Type II rootkits, which evade detection by instituting steps actively to conceal their presence. They do so by altering system-level data structures and code. The basic idea is to get the targeted system to lie to the investigator so that nothing seems out of place.
Early rootkits on UNIX often did nothing more than patch common system binaries on disk or replace them entirely with modified versions. In those days, this approach was feasible, and attractive, because AT&T licensed its source code along with the software. Hardware was so expensive that it subsidized everything else. Vendors pretty much gave away the system software and its blueprints once the computer was paid for.
A more sophisticated approach is to patch the image of a binary in memory. The benefit of this practice is that it avoids leaving the telltale marks that can be detected by offline checksum analysis. In the case of patching bytes in memory, you’ll have to decide whether your rootkit will target components that reside in user space or kernel space. Once more, you’ll also need to decide whether to target static objects or dynamic objects.
This leads us to the distinction between Type I and Type II rootkits. Type I rootkits hide by modifying static objects (e.g., procedure code, call tables, boot sector instructions). Type II rootkits hide by modifying system elements that are inherently fluid and constantly in a state of flux (e.g., kernel structures, callback tables, registry hives).
In general, modifying static information is more risky. This is because fixed values lend themselves to checksums and digital signatures. For example, machine instructions and address tables are fairly static, making them easier to take a snapshot of. Dynamic objects and structures, in contrast, were meant to change.
User space versus kernel space, and static versus dynamic: These four options create a matrix of different rootkit techniques (see Figure 4.22). In the coming chapters, I’ll examine a number of Gong Fu techniques that span this spectrum. Don’t panic if you see acronyms and terms that you don’t recognize, you’ll meet them all in good time. The basic path that I take will start with older, more traditional techniques and then move on to more contemporary ones.
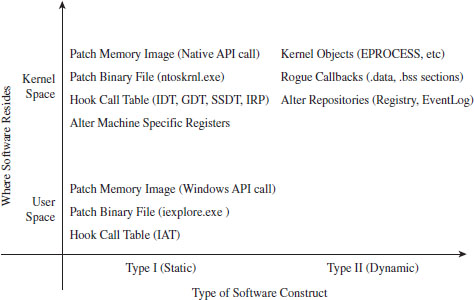
Figure 4.22
Jumping Out of Bounds: Type III
The modifications that allow a Type I or Type II rootkit to remain concealed can also be viewed as telltale signs by someone who knows what to look for. This dynamic has led to an arms race. As the Black Hats find a new concealment technique, the White Hats figure out what’s going on and find ways of detecting that the corresponding trick is being used.
As the arms race has progressed, and detection software has become more successful, rootkit architects have pushed the envelope for concealment by moving into special regions of execution on the periphery of the targeted system’s environment. In other words, attackers have found ways to jump out of bounds so that they don’t need to modify the target to achieve concealment.
This highlights a trend that has emerged. The system vendors devise new fortified areas specifically intended to shield code from subversion. For a while, this is all nice and well … until malicious code finds its way into these regions (at which point you essentially have the equivalent of an internal affairs division that’s gone bad).
In the war between offensive and defensive software, autonomy becomes the coin of the realm. The less you rely on the system, the smaller your footprint. The extreme expression of this strategy is a microkernel design where the rootkit doesn’t use any of the services provided by the OS proper. It runs without assistance from the targeted system, communicating directly with the hardware, relying entirely on its own code base. In this case, nothing will be gleaned from reading the event logs, and no traces of the rootkit will be unearthed by analyzing the operating system’s internal bookkeeping data structures. This is because nothing in the OS itself has been modified.
Over the years, related technology has matured, and rootkits that execute in Ring –1 (hypervisor host mode), Ring –2 (SMM), and Ring –3 (the Intel AMT environment) have appeared (see Figure 4.23). As the path of program control submerges into the lower rings, it becomes more entangled with the intricacies of the native chipset and much harder to detect.
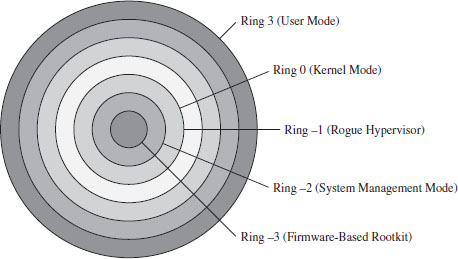
Figure 4.23
Thus, it should come as no surprise that the major-league players (the ones funded by a national budget) have gone all the way down into the hardware, placing back doors at the circuit level. Scan with anti-virus software all you want, it will do little to protect against this sort of embedded corruption.
The problem with Type III rootkits is that they’re extremely hardware dependent. You’re essentially writing your own little OS with all the attendant driver code and processor-specific niceties.
The Road Ahead
Once the requisite design decisions have been made, the development process can continue. But before we can implement, we need to become familiar with the tools we have at our disposal. Rootkits often reside in kernel space to leverage Ring 0 privileges. This will entail wielding a bunch of tools normally reserved for that obscure community of engineers who build Windows device drivers. I’ll spend the next two chapters on this sort of material.
1. http://msdn.microsoft.com/en-us/library/aa366778%28v=VS.85%29.aspx.
2. http://vreugdenhilresearch.nl/Pwn2Own-2010-Windows7-InternetExplorer8.pdf.
3. Joanna Rutkowska, Introducing Stealth Malware Taxonomy, COSEINC Advanced Malware Labs, November 2006, http://invisiblethings.org/papers/malware-taxonomy.pdf.