Table of Contents for
Designing for How People Think
 Designing for How People Think
Published by
O'Reilly Media, Inc., 2019
Designing for How People Think
Published by
O'Reilly Media, Inc., 2019
- Cover
- Title Page
- Copyright
- 01 Rethinking "The" Experience
- 02 The Six Minds of User Experience
- 03 In the Blink of an Eye- Vision, Attention, and Automaticity
- 04 Wayfinding- Where Am I?
- 05 Memory:Semantics
- 06 Language- I Told You So
- 07 Decision-Making and Problem Solving- Enter Consciousness Stage Left
- 08 Emotion- Logical Decision Making Meets Its Match
- 09 User Research- Contextual Interviews
- 10 Vision- Are You Looking at Me?
- 11 Language- Did They Just Say That?
- 12 Wayfinding- How Do You Get There?
- 13 Memory- Expectations and Filling in Gaps
- 14 Decision-Making - Following the Breadcrumbs
- 15 Emotion- The Unspoken Reality
- 16 Sense-Making
- 17 Putting the Six Minds to work- Appeal, Enhance, Awaken
- 18 Succeed Fast, Succeed Often
- 19 Now see what you’ve done?
- 20 How To Make a Better Human
- 20 How To Make a Better Human
We have collected data from some contextual inquiry interview. That data has been sorted into our Six Minds framework. Now to our next major goals:
- ● Look for commonalities amongst dimensions of the Six Minds (e.g., level of expertise, or feelings of anxiety).
- ● Segmenting users that differ in their needs (e.g., novices vs. experienced professionals, supervisors vs. analysts, parents vs. children), segmenting the audience by relevant dimensions (e.g., word usage, micro-goals, underlying assumptions).
We’ll end this chapter with a few notes about another system of classification (See, Feel, Say Do) and why I believe it fails to organize the data in a way that is most helpful for change.
Signal to noise: Affinity diagrams
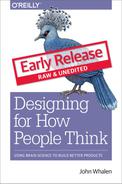
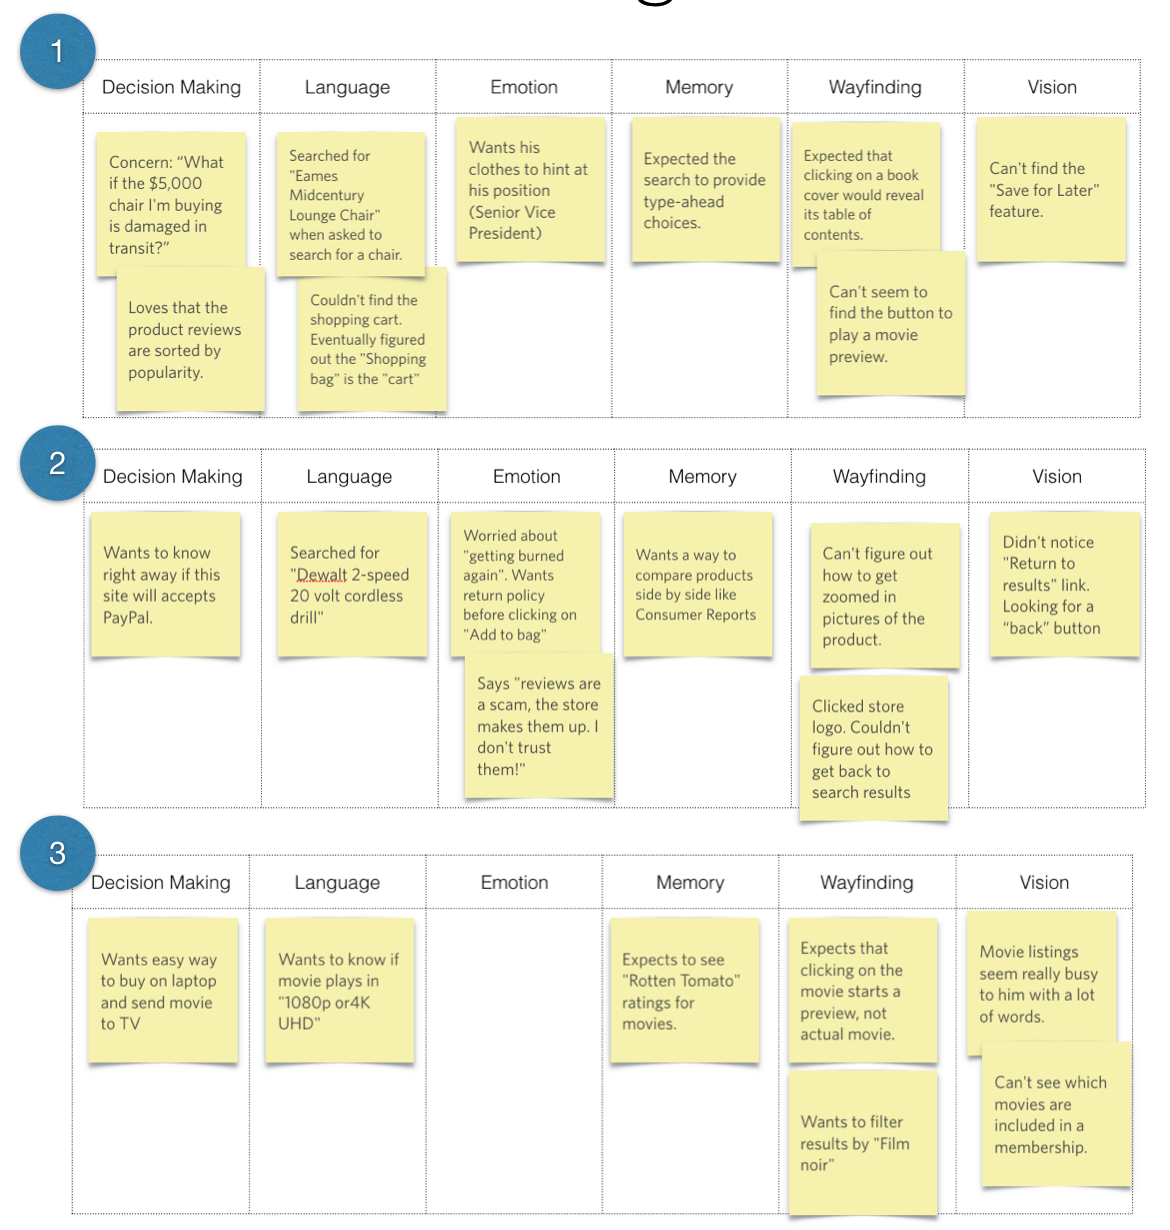
Using our Six Minds framework, let’s review our five participants from Part 2. We have all our sticky note findings grouped by participants and by the Six Minds. Now it’s time to look at these findings and see if there are any relationships between them or any underlying similarities in how these individuals are thinking.
16.1
Language
16.2
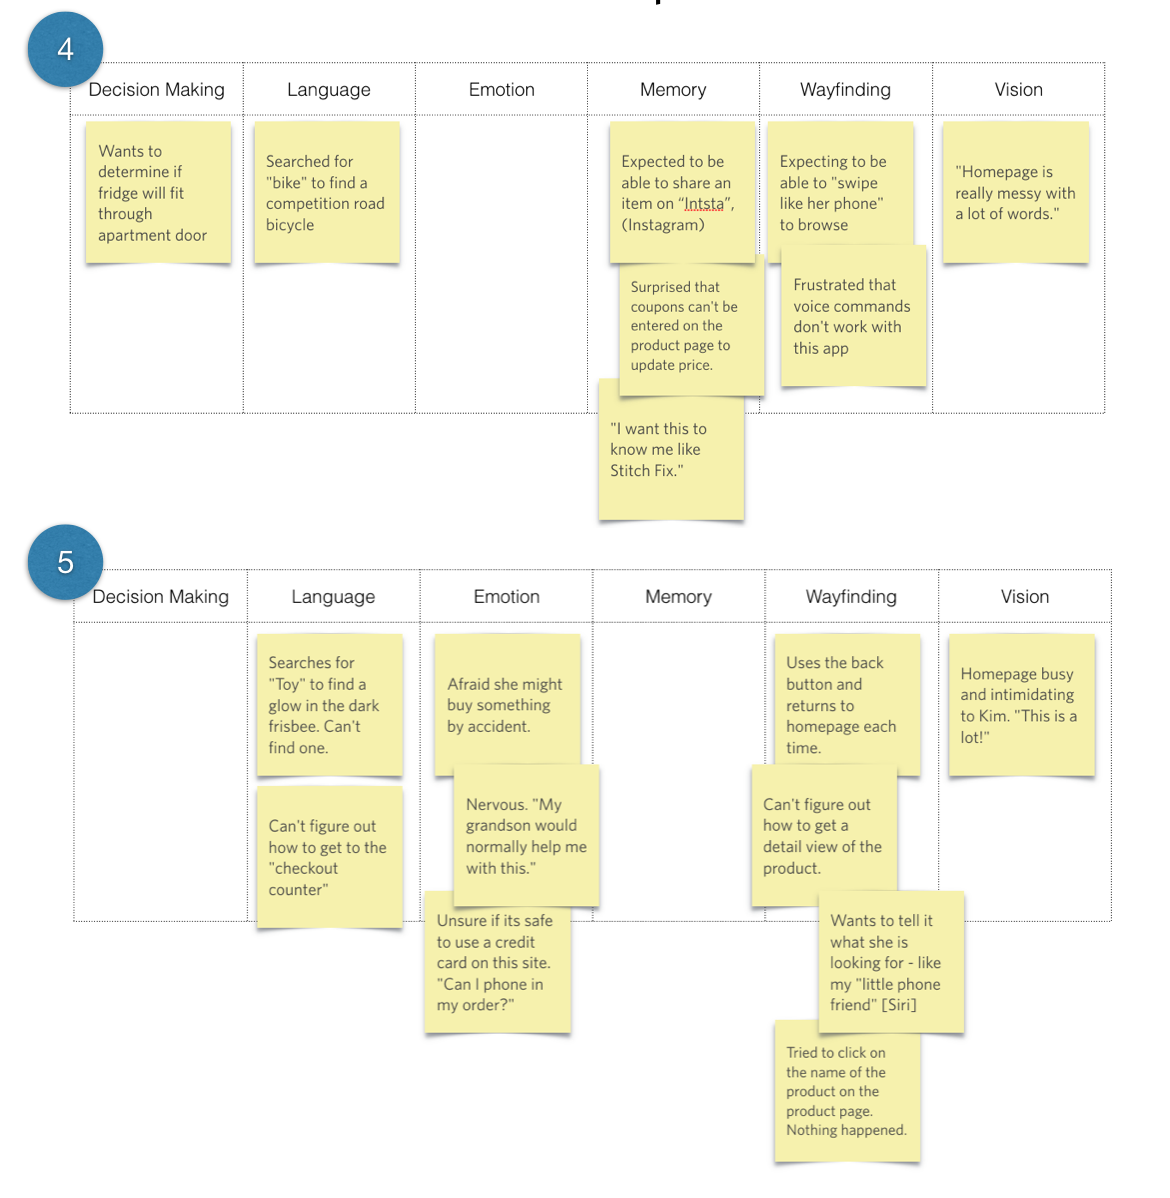
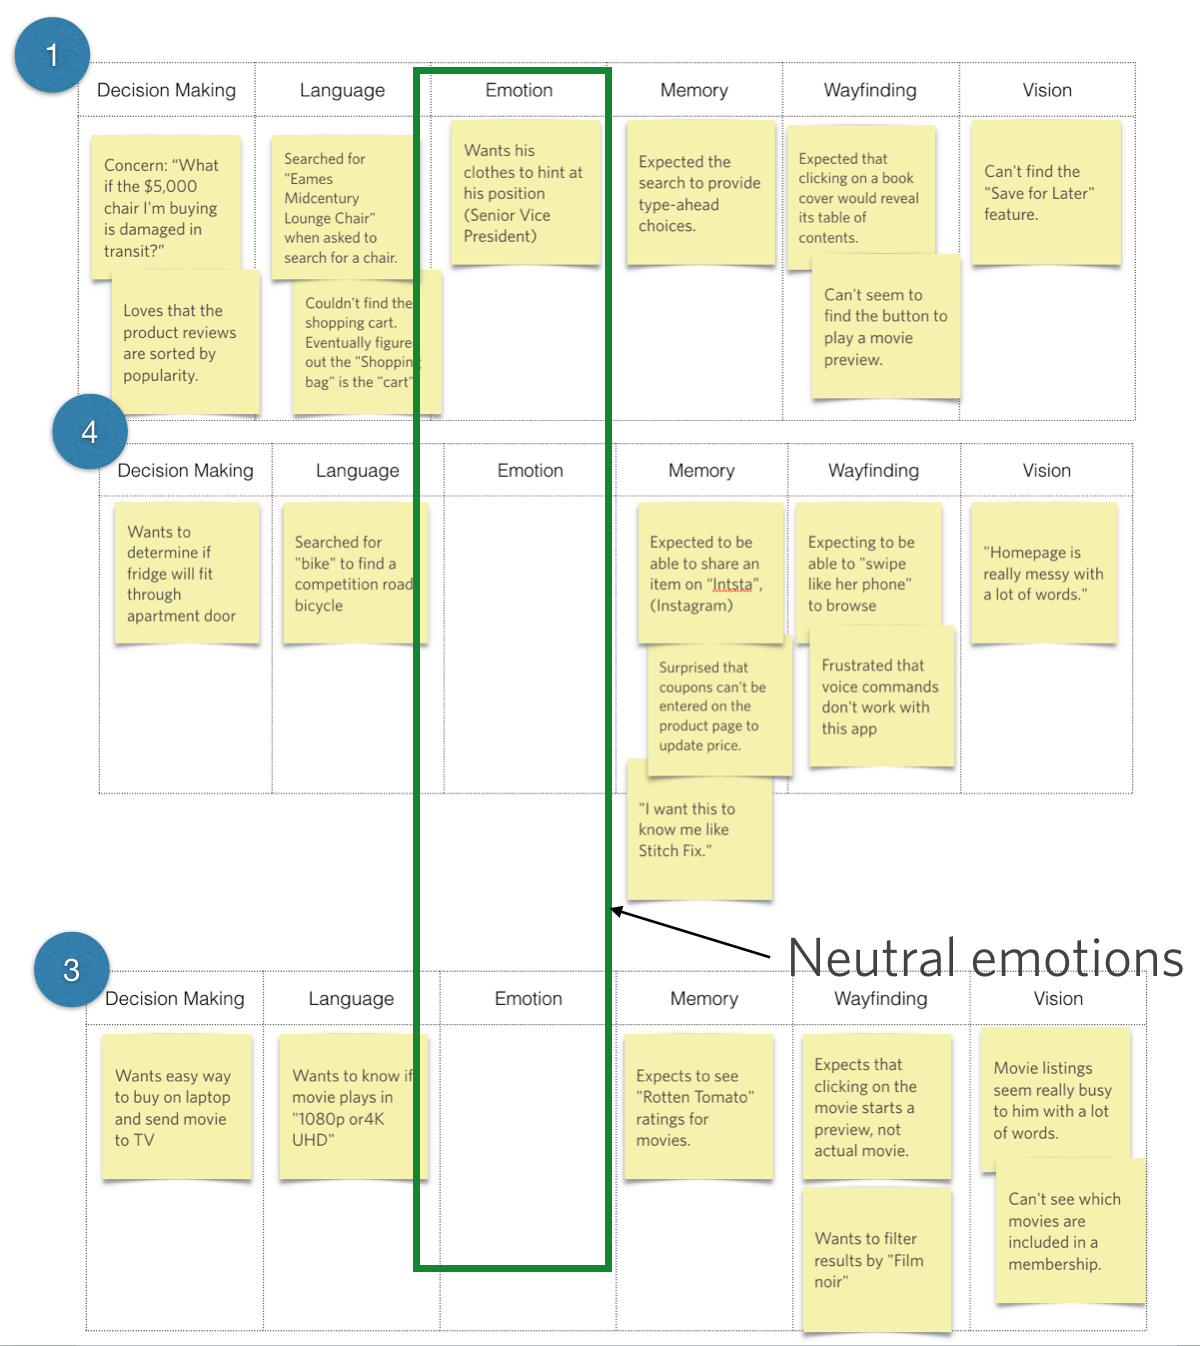
Looking at the column for Language, I see that Participants 1, 2, and 3 are all saying things like “Eames Midcentury Lounge Chair,” or “DeWalt 2-speed, 20-volt cordless drill,” or “1080p or “4K UHD.” While they’re searching for very different things, these three participants seem to have pretty sophisticated language for what they’re talking about. They seem to be more like experts, if not professionals, in their particular fields, and are very knowledgeable in the subject matter.
16.3
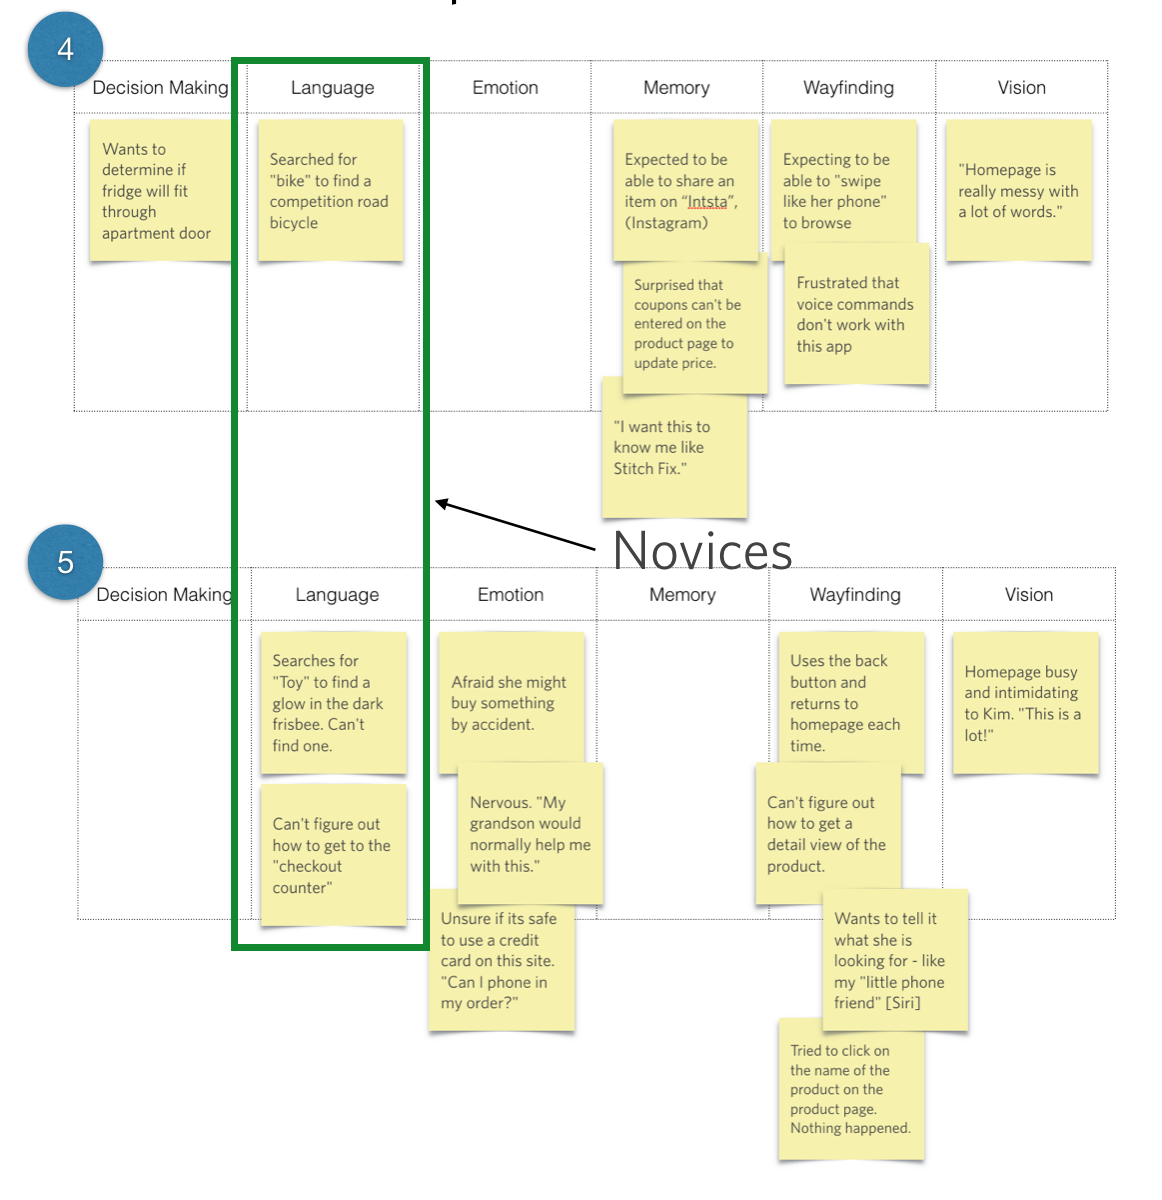
In contrast, it looks like Participant 4 searched for a “bike” while looking for a competition road bike. Participant 5 searched for a glow-in-the-dark Frisbee by typing in “toy.” Participant 5 also talked about getting to the “checkout counter,” rather than an “Amazon checkout” or “QuickPay,” or something else that would suggest more knowledge of how the online shopping experience works.
Just by looking at language, we see that we’ve got some people with expertise in the field, and others who are much more novices in the area of e-commerce. Moving forward, it might make sense to examine how the experts approach aspects of the interface, vs. how the novices approach those same aspects, and see if there are similarities across those individuals.
This is just a start, though. I don’t want to pigeonhole anyone into just one category, because ultimately I’m trying to find commonalities on many dimensions. Using a different dimension or mind, I could look at these same five people in a very different way.
Emotion
16.4
16.5
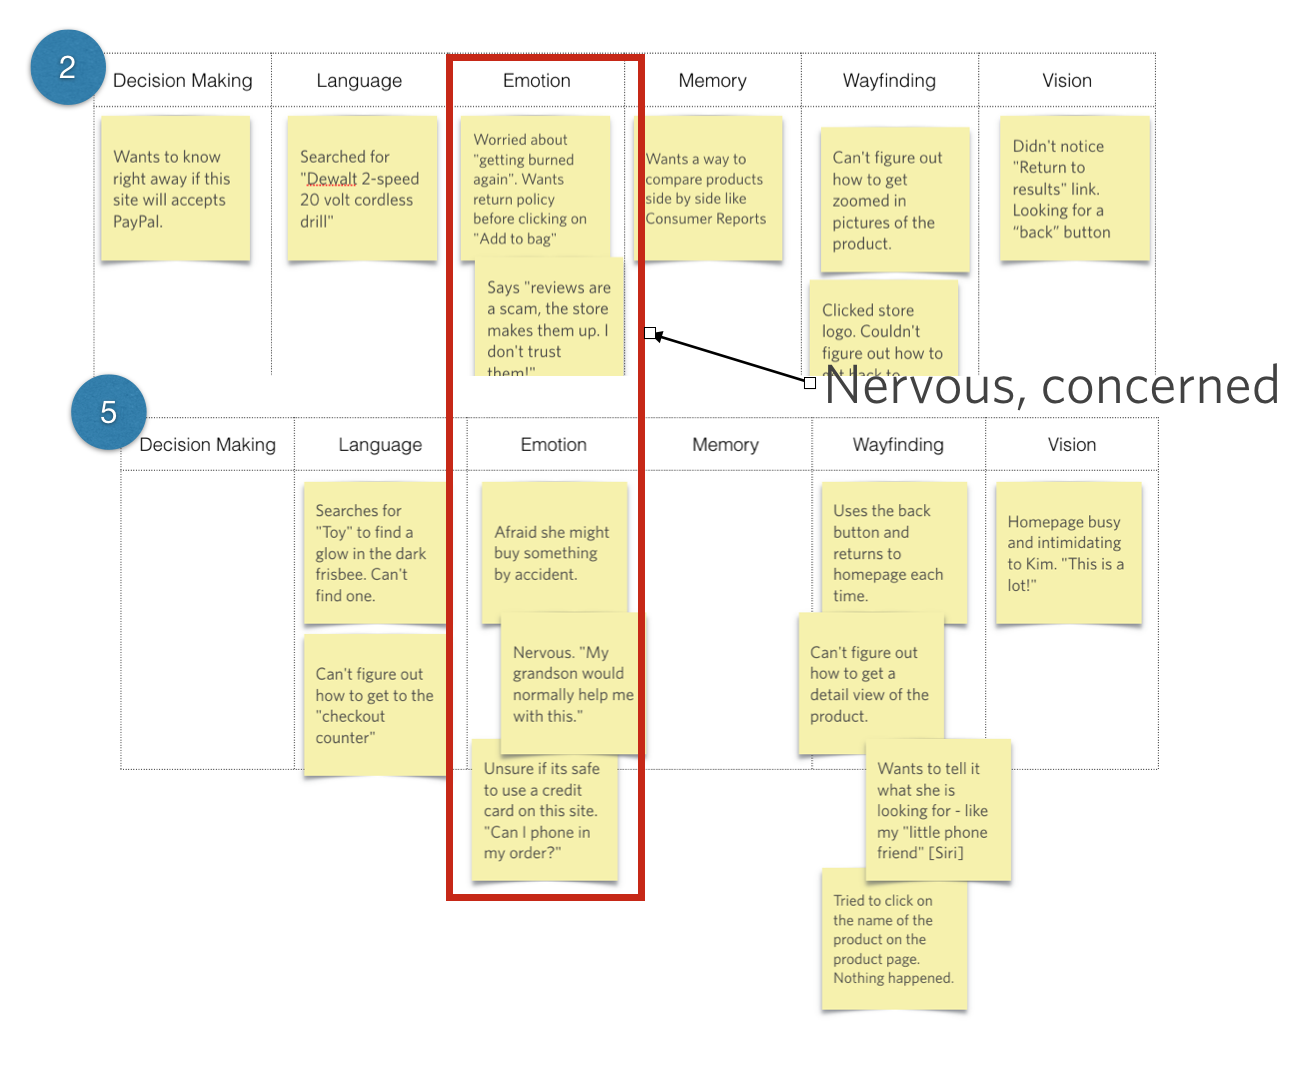
Let’s take emotion. Looking across these five people, we see that Participants 2 and 5 both seemed pretty concerned about the situation, and were afraid that something bad might happen or that they would “get burned again.” We’re definitely seeing some uncertainty and reticence to go ahead and take the next step because they’re worried about what might happen. These folks might need some reassurance. Participants 1, 3, and 4, on the other hand, aren’t displaying any of that emotion or hesitation.
Could there be other areas in which 2 and 5 are also on the same page? Maybe there are similarities in how they do wayfinding, or the information they’re looking for, as opposed to 1, 3, and 4, who seem to be going through this process in a more matter-of-fact way.
Using different dimensions, we can look at people and see how we might group them. Ideally, we would hope to find these similarities across multiple dimensions. I’m using a tiny sample sample size for the sake of illustration in this book, but typically, we would be looking at this with a much broader set of data, perhaps 24 to 40 people (anticipating groups of 4-10 people depending on how the segments fall out).
Wayfinding
16.6
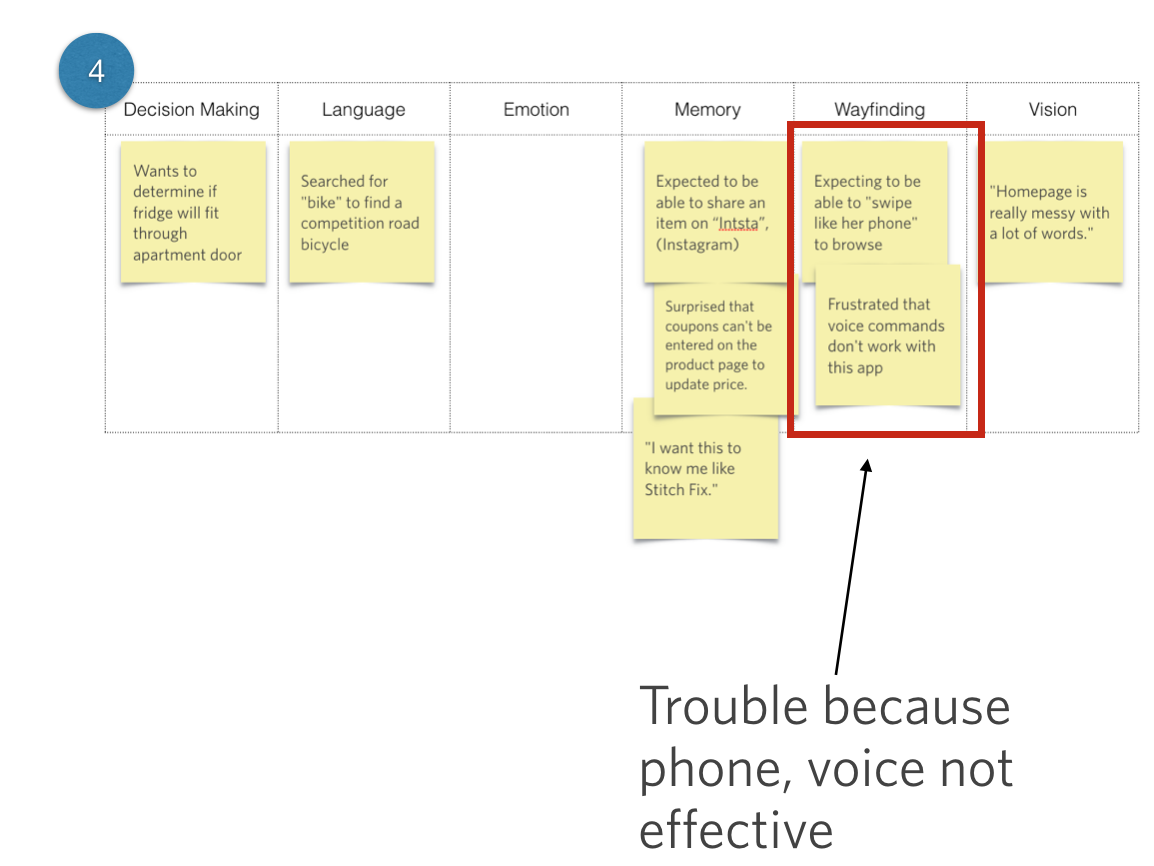
16.7
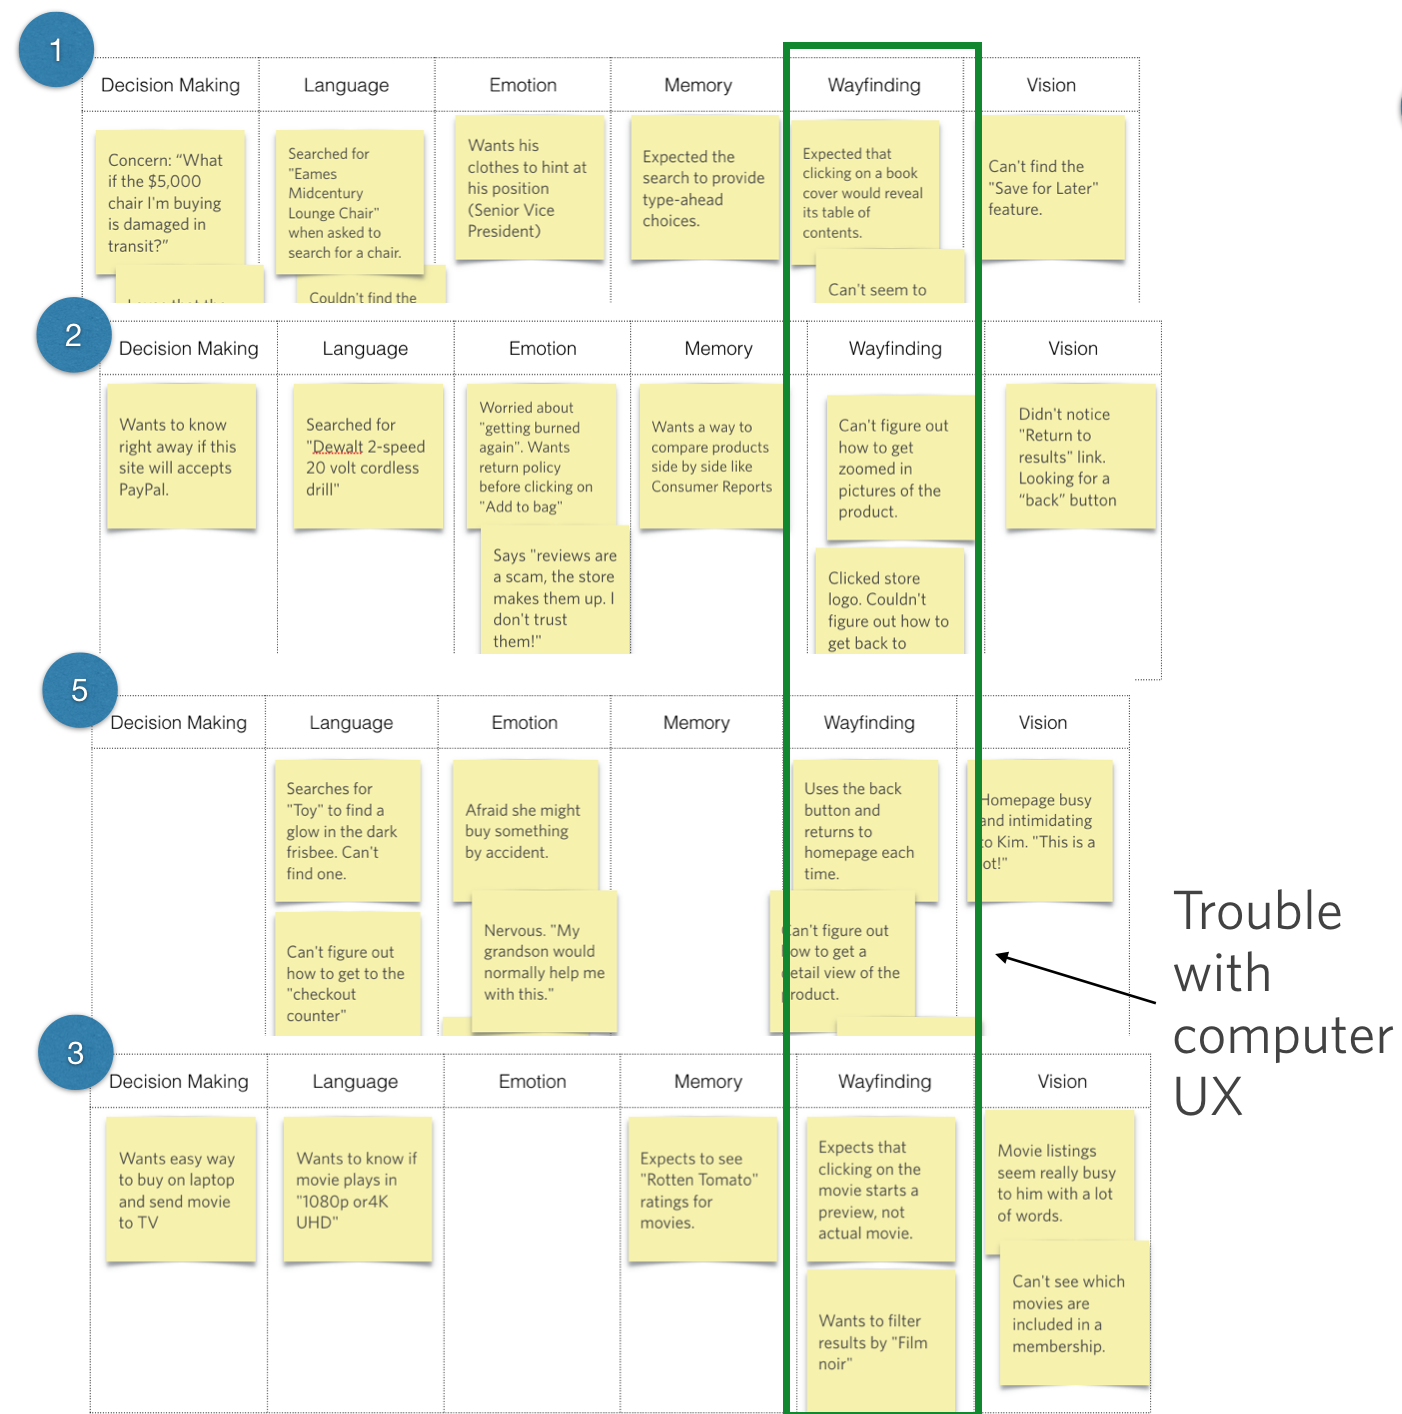
When we look at wayfinding, we see that Participants 1, 2, 3, and 5 all had problems with the user experience or the way that they interacted with a laptop. Participant 4 approached the experience very differently, expressing a desire to be able to “swipe like her phone” or to use voice commands. This participant seems far more familiar with the technology, to the extent that she has surpassed it and is ready to take it to the next level. From the Wayfinding lens, we see that our participants are looking at the same interface using varied tools and with varied expectations in terms of their level of interaction design and sophistication.
That’s just three ways we could group this batch of users. We’ll talk in a moment about which one makes the most sense to pick. But first, a note on subgroups.
Sometimes — and actually, it’s pretty common — it might be really obvious to you that certain people are of one accord and can be grouped together. Other times, you may see some commonalities among a subgroup, but there’s no real equivalent from the others.
Memory
16.8
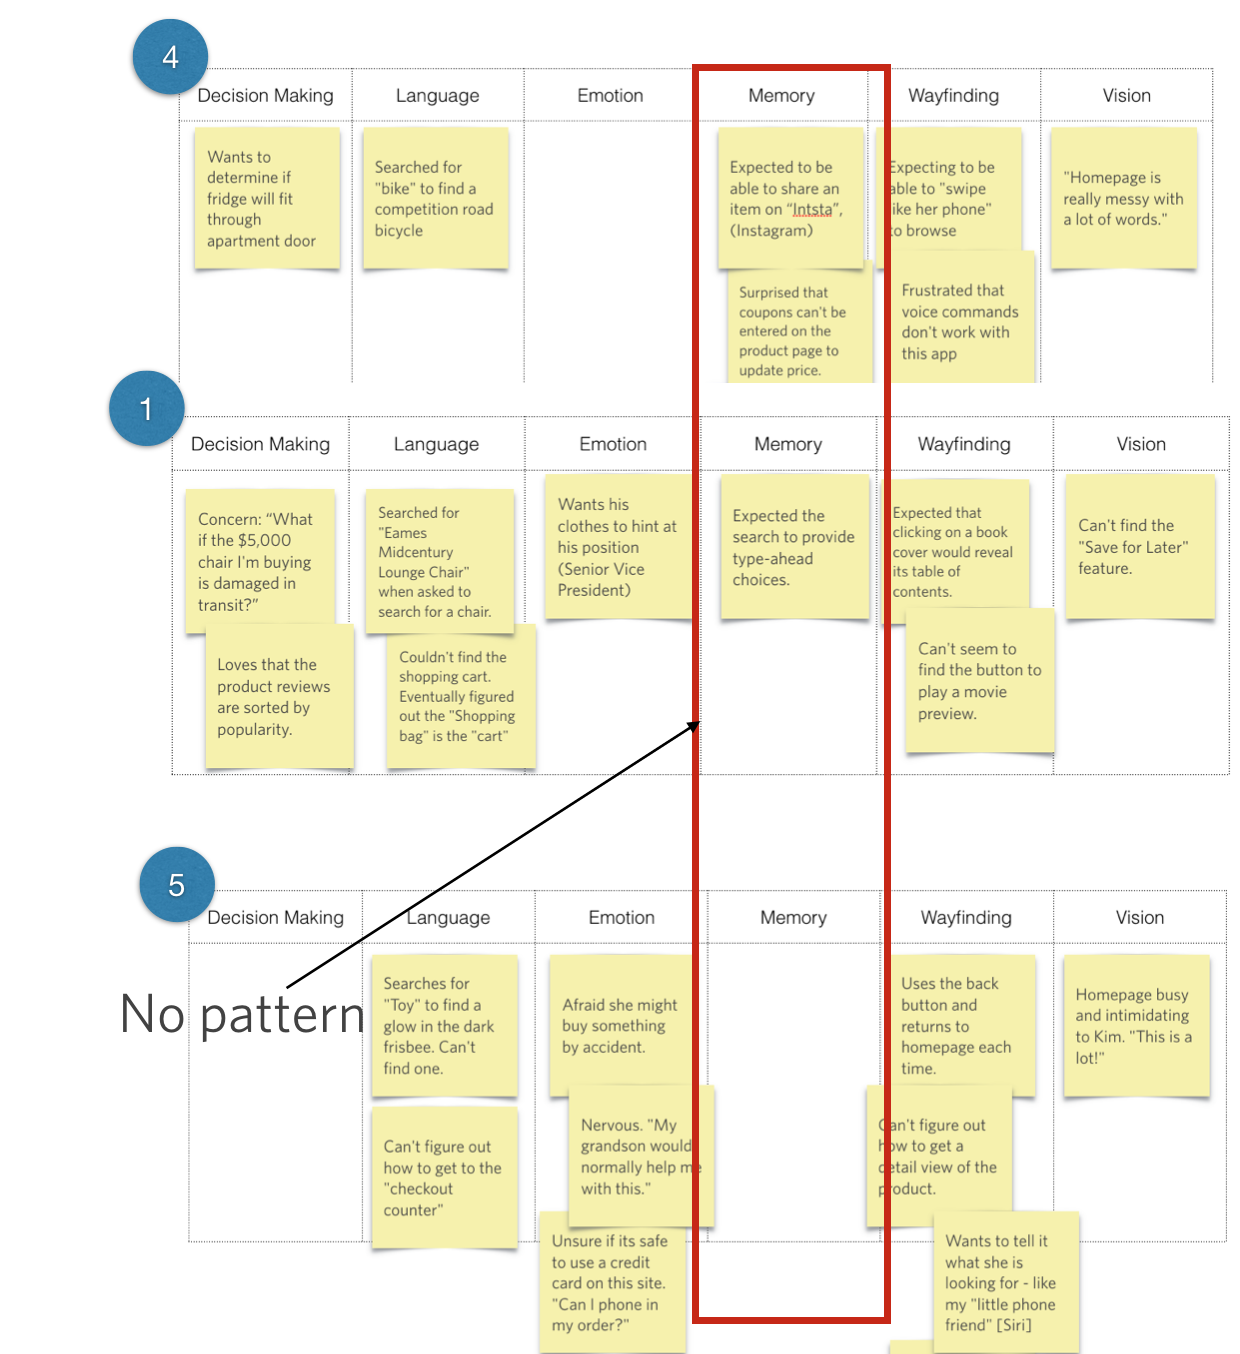
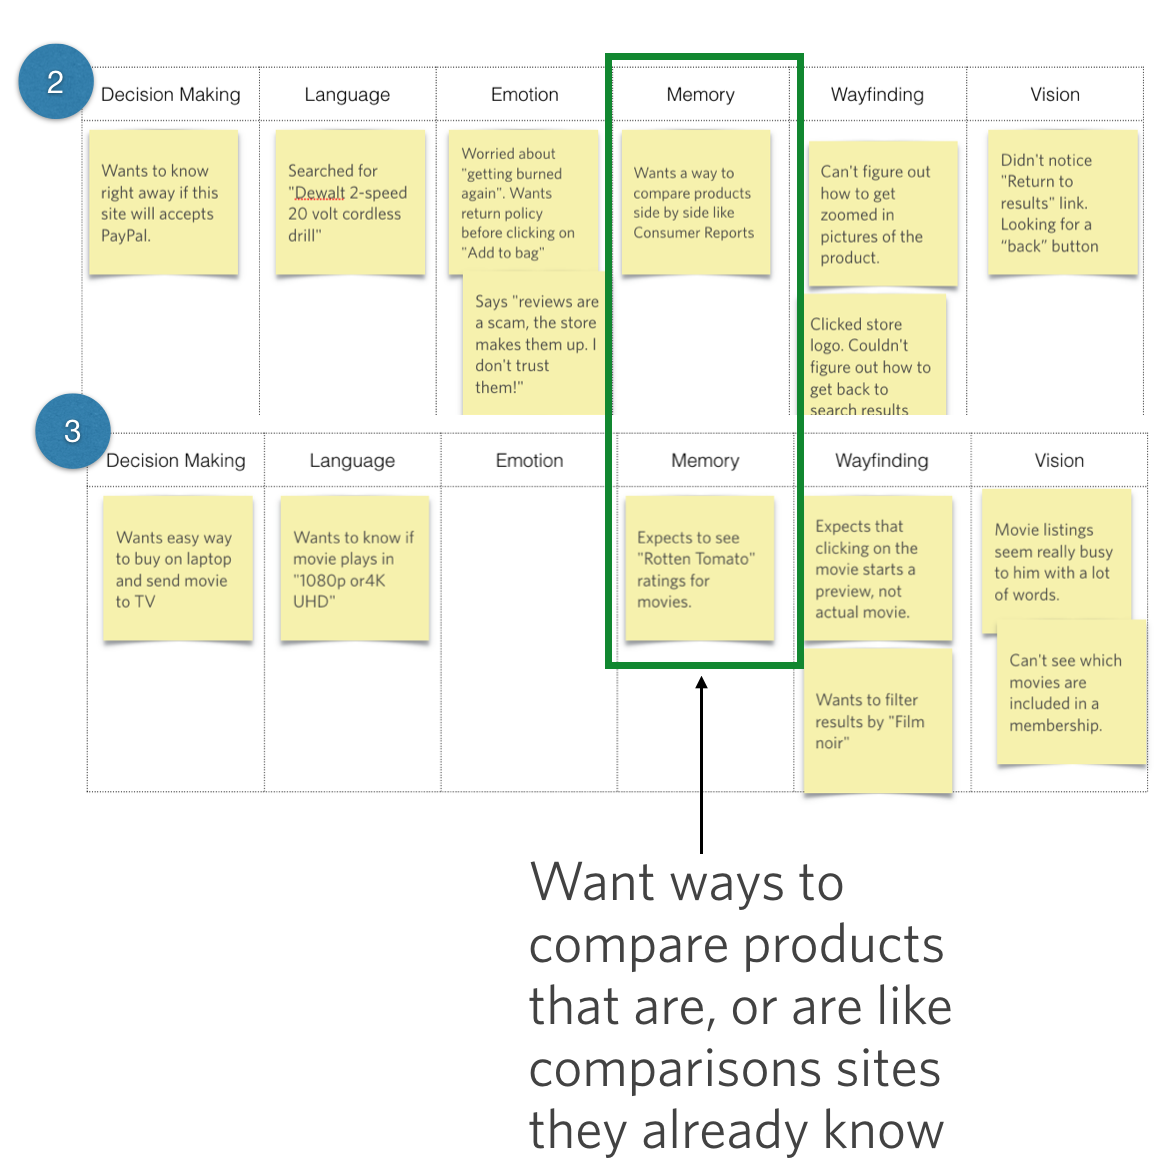
16.9
In the Memory column, for example, we see that Participants 2 and 3 both had a interesting way that they wanted to see comparisons or ratings, which is something we don’t see at all from the other folks. Because there’s no strong equivalent from the others (e.g., sophisticated/not sophisticated, or hesitant/not hesitant), I would label this commonality as interesting, but maybe not the best way to group our participants.
Now if there’s a subgroup that has a relevant attribute we want to identify, it’s fine to recognize that subgroup. Most of the time, however, we want to identify those fundamentally different types of audiences. With this broader type of audience segmentation, I don’t typically spend too much time on subgroups because then I end up with a lot of “Other” categories. Ideally, we want to place our participants into one of each distinct group.
Finding the dimensions
I think the best way to show you the audience segmentation process is through real-life example. With the three case studies that follow, I’ll show you just one grouping per data set, to give you a taste of the kinds of things we might produce.
Case Study: Millennial Money
16.10
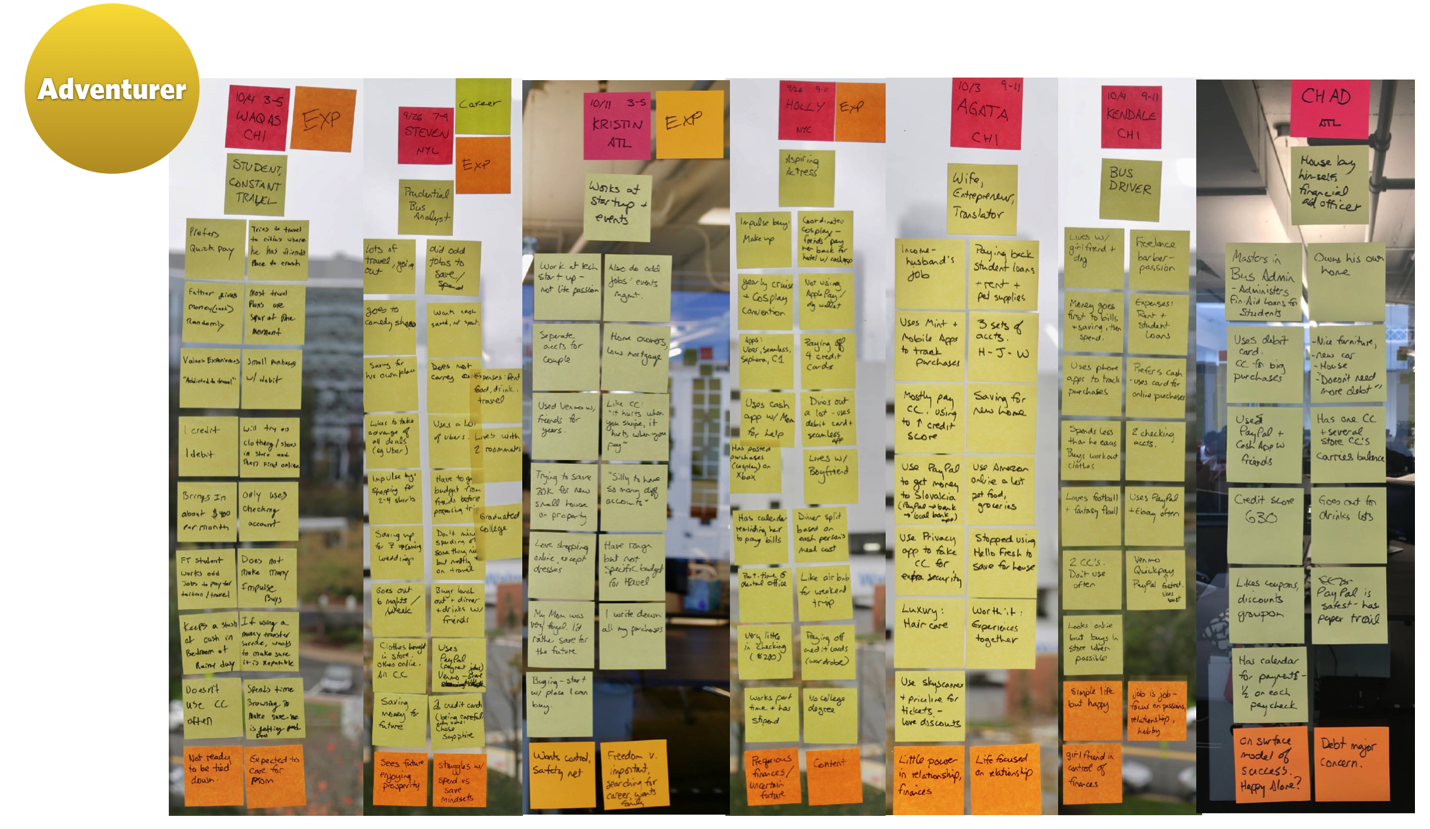
When working with a worldwide online payments system (you’ve heard of it), we performed contextual interviews with Millennials, trying to understand how they use and manage money and how they define financial success.
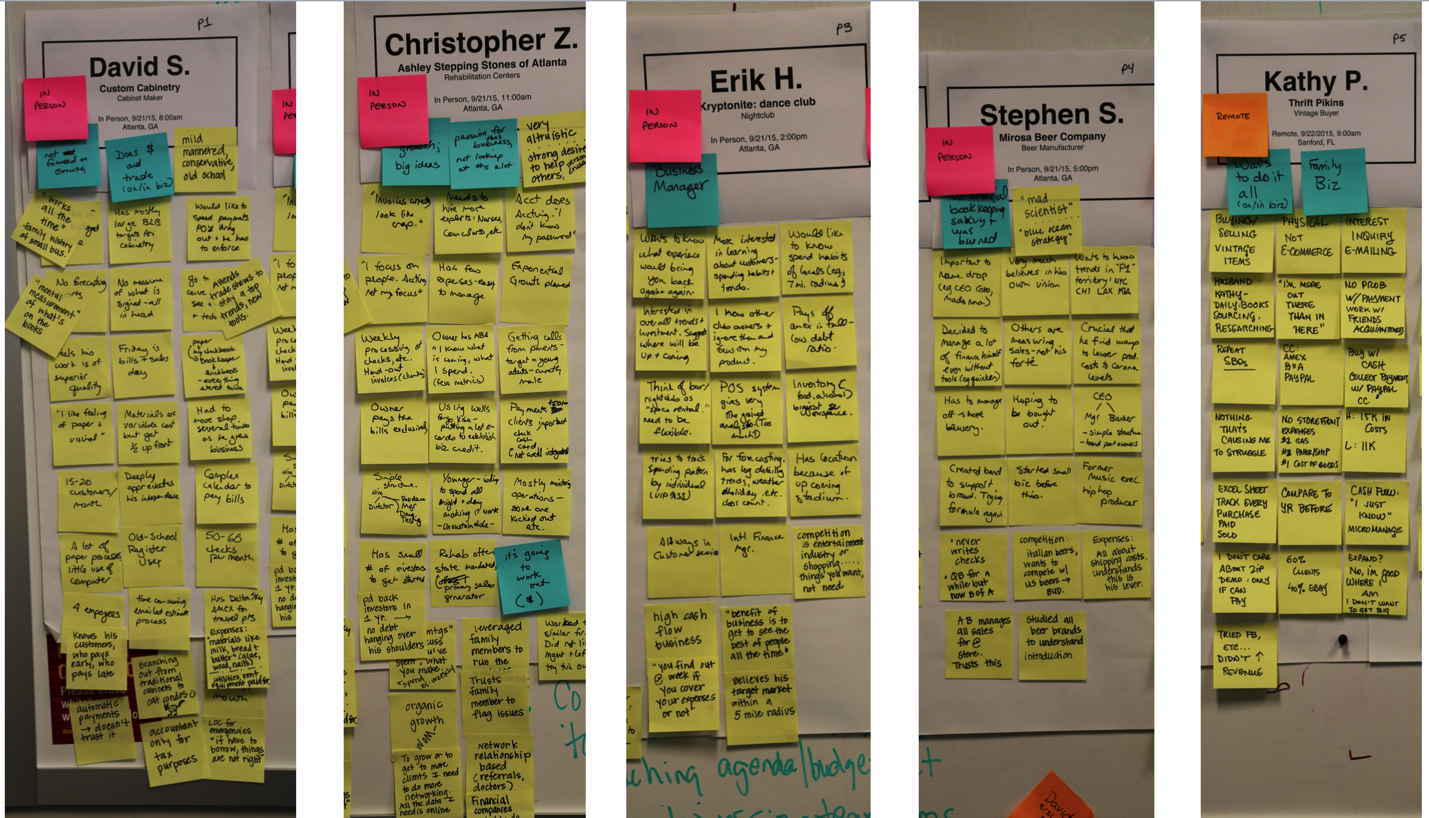
Like you saw before, these sticky notes represent real-life cases of people we met with. Once again, the question is: “How would I organize these folks?” This picture shows all the notes sorted by person for a handful of the participants (not obvious is that they were divided into the Six Minds as well).
One subset of the participants studied had the commonality of a life focused on adventure. Their desired lifestyle dramatically affected their decision-making about money — from saving just enough, to immediately use that money for their latest Instagram-ready adventure. We saw that what made these participants happy, and their deepest goal (Emotion), was to have new experiences and adventures. They were putting all their time and money into adventures and travel. Ultimately, what was really meaningful to them at that deep emotional state was experiences, rather than things.
Another observation that falls within Emotion is that the participants weren’t really defining themselves by their job or other traditional definitions (e.g., “I’m an introvert”); instead, they seemed to find their identity in the experiences they wanted to have.
Socially speaking, these people were instigators, and tried to get others to join them in their adventures. New possibilities, and offers of cheap tickets for which they knew the ticket codes (language) easily attracted their attention (attention!). They were masters of manipulating social networks (Instagram, Pinterest) to learn about a new place (wayfinding).
Using the Six Minds framework, I think we saw several things in these participants (remember, this was on behalf of that big online payments system, so we were particularly interested in groupings related to how this group managed their money):
- 1. Decision-making: They weighed every money-related decision against their goal of having new experiences. Their level of commitment to long-term financial planning was just not there because they were focused on living in the moment.
- 2. Emotion: Maximizing their adventure-readiness was paramount, and anything that got in the way of that happiness was seen as negative. Because of their underlying goal, they were fearful of the idea of a traditional 9-to-5 job, which would limit their ability to pursue this kind of travel.
- 3. Language: They had amazing vocabulary and knowledge of travel sites, and airline specials — even the codes for airfares (did you know airfares have codes?). They spoke the lingo of frequent flier miles, baggage fees and rental cars because they were experts in travel.
That’s an example of one audience. We looked at other audiences for that study, but I just wanted to give you a feeling for that grouping and how we mostly used decision-making, emotion, and a bit of language as the key drivers for how we organized them. Other dimensions, like the way that they interacted with websites (wayfinding) or their underlying experiences and the metaphors they used (memory) just weren’t as important as that central concept that they organized their life around. So that was how we decided to group them.
This is pretty common. With audience segmentation, bigger-picture dimensions, like decision-making and emotion, tend to stand out more than the other Six Minds dimensions. If you’re study is focused on an interface-intensive situation, like designers using Adobe Photoshop for example, you might find groupings that have more to do with vision or wayfinding, but that’s less common.
Case Study: Small Business Owners
16.11
In this case, we once again started with our findings organized by participants, in this case small business owners. Per usual, we separated those findings into our Six Minds.
We soon saw that two fundamentally different types of small business owners stood out:
- 1. Passionate Producers. These folks loved their craft. They loved creating products.They weren’t too focused on the money making part of their business.
- 2. Calculating Coordinator. This group were natural-born managers. Understanding spreadsheets, tracking time, anticipating future needs, and ensuring they had necessary cash flow were just a few of their strengths.
Like with the previous case study, these distinctions came through mostly through looking at how the participants approached decision-making, emotion, and language.
Passionate Producers
The “Passionate Producers,” as we called them, had a very emotional decision-making approach. One participant, a woodworker, was so passionate about delivering an amazing product (emotion) that he was willing to pay for better wood than he had budgeted for (decision making). He wasn’t too concerned with the bottom line (attention), and assumed the money would work out. Others in this grouping were so excited about their product that they weren’t worried about taking out huge loans.
A wedding planner that I’ll call Greg was a great example of this. He loved the work of making an amazing wedding. He “spoke wedding fluently” (language) and had an incredibly sophisticated language when it came to things like icing on the cake (literally). Everything he did was focused on making the day beautiful for the bride (memory), using the very best possible materials, and ensuring his clients (all of whom he knew intimately) were thrilled (emotion - his in receiving thanks for his work). He was most fearful of having an embarrassing wedding that the client was dissatisfied with (emotion). He didn’t focus much on record-keeping (attention). He had receipts in an envelope from his team, and didn’t always know which clients they went with (decision making). He struggled with tracking his cash flow and at the end of the day, but was proud of his work, and valued the praise and prestige he received through it.
Calculating Coordinators
Our “Calculating Coordinators,” on the other hand, are not concerned with how the cake looks or the best type of doily to go under a vase (attention). They were much more analytical in their decision-making, and were concerned with the financial viability of the business (decision making). They were much more concerned with what was in the checking account than what the end product looked like, or what their customers thought. Emotion and underlying motivations were still there; they were just different. For these folks, they were driven by their love of organizing, managing, and running companies (emotion).
Someone I’ll call Leo ran several businesses. He didn’t talk about the end products or the customers once, but he knew the back-office side of his business like, well, nobody’s business (attention, memory). More than anything, he loved managing, making decisions, and collecting data (decision making). He spoke fluent business, and used language that demonstrated his expertise in all the systems involved in running these companies. His vocabulary included things like the “60-day moving average of cash” and the “Q ratio” for his companies (language). He also spoke the language of numbers, rather than the language of marketing or branding. He was terrified of a negative profit margin (emotion).
To sum up
To segment these small business owners, we looked at how they are framing decisions (decision making), what means the most to them (emotion), and the language they’re using (language). Together, these three dimensions provided a lasting and valuable method of segmenting the audience and identifying potential products for each.
Case Study: Trust in credit
The last case here concerns a study we did on behalf of a top 10 financial company (you’ve heard of it as well). We studied how much people know about their credit scores and how they’re affected by them. We also wanted to gauge their overall knowledge about credit and fraud.
In this case, I’m only going to show you one persona, but I wanted to say that we found several types of groups. Let’s consider one particular group, who were Fearful & Unsure. For them, financial transactions were tied to so much emotion, much more than is typical of the average individual. One woman we’ll call Ruth was incredibly embarrassed when her credit card was denied at the grocery store because someone had actually stolen her identity. This led to feelings of anxiety, denial, powerlessness, fear, and being overwhelmed.
In this audience segment, people like Ruth were motivated to just hide from the issue (emotion). Unlike other people who were inspired to take action and learn about credit to protect themselves, this segment was too shell-shocked to take much action (decision making). They tried to avoid situations where it could happen again, and were operating in a timid defense mode, rather than offense (attention). This Fearful & Unsure group didn’t consider themselves credit-savvy, which was consistent with the language they used to speak about credit issues (language).
What’s driving these personas is their emotional response to a situation involving credit, resulting in a unique pattern of decision-making, the language of a novice, and being inattentive to ways to reduce their credit risk in the future. Together, those dimensions defined these different groups.
Challenging internal assumptions
In the examples above, you saw how I’ve used more complex cognitive processes like decision-making, emotion, and language to segment audiences across an industry or target audience pool. In many cases, you might have a boss or a manager who’s used to doing audience segmentation in a different way (e.g., “We need people who are in these age-ranges, or these socio-economic brackets, or have these titles”). I want you to be ready to challenge some of these historical assumptions.
Especially if your analysis seems to contradict some of the big patterns from yesteryear, be prepared to receive some flack. Don’t be afraid to say that “No, our data is actually inconsistent with that” — and point to the data! Go ahead and test the old assumptions to see if they’re still valid anymore.
When possible, try to get a sample that’s at least 24 people. If you can get a geographically dispersed or even linguistically diverse sample, even better. All of these considerations are ammunition to help you answer the question “Was this an unusual sample?” When you have a large, diverse sample, you can say, “No; this is well beyond one or two people who happen to think in this way,” and claim it as a broader pattern.
At times, you’ll need to do this not only with the outdated notions of colleagues, but also with your own preconceived ideas. Sometimes the data we find challenges our own ideas and ways of organizing material. In these cases, I urge you to make sure that you’re representing the data accurately, and not from the lens of presupposition.
Back in Chapter 8, I challenged you to approach contextual inquiry with a “tabula rasa” (clean slate) mentality. Leave your assumptions at the door and be open to whatever the data says. The same goes for audience segmentation. As best you can, try not to approach the data with your own hypotheses. We know statistically that people who say “I know that X is true” are looking for confirmation of X in the data, as opposed to people who are just testing out different possibilities. Be the latter type of analyst. Be open to different possibilities.
Always try to negate the other possibilities, as opposed to only looking for information that confirms your hypothesis. Look carefully at the underlying emotional drivers for each person. How are they moving around their problem space, and what are they finding out? What are the past experiences that are affecting them, and do the segments hinge on those past experiences?
In the case of the small business owners, we went back and forth a lot on what the salient features were for audience segmentation. There was the fact that they problem-solved from two very different perspectives. There was the language and sophistication level factor, which also differed greatly based on the subject matter (e.g., craft expertise vs. business expertise). There were several patterns we were seeing. To land on our eventual segmentations, we had to test each of these patterns across our audience segmentations and make sure those patterns were really borne out across the data.
And when possible, try to organize your participants by the highest-level dimension possible. Even though you may start out by the surface level observations, try to go deeper to get at those drivers and underlying vision. As a psychologist, I give you permission to dig deeper into the psyche — into the big, bold emotional state that influences the way they make decisions.
Ending an outdated practice: See/Feel/Say/Do
If you are familiar with empathy research, you may have heard of a See/Feel/Say/Do chart. These charts are popular with many groups looking for a mechanism to develop empathy for a user.
16.12
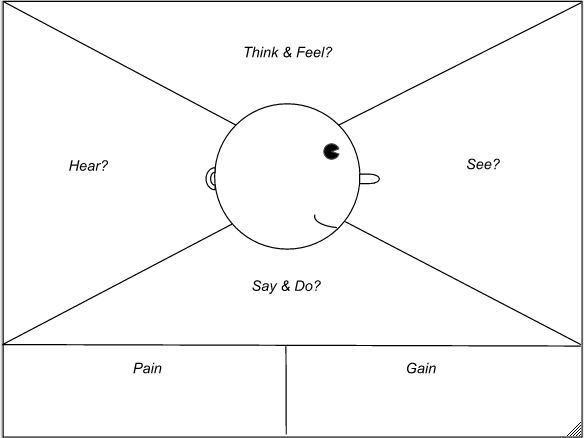
A lot of empathy research points researchers to use a diagram like the one you see here. See/Feel/Say/Do diagrams ask the following questions of your user(s):
- ● “What are they seeing?”
- ● “What are they feeling and thinking?”
- ● “What are they saying and doing?”
- ● “What are they hearing?” (some diagrams leave this one out)
The diagram shown here also includes a Pain/Gain component, asking “What are some of the things your user is having trouble with?” (pain) and “What are some opportunities to improve those components?” (gain).
Before I dispel this notion, I will acknowledge there is an extent to which you could consider See/Feel/Say/Do as a subset of what we’ve been talking about with the Six Minds. Let’s look more closely at See/Feel/Say/Do.
“See.” At first glance, this is pretty clearly tied to vision. But remember that when we consider what the user is seeing, we want to know what they’re actually looking at or attending to — not necessarily what we’re presenting to them, which may be different. I want to make sure that we’re thinking from an audience perspective, and taking into account actually what they’re really seeing. There is an important component that is missing here: What are they not seeing. We want to know what they are searching for, and why. It is crucial to consider the attentional component, too.
“Feel.” It seems like “feel” would be synonymous with emotion. But think again. In these empathy diagrams, “feel” is talking about the immediate emotion of a user in relation to a particular interface. It asks “What is the user experiencing at this very moment?” As you may remember from our discussion of emotion, from a design perspective, we should be more interested in that deeper, underlying source of emotion. What it is that my users are trying to achieve? Why? Are they fearful of what might happen if they’re not able to achieve that? What are some of their deepest concerns? In other words, I want to push beyond the surface level of immediate reactions to an interface and consider the more fundamental concerns that may be driving that reaction.
“Say.” A lot of times, the saying and doing are grouped together, but first let’s focus on the saying. I struggle with the notion of reporting what users are actually saying because at the end of the day, your user can say things that relate to any of the Six Minds. They might say what they’re trying to accomplish, which would be decision-making. They could describe how they’re interacting with something, which would be wayfinding. Or maybe they’re saying something about emotion. If you recall the types of observations we grouped under language in Part 2 with our sticky note exercise, they weren’t a mere litany of all the things our users uttered, but rather all the things our users said (or did) that pertained to the words being used on a certain interface. I believe that language has to do with the user’s level of sophistication and the terms they expect to see when interacting with a product.
By categorizing all of the words coming out of our users’ mouths as “say,” I worry that we’re oversimplifying things and missing what those statements are getting at. I also think we miss the chance to determine people’s overall expertise level based on the kinds of words they’re using. This grouping doesn’t lend itself to an organization that can influence product or service design.
“Do.” When we think about wayfinding, that has to do with how people are getting around on the interface or service design. It asks questions like “Where are you in the process?”, and “How can you get to the next step?”. I think wayfinding gets at what the user is actually doing, as well as what they believe they can do, based on their perception of how this all works. Describing behavior (“do”) is helpful, but not sufficient.
Decision-making (missing). While “do” comes close, I think that we’re missing decision-making in See/Feel/Say/Do. This style of representation doesn’t mention how users are trying to solve the problem. With decision-making or problem-solving, we want to consider how our users think they can solve the problem and what operators they think they can use to move around their decision space.
Memory (missing). Memory also gets the short shrift. We want to know the metaphors people are using to solve this problem, and the expected interaction styles they’re bringing into this new experience. We want to know about their past experiences and expectations that users might not even be aware of, but that they imply through their actions and words. Like how they expect the experience of buying a book to work based on how Amazon works, or how they expect a sit-down restaurant to have waiters and white tablecloths. See/Feel/Say/Do charts leave out the memories and frameworks users are employing.
Hopefully you can see that while better than nothing, See/Feel/Say/Do is missing key elements that we need to consider, and that it also oversimplifies some of the pieces it does consider. We can do better with our Six Minds. Here’s how.
Concrete recommendations:
- ● Segment audiences using the following:
- ○ Collect findings from the contextual interviews across the Six Minds.
- ○ Determine which participants and activities share “affinities” or commonalities.
- ○ Determine how users differ in their needs, segmenting them by relevant dimensions.