Table of Contents for
Building PHP Applications with Symfony™, CakePHP, and Zend® Framework
 Building PHP Applications with Symfony™, CakePHP, and Zend® Framework
Published by
Wrox, 2011
Building PHP Applications with Symfony™, CakePHP, and Zend® Framework
Published by
Wrox, 2011
- Copyright
- Credits
- ABOUT THE AUTHORS
- ACKNOWLEDGMENTS
- Introduction
- 1. Introducing Symfony, CakePHP, and Zend Framework
- 2. Getting Started
- 3. Working with Databases
- 4. Your First Application in the Three Frameworks
- 5. Forms
- 6. Mailing
- 7. Searching
- 8. Security
- 9. Templates
- 10. AJAX
- 11. Making Plug-ins
- 12. Web Services
- 13. Back End
- 14. Internationalization
- 15. Testing
- 16. User Management
- 17. Performance
- 18. Summary
- A. Web Resources
- B. CodeIgniter, Lithium, and Agavi with Code Examples
- GLOSSARY OF ACRONYMS AND TECHNICAL TERMS
There is no such thing as innocence, only degrees of guilt.
WHAT'S IN THIS CHAPTER?
There are various benchmarks showing that some frameworks are faster than others. There are two reasons not to trust them too much. First, they depend heavily on the configuration of the server and the framework itself, so they may be biased, on purpose or not. Second, as a general rule, the more a framework is stacked with features, the slower it is. Pure PHP is always fastest in benchmarks, but that doesn't mean it is the best way to develop apps.
In this chapter we are going to introduce you to Apache JMeter, a tool designed specifically to test server performance. With JMeter, you can carry out your own benchmarks and diagnose problems with server performance. If you really can't wait for your own results, in this chapter we perform two simple benchmarks for you. Furthermore, you will see a comparison of development speed, which is in many cases more important than server throughput.
Apache JMeter is a great tool for stress, load, and performance tests of your application. It was developed under the banner of Apache Jakarta. It can simulate multiple user requests for server resources simultaneously. You can use it to test any of the examples introduced in this book or your own applications.
First of all, you need to download JMeter for your environment at http://jakarta.apache.org/jmeter/. It is a Java application, so it is OS-independent. Unpack it to a directory of your choice. Inside the /bin folder is ApacheJMeter.jar, a runnable Java archive, and shell script launchers for various operating systems.
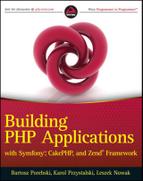
Run JMeter as a window application. It may not look very impressive, but under this window, tremendous capabilities are hidden. JMeter can create lots of threads to simulate users, one user per thread. Suppose that you want to run a simple test, in which 10 users simultaneously request a web page, 100 times each. To do that, you need first to define threads. Adding these is possible by right-clicking Test Plan in the Apache JMeter window and choosing Add

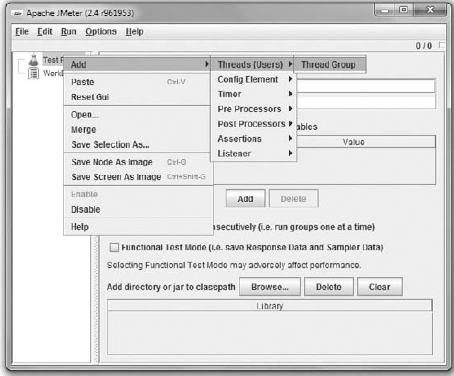
Thread Group configuration is very important. If you put the wrong values here, you can make your desktop unresponsive until the next reboot. If you do not believe that, put 100000 into the Number of Threads and Loop Count fields. A reasonable configuration is shown in Figure 17-2. Of course, you can increase these values if you wish.
After defining a thread group, you should also specify what kind of requests should be executed. You can use JMeter's Sampler to specify this. Right-click the newly created Thread Group and choose Add
To see your results, you need JMeter's Listeners. Listeners are modules used to visualize the output. Just right-click the Thread Group and choose Add
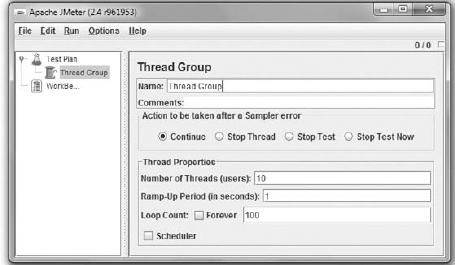
When all needed components are added, you should see in the left panel of JMeter a Test Plan structure like that shown in Figure 17-3. Now you can configure each module. Start with the Graph Results, as shown in the right panel of Figure 17-3. Here you can change the name of the item, set a log file to write into, and use display options. In this case, only Throughput is needed, but feel free to try the other options.
Now you are ready to start a simple test. To make it possible, you should first run the JMeter server. Under Windows, you need to click the JMeter-server.bat batch icon. Make sure that java.exe is added to the PATH environment variable (this process is described in Chapter 2). Under Linux, you should run jmeter-server.sh from the shell level as follows:
$ ./jmeter-server
In some cases, the server will not start, and it shows errors that your hostname is a loopback interface. To solve this problem, you need to edit the /etc/hosts file with root privileges and change your hostname from 127.0.0.1 to the real IP address. To check your IP, you can run this command:
$ ifconfig
You should set the IP address of the eth0 interface.
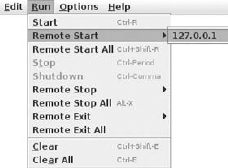
After starting the JMeter server successfully, you can run the previously defined test. To do that, choose Run
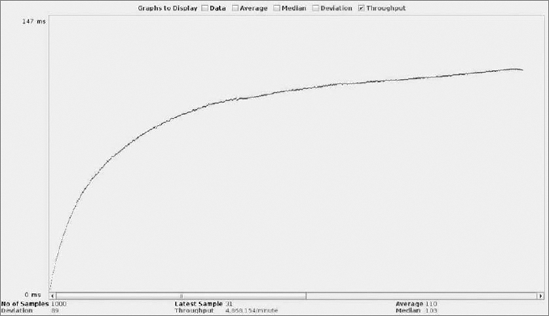
Now you can switch to the Graph Results and see a pretty chart. It's generated on the fly, so you can observe how the throughput is growing when more and more threads are running (see Figure 17-5). Results are also shown on the bottom, below the chart.
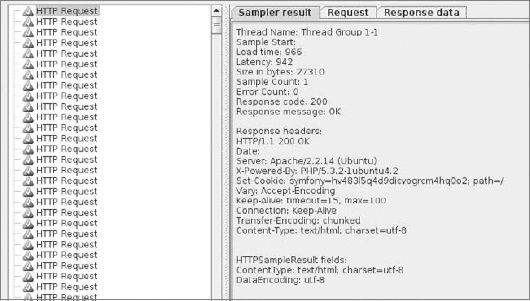
When you switch to Results Tree, you can see the details of each request (see Figure 17-6). As long as the tree is green, everything is going well. When you choose one of the items, you can see detailed information on the right.
Now you know how to run benchmarks with JMeter. You have a reliable tool to test the performance of any web application on any framework.
You can also increase thread count and loop count and try to crash your application with a stress test. When your desktop freezes for a few seconds after the test has started, you can be pleased because you have successfully crashed your web application and now you know its performance boundaries. By checking the Forever field in the Thread Group's Loop Count field, you can easily test your application in heavy load conditions. You should run these tests on the target machine because hardware and operating system configuration are decisive factors here.
We have done benchmarks of two simple applications: a pretty standard Hello World example and a CRUD database access app. Both were explained in Chapters 2 through 4, so you can easily copy source code from there or create your own custom set of benchmarks.
The benchmarks were carried out on Ubuntu 10.04 kernel 2.6.32-25. The hardware used was an i5-750 2.67-GHz Intel processor with 8GB RAM. JMeter was used to simulate 10 users making 1,000 requests each. The numbers are amounts of page views per second handled by the server. So the higher amount is better.
This is the simplest application without a database connection; it just uses a controller to display a view. While these results are far from benchmarking a full-featured application, they can show the speed of the frameworks' cores. The benchmarked frameworks are Symfony 1.4, CakePHP 1.3, Zend Framework 1.11, and (as a bonus) Symfony 2.0 beta.
SYMFONY 1.4 | CAKEPHP 1.3 | ZEND FRAMEWORK 1.11 | SYMFONY 2.0 BETA | |
|---|---|---|---|---|
Throughput | 221 | 178 | 348 | 401 |
As you can see, Symfony 2.0 is exceptionally good; it's almost twice as fast as Symfony 1.4. Zend Framework 1.11 is second, being the fastest stable release of these three frameworks. CakePHP 1.3 is the last one, being slightly slower than Symfony 1.4. These results are generally consistent with various other benchmarks found in the web.
This example application was extended to database usage. For every page request, 10 e-mail addresses were retrieved from a MySQL database.
SYMFONY 1.4 | CAKEPHP 1.3 | ZEND FRAMEWORK 1.11 | |
|---|---|---|---|
Throughput | 139 | 105 | 187 |
The results are not surprising: Zend Framework 1.11 is the first, CakePHP 1.3 is the last, and Symfony 1.4 is in the middle.
As discussed before, don't attach too much attention to the performance benchmarks. First of all, you gain more speed by knowing how to optimize your single favorite framework than switching to another. Second, the differences demonstrated in our benchmarks are still small, and if you really need a fast framework, try a lightweight one like CodeIgniter or Yii. Or use plain PHP if you want the app to work even faster. And finally, the server costs are generally much lower than the programming costs. That's why we feel the development speed benchmark in this section is more important.
We have discussed how much work was needed to make the previous CRUD application. These results do not scale to bigger projects, in particular because the controllers and views generated by Symfony are just stubs that need to be expanded. But these numbers can give you a good idea of relative development speeds. The fewer lines, the faster you can start your project.
SYMFONY | CAKEPHP | ZEND FRAMEWORK | |
|---|---|---|---|
Command Line | 4 commands | 1 command | 5 commands |
Schema/Model | 23 schema lines | 9 schema lines | 168 model lines |
Config | 1 line | 1 line | 1 line |
Controller | 0 lines (40 generated) | 38 lines | 95 lines |
View | 0 lines (83 generated) | 42 lines | 42 lines |
As you can see, CakePHP and Symfony are far ahead of Zend Framework. Symfony needs the least hand-written code in this example because it could easily take advantage of its command-line tools that can generate simple CRUD controllers and views. CakePHP allows even more rapid development, because in general it needs the least overall code for the same effects. Its schemas also are very short: only nine lines. Zend Framework, however, doesn't look good here. This example shows the sensitive spot of ZF — the model layer — so in general, the difference should be less dramatic. But you'll see throughout this book that ZF examples were usually the most time-consuming. So the execution speed comes at the price of development speed.