Using Fiona, you can open a shapefile and access attribute data, such as geometries. For example, our Natural Earth dataset contains a shapefile with all of the states in the US with their vector geometries. Use the following code to open the shapefile and get all of the vector geometry of the first feature (starting from index number 0):
In:   import pprint, fiona
      with fiona.open\
     (r"C:\data\gdal\NE\110m_cultural\ne_110m_admin_1_states_provinc
     es.shp") as src:
      pprint.pprint(src[0])
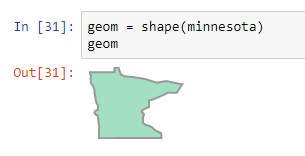
We can use the shape method and pass in all of the coordinates from Minnesota:
In:   from shapely.geometry import shape
      minnesota = {'type': 'Polygon', 'coordinates':
      [[(-89.61369767938538, 47.81925202085796), (-89.72800594761503,
      47.641976019880644), (-89.84283098016755, 47.464725857119504),
      (-89.95765601272012, 47.286907253603175),....]]}
Next, we plot the geometry with Shapely:
A note on plotting separate shapefile geometries in Python:
As you may have noticed from the prefacing text, referencing separate geometry elements such as a state from shapefiles and plotting them with Python isn't that straightforward. Luckily, there are many code examples available for professionals to solve this problem. Have a look at the following options that are freely available for Python users, to see how you could approach plotting shapefile vector geometries in Python, if you decide to work directly with shapefiles instead of converting to the GeoJSON format:
- Use NumPy arrays and matplotlib: You can use NumPy arrays to squeeze all of the coordinates in a one-dimensional array and plot these next.
- Use Shapely and create a new dictionary from an existing shapefile: If you know how to reorganize an existing collection of dictionaries, it is possible to create a new dictionary out of an existing shapefile that uses the name of a geographical area as a key, with the geometry data of that area as values. Next, you can use Shapely to pass in elements of these dictionaries and plot them in Python.
- Use pyshp and matplotlib: The pyshp library can be used to read in geometry information that can then be plotted with matplotlib.
- Use GeoPandas and matplotlib: The GeoPandas library can be used together to read in shapefiles. Not only can you plot vector data using matplotlib's capabilities, but you can also read in attribute tables as pandas dataframes.