In the following exercise, we'll search for online content, add it to our map, and describe the data. We'll finish by saving your map widget directly into a web map that is stored in your personal content folder in ArcGIS Online. This is a new feature that comes with the 1.3 version of the API, which makes it really easy to create web maps. The content we'll be using is a feature layer file containing bike trails in Solano County in California. This content is available through ArcGIS Online. We can use the API to search the content, reference it, and add it to our map widget in our Jupyter Notebook app.
First, we'll log into ArcGIS Online using a personal account. Read the code and follow the instructions as follows:
In:   import arcgis
In:   from arcgis.gis import GIS
      gis = GIS()
In the previous code, you are required to type your own personal details between the brackets following the capitalized GIS in the third line, starting with a personal URL, username, and password. If you've created a free ArcGIS developer account, this will look something like gis = GIS(“https://firstname-lastname.maps.arcgis.com”, “username”, “password”). If you've signed up for a trial period for ArcGIS Online, the first URL will be https://www.arcgis.com, followed by your username and password.
Next, we'll open up a map of Solano County, our area of interest:
In:   map = gis.map("Solano County, USA")
      map.zoom = 10
      map
To search for specific content outside of our own organization, use the following code that includes a query with specific search terms. Here, we've used trails in and near San Francisco:
In: search_result = gis.content.search(query="san francisco trail",
    item_type="Feature Layer", outside_org=True)
    search_result
In the previous code, we're using the content property of the GIS object to search for content. Using a personalized account, we specify we want to search for data outside of our own organization. Our query is looking for trails near San Francisco of the type "Feature Layer". Next, the results are returned by repeating the variable name. The output in this case looks like the following list but could be different for the reader. For brevity, only the first three search results are shown:
Out: [<Item title:"National Park Service - Park Unit Boundaries"
     type:Feature
     Layer Collection owner:imrgis_nps>,

     <Item title:"National Park Service - Park Unit Centroids"
     type:Feature Layer
     Collection owner:imrgis_nps>,

     <Item title:"JUBA_HistoricTrail_ln" type:Feature Layer Collection
      owner:bweldon@nps.gov_nps>,…
The items are returned as a list, with each item consisting of its title, type, and owner name. We can also show this items list in a different way if we use the Jupyter Notebook application:
In:   from IPython.display import display
      for item in search_result:
          display(item)
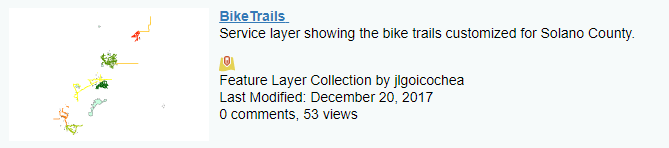
Now, our search results are returned with a thumbnail picture, a title, and description. The title is also a hyperlink that will take you to an ArcGIS Online web page where you can display the content in a viewer and consult the metadata. We are interested in the following item showing bike trails in Solano County in a feature collection. This is a collection of feature layers and a table, meaning we have to find a way to access the right feature layer and add it to our map widget:
We now want to display the bike trail data from this feature collection on the map. To do this, we need to reference the data source in our code. We can do this as follows:
In:   bike_trails_item = search_result[8]
      bike_trails_item.layers
The code works as follows, the first line creates a variable that references the item from our search results list that contains the Bike Trails service layer. Next, we'll use the layers property on this item to see how many layers the item contains, in this case two layers, indexed 0 and 1.
Next, we want the names of both layers. Using a for loop, we can print the layer names:
In:   for lyr in bike_trails_item.layers:
          print(lyr.properties.name)

Out:  BikeTrails
      Parks
We can see that the bike trails are stored in the first layer. Next, we'll reference this layer within the service layer by assigning it the name bike_trails_layer variable. We'll also print the feature layer URL by repeating our newly created variable:
In: bike_trails_layer = bike_trails_item.layers[0]
In: bike_trails_layer
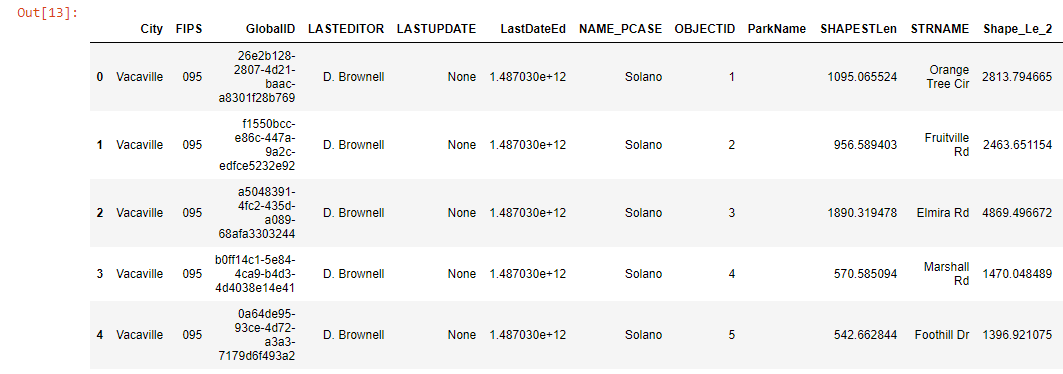
Using a pandas dataframe, we can visualize the attribute table that comes with the layer:
In:   bike_df = bike_trails_layer.query().df
In:   bike_df.head()
Limiting the output to the first five rows using the head() function, we get the following output:
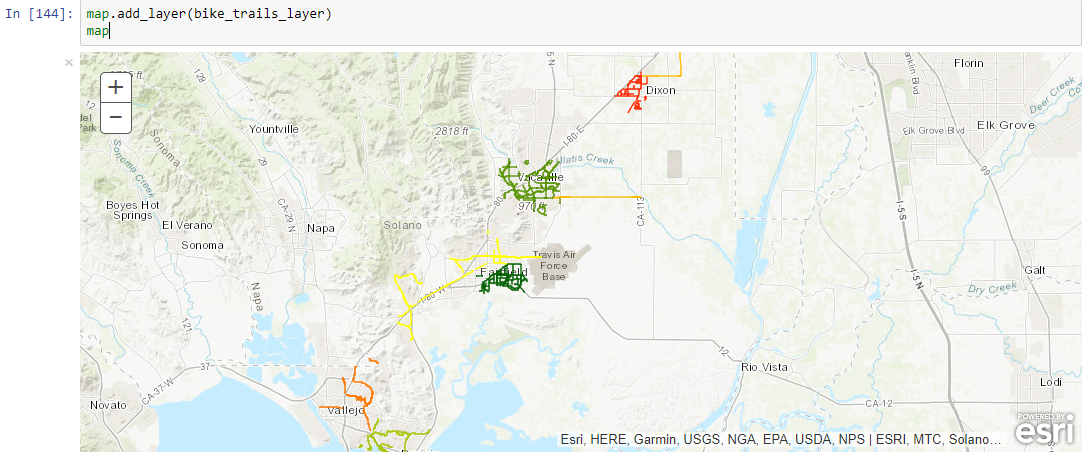
We can now add the layer to the map and look at the results:
In:   map.add_layer(bike_trails_layer)
      map
The bike trails will be displayed on top of our basemap in the map widget. If you don't see the trails, you may need to zoom in and out a few times, as well as pan the map to the right until you see the following result, showing the different bike trails as line segments on top of the basemap:
We'll now create our own web map from this map widget. This is a recent feature of the API, which is very powerful for creating and hosting your own web maps in ArcGIS Online. This is not the only way to create web maps, but serves as an example of how you can use the API to do this. By importing the WebMap class, we can create an instance of this class through a variable called wm, which will store our web map. Using the save function, we can simply save this map widget as a web map in our own organization's content folder:
In: from arcgis.mapping import WebMap
wm = WebMap()
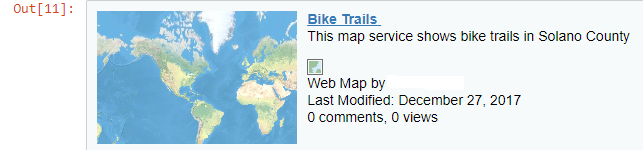
web_map_properties = {'title':'Bike Trails ',
'snippet':'This map service shows bike trails in Solano County',
'tags':'ArcGIS Python API'}
web_map_item = wm.save(item_properties=web_map_properties)
web_map_item
Python returns our item that we can immediately visit online by clicking the URL underlined in blue, after providing our login credentials to access our organizational page of ArcGIS Online:
We can edit the metadata in the overview tab, while we can delete it in the Settings tab (scroll down to see this option marked in red).
Returning to our Jupyter Notebook, we can display the information from the service URL using Python, returning output in JSON format, showing only the first three results here:
In: bike_trails_layer.properties
By using a for loop, we can display the field names:
In:   for field in bike_trails_layer.properties['fields']:
          print(field['name'])

Out: OBJECTID
     SHAPESTLen
     STRNAME
      ...
You can also access individual properties of the feature layer, for example the extent:
In:   bike_trails_layer.properties.extent

Out:  {
     "xmin": 6485543.788552672,
     "ymin": 1777984.1018305123,
     "xmax": 6634421.269668501,
     "ymax": 1958537.218413841,
     "spatialReference": {
     "wkid": 102642,
     "latestWkid": 2226
      }
    }
This concludes the second exercise, in which we learned how to search for content, add it to our map widget, and describe the data we're working with. We'll now have a look at the raster module to see how we can visualize and process raster imagery.