Table of Contents for
Raspberry Pi Cookbook, 2nd Edition
 Raspberry Pi Cookbook, 2nd Edition
Published by
O'Reilly Media, Inc., 2016
Raspberry Pi Cookbook, 2nd Edition
Published by
O'Reilly Media, Inc., 2016
- nav
- Cover
- Raspberry Pi Cookbook
- Raspberry Pi Cookbook
- Preface to the Second Edition
- Setup and Management
- Networking
- Operating System
- Software
- Python Basics
- Python Lists and Dictionaries
- Advanced Python
- Computer Vision
- Hardware Basics
- Controlling Hardware
- Motors
- Digital Inputs
- Sensors
- Displays
- The Internet of Things
- Arduino and Raspberry Pi
- Parts and Suppliers
- Raspberry Pi Pinouts
- Index
- About the Author
- Colophon
Chapter 13. Sensors
13.0 Introduction
In this chapter, you will look at recipes for using sensors of various types that will allow the Raspberry Pi to measure temperature, light, and more.
Compared to a board like the Arduino, the Raspberry Pi lacks analog inputs. This means that for many sensors, it is necessary to use additional analog-to-digital (ADC) converter hardware. Fortunately, this is relatively easy to do. It is also possible to use resistive sensors with a capacitor and a couple of resistors.
Most of the recipes will require the use of a solderless breadboard and male-to-female jumper wires (see Recipe 9.8).
13.1 Using Resistive Sensors
Note
Be sure to check out the accompanying video for this recipe at http://razzpisampler.oreilly.com.
Solution
You can measure resistance on a Raspberry Pi using nothing more than a capacitor, a couple of resistors, and two GPIO pins. In this case, you will be able to estimate the position of the knob on a small variable resistor (trimpot) by measuring its resistance from its slider contact to one end of the pot.
To make this recipe, you will need:
-
Breadboard and jumper wires (see “Prototyping Equipment”)
-
10kΩ trimpot (see “Resistors and Capacitors”)
-
Two 1kΩ resistors (see “Resistors and Capacitors”)
-
330 nF capacitor (see “Resistors and Capacitors”)
Figure 13-1 shows the arrangement of components on the breadboard.
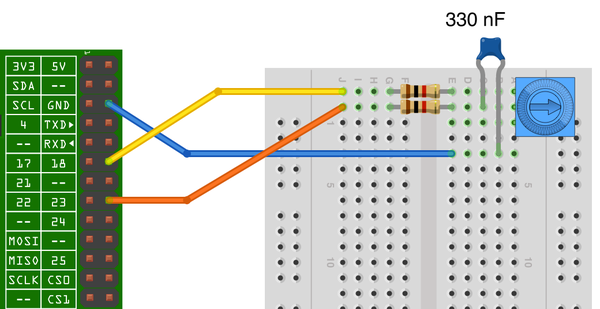
Figure 13-1. Measuring resistance on a Raspberry Pi
Open an editor (nano or IDLE) and paste in the following code. As with all the program examples in this book, you can also download the program from the Code section of the Raspberry Pi Cookbook website, where it is called pot_step.py.
importRPi.GPIOasGPIOimporttime,mathC=0.36# uFR1=1000# OhmsGPIO.setmode(GPIO.BCM)# Pin a charges the capacitor through a fixed 1k resistor# and the pot in series# Pin b discharges the capacitor through a fixed 1k resistora_pin=18b_pin=23# Discharge the capacitor, leaving it ready to start filling updefdischarge():GPIO.setup(a_pin,GPIO.IN)GPIO.setup(b_pin,GPIO.OUT)GPIO.output(b_pin,False)time.sleep(0.1)# Return the time taken (uS) for the voltage on the capacitor# to count as a digital input HIGH# which is 1.65V or higherdefcharge_time():GPIO.setup(b_pin,GPIO.IN)GPIO.setup(a_pin,GPIO.OUT)GPIO.output(a_pin,True)t1=time.time()whilenotGPIO.input(b_pin):passt2=time.time()return(t2-t1)*1000000# Take an analog reading as the time taken to charge after# first discharging the capacitordefanalog_read():discharge()t=charge_time()discharge()returnt# Convert the time taken to charge the cpacitor into a value of resistance# To reduce errors, do it 100 times and take the averagedefread_resistance():n=10total=0;foriinrange(1,n):total=total+analog_read()t=total/float(n)T=t*0.632*3.3r=(T/C)-R1returnrtry:whileTrue:(read_resistance())time.sleep(0.5)finally:GPIO.cleanup()
When you run the program, you should see some output like this:
$ sudo python pot_step.py
10049.2157936
10105.1559448
10158.6098671
11331.0049375
10162.6154582
10156.8142573
9501.27855937
8216.17444356
The reading will vary as you rotate the knob of the trimpot. Ideally, the reading of resistance would vary between 0 and 10,000Ω but in practice, there will be some error. You might like to tweak the value of the constant C at the top of the program if you want more accurate readings, but remember the value of C will probably have to be changed if you put another capacitor in, even if the capacitor was nominally of the same value.
Discussion
To explain how this program works, I first need to explain how the step response technique can be used to measure the resistance of the variable resistor.
Figure 13-2 shows the schematic diagram for the recipe.
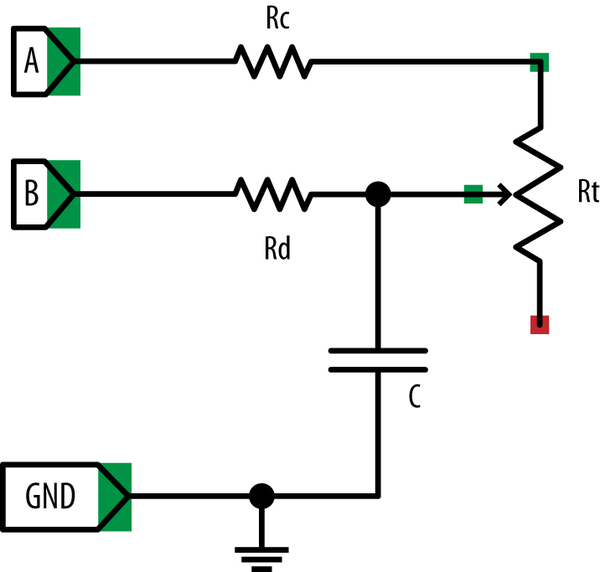
Figure 13-2. Measuring resistance using step response
This way of doing things is called step response because it works by seeing how the circuit responds from the step change when an output is switched from low to high.
You can think of a capacitor as a tank of electricity, and as it fills with charge, the voltage across it increases. You can’t measure that voltage directly, because the Raspberry Pi doesn’t have an Analog to Digital Converter (ADC). However, you can time how long it takes for the capacitor to fill with charge to the extent that it gets above the 1.65V or so that constitutes a high digital input. The speed at which the capacitor fills with charge depends on the value of the variable resistor (Rt). The lower the resistance, the faster the capacitor fills with charge and the voltage rises.
To be able to get a good reading, you must also be able to empty the capacitor each time before you take a reading. In Figure 13-2, connection A is used to charge the capacitor through Rc and Rt, and connection B is used to discharge (empty) the capacitor through Rd. The resistors Rc and Rd are used to prevent too much current from flowing as the capacitor is charged and discharged through the Raspberry Pi’s relatively fragile GPIO pins.
The steps involved in taking a reading are first to discharge the capacitor through Rd and then to let it charge through Rc and Rt.
To discharge it, connection A (GPIO 18) is set to be an input, effectively disconnecting Rc and Rt from the circuit. Connection B (GPIO 23) is then set to be an output and low. This is held there for 100 milliseconds to empty the capacitor.
Now that the capacitor is empty, you can start to allow charge to flow into it by setting connection B to be an input (effectively disconnecting it) and then enabling connection A to be a high output at 3.3V. Capacitor C will now begin to charge through Rc and Rt. The while loop will do nothing until the voltage at connection B switches from being low to high at about 1.65V.
At that point, the time taken is returned.
Figure 13-3 shows how a resistor and capacitor in this kind of arrangement charge and discharge as the voltage is toggled between high and low.
You can see that the voltage at the capacitor increases rapidly at first but then trails off as the capacitor becomes full. Fortunately, you are interested in the area of the curve up until the capacitor reaches about 1.65V, which is a fairly straight line, meaning that the time taken for the voltage across the capacitor to rise to this point is roughly proportional to the resistance of Rt and hence the position of the knob.
This approach is not hugely accurate, but it is very low cost and easy to use. The inaccuracy is largely because capacitors of a suitably high value are only accurate to 10%.
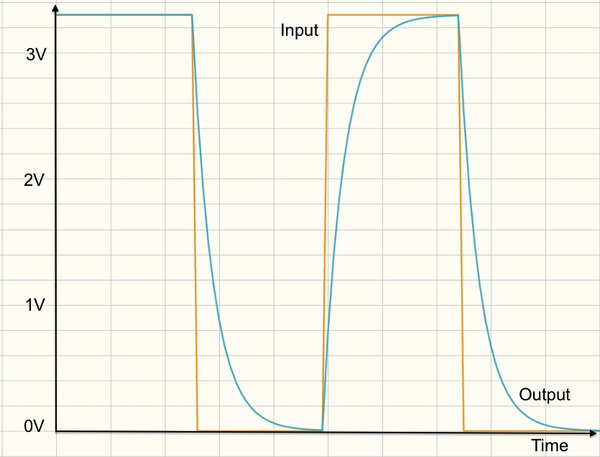
Figure 13-3. Charging and discharging a capacitor
See Also
Using a step response works well with all kinds of resistive sensors for light (Recipe 13.2), temperature (Recipe 13.3), and even gas detection (Recipe 13.4).
For more accurate measurements of the trimpot position, see Recipe 13.5, where the pot is used with an ADC converter.
13.2 Measuring Light
Solution
Use the same basic recipe and code as Recipe 13.1, but replace the trimpot with a photoresistor.
To make this recipe, you will need:
-
Breadboard and jumper wires (see “Prototyping Equipment”)
-
Photoresistor (see “Resistors and Capacitors”)
-
Two 1kΩ resistors (see “Resistors and Capacitors”)
-
330 nF capacitor (see “Resistors and Capacitors”)
All these parts are included in the Electronics Starter Kit for Raspberry Pi from Monk Makes (see “Prototyping Equipment”).
Figure 13-4 shows the arrangement of components on the breadboard.
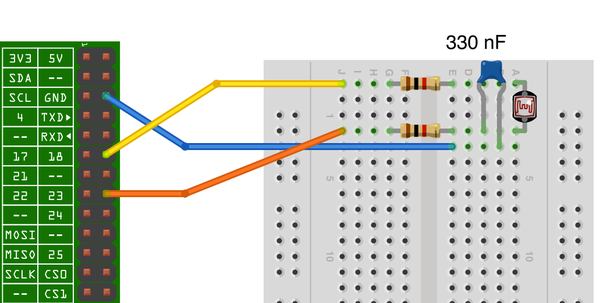
Figure 13-4. Measuring light on a Raspberry Pi
Using the same program as Recipe 13.1 (pot_step.py), you will see the output vary as you move your hand over the photoresistor to cut out some of the light.
This solution provides relatively reliable readings of light levels. As an adaptation of the general solution for using resistive sensors (Recipe 13.1), it also copes with measuring a resistance of 0Ω without any risk of damaging the GPIO pins of the Raspberry Pi. Since a photoresistor is never going to dip to zero resistance, you can take a few shortcuts and do away with both 1kΩ resistors and one of the GPIO pins and make the simpler schematic shown in Figure 13-5.
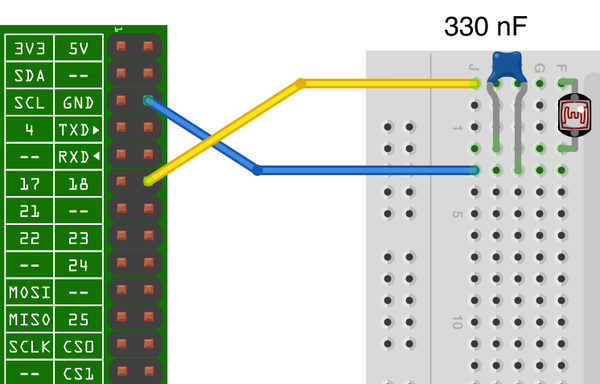
Figure 13-5. A simplified light sensor
In this variation, the same GPIO pin will be used to charge and discharge the capacitor and check to see if it is above the input HIGH threshold. The program can be found in photoresistor_step.py.
importRPi.GPIOasGPIOimporttimeGPIO.setmode(GPIO.BCM)pin=18defdischarge():GPIO.setup(pin,GPIO.OUT)GPIO.output(pin,False)time.sleep(0.1)# Return the time taken for the capacitor to go HIGH# which is 1.65V or higherdefcharge_time():t1=time.time()GPIO.setup(pin,GPIO.IN)whilenotGPIO.input(pin):# charge for 1msGPIO.setup(pin,GPIO.OUT)GPIO.output(pin,True)time.sleep(0.001)# set to input to test againGPIO.setup(pin,GPIO.IN)time.sleep(0.001)t2=time.time()return(t2-t1)*1000000# Take an analog reading as the time taken to charge Cdefanalog_read():discharge()returncharge_time()whileTrue:(analog_read())time.sleep(0.5)
In only using one pin, after discharging the capacitor through the photoresistor, the charge_time function charges the capacitor through the photoresistor for just 1 ms. It sets the pin to be an input and tests to see if it’s over the HIGH threshold, and then repeats until it is HIGH.
Discussion
A photoresistor is a resistor whose resistance varies depending on the amount of light coming through its transparent window. The brighter the light, the lower the resistance. Typically, the resistance varies between about 1kΩ in bright light up to perhaps 100kΩ in complete darkness.
The sensors can only really give a rough idea of the light level.
See Also
You could also use an ADC with the photoresistor (Recipe 13.5).
13.3 Measuring Temperature with a Thermistor
Solution
A thermistor is a resistor whose resistance varies with temperature. Use the step response method (Recipe 13.1) to measure the resistance of the thermistor and then calculate the temperature.
To make this recipe, you will need:
-
Breadboard and jumper wires (see “Prototyping Equipment”)
-
1k Thermistor (see “Resistors and Capacitors”)
-
Two 1kΩ resistors (see “Resistors and Capacitors”)
-
330 nF capacitor (see “Resistors and Capacitors”)
All these parts are included in the Electronics Starter Kit for Raspberry Pi from Monk Makes (see “Prototyping Equipment”). When you get your thermistor, make sure that you know its values of Beta and R0 (resistance at 25C) and that it is a Negative Temperature Coefficient (NTC) device.
Figure 13-6 shows the breadboard layout for this recipe.
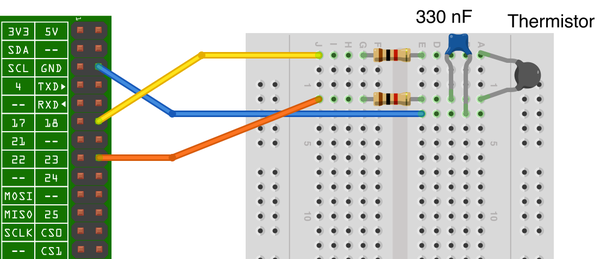
Figure 13-6. Breadboard layout for using a thermistor
Open an editor (nano or IDLE) and paste in the following code. As with all the program examples in this book, you can also download the program from the Code section of http://www.raspberrypicookbook.com, where it is called thermistor.py.
importRPi.GPIOasGPIOimporttime,mathC=0.36# uFR1=1000# OhmsB=3800.0# The thermistor constantR0=1100.0# The resistance of the thermistor at 25CGPIO.setmode(GPIO.BCM)# Pin a charges the capacitor through a fixed 1k resistor# and the thermistor in series# Pin b discharges the capacitor through a fixed 1k resistora_pin=18b_pin=23# Discharge the capacitor, leaving it ready to start filling updefdischarge():GPIO.setup(a_pin,GPIO.IN)GPIO.setup(b_pin,GPIO.OUT)GPIO.output(b_pin,False)time.sleep(0.1)# Return the time taken (uS) for C to charge# which is 1.65V or higherdefcharge_time():GPIO.setup(b_pin,GPIO.IN)GPIO.setup(a_pin,GPIO.OUT)GPIO.output(a_pin,True)t1=time.time()whilenotGPIO.input(b_pin):passt2=time.time()return(t2-t1)*1000000# Take an analog reading from charge timedefanalog_read():discharge()t=charge_time()discharge()returnt# Convert the time taken to charge the capacitor into a value of resistance# To reduce errors, do it 10 times and take the average.defread_resistance():n=10total=0;foriinrange(1,n):total=total+analog_read()t=total/float(n)T=t*0.632*3.3r=(T/C)-R1returnrdefread_temp_c():R=read_resistance()t0=273.15# 0 deg C in Kt25=t0+25.0# 25 deg C in K# Steinhart-Hart equation - Google itinv_T=1/t25+1/B*math.log(R/R0)T=(1/inv_T-t0)returnTtry:whileTrue:(read_temp_c())time.sleep(0.5)finally:GPIO.cleanup()
When you run the program, you will see a series of temperature measurements in degrees C. To convert to degrees F, use the formula Tf = Tc * 9 / 5 + 32.
$ sudo python thermistor.py
18.3040458984
17.8302664759
17.3917856854
17.9286173793
Discussion
Most of the code in this project is the same as for Recipe 13.1. The new part is the function read_temp_c, which converts the resistance value into a temperature in degrees C.
Calculating the temperature from the resistance of the thermistor requires some fairly hairy math using logarithms called the Steinhart-Hart equation. This equation needs to know two things about the thermistor: its resistance at 25 degrees C (called T0 or sometimes T25) and a constant for the thermistor called Beta, or sometimes just B. If you use a different thermistor, you will need to plug these values into the variables B and R0 at the top of the program.
Note that a capacitor typically only has an accuracy of 10%, and thermistors are similarly inaccurate in their value of R0, so to get useful readings from the thermistor, you will need to tweak the variables C and R0.
Adjust C first, using a 1kΩ 1% accuracy resistor in place of the pot in Recipe 13.1. Then adjust R0 to give readings that agree with an accurate thermometer.
See Also
To measure temperature using a TMP36, see Recipe 13.8.
To measure temperature using a digital temperature sensor (DS18B20), see Recipe 13.11.
To measure temperature using a Sense HAT, see Recipe 13.10.
13.4 Detecting Methane
Solution
Low-cost resistive gas sensors are available that can easily be wired to a Raspberry Pi to detect gases such as methane. You can use the step response method that you first used in Recipe 13.1.
To make this recipe, you will need:
-
Breadboard and jumper wires (see “Prototyping Equipment”)
-
Methane sensor (see “Modules”)
-
Two 1kΩ resistors (see “Resistors and Capacitors”)
-
330 nF capacitor (see “Resistors and Capacitors”)
The sensor contains a heating element that requires 5V at up to 150mA. The Raspberry Pi is capable of providing this as long as its power supply can supply the extra 150mA.
The sensor module has rather thick legs—too thick to fit into breadboard holes. One way around this is to solder short lengths of solid core wire to each lead (Figure 13-7). Another is to buy SparkFun’s gas sensor breakout board.
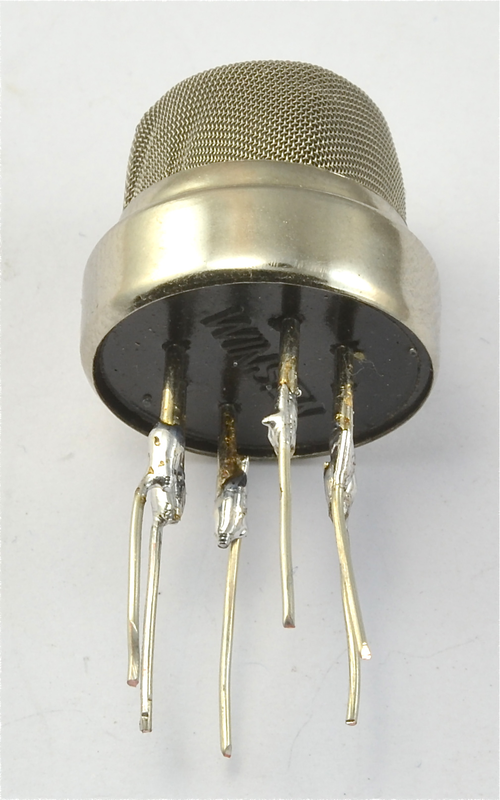
Figure 13-7. Soldering leads onto the gas sensor
Wire the breadboard as shown in Figure 13-8 if you’re using the SparkFun breakout board, or as shown in Figure 13-9 if you soldered longer leads to the gas sensor.
Note that the direct connection shown in Figure 13-9 uses the same symbol for the breakout board rather than the sensor on its own, but if you look carefully, the connections are to the six sensor pins, not the four pins of the breakout.
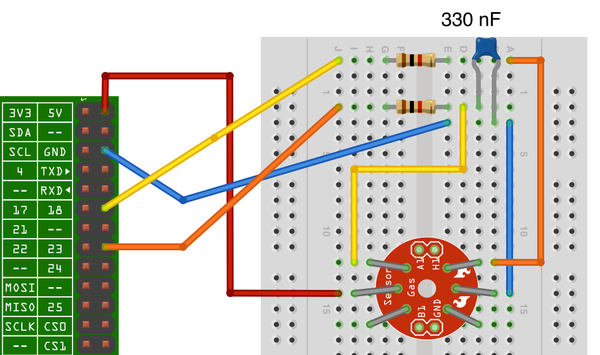
Figure 13-8. Connecting a methane gas sensor to a Raspberry Pi (breakout board)
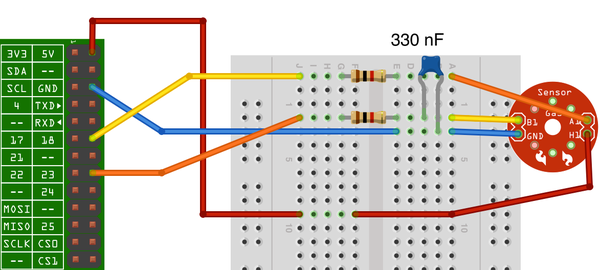
Figure 13-9. Connecting a methane gas sensor to a Raspberry Pi (direct)
You can use the exact same program as Recipe 13.1, and you can test the methane sensor by breathing on it. You should see the readings from the sensor drop when you breathe on it.
Discussion
The obvious use of a methane gas sensor is for novelty fart detecting projects. A more serious use would be for detecting leaks of natural gas. You could, for instance, imagine a Raspberry Pi home-watch project that monitored the home with various sensors. It could then send you an email, while you are on vacation, informing you that your house is about to explode. Or maybe not.
These types of sensors (Figure 13-10) use a heating element that warms a resistive surface impregnated with a catalyst sensitive to a particular gas. When the gas is present, the resistance of the catalyst layer changes.
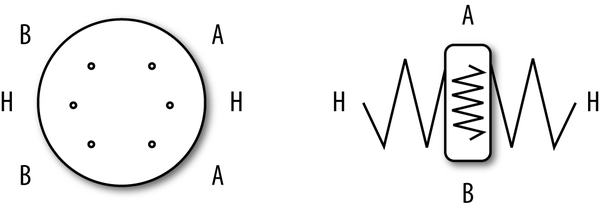
Figure 13-10. A methane gas sensor
Both the heater and the sensing surface are electrically just resistors. So both can be connected either way around.
This particular gas sensor is most sensitive to methane, but will also detect other gases to a lesser extent. That is why breathing on the sensor alters the reading, as healthy individuals will not normally breathe out methane. The cooling effect of blowing on the element may also have an effect.
See Also
The datasheet for this sensor can be found at http://bit.ly/1gYupsu. This will give you all sorts of useful information about the sensor’s sensitivity to various gases.
There are a range of these low-cost sensors available for sensing different gases. For a list of sensors offered by SparkFun, see the SparkFun website.
13.5 Measuring a Voltage
Solution
The Raspberry Pi GPIO connector has only digital inputs. If you wish to measure a voltage, you need to use a separate analog-to-digital converter (ADC).
Use the MCP3008 eight-channel ADC chip. This chip actually has eight analog inputs, so you can connect up to eight sensors to one of these and interface to the chip using the Raspberry Pi SPI interface.
To make this recipe, you will need:
-
Breadboard and jumper wires (see “Prototyping Equipment”)
-
MCP3008 eight-channel ADC IC (see “Integrated Circuits”)
-
10kΩ trimpot (see “Resistors and Capacitors”)
Figure 13-11 shows the breadboard layout for using this chip. Make sure that you get the chip facing the right way. The little notch in the package should be toward the top of the breadboard.
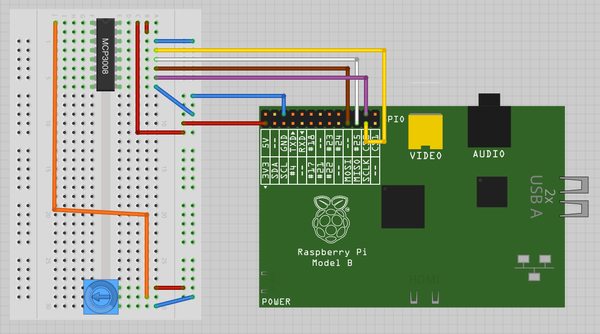
Figure 13-11. Using an MCP3008 ADC IC with a Raspberry Pi
The variable resistor has one end connected to 3.3V and the other to ground, which allows the middle connection to be set to any voltage between 0 and 3.3V.
Before trying the program, make sure you have SPI enabled and the SPI Python library installed (Recipe 9.5).
Open an editor (nano or IDLE) and paste in the following code. As with all the program examples in this book, you can also download the program from the Code section of http://www.raspberrypicookbook.com, where it is called adc_test.py.
importspidev,timespi=spidev.SpiDev()spi.open(0,0)defanalog_read(channel):r=spi.xfer2([1,(8+channel)<<4,0])adc_out=((r[1]&3)<<8)+r[2]returnadc_outwhileTrue:reading=analog_read(0)voltage=reading*3.3/1024("Reading=%d\tVoltage=%f"%(reading,voltage))time.sleep(1)
The interesting part of the program is contained in the analog_read function. This takes a parameter that should be between 0 and 7 and specifies which of the eight analog inputs down the lefthand side of the chip should be read.
The bit manipulation sets up a request for the appropriate channel and then sends the bits to the MCP3008, which reads the resultant data:
$ sudo python adc_test.py
Reading=0       Voltage=0.000000
Reading=126	Voltage=0.406055
Reading=221     Voltage=0.712207
Reading=305     Voltage=0.982910
Reading=431     Voltage=1.388965
Reading=527	Voltage=1.698340
Reading=724     Voltage=2.333203
Reading=927     Voltage=2.987402
Reading=1020    Voltage=3.287109
Reading=1022    Voltage=3.293555
Discussion
The MCP3008 has 10-bit ADCs, so when you take a reading, it gives you a number between 0 and 1023. The test program converts this into a voltage reading by multiplying the reading by the voltage range (3.3V) and then dividing it by 1,024.
You can combine any of the following recipes that use the MCP3008 to allow readings to be taken from up to eight sensors.
You can also use resistive sensors with the MCP3008 by combining them with a fixed-value resistor and arranging them as a voltage divider (see Recipe 13.6 and Recipe 13.7).
See Also
If you’re just interested in detecting the turning of a knob, you can use a rotary encoder instead of a pot (Recipe 12.7).
You can also detect the position of a pot without the use of an ADC chip by using the step response method (Recipe 13.1).
Check out the datasheet for the MCP3008.
The Explorer HAT Pro from Pimoroni also has an ADC (Recipe 9.17).
13.6 Reducing Voltages for Measurement
Problem
You want to measure a voltage, but it is higher than the 3.3V possible using an MCP3008 (Recipe 13.5).
Solution
Use a pair of resistors to act as a voltage divider to reduce the voltage to a suitable range.
To try this recipe, you will need:
-
Breadboard and jumper wires (see “Prototyping Equipment”)
-
MCP3008 eight-channel ADC IC (see “Integrated Circuits”)
-
10kΩ resistor (see “Resistors and Capacitors”)
-
3.3kΩ resistor (see “Resistors and Capacitors”)
-
9V battery and clip lead
Figure 13-12 shows the arrangement for this, using a breadboard. The setup will measure the voltage of the battery.
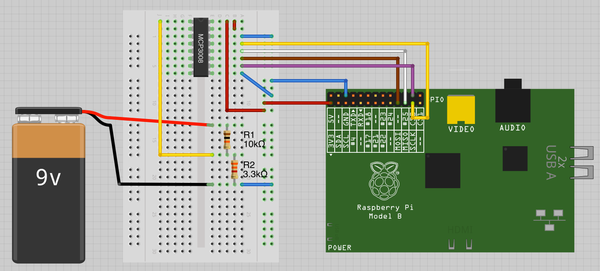
Figure 13-12. Reducing the voltage of analog inputs
Warning
Never use this recipe to measure high-voltage AC, or for that matter, any type of AC. It is for low-voltage DC only.
Open an editor (nano or IDLE) and paste in the following code. As with all the program examples in this book, you can also download the program from the Code section of the Raspberry Pi Cookbook website, where it is called adc_scaled.py.
importspidevR1=10000.0R2=3300.0spi=spidev.SpiDev()spi.open(0,0)defanalog_read(channel):r=spi.xfer2([1,(8+channel)<<4,0])adc_out=((r[1]&3)<<8)+r[2]returnadc_outreading=analog_read(0)voltage_adc=reading*3.3/1024voltage_actual=voltage_adc/(R2/(R1+R2))("Battery Voltage="+str(voltage_actual))
The program is very similar to that of Recipe 13.5. The main difference is the scaling, using the values of the two resistors. The values of these two resistors are held in the variables R1 and R2.
When you run the program, the battery voltage will be displayed:
$ sudo python adc_scaled.py
Battery Voltage=8.62421875
Warning
Read the discussion carefully before attaching anything higher than 9V, or you may destroy the MCP3008.
Discussion
This arrangement of resistors is called a voltage divider or sometimes a potential divider (Figure 13-13). The formula for calculating the output voltage, given the input voltage and the values of the two resistors, is:
- Vout = Vin * R2 / (R1 + R2)
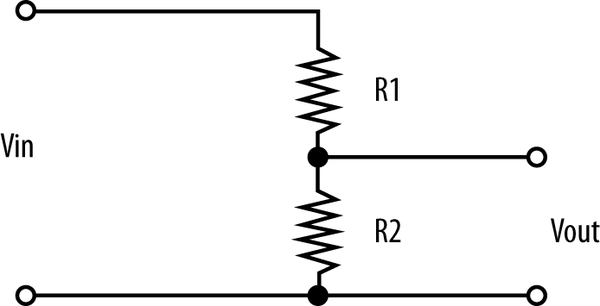
Figure 13-13. A voltage divider
This means that if R1 and R2 were both the same value (say, 1kΩ), then Vout would be half of Vin.
When choosing R1 and R2, you also need to consider the current flowing through R1 and R2. This will be Vin/(R1 + R2). In the preceding example, R1 is 10kΩ and R2 is 3.3kΩ. So the current flowing will be 9V/13.3kΩ = 0.68mA. This is low, but still enough to eventually drain the battery, so do not leave it connected all the time.
See Also
To avoid the math, you can use an online resistor calculator.
The voltage divider is also used to convert resistance to voltage when using a resistive sensor with an ADC (Recipe 13.7).
13.7 Using Resistive Sensors with an ADC
Solution
Use a potential divider with one fixed resistor and the resistive sensor to convert the resistance of the sensor into a voltage that can be measured with the ADC.
As an example, you can remake the light sensor project of Recipe 13.2 to use the MCP3008 instead of the step response technique.
To try this recipe, you will need:
-
Breadboard and jumper wires (see “Prototyping Equipment”)
-
MCP3008 eight-channel ADC IC (see “Integrated Circuits”)
-
10kΩ resistor (see “Resistors and Capacitors”)
-
Photoresistor (see “Resistors and Capacitors”)
Figure 13-14 shows the arrangement for this, using a breadboard.
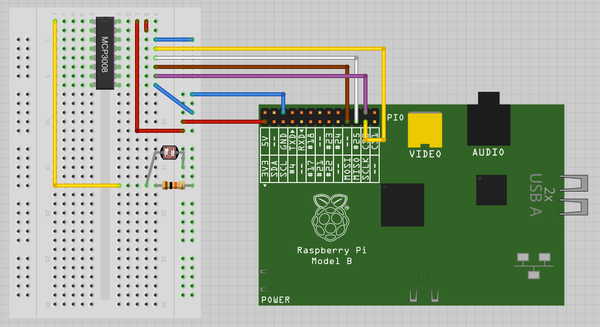
Figure 13-14. Using a photoresistor with an ADC
You can use the exact same program as Recipe 13.5 (adc_test.py). Covering up the light sensor with your hand changes the readings. You also need to set up SPI on your Raspberry Pi, so if you haven’t already done so, follow Recipe 9.5.
$ sudo python adc_test.py

Reading=341	Voltage=1.098926
Reading=342	Voltage=1.102148
Reading=227	Voltage=0.731543
Reading=81	Voltage=0.261035
Reading=86	Voltage=0.277148
These readings may be quite a bit different, depending on your photoresistor, but the important thing is that the figure changes as the light level changes.
Discussion
Choice of fixed value resistor is not very critical. If the value is too high or low, then you will find that the range of readings is rather narrow. Select a resistor value somewhere between the minimum and maximum resistance of the sensor. You may need to experiment with a few resistors before deciding on one that suits your sensor over the range of readings you’re interested in. If in doubt, start with 10kΩ and see how that works.
You can swap out the photoresistor for pretty much any resistive sensor. So, for instance, you could use the gas sensor from Recipe 13.4.
See Also
To measure light intensity without the complication of an ADC, see Recipe 13.2. For an example of using more than one channel of the ADC at a time, see Recipe 13.12.
13.8 Measuring Temperature with an ADC
Solution
Use an MCP3008 ADC chip.
However, unless you need more than one analog channel, you should consider using the DS18B20 digital temperature sensor, which is more accurate and doesn’t require a separate ADC chip (Recipe 13.11).
To try this recipe, you will need:
-
Breadboard and jumper wires (see “Prototyping Equipment”)
-
MCP3008 eight-channel ADC IC (see “Integrated Circuits”)
-
TMP36 temperature sensor (see “Integrated Circuits”)
Figure 13-15 shows the arrangement for this, using a breadboard.
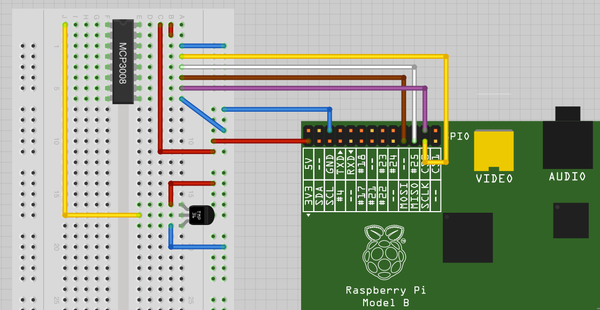
Figure 13-15. Using a TMP36 with an ADC
Make sure that you get the TMP36 facing the right way. One side of the package is flat, while the other is curved.
You will need to set up SPI on your Raspberry Pi, so if you haven’t already done so, follow Recipe 9.5.
Open an editor (nano or IDLE) and paste in the following code. As with all the program examples in this book, you can also download the program from the Code section of the Raspberry Pi Cookbook website, where it is called adc_tmp36.py.
importspidev,timespi=spidev.SpiDev()spi.open(0,0)defanalog_read(channel):r=spi.xfer2([1,(8+channel)<<4,0])adc_out=((r[1]&3)<<8)+r[2]returnadc_outwhileTrue:reading=analog_read(0)voltage=reading*3.3/1024temp_c=voltage*100-50temp_f=temp_c*9.0/5.0+32("Temp C=%f\t\tTemp f=%f"%(temp_c,temp_f))time.sleep(1)
The program is based on that of Recipe 13.8. A little bit of additional math calculates the temperature in degrees Celsius and Fahrenheit:
$ sudo python adc_tmp36.py
Temp C=19.287109        Temp f=66.716797
Temp C=18.642578        Temp f=65.556641
Temp C=18.964844        Temp f=66.136719
Temp C=20.253906        Temp f=68.457031
Temp C=20.898438        Temp f=69.617188
Temp C=20.576172        Temp f=69.037109
Temp C=21.865234        Temp f=71.357422
Temp C=23.154297        Temp f=73.677734
Temp C=23.476562        Temp f=74.257812
Temp C=23.476562        Temp f=74.257812
Temp C=24.121094        Temp f=75.417969
Temp C=24.443359        Temp f=75.998047
Temp C=25.087891        Temp f=77.158203
Discussion
The TMP36 outputs a voltage that is proportional to the temperature. According to the datasheet for the TMP36, the temperature in degrees C is calculated as the voltage (in volts) times 100 minus 50.
The TMP36 is fine for measuring the approximate temperature but is specified as having an accuracy of only 2 degrees C. This will only get worse if you attach long leads to it. To some extent, you can calibrate an individual device, but for better accuracy, use a DS18B20 (Recipe 13.11), which has a stated accuracy of 0.5% over a temperature range of -10 to +85 degrees C. Being a digital device, it should not suffer any loss of accuracy when attached to long leads.
See Also
Take a look at the TMP36 datasheet.
To measure temperature using a thermistor, see Recipe 13.3.
To measure temperature using a digital temperature sensor (DS18B20), see Recipe 13.11.
To measure temperature using a Sense HAT, see Recipe 13.10.
13.9 Measuring the Raspberry Pi CPU Temperature
Solution
Use the os library to access the temperature sensor built into the Broadcom chip.
Open an editor (nano or IDLE) and paste in the following code. As with all the program examples in this book, you can also download the program from the Code section of the Raspberry Pi Cookbook website, where it is called cpu_temp.py.
importos,timewhileTrue:dev=os.popen('/opt/vc/bin/vcgencmd measure_temp')cpu_temp=dev.read()(cpu_temp)time.sleep(1)
When you run this program, it will report the temperature. Note that the message printed is actually a string with temp= before the temperature and 'C after it.
$ python cpu_temp.py
temp=33.6'C
temp=33.6'C
Discussion
If you want the temperature as a number rather than a string, you need to chop off the extra text and then convert the number to a float. You can find an example program for this in cpu_temp_float.py.
importos,timewhileTrue:dev=os.popen('/opt/vc/bin/vcgencmd measure_temp')cpu_temp_s=dev.read()[5:-3]# top and tail stringcpu_temp=float(cpu_temp_s)(cpu_temp)time.sleep(1)
See Also
For more information on chopping up strings, see Recipe 5.15.
To measure temperature using a thermistor, see Recipe 13.3.
To measure temperature using a TMP36, see Recipe 13.8.
To measure temperature using a digital temperature sensor (DS18B20), see Recipe 13.11.
To measure temperature using a Sense HAT, see Recipe 13.10.
13.10 Measuring Temperature, Humidity, and Pressure with a Sense HAT
Solution
Use a Raspberry Pi Sense HAT (Figure 13-16). That way you get all those sensors plus some extras like a display.
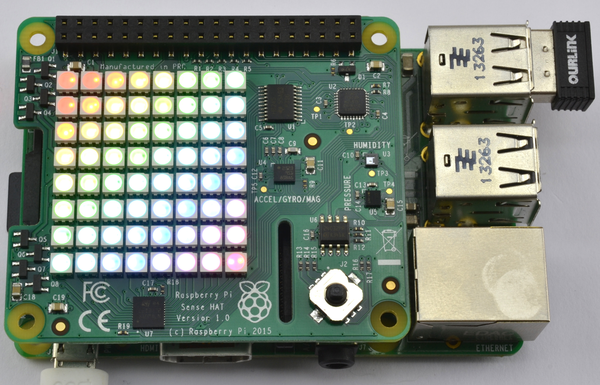
Figure 13-16. A Sense HAT
Start by following Recipe 9.16 to install the libraries needed by the Sense HAT.
Open an editor (nano or IDLE) and paste in the following code. As with all the program examples in this book, you can also download the program from the Code section of the Raspberry Pi Cookbook website, where it is called sense_hat_thp.py.
fromsense_hatimportSenseHatimporttimehat=SenseHat()whileTrue:t=hat.get_temperature()h=hat.get_humidity()p=hat.get_pressure()('Temp C:{:.2f} Hum:{:.0f} Pres:{:.0f}'.format(t,h,p))time.sleep(1)
When you run the program, the terminal will display something like this:
$ sudo python sense_hat_thp.py
Temp C:27.71 Hum:56 Pres:1005
Temp C:27.60 Hum:55 Pres:1005
The temperature is in degrees C, the humidity is the percentage of relative humidity, and the atmospheric pressure is in millibars.
Discussion
You will find that the temperature readings from the Sense HAT are on the high side. This is because the temperature sensor is built into the humidity sensor and is on the Sense HAT PCB. The Sense HAT generates very little heat (unless you use the display) but the Raspberry Pi under the Sense HAT does get warm and will increase the temperature of the HAT. The best way to avoid this problem is to use a 40-way ribbon cable to move the Sense HAT away from the Raspberry Pi. There are also attempts to adjust the readings by using the temperature reading of the Raspberry Pi, and you can follow a discussion on that at http://bit.ly/1OfEEWf. Personally, I feel that these compensation attempts are probably very specific to the users posting and are unlikely to produce reliable results.
As well as reading the temperature from the humidity sensor, the pressure sensor also has a temperature sensor built in that you can read like this:
t=hat.get_temperature_from_pressure()
It is unclear from the documentation as to whether this reading is any more accurate than using the humidity sensor, but for my setup, it reported temperatures about 1 degree C lower than the humidity sensor.
See Also
To get started with the Sense HAT, see Recipe 9.16.
The programming reference for the Sense HAT is here: https://pythonhosted.org/sense-hat/api/.
The Sense HAT also has an accelerometer, gyroscope (Recipe 13.13) and magnetometer (Recipe 13.14) for navigation type projects. It also has a full-color 8×8 LED matrix display (Recipe 14.3).
13.11 Measuring Temperature Using a Digital Sensor
Solution
Use the DS18B20 digital temperature sensor. This device is more accurate than the TMP36 used in Recipe 13.8 and uses a digital interface, so it doesn’t require an ADC chip.
Although the interface to this chip is called one-wire, this just refers to the data pin. You do need at least one other wire to connect to a one-wire device.
To make this recipe, you will need:
-
Breadboard and jumper wires (see “Prototyping Equipment”)
-
DS18B20 temperature sensor (see “Integrated Circuits”)
-
4.7kΩ resistor (see “Resistors and Capacitors”)
Fit the components onto the breadboard as shown in Figure 13-17. Make sure that you get the DS18B20 facing the right way.
The latest version of Raspbian has support for the one-wire interface used by the DS18B20 but you do have to enable it.
To enable 1-wire support, edit the file /boot/config.txt using the command sudo nano /boot/config.txt and add the line shown below to the end of the file. Then reboot your Raspberry Pi for the change to take effect.
$ dtoverlay=w1-gpio
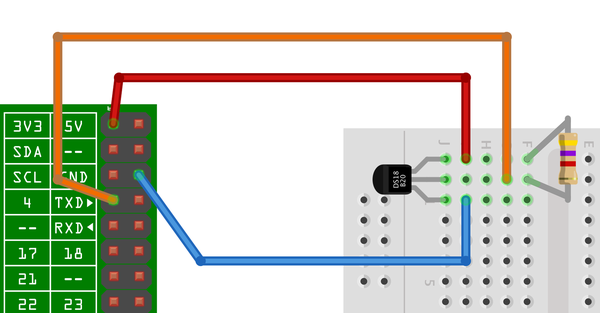
Figure 13-17. Connecting a DS18B20 to a Raspberry Pi
Open an editor (nano or IDLE) and paste in the following code. As with all the program examples in this book, you can also download the program from the Code section of the Raspberry Pi Cookbook website, where it is called temp_DS18B20.py.
importglob,timebase_dir='/sys/bus/w1/devices/'device_folder=glob.glob(base_dir+'28*')[0]device_file=device_folder+'/w1_slave'defread_temp_raw():f=open(device_file,'r')lines=f.readlines()f.close()returnlinesdefread_temp():lines=read_temp_raw()whilelines[0].strip()[-3:]!='YES':time.sleep(0.2)lines=read_temp_raw()equals_pos=lines[1].find('t=')ifequals_pos!=-1:temp_string=lines[1][equals_pos+2:]temp_c=float(temp_string)/1000.0temp_f=temp_c*9.0/5.0+32.0returntemp_c,temp_fwhileTrue:("temp C=%f\ttemp F=%f"%read_temp())time.sleep(1)
When the program is run, it will report the temperature once a second in both degrees Celsius and Fahrenheit:
$ python temp_DS18B20.py
temp C=25.187000 temp F=77.336600
temp C=25.125000	temp F=77.225000
temp C=25.062000	temp F=77.111600
temp C=26.312000	temp F=79.361600
temp C=27.875000	temp F=82.175000
temp C=28.875000	temp F=83.975000
Discussion
At first sight, the program looks a little odd. The interface to the DS18B20 uses a file-like interface. The file interface for the device will always be in the folder /sys/bus/w1/devices/ and the name of the file path will start with 28, but the rest of the file path will be different for each sensor.
The code assumes that there will only be one sensor, and finds the first folder starting with 28. To use multiple sensors, use different index values inside the square brackets.
Within that folder will be a file called w1_slave, which is opened and read to find the temperature.
The sensor actually returns strings of text like this:
81 01 4b 46 7f ff 0f 10 71 : crc=71 YES
81 01 4b 46 7f ff 0f 10 71 t=24062
The remainder of the code extracts the temperature part of this message. This appears after t= and is the temperature in one-thousandths of a degree Celsius.
The read_temp function calculates the temperature in both degrees Celsius and Fahrenheit and returns both values.
Besides the basic chip version of the DS18B20, you can also buy a version encapsulated in a rugged and waterproof probe.
See Also
To find out about logging readings, see Recipe 13.20.
This recipe is heavily based on an Adafruit tutorial.
Take a look at the datasheet for the DS18B20.
To measure temperature using a thermistor, see Recipe 13.3.
To measure temperature using a TMP36, see Recipe 13.8.
To measure temperature using a Sense HAT, see Recipe 13.10.
13.12 Measuring Acceleration with an MCP3008 Module
Solution
Use an analog accelerometer with an MCP3008 ADC chip to measure the X, Y, and Z analog outputs.
To try this recipe, you will need:
-
Breadboard and jumper wires (see “Prototyping Equipment”)
-
MCP3008 eight-channel ADC IC (see “Integrated Circuits”)
-
ADXL335 triple-axis accelerometer (see “Modules”)
Figure 13-18 shows the arrangement for this, using a breadboard. It uses three channels of the ADC to measure the X, Y, and Z acceleration forces.
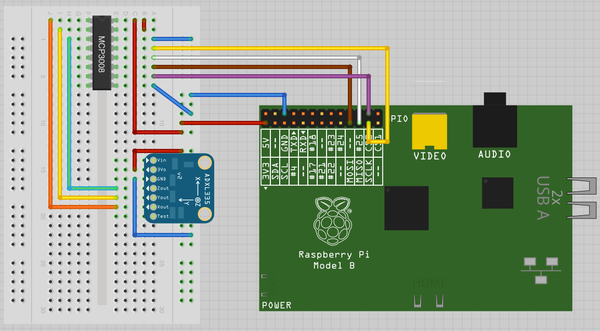
Figure 13-18. Using a triple-axis accelerometer
You will need to set up SPI on your Raspberry Pi, so if you have not already done so, follow Recipe 9.5.
Open an editor (nano or IDLE) and paste in the following code. As with all the program examples in this book, you can also download the program from the Code section of the Raspberry Pi Cookbook website, where it is called adc_accelerometer.py.
importspidev,timespi=spidev.SpiDev()spi.open(0,0)defanalog_read(channel):r=spi.xfer2([1,(8+channel)<<4,0])adc_out=((r[1]&3)<<8)+r[2]returnadc_outwhileTrue:x=analog_read(0)y=analog_read(1)z=analog_read(2)("X=%d\tY=%d\tZ=%d"%(x,y,z))time.sleep(1)
The program simply reads the three forces and prints them out:
$ sudo python adc_accelerometer.py
X=508   Y=503	Z=626
X=508	Y=504	Z=624
X=506	Y=505	Z=627
X=423	Y=517	Z=579
X=411	Y=513	Z=548
X=532	Y=510	Z=623
X=609	Y=518	Z=495
X=607	Y=521	Z=496
X=610	Y=513	Z=499
The first three readings took place with the accelerometer level. In the next three, the whole breadboard was tipped to one side. You can see that the X reading has decreased. Tipping the breadboard the other way causes the X reading to increase.
Discussion
The most common use for an accelerometer is to detect tilt. This works because the Z axis force is dominated by the pull of gravity (Figure 13-19).
When the accelerometer is tilted in one direction, some of that vertical force of gravity becomes active on another axis of the accelerometer.
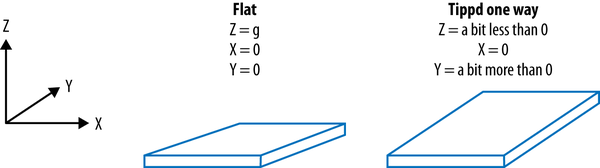
Figure 13-19. Detecting tilt with an accelerometer
We can use this principle to detect when the tilt is past a certain threshold. The following program (tilt.py) illustrates this point:
importspidev,timespi=spidev.SpiDev()spi.open(0,0)defanalog_read(channel):r=spi.xfer2([1,(8+channel)<<4,0])adc_out=((r[1]&3)<<8)+r[2]returnadc_outwhileTrue:x=analog_read(0)y=analog_read(1)z=analog_read(2)ifx<450:("Left")elifx>550:("Right")elify<450:("Back")elify>550:("Forward")time.sleep(0.2)
When you run the program, you will start to see direction messages. You could use this to control a roving robot or a motorized pan-tilt head with a webcam attached:
$ sudo python tilt.py
Left
Left
Right
Forward
Forward
Back
Back
See Also
See the datasheet for the accelerometer chip used in the module.
There are many other analog accelerometer modules available. You may find that they give different readings. Make sure that the analog outputs do not exceed 3.3V.
The Sense HAT includes an accelerometer (Recipe 13.13).
13.13 Using the Inertial Management Unit (IMU) of the Sense HAT
Problem
You want more accurate orientation information from your Raspberry Pi than the accelerometer from Recipe 13.12 provides.
Solution
Use the Inertial Management Unit (IMU) of the Sense HAT. This unit includes a 3-axis accelerometer like the one in Recipe 13.12 but also has a 3-axis gyroscope and magnetometer. The readings from these different sensors are combined to let you get a more accurate orientation for the Sense HAT expressed as pitch, roll, and yaw (as shown in Figure 13-20).
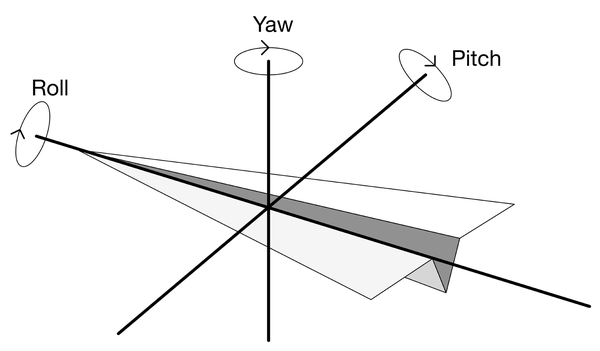
Figure 13-20. Pitch, roll, and yaw
Pitch, roll, and yaw are three terms that come from aviation. They are relative to the axis of the plane’s flight. The pitch is the angle to the horizontal. The roll is the degree of rotation around the plane’s axis of flight (imagine one wing going up and the other down), and yaw is the rotation on the horizontal axis (think changing bearing).
Open an editor (nano or IDLE) and paste in the following code. As with all the program examples in this book, you can also download the program from the Code section of the Raspberry Pi Cookbook website, where it is called sense_hat_orientation.py.
fromsense_hatimportSenseHatsense=SenseHat()sense.set_imu_config(True,True,True)whileTrue:o=sense.get_orientation()("p: {:.0f}, r: {:.0f}, y: {:.0f}".format(o['pitch'],o['roll'],o['yaw']))
The function set_imu_config specifies which of the compass, gyroscope, and accelerometer (in that order) should be used to measure the orientation. Setting all three to True will mean that all are used to make the measurement.
When you run the program, you will see output similar to this:
$ sudo python sense_hat_orientation.py
p: 1, r: 317, y: 168
p: 1, r: 318, y: 169
Try tilting the Sense HAT and Raspberry Pi forward toward the USB ports, and you should see the value of pitch increase.
Discussion
An accelerometer measures forces on a stationary mass and can therefore measure the degree of tilt by calculating how much of the force supplied by gravity (z-axis) influences the force measured on the x and y axes.
A gyroscope is different. It measures the force on moving masses (vibrating back and forth) as those masses turn relative to the path of the movement, using an effect called the Coriolis effect.
See Also
For more information on the Sense HAT’s IMU, see https://www.raspberrypi.org/learning/astro-pi-guide/sensors/movement.md.
To measure temperature, humidity, and atmospheric pressure, see Recipe 13.10.
The IMU of the Sense HAT can also be used to make a compass and detect the presence of a magnet (Recipe 13.16).
To find out more about gyroscopes and the Coriolis effect, see https://en.wikipedia.org/wiki/Coriolis_effect.
13.14 Finding Magnetic North with the Sense HAT
Solution
Use the Python library for the built-in 3-axis magnetometer in the Sense HAT.
First follow Recipe 9.16 to install the Sense HAT library.
Open an editor (nano or IDLE) and paste in the following code. As with all the program examples in this book, you can also download the program from the Code section of the Raspberry Pi Cookbook website, where it is called sense_hat_compass.py.
fromsense_hatimportSenseHatsense=SenseHat()whileTrue:bearing=sense.get_compass()('Bearing: {:.0f} to North'.format(bearing))
When you run this program, you will see a series of bearing readings.
$ sudo python sense_hat_compass.py
Bearing: 138 to North
Bearing: 138 to North
Discussion
The compass will be sensitive to any other nearby sources of magnetic field so you may find it difficult to get accurate bearings.
See Also
You can find documentation for Sense HAT at https://github.com/RPi-Distro/python-sense-hat and http://pythonhosted.org/sense-hat/api/.
To use the Sense HAT to detect a magnet, see Recipe 13.16.
13.15 Sensing a Magnet with a Reed Switch
Solution
Use a reed switch (Figure 13-21). It works just like a regular switch except it only activates when a magnet is near. Figure 13-22 shows how a reed switch works.
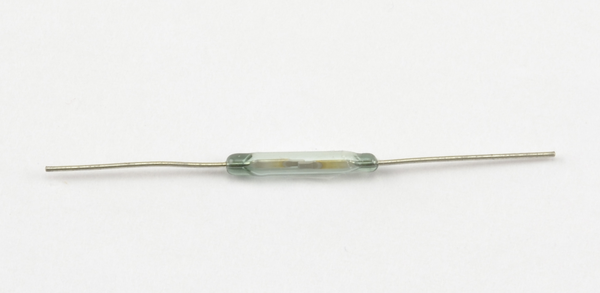
Figure 13-21. A reed switch
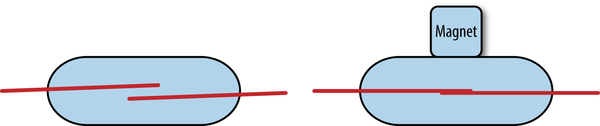
Figure 13-22. How a reed switch works
The two reed contacts are encased in a a glass tube. When a magnet is placed near the reed switch, the reeds are pulled together and make contact.
You can use any of the regular switch recipes in Chapter 12 with a reed switch, starting with Recipe 12.1.
Discussion
Reed switches are a low-tech way of detecting a magnet. They have been around since the 1930s and are extremely reliable. They are also commonly used in security systems where a plastic encased reed switch is placed on a door frame, with a fixed magnet in another plastic enclosure on the door itself. When the door opens, the reed switch contacts open, triggering the alarm.
See Also
To detect a magnet using the magnetometer of the Sense HAT, see Recipe 13.16.
13.16 Sensing a Magnet with the Sense HAT
Solution
Use the Sense HAT’s Python library to interface with its magnetometer.
Open an editor (nano or IDLE) and paste in the following code. As with all the program examples in this book, you can also download the program from the Code section of the Raspberry Pi Cookbook website, where it is called sense_hat_magnet.py.
fromsense_hatimportSenseHatimporttimehat=SenseHat()fill=(255,0,0)whileTrue:reading=int(hat.get_compass_raw()['z'])ifreading>200:hat.clear(fill)time.sleep(0.2)else:hat.clear()
When the magnet gets close to the Sense HAT, the LEDs will all turn red for 1/5 of a second.
Discussion
It doesn’t matter which axis of the compass data you use; they will all be greatly disrupted by the presence of a fixed magnet.
See Also
To detect a magnet using a reed switch, see Recipe 13.15.
For other ways to use the Sense HAT display, see Recipe 14.3.
13.17 Measuring Distance
Solution
Use a low-cost SR-04 rangefinder. These devices need two GPIO pins: one to trigger the pulse of ultrasound and the other to monitor how long it takes for the echo to return.
To make this recipe, you will need:
-
Breadboard and jumper wires (see “Prototyping Equipment”)
-
SR-04 rangefinder (eBay)
-
470Ω resistor (see “Resistors and Capacitors”)
-
270Ω resistor (see “Resistors and Capacitors”)
Fit the components onto the breadboard as shown in Figure 13-23. The resistors are necessary to reduce the echo output of the rangefinder from 5V to 3.3V (see Recipe 9.12).
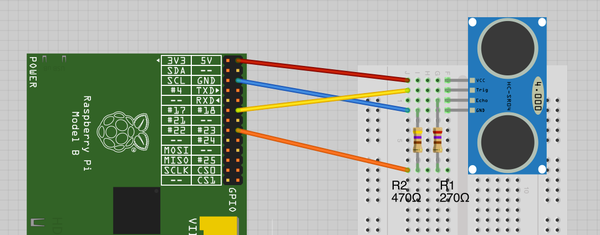
Figure 13-23. Connecting an SR-04 rangefinder to a Raspberry Pi
Open an editor (nano or IDLE) and paste in the following code. As with all the program examples in this book, you can also download the program from the Code section of the Raspberry Pi Cookbook website, where it is called ranger.py.
importRPi.GPIOasGPIOimporttimetrigger_pin=18echo_pin=23GPIO.setmode(GPIO.BCM)GPIO.setup(trigger_pin,GPIO.OUT)GPIO.setup(echo_pin,GPIO.IN)defsend_trigger_pulse():GPIO.output(trigger_pin,True)time.sleep(0.0001)GPIO.output(trigger_pin,False)defwait_for_echo(value,timeout):count=timeoutwhileGPIO.input(echo_pin)!=valueandcount>0:count=count-1defget_distance():send_trigger_pulse()wait_for_echo(True,10000)start=time.time()wait_for_echo(False,10000)finish=time.time()pulse_len=finish-startdistance_cm=pulse_len/0.000058distance_in=distance_cm/2.5return(distance_cm,distance_in)whileTrue:("cm=%f\tinches=%f"%get_distance())time.sleep(1)
The operation of the program is described in the next Discussion. When the program is run, it will report the distance in both centimeters and inches, once per second. Use your hand or some other obstacle to change the reading.
sudo python ranger.py
cm=154.741879   inches=61.896752
cm=155.670889	inches=62.268356
cm=154.865199	inches=61.946080
cm=12.948595	inches=5.179438
cm=14.087249	inches=5.634900
cm=13.741954	inches=5.496781
cm=20.775302	inches=8.310121
cm=20.224473	inches=8.089789
Discussion
While there are a number of ultrasonic rangefinders available, the type used here is easy to use and low cost. It works by sending a pulse of ultrasound and then measuring the amount of time taken for the echo to be received. One of the round ultrasonic transducers on the front of the device is the transmitter, and the other is the receiver.
This process is controlled from the Raspberry Pi. The difference between this type of device and more expensive models is that the more expensive versions include their own microcontroller, which carries out all the necessary timing and provides an I2C or serial interface to return a final reading.
When you are using one of these sensors with a Raspberry Pi, the trig (trigger) input to the rangefinder is connected to a GPIO output, and the echo output of the rangefinder is connected to a GPIO input on the Raspberry Pi after having its voltage range lowered from 5V to a safe 3.3V.
Figure 13-24 shows an oscilloscope trace of the sensor in action. The top (red) trace is connected to trig, and the bottom (yellow) trace is connected to echo. You can see that first the trig pin is taken high for a short pulse. There is then a short delay before the echo pin goes high. This stays high for a period that is proportional to the distance from the sensor.
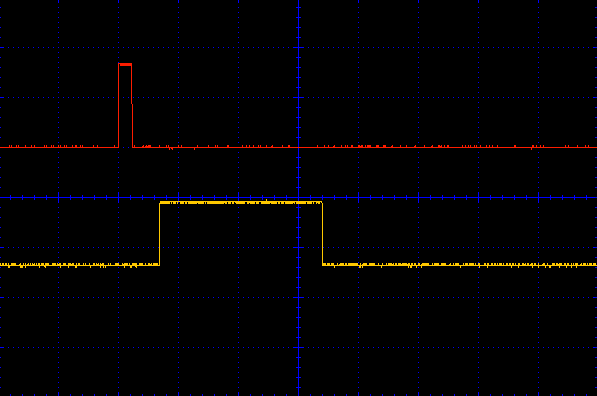
Figure 13-24. The oscilloscope trace for trigger and echo
The code for this sensor first generates a trigger pulse (using the function send_trigger_pulse). It must wait until the echo pin goes high, and then times how long the echo pin stays high.
We can then calculate the distance by using the time taken for the echo pulse and the speed of sound.
The wait_for_echo function waits until the echo pin either goes high or low, depending on its first argument. Its second argument is used to provide a timeout so that if for any reason, the echo pin does not change to the state being waited for, the loop won’t hang indefinitely.
This method of measuring distance is not terribly accurate because temperature, pressure, and relative humidity all alter the speed of sound and hence the distance readings.
See Also
Take a look at the datasheet for the ultrasonic rangefinder.
13.18 Capacitative Touch Sensing
Solution
Use an Adafruit Capacitative Touch HAT (Figure 13-25).
Touch sensors are a lot of fun and are great for educational use. You can attach anything that conducts electricity a little, including fruit. A popular project is to construct a fruit keyboard using a variety of fruits and vegetables attached to the sense terminals on the board using alligator clips. Then as you touch the different items of fruit, different sounds are made.
The Adafruit Touch HAT uses the Raspberry Pi’s I2C interface. You also need SPI tools installed, so if you have not already done so, follow Recipe 9.3.
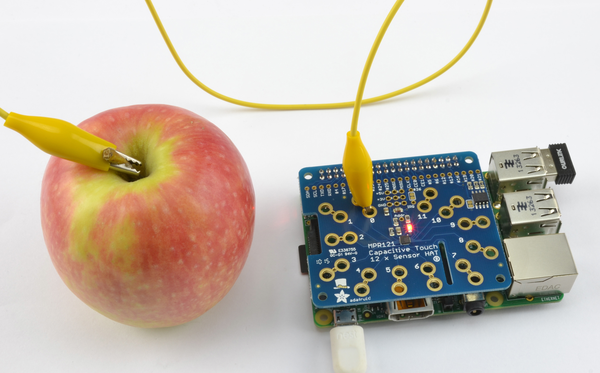
Figure 13-25. An Adafruit Capacitative Touch HAT attached to an apple
To install the Python library for the HAT, run the following commands:
$ cd /home/pi
$ git clone https://github.com/adafruit/Adafruit_Python_MPR121.git
$ cd Adafruit_Python_MPR121/
$ sudo python setup.py install
To test out the Touch HAT, run the simpletest.py example supplied with the library by using the commands:
$ cd examples
$ sudo python simpletest.py
Adafruit MPR121 Capacitive Touch Sensor Test
Press Ctrl-C to quit.
0 touched!
0 released!
You can either just touch the connection pads or connect the pads to a piece of fruit using an alligator clip as shown in Figure 13-25.
Discussion
You will find other example programs in the examples folder, including the ever popular fruit-based musical keyboard.
The Adafruit Touch HAT has 12 touch contacts. If you only need a few touch contacts, you can use the Pimoroni Explorer HAT Pro, which has four alligator-clip–compatible contacts (Figure 13-26).
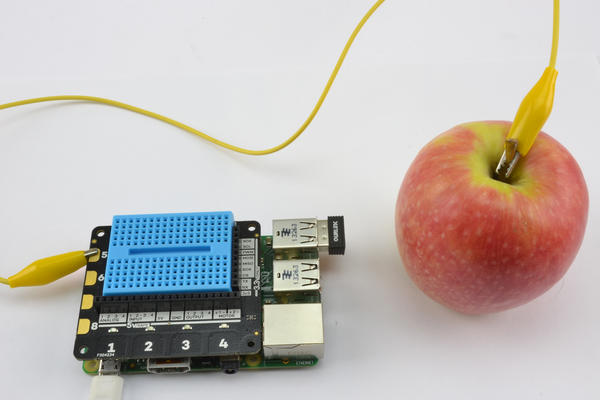
Figure 13-26. The Explorer HAT Pro with fruit
To use the Explorer HAT Pro’s touch contacts, first follow Recipe 9.17 to install the library for the HAT.
In addition to the four terminals on the side, designed for alligator clips, there are also four touch switches labeled 1 to 4 that also use the touch interface.
To try out touch on the Explorer HAT Pro, open a Python console and run the following commands to detect touches:
>>> import explorerhat
Explorer HAT Pro detected...
>>> explorerhat.touch.five.is_pressed()
True
>>> explorerhat.touch.five.is_pressed()
False
>>>
If you run the is_pressed() function while holding the apple, the result will be True; otherwise, it will be False.
See Also
For documentation of the Adafruit Touch HAT, see https://www.adafruit.com/products/2340, and for the Explorer HAT Pro, see https://github.com/pimoroni/explorer-hat.
13.19 Displaying Sensor Values
Solution
Use the Tkinter library to open a window and write the reading on it as a label with a large font (Figure 13-27).
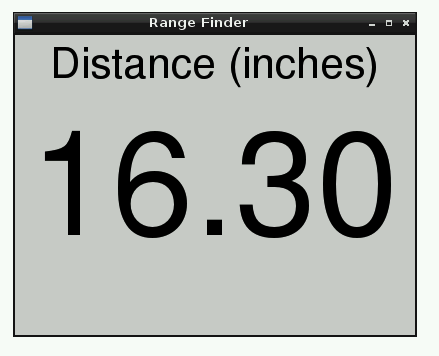
Figure 13-27. Displaying a sensor reading using Tkinter
This example uses data from the ultrasonic rangefinder of Recipe 13.17. So, complete that recipe first if you want to try out this example.
To test out the rangefinder, open an editor (nano or idle) and paste in the following code. As with all the program examples in this book, you can also download the program from the Code section of the book’s website, where it is called gui_sensor_reading.py. The code for measuring distances using the ultrasonic sensor is the same as in Recipe 13.17, so only the section of the code concerned with displaying the value is repeated here:
classApp:def__init__(self,master):self.master=masterframe=Frame(master)frame.pack()label=Label(frame,text='Distance (inches)',font=("Helvetica",32))label.grid(row=0)self.reading_label=Label(frame,text='12.34',font=("Helvetica",110))self.reading_label.grid(row=1)self.update_reading()defupdate_reading(self):cm,inch=get_distance()reading_str="{:.2f}".format(inch)self.reading_label.configure(text=reading_str)self.master.after(500,self.update_reading)root=Tk()root.wm_title('Range Finder')app=App(root)root.geometry("400x300+0+0")root.mainloop()
Discussion
Athough this recipe uses a distance sensor, it works equally well with the other sensor recipes in this chapter. You just need to change the labels and the method of obtaining a reading from the sensor.
See Also
For information on formatting numbers to a certain number of decimal places, see Recipe 7.1.
For an example of displaying sensor data in a web browser rather than an application window, see Recipe 15.2.
13.20 Logging to a USB Flash Drive
Solution
Write a Python program that writes the data to a file on a USB flash drive. By writing the file in comma-separated values (CSV), you can import it directly into a spreadsheet, including Gnumeric on the Raspberry Pi (Recipe 4.2).
The example program will log temperature readings recorded from a DS18B20. So if you wish to try this out, first build Recipe 13.11.
Open an editor (nano or IDLE) and paste in the following code. As with all the program examples in this book, you can also download the program from the Code section of the Raspberry Pi Cookbook website, where it is called temp_log.py.
importos,glob,time,datetimelog_period=600# secondslogging_folder=glob.glob('/media/*')[0]dt=datetime.datetime.now()file_name="temp_log_{:%Y_%m_%d}.csv".format(dt)logging_file=logging_folder+'/'+file_nameos.system('modprobe w1-gpio')os.system('modprobe w1-therm')base_dir='/sys/bus/w1/devices/'device_folder=glob.glob(base_dir+'28*')[0]device_file=device_folder+'/w1_slave'defread_temp_raw():f=open(device_file,'r')lines=f.readlines()f.close()returnlinesdefread_temp():lines=read_temp_raw()whilelines[0].strip()[-3:]!='YES':time.sleep(0.2)lines=read_temp_raw()equals_pos=lines[1].find('t=')ifequals_pos!=-1:temp_string=lines[1][equals_pos+2:]temp_c=float(temp_string)/1000.0temp_f=temp_c*9.0/5.0+32.0returntemp_c,temp_fdeflog_temp():temp_c,temp_f=read_temp()dt=datetime.datetime.now()f=open(logging_file,'a')f.write('\n"{:%H:%M:%S}",'.format(dt))f.write(str(temp_c))f.close()("Logging to: "+logging_file)whileTrue:log_temp()time.sleep(log_period)
The program is set to log the temperature every 10 minutes (600 seconds). You can alter this by changing the value of log_period.
Discussion
When you plug a USB flash drive into a Raspberry Pi, it automatically installs it under /media. If there is more than one removeable drive attached to your Raspberry Pi, then the program uses the first folder it finds inside /media. The name of the logging file is constructed from the current date.
If you open the file in a spreadsheet like Open Office, you will be able to edit it directly. Your spreadsheet may ask you to specify the separator for the data, which will be a comma.
Figure 13-28 shows a set of data captured using this recipe, and the resulting file has been opened with the Gnumeric spreadsheet running on the Raspberry Pi.
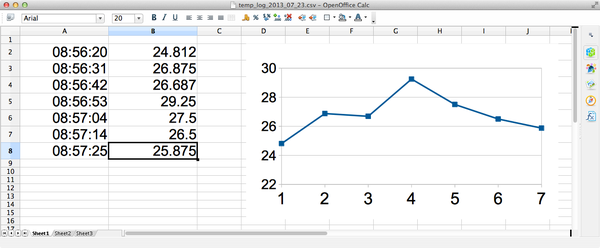
Figure 13-28. Charting data
See Also
This program could easily be adapted for use with any of the other sensors used in this chapter.
For an example of logging sensor data to a web service, see Recipe 15.6.