Table of Contents for
Learning Linux Shell Scripting
 Learning Linux Shell Scripting
Published by
Packt Publishing, 2015
Learning Linux Shell Scripting
Published by
Packt Publishing, 2015
- Cover
- Table of Contents
- Learning Linux Shell Scripting
- Learning Linux Shell Scripting
- Credits
- About the Author
- Acknowledgments
- About the Reviewers
- www.PacktPub.com
- Preface
- What you need for this book
- Who this book is for
- Conventions
- Reader feedback
- Customer support
- 1. Getting Started and Working with Shell Scripting
- Tasks done by shell
- Working in shell
- Learning basic Linux commands
- Our first script – Hello World
- Compiler and interpreter – difference in process
- When not to use scripts
- Various directories
- Working more effectively with shell – basic commands
- Working with permissions
- Summary
- 2. Drilling Deep into Process Management, Job Control, and Automation
- Monitoring processes using ps
- Process management
- Process monitoring tools – top, iostat, and vmstat
- Understanding "at"
- Understanding "crontab"
- Summary
- 3. Using Text Processing and Filters in Your Scripts
- IO redirection
- Pattern matching with the vi editor
- Pattern searching using grep
- Summary
- 4. Working with Commands
- Command substitution
- Command separators
- Logical operators
- Pipes
- Summary
- 5. Exploring Expressions and Variables
- Working with environment variables
- Working with read-only variables
- Working with command line arguments (special variables, set and shift, getopt)
- Understanding getopts
- Understanding default parameters
- Working with arrays
- Summary
- 6. Neat Tricks with Shell Scripting
- The here document and the << operator
- The here string and the <<< operator
- File handling
- Debugging
- Summary
- 7. Performing Arithmetic Operations in Shell Scripts
- Using the let command for arithmetic
- Using the expr command for arithmetic
- Binary, octal, and hex arithmetic operations
- A floating-point arithmetic
- Summary
- 8. Automating Decision Making in Scripts
- Understanding the test command
- Conditional constructs – if else
- Switching case
- Implementing simple menus with select
- Looping with the for command
- Exiting from the current loop iteration with the continue command
- Exiting from a loop with a break
- Working with the do while loop
- Using until
- Piping the output of a loop to a Linux command
- Running loops in the background
- The IFS and loops
- Summary
- 9. Working with Functions
- Passing arguments or parameters to functions
- Sharing the data by many functions
- Declaring local variables in functions
- Returning information from functions
- Running functions in the background
- Creating a library of functions
- Summary
- 10. Using Advanced Functionality in Scripts
- Using the trap command
- Ignoring signals
- Using traps in function
- Running scripts or processes even if the user logs out
- Creating dialog boxes with the dialog utility
- Summary
- 11. System Startup and Customizing a Linux System
- User initialization scripts
- Summary
- 12. Pattern Matching and Regular Expressions with sed and awk
- sed – noninteractive stream editor
- Using awk
- Summary
- Index
We can view the native performance of various processes in OS using tools which will be discussed further. To view a dynamic real-time view of the top running processes in OS, use the following command:
$top
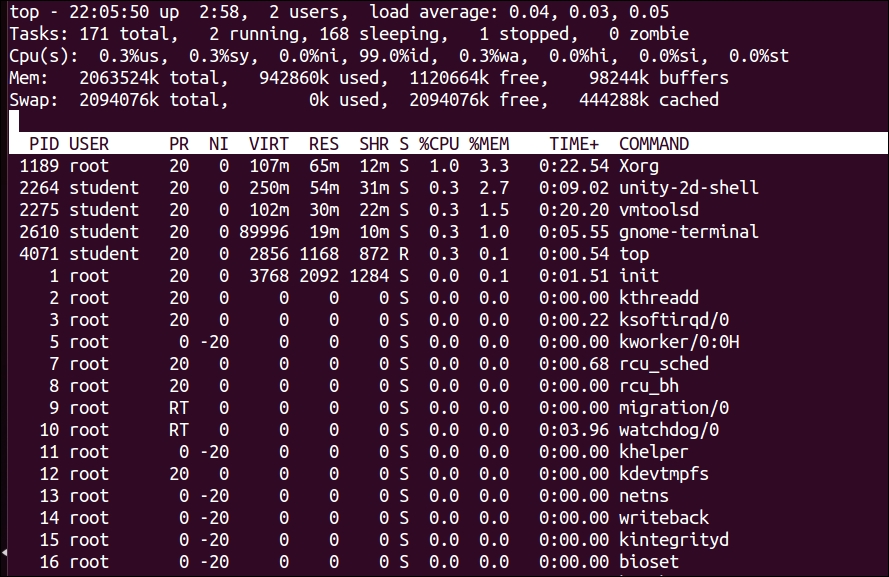
An explanation of the top command generated output is as follows:
The $top command displays a lot of information about the running system.
The first line of the display is shown as follows:

The description of fields in the first line is as follows:
The second line is shown as follows:

This line shows the summary of tasks or processes. It shows the total number of all the processes, which includes the total number of running, sleeping, stopped, and zombie processes.
The third line is shown as follows:

This line shows information about CPU usage in % in different modes as follows:
- * us (user): CPU usage in % for running (un-niced) the user processes
- * sy (system): CPU usage in % for running the kernel processes
- * ni (niced): CPU usage in % for running the niced user processes
- * wa (IO wait): CPU usage in % for waiting for the IO completion
- * hi (hardware interrupts): CPU usage in % for serving hardware interrupts
- * si (software interrupts): CPU usage in % for serving software interrupts
- * st (time stolen): CPU usage in % for time stolen for this vm by the hypervisor
The fourth line is shown as follows:

This line provides information about memory usage. It shows the physical memory that is used, free, available, and used for buffers. The next line shows the swap memory that is available, used, free, and cached.
After this line, we see the table of values with the following columns:
PID: This is the ID of the processUSER: This is the user that is the owner of the processPR: This is the priority of the processNI: This is the "NICE" value of the processVIRT: This is the virtual memory used by the processRES: This is the physical memory used for the processSHR: This is the shared memory of the processS: This indicates the status of the process: S=sleep, R=running, and Z=zombie (S)%CPU: This is the % of CPU used by this process%MEM: This is the % of RAM used by the processTIME+: This is the total time of activity of this processCOMMAND: This is the name of the process
Let's take a look at the performance monitoring tools—iostat, vmstat, and sar:
- To view the statistics of the CPU and the input/output device's utilization, use the following command:
$ iostat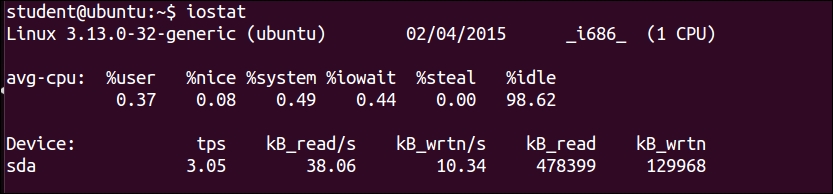
$ iostat –cShows only CPU statistics
$ iostat –dShows only disk statistics
- To view the virtual memory statistics, use the following command:
$vmstat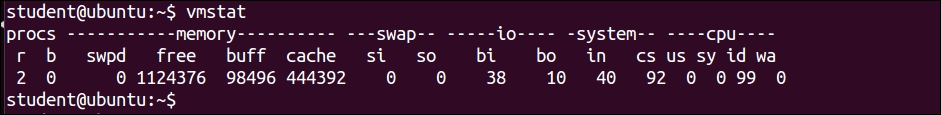
$ vmstat -sThis shows various event counters and memory statistics.
$ vmstat –t 1 5Runs for every one second stops after executing for five intervals.
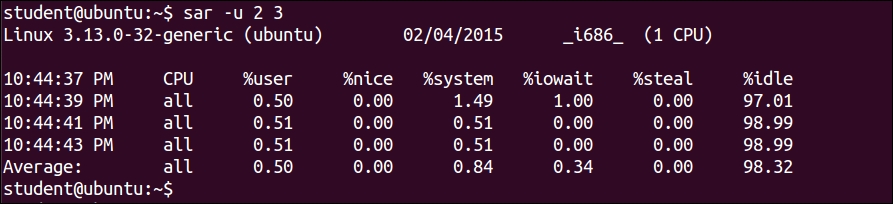
$ sar –u 2 3This will show the CPU activity report every 2 seconds, 3 times: