Table of Contents for
Optimizing Java
 Optimizing Java
Published by
O'Reilly Media, Inc., 2018
Optimizing Java
Published by
O'Reilly Media, Inc., 2018
- nav
- Cover
- Optimizing Java
- Optimizing Java
- Dedication
- Foreword
- Preface
- 1. Optimization and Performance Defined
- 2. Overview of the JVM
- 3. Hardware and Operating Systems
- 4. Performance Testing Patterns and Antipatterns
- 5. Microbenchmarking and Statistics
- 6. Understanding Garbage Collection
- 7. Advanced Garbage Collection
- 8. GC Logging, Monitoring, Tuning, and Tools
- 9. Code Execution on the JVM
- 10. Understanding JIT Compilation
- 11. Java Language Performance Techniques
- 12. Concurrent Performance Techniques
- 13. Profiling
- 14. High-Performance Logging and Messaging
- 15. Java 9 and the Future
- Index
- About the Authors
- Colophon
Chapter 10. Understanding JIT Compilation
In this chapter we will delve deeper into the inner workings of the JVM’s JIT compiler. The majority of the material is directly applicable to HotSpot, and is not guaranteed to be the same for other JVM implementations.
Having said that, the general science of JIT compilation is quite well studied, and JIT implementations occur in many modern programming environments, not just the JVM. As a result, many of the same JIT techniques are applicable to other JIT compilers.
Due to the abstract and technically complex nature of the subject matter, we will rely upon tooling to help understand and visualize the inner workings of the JVM. The primary tool we will be using is JITWatch, and we introduce it at the start of the chapter. Following this, we will be able to explain specific JIT optimizations and features and show how the technique and its effects can be observed from JITWatch.
Introducing JITWatch
JITWatch is an open source JavaFX tool designed and built by one of this book’s authors (Chris Newland) as a personal project. The tool is now hosted under the AdoptOpenJDK initiative, as part of a program run by the London Java Community to improve the amount of community participation in the Java ecosystem.
JITWatch allows a development or devops team to better understand what HotSpot actually did to the bytecode during the execution of the application. It is possible to tune compilation switches to improve the performance of our applications, but it is essential that we have a mechanism of measuring any improvements we have made.
Tip
Any method that is to be analyzed must be used in a hot path and be eligible for compilation. Interpreted methods are not suitable targets for serious optimization.
JITWatch provides objective measurements for comparison. Without these measurements there is a real risk of falling into the Missing the Bigger Picture antipattern discussed in the section “Performance Antipatterns Catalogue”.
To function, JITWatch parses and analyzes the detailed HotSpot compilation log output from the running Java application and displays it in the JavaFX GUI. This means that in order to work the tool requires the application to be run with a certain set of flags.
As well as any flags required for normal runs of the application, the following flags must be added for JITWatch if they are not already present:
-XX:+UnlockDiagnosticVMOptions -XX:+TraceClassLoading -XX:+LogCompilation
With these flags switched on, the JVM will produce a log that can be fed into JITWatch.
Basic JITWatch Views
After the application run has finished, you can start JITWatch, load the log, and produce a view like that shown in Figure 10-1, based on the actual run of the application.
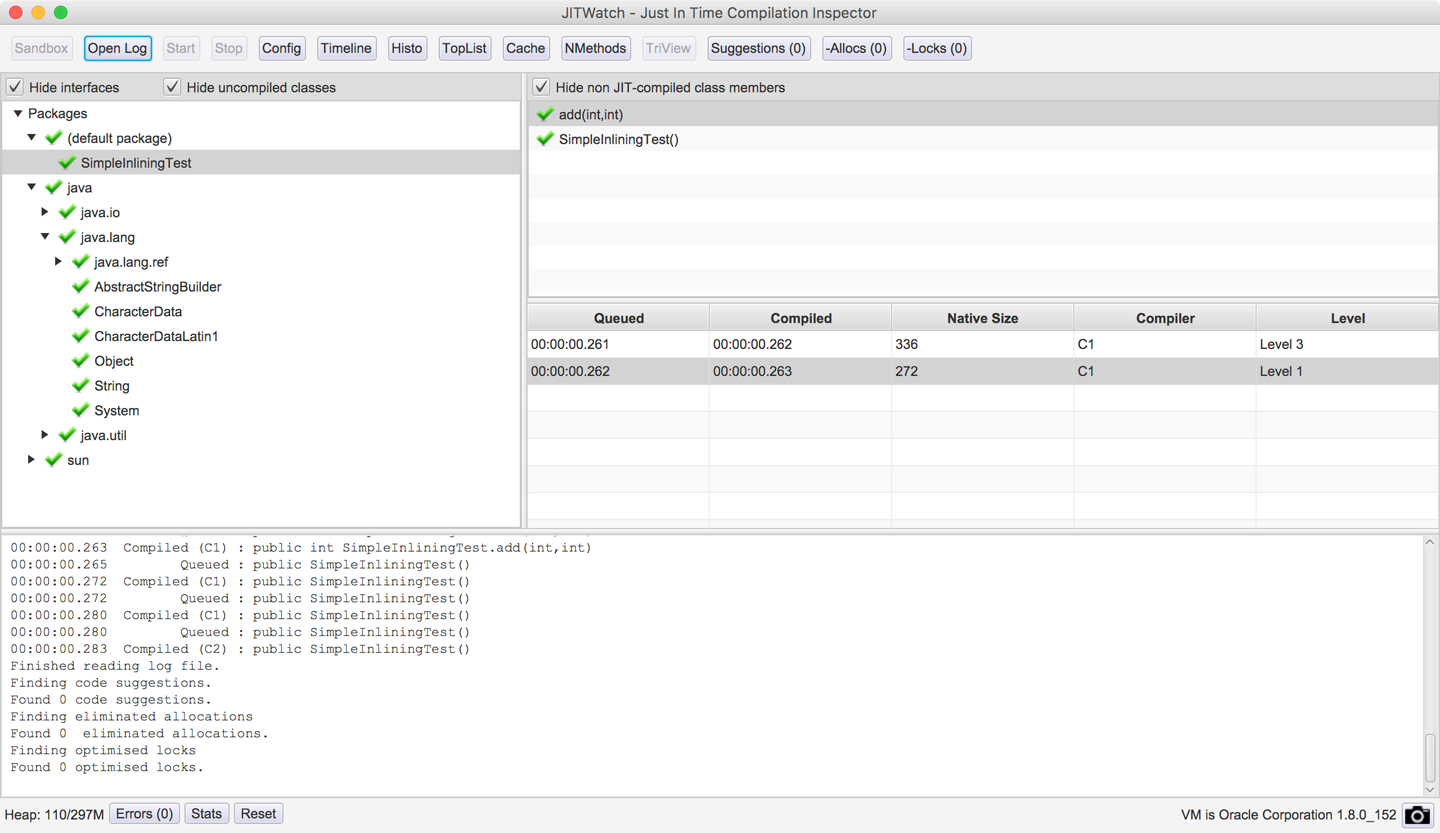
Figure 10-1. JITWatch main window
As well as loading logs from executed programs, JITWatch also provides an environment for experimenting with JIT behaviors called the sandbox. This view allows you to quickly prototype small programs and see the JIT decisions made by the JVM. A sample view is shown in Figure 10-2.
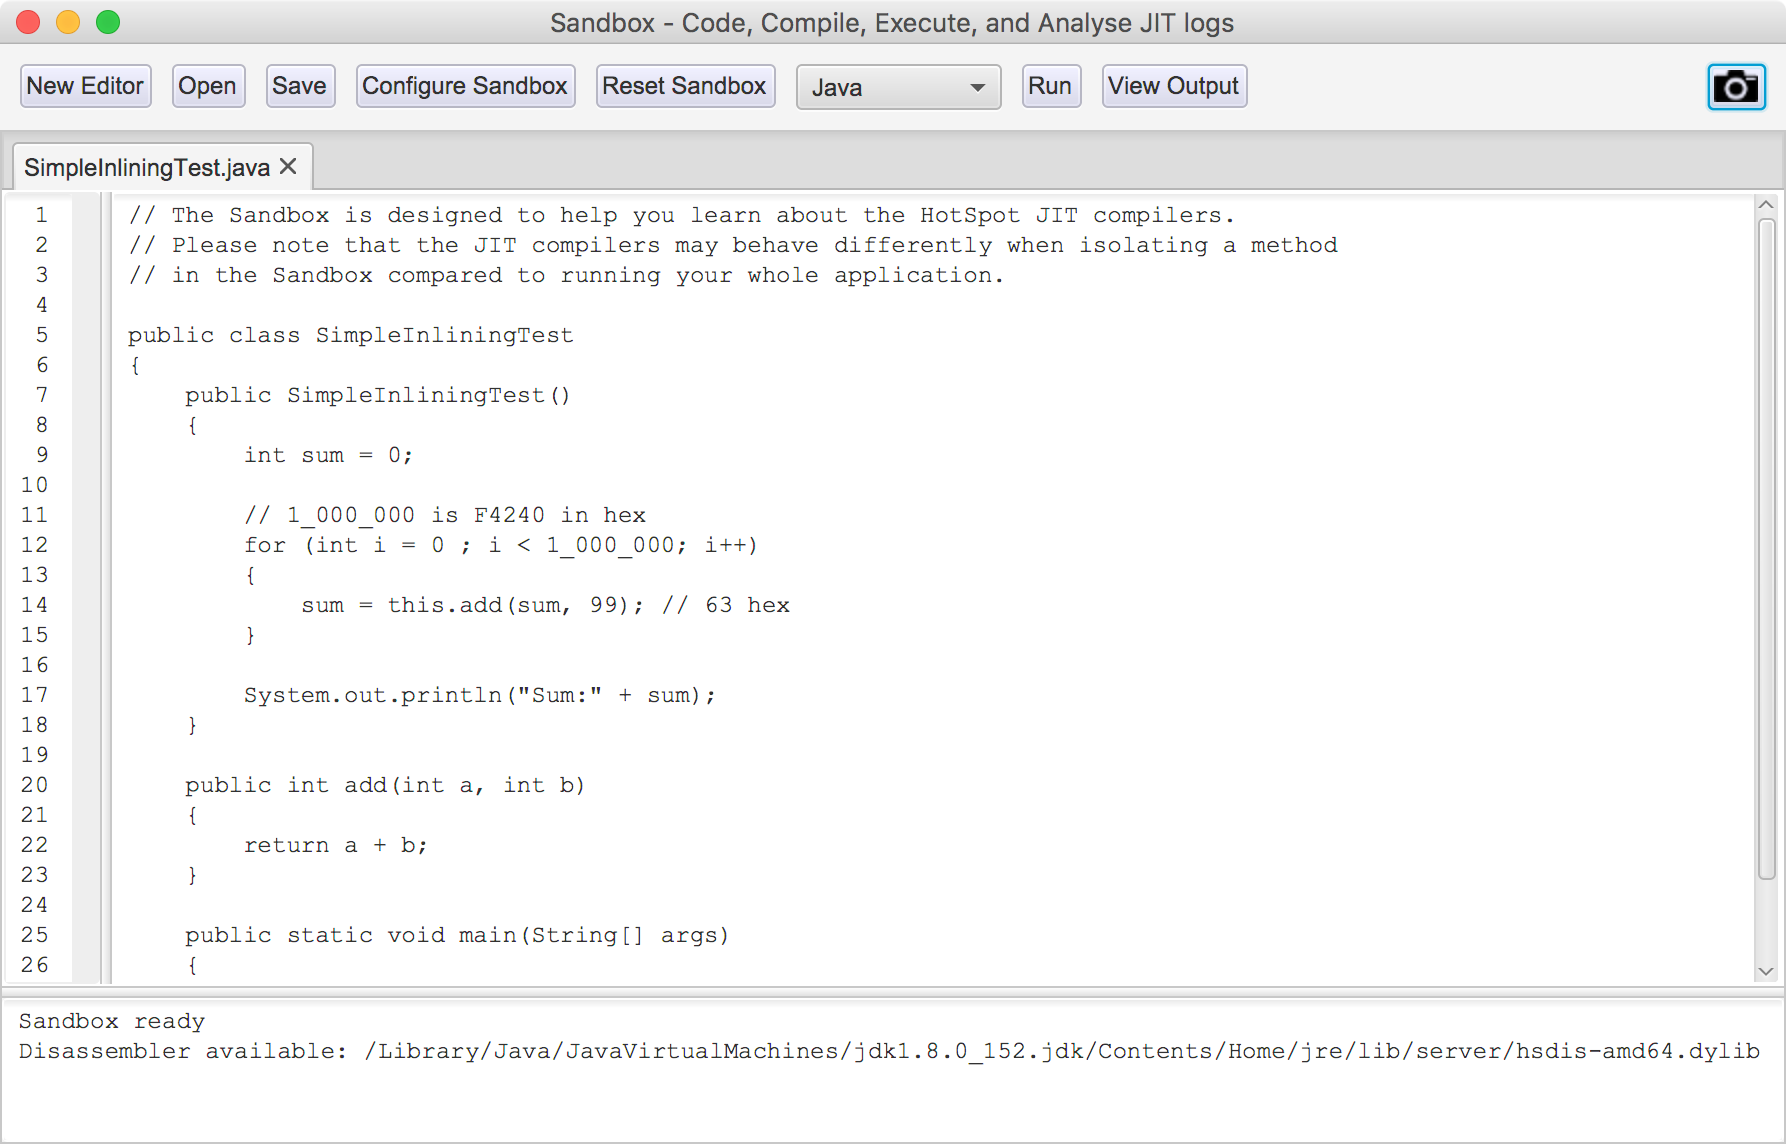
Figure 10-2. JITWatch sandbox
The sandbox workflow allows you to create or load a program written in Java or one of the other supported JVM languages, as an alternative to loading an existing logfile.
When you click the Run button, JITWatch will:
-
Compile your program into bytecode.
-
Execute the program on the JVM with JIT logging enabled.
-
Load the JIT logfile into JITWatch for analysis.
The sandbox is designed to allow fast feedback on the way small changes can affect the optimization choices made by the JVM. As well as Java, you can use the sandbox with Scala, Kotlin, Groovy, and JavaScript (Nashorn) by configuring their paths.
Warning
The sandbox can be incredibly useful, so you should pay attention to the warning presented in the edit window. Always remember that code run inside the sandbox may behave very differently from that in a real application.
The sandbox also allows you to experiment with the VM switches that control the JIT subsystem (see Figure 10-3). For example, using the sandbox configurations setting, you can change JVM JIT behaviors including:
-
Outputting disassembled native methods (requires a disassembly binary such as hsdis to be installed into your JRE) and choosing the assembly syntax.
-
Overriding the JVM default setting for tiered compilation (using both C1 and C2 JIT compilers)
-
Overriding compressed oops usage (disabling this can make the assembly easier to read by removing the address-shifting instructions)
-
Disabling on-stack replacement
-
Overriding the inlining default limits
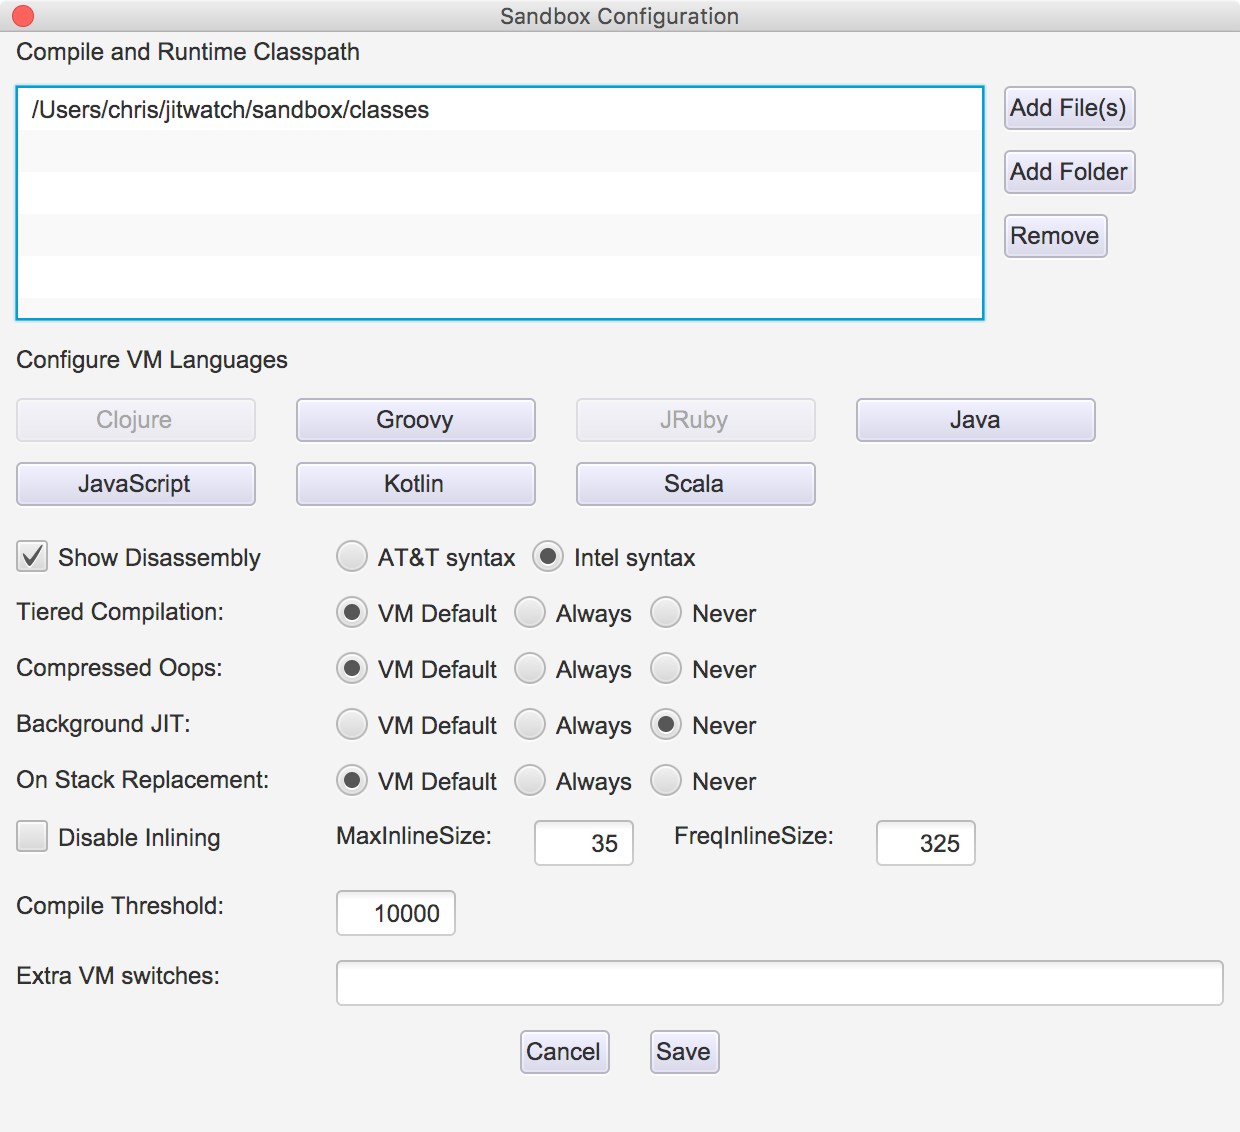
Figure 10-3. JITWatch sandbox configuration
Warning
Changing these settings can have significant effects on JVM performance. Altering them is not recommended for a production system apart from in extreme edge cases. Even then they should not be changed without extensive testing.
Another way in which the sandbox differs from a regular run of a JVM application is that in a full-size application the JVM will have the ability to combine optimizations across a larger view of code, rather than just a sandbox snippet. Aggressive JIT compilers (such as C2) may even apply one set of optimizations as a first pass to broaden the scope of program code visible to the optimizer.
For example, the inlining technique collapses methods into their callers. This means that the optimizer can now consider further optimizations (such as more inlining, or other forms) that would not have been obvious before the initial inlining. In turn, this means that a toy application in the sandbox that has only trivial inlining behavior may be treated differently by the JIT compiler than a method from a real application with real inlining.
As a result, most practitioners prefer a more sophisticated view of application compilation than the sandbox. Fortunately, the primary view that JITWatch provides is a very capable view, known as the TriView. This view shows how the source code was compiled into both bytecode and assembly. An example is shown in Figure 10-4; it shows evidence of the JIT compiler removing some unnecessary object allocations—an important optimization in modern JVMs that we will meet later in this chapter.
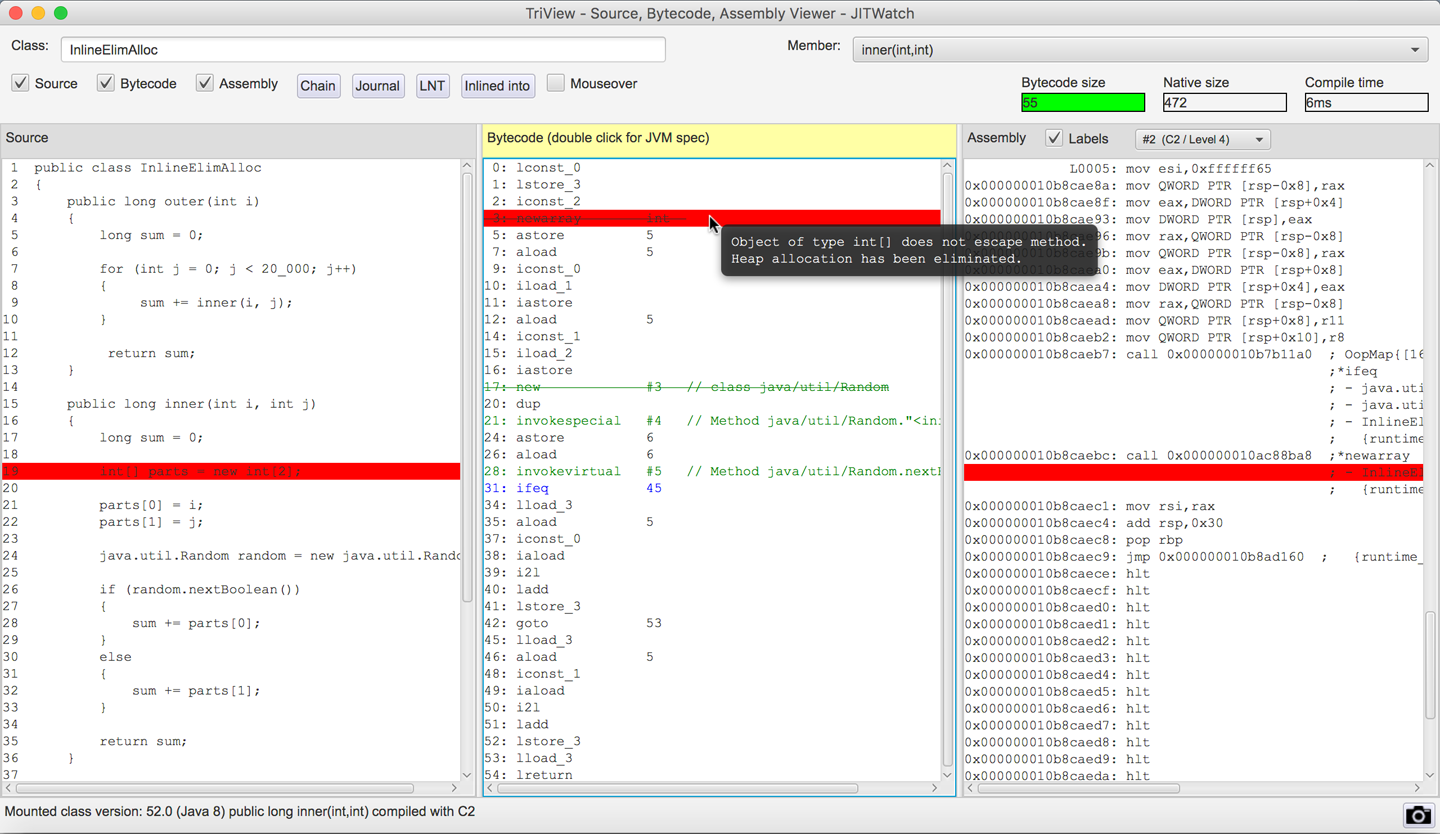
Figure 10-4. JITWatch TriView
JITWatch allows you to visualize where each compiled method is stored in the code cache. This is a relatively new feature and is still under active development, but the current view is shown in Figure 10-5.
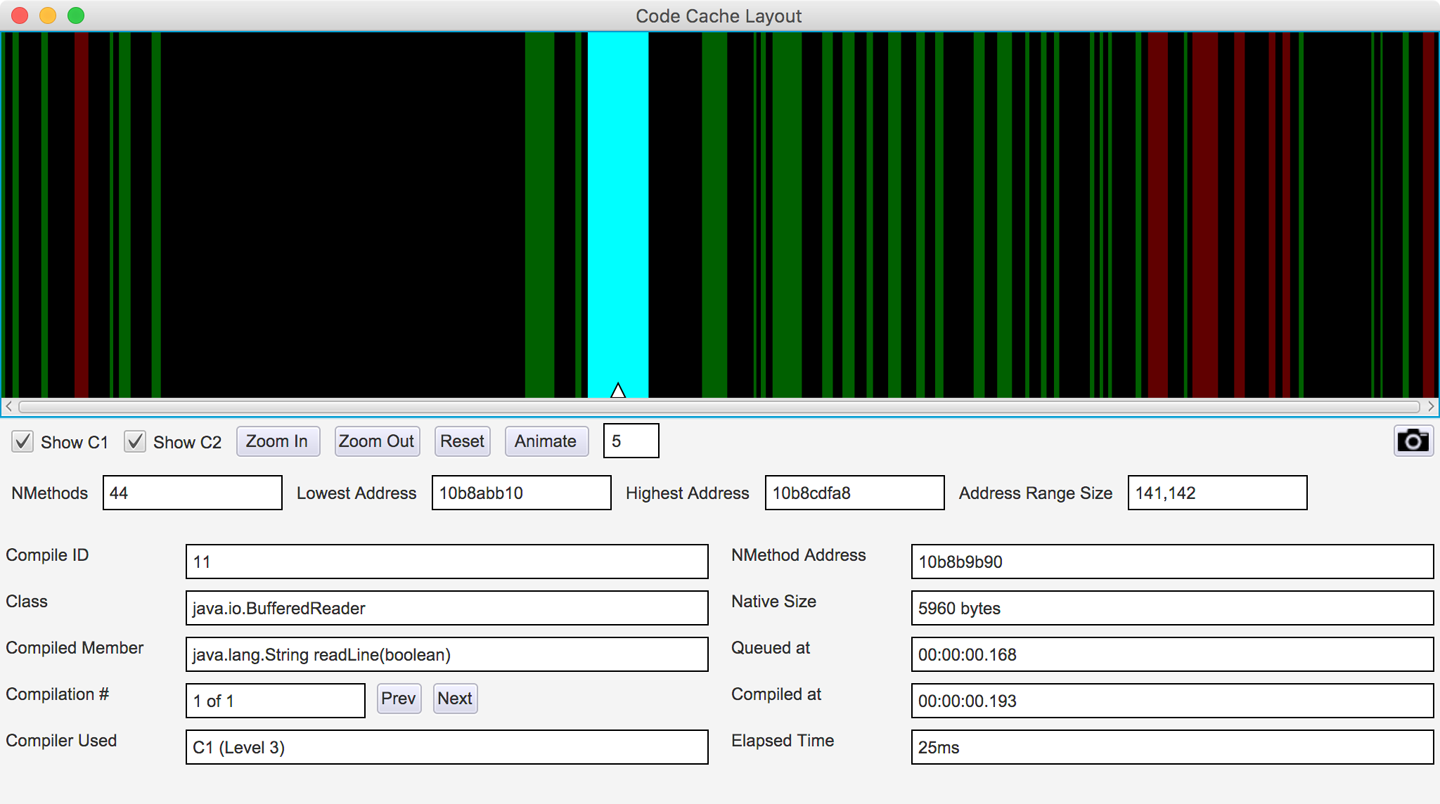
Figure 10-5. JITWatch code cache layout
In Java 8 and earlier, the code cache stores profiled compiled methods, nonprofiled compiled methods, and the VM’s own native code in a single region.
Java 9 introduces a segmented code cache where these different types of native code are stored in different regions to reduce fragmentation and sweeper times and improve the locality of fully compiled code. We’ll explore this feature fully in Chapter 15 when we discuss Java 9 features in depth.
Debug JVMs and hsdis
If you would like to delve deeper into tuning and obtaining statistics from the JIT subsystem, then you can do so with a debug JVM. This is one that has been built to produce debugging information beyond that available in a production JVM, and it will come at a cost in performance.
Debug VMs are not generally offered for download by the main JVM vendors, but a HotSpot debug JVM can be built from OpenJDK sources.
Note
Debug VM binaries for the Linux x86_64 platform can be downloaded from the author’s website.
If you want to inspect the disassembled native code produced by the JIT compilers, then you will need a disassembly binary such as hsdis. This can be built from the OpenJDK source code; instructions for doing so can be found in the JITWatch wiki article “Building hsdis”.
To instruct the VM to output method assembly, add this VM switch:
-XX:+PrintAssembly
Warning
Native code disassembly into readable assembly language is performed directly after the JIT compiler emits the method. It is an expensive operation that can impact the performance of your program and should be used carefully.
Now that we’ve introduced JITWatch, let’s move on to look at some of the technical details of the HotSpot JIT compiler.
Introducing JIT Compilation
To complement the view of compiled code from the tool, it is necessary for the performance engineer to have a working knowledge of how the VM collects data and what optimizations it will carry out on an executing program.
We’ve already seen that HotSpot uses profile-guided optimization (PGO) to guide JIT compilation decisions. Under the hood, HotSpot stores profile data about the running program in structures called method data objects, or MDOs for short.
MDOs are used by the bytecode interpreter and the C1 compiler to record the information the JIT compilers use when determining what optimizations to make. MDOs store information such as methods invoked, branches taken, and types observed at call sites.
Counters that record the “hotness” of a profiled property are maintained, and the values in them are decayed during profiling. This ensures that methods are compiled only if they are still hot when they reach the head of the compilation queue.
Once this profiling data has been gathered and the decision has been made to compile, the specific details of the individual compiler take over. The compiler builds an internal representation of the code to be compiled; the exact nature of the representation depends on which compiler (C1 or C2) is in use.
From this internal representation, the compiler will heavily optimize the code. HotSpot’s JIT compilers are able to perform a wide range of modern compiler optimization techniques, including:
-
Inlining
-
Loop unrolling
-
Escape analysis
-
Lock elision and lock coarsening
-
Monomorphic dispatch
-
Intrinsics
-
On-stack replacement
In the following sections we will describe each in turn.
As you meet each technique, it is important to recall that the majority of these optimizations are partially or completely dependent on runtime information and support.
The two JIT compilers within HotSpot also use different subsets of the preceding techniques and have different philosophies about how compilation should be approached. In particular, C1 does not engage in speculative optimization. This is the use of optimizations that rely on an unproven assumption about the nature of the execution. Aggressive optimizers (e.g., C2) will make an assumption based on the observed runtime execution and will make an optimization based on that assumption. That simplifying assumption may allow large (sometimes very large) performance speedups to be made.
To protect against the case that the assumption was not actually correct and is later invalidated, a speculative optimization is always protected with a “sanity check” known as a guard. The guard ensures that the assumption still holds, and is checked just before each time the optimized code is run.
If the guard is ever failed, the compiled code is no longer safe and must be removed. HotSpot immediately deoptimizes and demotes the method to interpreted mode to prevent any incorrect code from ever being executed.
Inlining
Inlining is the process of taking a called method (the callee) and copying its contents to the place where it was called from (the call site).
This eliminates the overhead associated with calling a method, which is not large but can include:
-
Setting up parameters to be passed
-
Looking up the exact method to be called
-
Creating new runtime data structures for the new call frame (such as local variables and an evaluation stack)
-
Transferring control to the new method
-
Possibly returning a result to the caller
Inlining is one of the first optimizations to be applied by the JIT compilers and is known as a gateway optimization, as it brings related code closer together by eliminating method boundaries.
Given the following code:
intresult=add(a,b);privateintadd(intx,inty){returnx+y;}
The inlining optimization copies the body of the add() method to its call site, effectively giving:
intresult=a+b;
HotSpot’s inlining compiler optimization allows the developer to write well-organized and reusable code. It represents the view that a developer should not need to micro-optimize by hand. Instead, HotSpot uses automatic statistical analysis to determine when related code should be brought together. Inlining therefore broadens the horizon for other optimizations, including:
-
Escape analysis
-
Dead code elimination (DCE)
-
Loop unrolling
-
Lock elision
Inlining Limits
It is sometimes necessary for the VM to place limits on the inlining subsystem. For example, the VM may need to control:
-
The amount of time the JIT compiler spends optimizing a method
-
The size of native code produced (and hence its use of the code cache memory)
Without these constraints the compiler could become tied up inlining very deep call chains or filling up the code cache with huge native methods. The general principle—that JIT compilation resources are precious—comes into play again here.
HotSpot considers several factors when determining whether to inline a method, including:
-
The bytecode size of the method to be inlined
-
The depth of the method to be inlined in the current call chain
-
The amount of space in the code cache already taken up by compiled versions of this method
In Figure 10-6 we can see JITWatch visualizing that the JIT compiler has inlined a chain of method calls into their ultimate caller but has rejected inlining a method created deliberately above the maximum default limit.
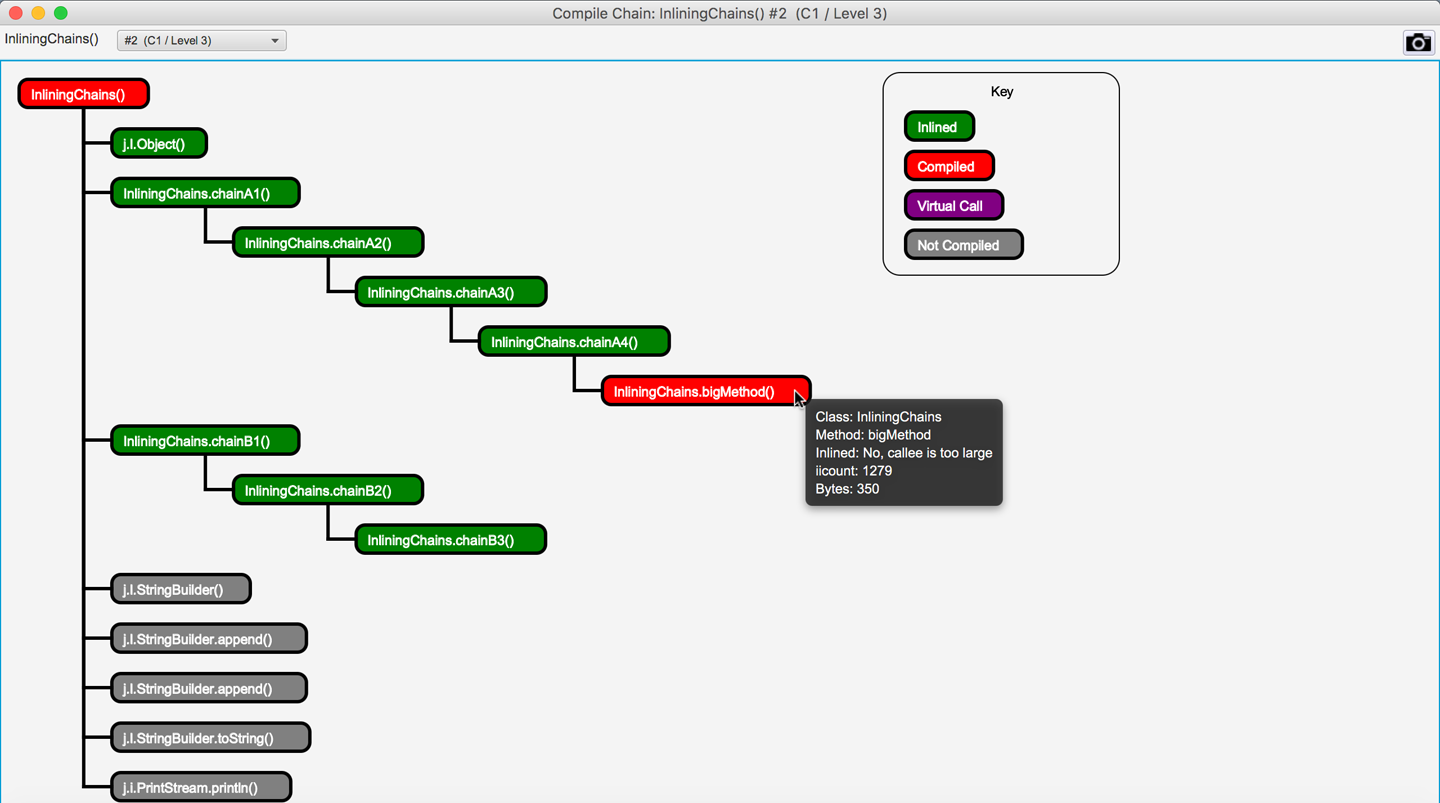
Figure 10-6. Chain of method calls inlined into the parent method
This depth of inlining is entirely typical and helps broaden the scope of the optimization.
Tuning the Inlining Subsystem
After we have determined that all important methods are being compiled, and adjusted the code cache to accommodate the application’s most significant methods, the next step is to consider inlining. In Table 10-1 we can see the basic JVM switches used to control the behavior of the inlining subsystem. These switches can be used to extend the simple JIT tuning methodology shown in “Simple JIT Tuning”.
| Switch | Default (JDK 8, Linux x86_64) | Explanation |
|---|---|---|
|
35 bytes of bytecode |
Inline methods up to this size. |
|
325 bytes of bytecode |
Inline “hot” (frequently called) methods up to this size. |
|
1,000 bytes of native code (non-tiered) |
Do not inline methods where there is already a final-tier compilation that occupies more than this amount of space in the code cache. |
|
9 |
Do not inline call frames deeper than this level. |
If important methods are not being inlined (e.g., due to being “slightly too big” for inlining), then in some circumstances it may be appropriate to adjust JVM parameters to make these methods inline. Under these conditions, we would start by adjusting either -XX:MaxInlineSize or -XX:FreqInlineSize and verify whether such a change produces observable improvements.
Any such tuning exercise that adjusts these parameters must, as always, be informed by observed data. Failing to consider the actual data and to prove the worth of a parameter change is at the heart of the Fiddling with Switches antipattern (see “Fiddling with Switches”).
Loop Unrolling
Once any method calls within the loop have been inlined (where possible), the compiler has a better idea of the size and cost of each loop iteration. Based on this, it can consider unrolling the loop to reduce the number of times the execution has to jump back to the beginning.
Each back branch can have undesirable processor effects, as the CPU dumps its pipeline of incoming instructions due to the back branch. In general, the shorter the loop body, the higher the relative cost of the back branch. Therefore, HotSpot makes decisions on whether to unroll loops based on criteria including:
-
The type of the loop counter variable (usually
intorlongrather than an object type) -
The loop stride (how the loop counter changes on each iteration)
-
The number of exit points (
returnorbreak) within the loop
Consider some example methods that perform summation of data fetched sequentially from an array.
This access pattern can be spotted in the assembly as [base, index, offset] addressing:
-
base registercontains the start address of data in the array. -
index registercontains the loop counter (which gets multiplied by the datatype size). -
offsetis used for offsetting each unrolled access.add rbx, QWORD PTR [base register + index register * size + offset]
Note
Loop unrolling behavior may vary between HotSpot versions and is highly architecture-dependent.
Given a loop over a long[] array, we can look at the conditions under which the loop will be unrolled.
When a loop accesses an array, HotSpot can eliminate array bounds checks by splitting the loop into three sections, as shown in Table 10-2.
| Loop section | Bounds checks? | Explanation |
|---|---|---|
Pre loop |
Yes |
Performs initial iterations with bounds checking. |
Main loop |
No |
The loop stride is used to calculate the maximum number of iterations that can be performed without requiring a bounds check. |
Post loop |
Yes |
Performs remaining iterations with bounds checking. |
Here is some example setup code to create an array over which the loop will iterate:
privatestaticfinalintMAX=1_000_000;privatelong[]data=newlong[MAX];privatevoidcreateData(){java.util.Randomrandom=newjava.util.Random();for(inti=0;i<MAX;i++){data[i]=random.nextLong();}}
We can use a JMH benchmark to compare the performance of iterating over this same array using either an int counter or a long counter:
packageoptjava.jmh;importorg.openjdk.jmh.annotations.*;importjava.util.concurrent.TimeUnit;@BenchmarkMode(Mode.Throughput)@OutputTimeUnit(TimeUnit.SECONDS)@State(Scope.Thread)publicclassLoopUnrollingCounter{privatestaticfinalintMAX=1_000_000;privatelong[]data=newlong[MAX];@SetuppublicvoidcreateData(){java.util.Randomrandom=newjava.util.Random();for(inti=0;i<MAX;i++){data[i]=random.nextLong();}}@BenchmarkpubliclongintStride1(){longsum=0;for(inti=0;i<MAX;i++){sum+=data[i];}returnsum;}@BenchmarkpubliclonglongStride1(){longsum=0;for(longl=0;l<MAX;l++){sum+=data[(int)l];}returnsum;}}
The results are as follows:
Benchmark                          Mode  Cnt     Score   Error  Units
LoopUnrollingCounter.intStride1   thrpt  200  2423.818 ± 2.547  ops/s
LoopUnrollingCounter.longStride1  thrpt  200  1469.833 ± 0.721  ops/s
The loop with the int counter performs nearly 64% more operations per second.
If we were to dive into the assembly, we would see that the body of a loop with a long counter will not be unrolled, and the loop will also contain a safepoint poll.
These safepoint checks have been inserted by the JIT compiler to mitigate the possibility that compiled code runs for long periods without checking the safepoint flag (see “JVM Safepoints”).
Other microbenchmarks might include using a variable stride, where the increment is stored in a variable and is not a compile-time constant. With a variable stride, we see that the loop is not unrolled and a safepoint is inserted before the back branch.
Loop Unrolling Summary
HotSpot contains a number of specific optimizations for loop unrolling:
-
It can optimize counted loops that use an
int,short, orcharloop counter. -
It can unroll loop bodies and remove safepoint polls.
-
Unrolling a loop reduces the number of back branches and their associated branch prediction costs.
-
Removing safepoint polls further reduces the work done each loop iteration.
You should always verify the effects yourself, though, rather than assume these examples hold true for all architectures and HotSpot versions.
Escape Analysis
HotSpot can perform a scope-based analysis for determining if work done within a method is visible or has side effects outside the boundary of that method. This escape analysis technique can be used to determine whether an object allocated within the method is visible outside of the method scope.
Note
The escape analysis optimization is attempted after any inlining has taken place. Inlining copies the callee method body to the call site, which prevents objects that are passed only as method arguments from being marked as escaping.
During the escape analysis phase HotSpot categorizes potential escapee objects into three types. This piece of code from hotspot/src/share/vm/opto/escape.hpp details the different possible escape scenarios:
typedefenum{NoEscape=1,// An object does not escape method or thread and it is// not passed to call. It could be replaced with scalar.ArgEscape=2,// An object does not escape method or thread but it is// passed as argument to call or referenced by argument// and it does not escape during call.GlobalEscape=3// An object escapes the method or thread.}
Eliminating Heap Allocations
Creating new objects within tight loops can put pressure on the memory allocation subsystem. Generating large numbers of short-lived objects will require frequent minor GC events to clean them up. It is possible for the allocation rate to be so high that the heap’s young generation fills up and short-lived objects are prematurely promoted to the old generation. If this occurs, they will require a more expensive full GC event to clean them up.
HotSpot’s escape analysis optimization is designed to allow developers to write idiomatic Java code without worrying about object allocation rates.
By proving that an allocated object does not escape the method (classed as a NoEscape), the VM can apply an optimization called scalar replacement. The fields in the object become scalar values, similar to if they had all been local variables instead of object fields. They can then be arranged into CPU registers by a HotSpot component called the register allocator.
Note
If there are not enough free registers available, then the scalar values can be placed onto the current stack frame (this is known as a stack spill).
The aim of escape analysis is to deduce whether the heap allocation can be avoided. If it can be, the object can be automatically allocated on the stack and thus GC pressure can be reduced by a small amount.
Let’s look at an example of an object allocation that would be categorized as a NoEscape since the instance of MyObj does not leave the method scope:
publiclongnoEscape(){longsum=0;for(inti=0;i<1_000_000;i++){MyObjfoo=newMyObj(i);// foo does not escape the method (NoEscape)sum+=foo.bar();}returnsum;}
Here is an example of an object allocation that would be categorized as an ArgEscape since the instance of MyObj is passed as an argument to the method extBar().
publiclongargEscape(){longsum=0;for(inti=0;i<1_000_000;i++){MyObjfoo=newMyObj(i);sum+=extBar(foo);// foo is passed as an argument to extBar (ArgEscape)}returnsum;}
If the call to extBar() was inlined into the loop body before the escape analysis was performed, then MyObj would be categorized as a NoEscape and could avoid being allocated on the heap.
Locks and Escape Analysis
HotSpot is able to use escape analysis and some related techniques to optimize the performance of locks.
Note
This applies only to intrinsic locks (those that use synchronized).
The locks from java.util.concurrent are not eligible for these optimizations.
The key lock optimizations that are available are:
-
Removing locks on nonescaping objects (lock elision)
-
Merging consecutive locked regions that share the same lock (lock coarsening)
-
Detecting blocks where the same lock is acquired repeatedly without an unlock (nested locks)
When consecutive locks on the same object are encountered, HotSpot will check if it is possible to enlarge the locked region. To achieve this, when HotSpot encounters a lock it will search backward to try to find an unlock on the same object. If a match is found, then it will consider whether the two lock regions can be joined to produce a single larger region.
You can read more about this in the JVM specification. In Figure 10-7 we can see this effect directly in JITWatch.
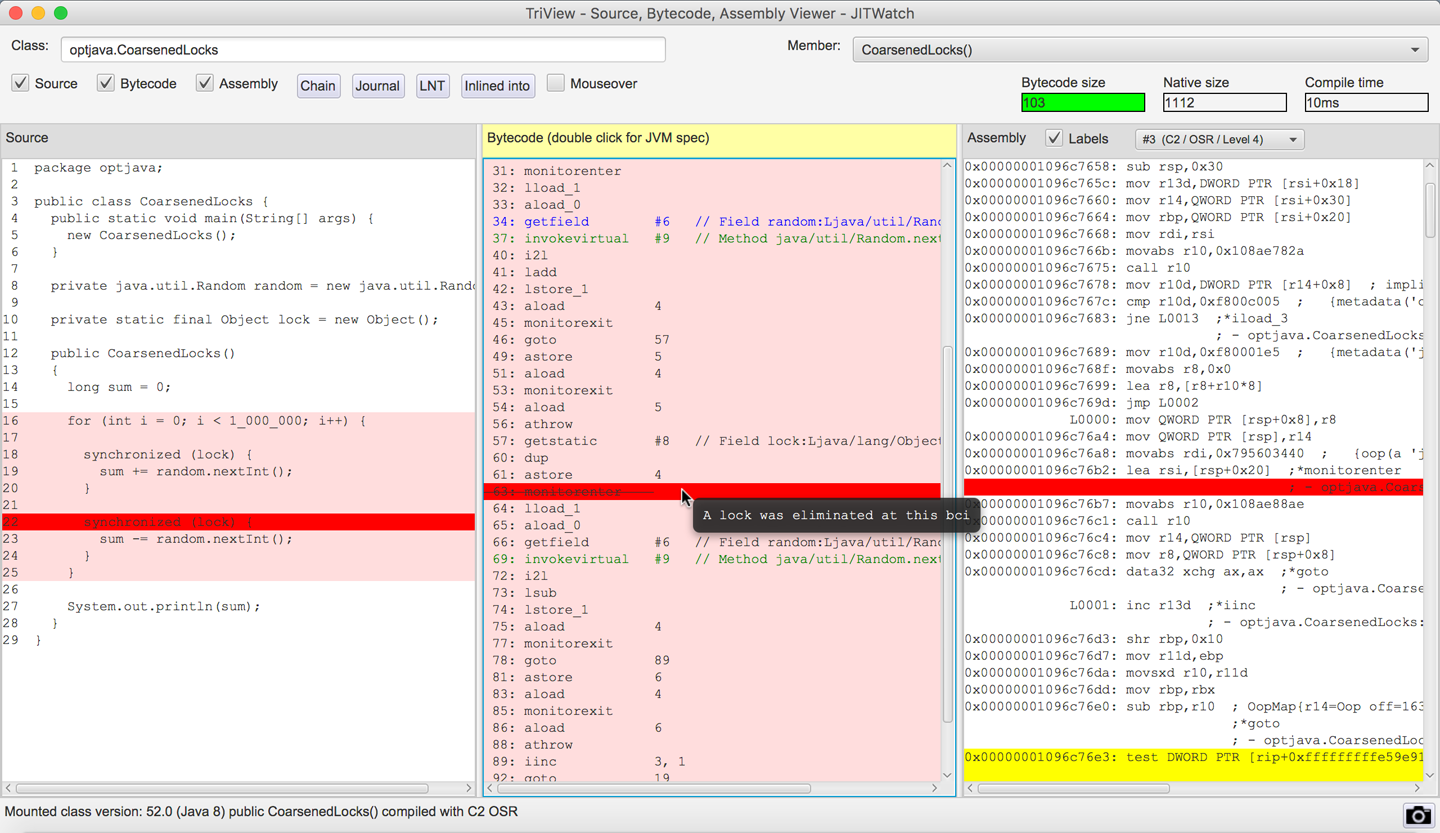
Figure 10-7. Lock coarsening
The lock coarsening optimization is enabled by default, but you can disable it using the VM switch -XX:-EliminateLocks to see its impact.
HotSpot is also able to detect nested locks that lock on the same object and remove the inner locks since the lock will already have been acquired by the thread.
Tip
At the time of writing, the nested lock elimination in Java 8 appears to work with locks that are declared as static final and with locks on this.
The nested lock optimization is enabled by default but you can disable it using the VM switch -XX:-EliminateNestedLocks.
Nested lock detection in JITWatch can be seen in Figure 10-8.
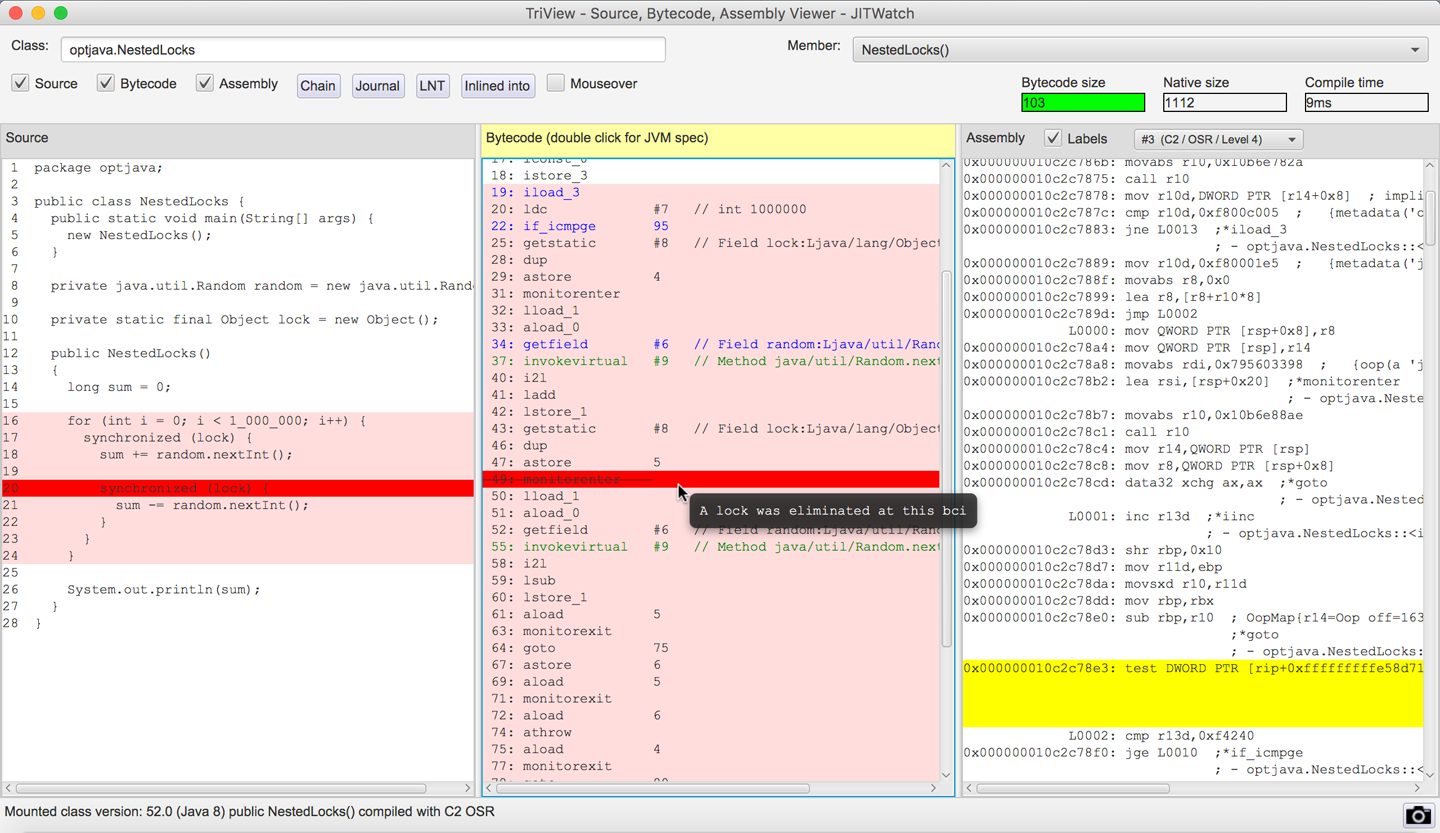
Figure 10-8. A nested lock is eliminated
HotSpot automatically calculates when it is safe to coarsen or eliminate locks. Tools such as JITWatch can visualize where locks have been optimized, and if you use a debug JVM you can output extra information on locks.
Limitations of Escape Analysis
Escape analysis, like other optimizations, is subject to tradeoffs since every allocation not made on the heap must happen somewhere, and the CPU registers and stack space are relatively scarce resources. One limitation in HotSpot is that by default, arrays of more than 64 elements will not benefit from escape analysis. This size is controlled by the following VM switch:
-XX:EliminateAllocationArraySizeLimit=<n>
Consider a hot code path that contains a temporary array allocation to read from a buffer. If the array does not escape the method scope, then escape analysis should prevent the heap allocation. However, if the array length is more than 64 elements (even if they are not all used), then it must be stored on the heap, which could quickly increase the allocation rate of this code.
In the following JMH benchmark, the test methods allocate nonescaping arrays of size 63, 64, and 65.
Note
An array size of 63 is tested to ensure that 64 is not faster than 65 simply because of memory alignment.
In each test, only the first two array elements, a[0] and a[1], are used, but the limitation considers only the array length and not the maximum index used:
packageoptjava.jmh;importorg.openjdk.jmh.annotations.*;importjava.util.concurrent.TimeUnit;@State(Scope.Thread)@BenchmarkMode(Mode.Throughput)@OutputTimeUnit(TimeUnit.SECONDS)publicclassEscapeTestArraySize{privatejava.util.Randomrandom=newjava.util.Random();@BenchmarkpubliclongarraySize63(){int[]a=newint[63];a[0]=random.nextInt();a[1]=random.nextInt();returna[0]+a[1];}@BenchmarkpubliclongarraySize64(){int[]a=newint[64];a[0]=random.nextInt();a[1]=random.nextInt();returna[0]+a[1];}@BenchmarkpubliclongarraySize65(){int[]a=newint[65];a[0]=random.nextInt();a[1]=random.nextInt();returna[0]+a[1];}}
The results show a large drop in performance once the array allocation cannot benefit from the escape analysis optimization:
Benchmark                         Mode  Cnt         Score       Error  Units
EscapeTestArraySize.arraySize63  thrpt  200  49824186.696 ±  9366.780  ops/s
EscapeTestArraySize.arraySize64  thrpt  200  49815447.849 ±  2328.928  ops/s
EscapeTestArraySize.arraySize65  thrpt  200  21115003.388 ± 34005.817  ops/s
If you find that you do need to allocate a larger array in hot code, then you can instruct the VM to allow larger arrays to be optimized. Running the benchmark again with a limit of 65 elements shows that performance is restored:
$ java -XX:EliminateAllocationArraySizeLimit=65 -jar target/benchmarks.jar
Benchmark                         Mode  Cnt         Score      Error  Units
EscapeTestArraySize.arraySize63  thrpt  200  49814492.787 ± 2283.941  ops/s
EscapeTestArraySize.arraySize64  thrpt  200  49815595.566 ± 5833.359  ops/s
EscapeTestArraySize.arraySize65  thrpt  200  49818143.279 ± 2347.695  ops/s
Another important limitation is that HotSpot does not support partial escape analysis (also known as flow-sensitive escape analysis).
Note
The jRockit JVM did support partial escape analysis, but this technology was not carried over into HotSpot after the merging of the two JVMs.
If an object is found to escape the method scope on any branch, then the optimization to avoid allocating the object on the heap will not be applied. In the following example, if both branches are seen to be taken then the object can sometimes escape the methods and must be classed as an ArgEscape. This will increase the object allocation rate and put additional pressure on the GC.
for(inti=0;i<100_000_000;i++){ObjectmightEscape=newObject(i);if(condition){result+=inlineableMethod(mightEscape);}else{result+=tooBigToInline(mightEscape);}}
If it is possible in your code to localize the object allocation to within a nonescaping branch, as shown here, then you will benefit from escape analysis on that path.
for(inti=0;i<100_000_000;i++){if(condition){ObjectmightEscape=newObject(i);result+=inlineableMethod(mightEscape);}else{ObjectmightEscape=newObject(i);result+=tooBigToInline(mightEscape);}}
Monomorphic Dispatch
Many of the speculative optimizations that HotSpot’s C2 compiler undertakes are based on empirical research. One example is the technique called monomorphic dispatch (monomorphic is derived from the Greek for “single form”).
It relies on a strange, but powerful, observed fact: in human-authored code, very often only one runtime type is ever observed to be the type of the receiver object at any individual call site.
Note
This is generally understood to be a reflection of the way that humans design object-oriented software, rather than anything specific to Java or the JVM.
That is, when we’re calling a method on an object, if we examine the runtime type of that object the first time we call that method, it is quite likely to always be the same type for every subsequent call.
If that speculative assumption is true, then the call to the method being invoked at that site can be optimized.
In particular, the indirection of looking up methods in vtables can be eliminated.
If it’s always the same type, then we can compute the call target once and replace the invokevirtual instruction with a quick type test (the guard) and then a branch to the compiled method body.
Put another way, the virtual lookup and associated indirection through the klass pointer and vtable only needs to be done once and can be cached for future invocations at that call site.
Note
For an invokevirtual call site, the only possible types that can be seen are the base type that defines the method to be executed and any subtypes of it.
This is the Liskov Substitution Principle in another guise.
Consider the following piece of code:
java.util.Datedate=getDate();System.out.println(date.toInstant());
If the getDate() method always returns an instance of java.util.Date, then the call to toInstant() can be assumed to be monomorphic.
However, if after many iterations of this code, getDate() suddenly returns an instance of java.sql.Date, then the monomorphic assumption is no longer valid, as an entirely different implementation of toInstant() must now be called.
HotSpot’s solution is to back out of the optimization and revert the call site to using full virtual dispatch. The guard that is used to protect the monomorphic call is very straightforward: it is a simple equality of klass words, and it is checked before every call instruction to ensure that no incorrect code is executed.
A very large number of calls in a typical application will be monomorphic. HotSpot also has another optimization, which is more rarely useful, called bimorphic dispatch. This allows two different types to be handled in a similar way to the monomorphic case, by caching two different klass words per call site.
Call sites that are not either monomorphic or bimorphic are known as megamorphic (Greek for “many forms”). If you find that you have a megamorphic call site with only a small number of observed types, you can use a trick to regain some performance.
It works by “peeling” off types from the original call site using instanceof checks so that you leave only a bimorphic call site that observes two concrete types.
An example of this can be seen here:
packageoptjava.jmh;importorg.openjdk.jmh.annotations.*;importjava.util.concurrent.TimeUnit;interfaceShape{intgetSides();}classTriangleimplementsShape{publicintgetSides(){return3;}}classSquareimplementsShape{publicintgetSides(){return4;}}classOctagonimplementsShape{publicintgetSides(){return8;}}@State(Scope.Thread)@BenchmarkMode(Mode.Throughput)@OutputTimeUnit(TimeUnit.SECONDS)publicclassPeelMegamorphicCallsite{privatejava.util.Randomrandom=newjava.util.Random();privateShapetriangle=newTriangle();privateShapesquare=newSquare();privateShapeoctagon=newOctagon();@BenchmarkpublicintrunBimorphic(){ShapecurrentShape=null;switch(random.nextInt(2)){case0:currentShape=triangle;break;case1:currentShape=square;break;}returncurrentShape.getSides();}@BenchmarkpublicintrunMegamorphic(){ShapecurrentShape=null;switch(random.nextInt(3)){case0:currentShape=triangle;break;case1:currentShape=square;break;case2:currentShape=octagon;break;}returncurrentShape.getSides();}@BenchmarkpublicintrunPeeledMegamorphic(){ShapecurrentShape=null;switch(random.nextInt(3)){case0:currentShape=triangle;break;case1:currentShape=square;break;case2:currentShape=octagon;break;}// peel one observed type from the original call siteif(currentShapeinstanceofTriangle){return((Triangle)currentShape).getSides();}else{returncurrentShape.getSides();// now only bimorphic}}}
Running this benchmark produces the following output:
Benchmark                                  Mode  Cnt     Score    Error  Units
PeelMega...Callsite.runBimorphic          thrpt  200  75844310 ±  43557  ops/s
PeelMega...Callsite.runMegamorphic        thrpt  200  54650385 ±  91283  ops/s
PeelMega...Callsite.runPeeledMegamorphic  thrpt  200  62021478 ± 150092  ops/s
When two implementations are observed at the call site, bimorphic inlining occurs. This performs around 38% more operations per second than the megamorphic call site, which observes three implementations and where method dispatch remains a virtual call. Note that this is not a fair comparison, as the code is behaviorally different.
When one of the observed types is peeled off into a different call site, the program performs around 13% more operations per second than the megamorphic code.
The subject of method dispatch, and the resulting performance implications, is a deep one. Aleksey Shipilëv gives a master class in his blog post “The Black Magic of (Java) Method Dispatch”.
Intrinsics
An intrinsic is the name given to a highly tuned native implementation of a method that is preknown to the JVM rather than generated dynamically by the JIT subsystem. They are used for performance-critical core methods where the functionality is supported by specific features of the operating system or CPU architecture. This makes them platform-specific, and some intrinsics may not be supported on every platform.
When the JVM starts up, the CPU is probed at runtime and a list of the available processor features is built. This means that the decision about which optimizations to use can be deferred until runtime, and does not have to be made at code compilation time.
Note
Intrinsics can be implemented in the interpreter as well as the C1 and C2 JIT compilers.
Examples of some common intrinsics are shown in Table 10-3.
| Method | Description |
|---|---|
|
Faster copying using vector support on the CPU. |
|
Fast implementations provided by most OSs. |
|
Can be performed without branching on some CPUs. |
Other |
Direct instruction support on some CPUs. |
Cryptographic functions (e.g., AES) |
Hardware acceleration can give significant performance improvements. |
The intrinsic templates are available to view in the HotSpot source code of OpenJDK. They are contained within .ad files (the suffix stands for “architecture dependent”).
Tip
Java 9 also introduces the @HotSpotIntrinsicCandidate annotation in the source code to indicate that an intrinsic may be available.
For the x86_64 architecture, they can be found in the file hotspot/src/cpu/x86/vm/x86_64.ad.
For example, to calculate the base 10 logarithm of a number, we can use the method from java.lang.Math:
publicstaticdoublelog10(doublea)
On the x86_64 architecture this calculation can be performed with two instructions of the floating-point unit (FPU):
-
Calculate the base 10 logarithm of the constant 2.
-
Multiply this by the base 2 logarithm of your argument.
The intrinsic code for this is:
instructlog10D_reg(regDdst)%{//ThesourceandresultDoubleoperandsinXMMregisters//match(Setdst(Log10Ddst));//fldlg2;pushlog_10(2)ontheFPUstack;full80-bitnumber//fyl2x;computelog_10(2)*log_2(x)format%{"fldlg2\t\t\t#Log10\n\t""fyl2x\t\t\t# Q=Log10*Log_2(x)\n\t"%}ins_encode(Opcode(0xD9),Opcode(0xEC),Push_SrcXD(dst),Opcode(0xD9),Opcode(0xF1),Push_ResultXD(dst));ins_pipe(pipe_slow);%}
Tip
If the source code of a core Java method appears nonoptimal, then check if the VM already has a platform-specific implementation via an intrinsic.
When considering adding a new intrinsic, you will need to evaluate the tradeoff of the additional complexity versus the likelihood of the intrinsic being useful.
For example, we could conceive of intrinsics that perform basic arithmetic identities, such as the sum of the first n numbers. Traditional Java code would require O(n) operations to calculate this value, but it has a trivial formula that will calculate it in O(1) time.
Should we implement an intrinsic to calculate the sum in constant time?
The answer depends on how many classes observed in the wild have a need to calculate such a sum—in this case, not many. Such an intrinsic would therefore clearly be of limited utility and almost certainly not worth the extra complexity in the JVM.
This underlines the point that intrinsics can have a large performance impact only for those operations that are genuinely seen frequently in real code.
On-Stack Replacement
Sometimes you will encounter code that contains a hot loop within a method that is not called enough times to trigger a compilation—for example, in a Java program’s main() method.
HotSpot can still optimize this code using a technique called on-stack replacement (OSR). This trick counts the loop back branches in the interpreter; when these cross a threshold, the interpreted loop will be compiled and execution will switch to this compiled version.
The compiler is responsible for making sure any state changes, such as local variables and locks that were accessed within the interpreted loop, are made available to the compiled version. Once the compiled loop exits, all state changes must be visible at the point where execution continues.
For example, if we have this hot loop inside the main() method:
packageoptjava;publicclassOnStackReplacement{// method called oncepublicstaticvoidmain(String[]args){java.util.Randomr=newjava.util.Random();longsum=0;// first long-running loopfor(inti=0;i<1_000_000;i++){sum+=r.nextInt(100);}// second long-running loopfor(inti=0;i<1_000_000;i++){sum+=r.nextInt(100);}System.out.println(sum);}}
Then the method bytecode will look like this:
publicstaticvoidmain(java.lang.String[]);descriptor:([Ljava/lang/String;)Vflags:ACC_PUBLIC,ACC_STATICCode:stack=4,locals=5,args_size=10:new#2// class java/util/Random3:dup4:invokespecial#3// Method java/util/Random."<init>":()V7:astore_18:lconst_09:lstore_210:iconst_011:istore413:iload415:ldc#4// int 100000017:if_icmpge3620:lload_221:aload_122:bipush10024:invokevirtual#5// Method java/util/Random.nextInt:(I)I27:i2l28:ladd29:lstore_230:iinc4,133:goto1336:getstatic#6// Field java/lang/System.out:Ljava/io/PrintStream;39:lload_240:invokevirtual#7// Method java/io/PrintStream.println:(J)V43:return
The goto bytecode at index 33 returns the flow to the loop check at index 13.
Note
A back branch happens when the loop reaches the end of its body, checks its exit condition, and—if the loop has not finished—branches back to the loop body start.
HotSpot can perform OSR compilation using both the C1 and C2 JIT compilers.
JITWatch can highlight which loop was OSR-compiled in the bytecode and source code, as can be seen in Figure 10-9.
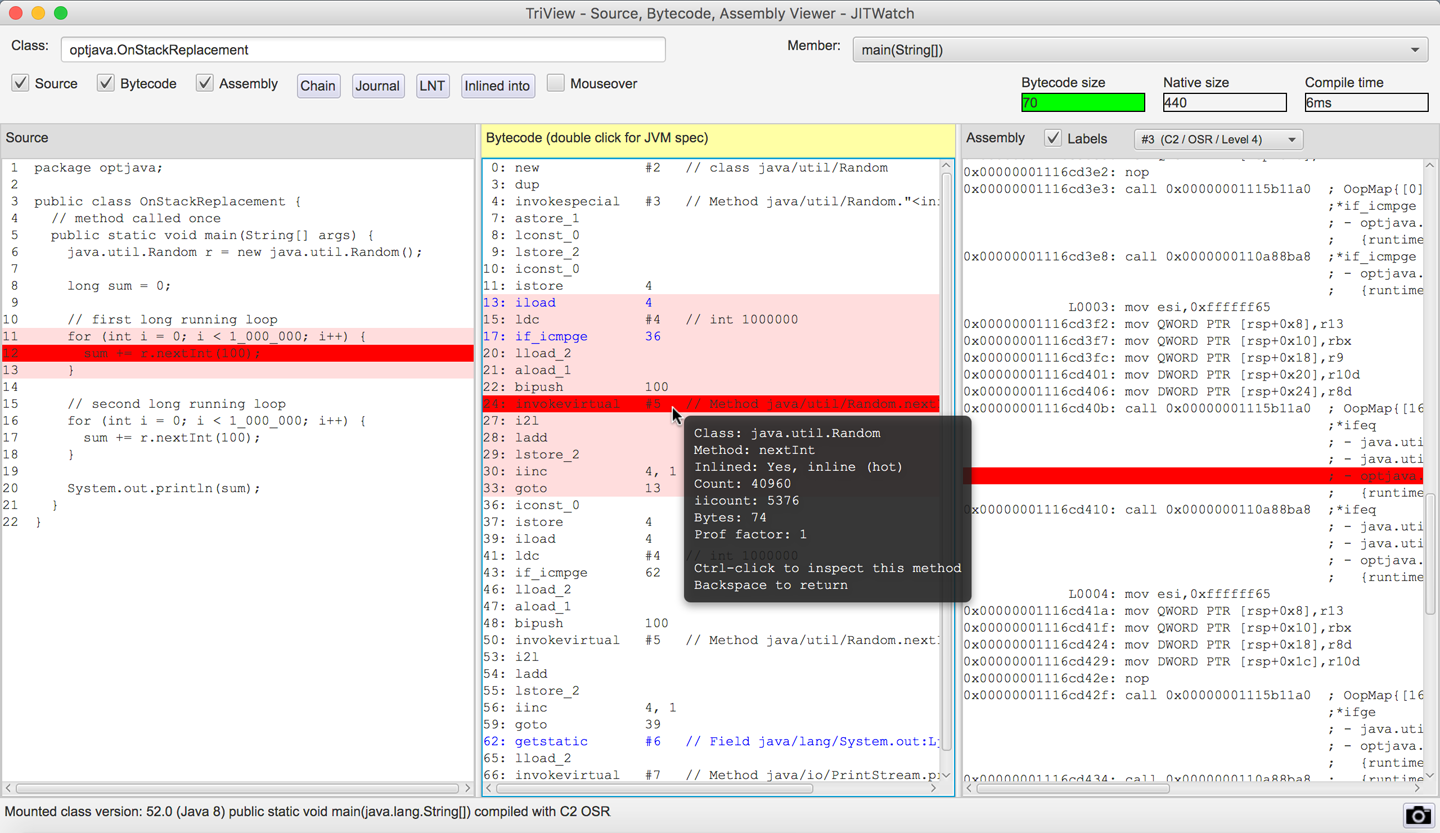
Figure 10-9. On-stack replacement
Safepoints Revisited
Before we leave the topic of JIT compilation, it makes sense to bring together a list of all the conditions in the JVM that require the VM to be at a safepoint. As well as GC STW events, the following activities require all threads to be at a safepoint:
-
Deoptimizing a method
-
Creating a heap dump
-
Revoking a biased lock
-
Redefining a class (e.g., for instrumentation)
In compiled code, the JIT compiler is responsible for emitting safepoint checks (as seen previously with loop unrolling) and in HotSpot it will generate them:
-
At Loop back branches
-
On Method return
This means that sometimes threads may take a certain amount of time to safepoint (e.g., if they are executing a loop containing a lot of arithmetic code without any method calls). If the loop is unrolled, then there may be an appreciable time before a safepoint is encountered.
Note
The JIT compiler is free to emit speculative and out-of-order instructions as long as the semantics of your program are maintained. When the VM reaches a safepoint, the state of the compiled code will match the state of your program at that point. Debuggers rely on this behavior.
The compiler will try to balance the cost of safepoint polling checks with avoiding long Time to SafePoint (TTSP) durations where threads already at their safepoint have to wait for other threads to reach theirs.
Note
You can see the total time a program has spent at safepoints, including waiting for all threads to reach the safepoints, by using the VM switch ‑XX:+PrintGCApplicationStoppedTime. Combine this with -XX:+PrintSafepointStatistics for futher information on safepoints.
We will discuss safepoints again in Chapter 13, as they are a cross-cutting concern that has an impact on many of the JVM subsystems.
Core Library Methods
To conclude this chapter, let’s take a quick look at some of the impacts of the size of JDK core library methods on JIT compilation.
Upper Method Size Limit for Inlining
Because inlining decisions are made on the bytecode size of a method, it is possible to identify methods that are too big for inlining using static analysis of class files.
The open source JarScan tool (part of the JITWatch distribution—its launch scripts are found in the JITWatch root folder) can identify all of the methods within a class folder or JAR file whose bytecode size is above a given threshold.
Running this tool over the Java 8 core libraries found in jre/lib/rt.jar with a command such as the following highlights some interesting results:
$ ./jarScan.sh --mode=maxMethodSize \
               --limit=325 \
               --packages=java.* \
               /path/to/java/jre/lib/rt.jar
In Java 8u152, on Linux x86_64, there are 490 methods in the java.* package tree larger than 325 bytes of bytecode (the FreqInlineSize limit for that platform), some of which are methods that you would not be surprised to find in hot code.
For example, the methods toUpperCase() and toLowerCase() from the java.lang.String class weigh in at a surprisingly large 439 bytes of bytecode each—outside the normal range for inlining.
The reason for this size is that in some locales, converting the case of a character changes the number of char values needed to store it.
The case-converting methods must therefore be able to detect this situation and resize and copy the underlying arrays backing the string, as demonstrated by the default implementation of the toUpperCase() method:
publicStringtoUpperCase(Localelocale){if(locale==null){thrownewNullPointerException();}intfirstLower;finalintlen=value.length;/* Now check if there are any characters that need to be changed. */scan:{for(firstLower=0;firstLower<len;){intc=(int)value[firstLower];intsrcCount;if((c>=Character.MIN_HIGH_SURROGATE)&&(c<=Character.MAX_HIGH_SURROGATE)){c=codePointAt(firstLower);srcCount=Character.charCount(c);}else{srcCount=1;}intupperCaseChar=Character.toUpperCaseEx(c);if((upperCaseChar==Character.ERROR)||(c!=upperCaseChar)){breakscan;}firstLower+=srcCount;}returnthis;}/* result may grow, so i+resultOffset is the write location in result */intresultOffset=0;char[]result=newchar[len];/* may grow *//* Just copy the first few upperCase characters. */System.arraycopy(value,0,result,0,firstLower);Stringlang=locale.getLanguage();booleanlocaleDependent=(lang=="tr"||lang=="az"||lang=="lt");char[]upperCharArray;intupperChar;intsrcChar;intsrcCount;for(inti=firstLower;i<len;i+=srcCount){srcChar=(int)value[i];if((char)srcChar>=Character.MIN_HIGH_SURROGATE&&(char)srcChar<=Character.MAX_HIGH_SURROGATE){srcChar=codePointAt(i);srcCount=Character.charCount(srcChar);}else{srcCount=1;}if(localeDependent){upperChar=ConditionalSpecialCasing.toUpperCaseEx(this,i,locale);}else{upperChar=Character.toUpperCaseEx(srcChar);}if((upperChar==Character.ERROR)||(upperChar>=Character.MIN_SUPPLEMENTARY_CODE_POINT)){if(upperChar==Character.ERROR){if(localeDependent){upperCharArray=ConditionalSpecialCasing.toUpperCaseCharArray(this,i,locale);}else{upperCharArray=Character.toUpperCaseCharArray(srcChar);}}elseif(srcCount==2){resultOffset+=Character.toChars(upperChar,result,i+resultOffset)-srcCount;continue;}else{upperCharArray=Character.toChars(upperChar);}/* Grow result if needed */intmapLen=upperCharArray.length;if(mapLen>srcCount){char[]result2=newchar[result.length+mapLen-srcCount];System.arraycopy(result,0,result2,0,i+resultOffset);result=result2;}for(intx=0;x<mapLen;++x){result[i+resultOffset+x]=upperCharArray[x];}resultOffset+=(mapLen-srcCount);}else{result[i+resultOffset]=(char)upperChar;}}returnnewString(result,0,len+resultOffset);}
Improve performance with a domain-specific method
If you can be sure that in your problem domain the character set of your inputs does not require this flexibility (perhaps all your inputs are in ASCII), then you could create a domain-specific version of toUpperCase() whose bytecode is easily within the inlining limits.
This ASCII-specific implementation compiles to just 69 bytes of bytecode:
packageoptjava.jmh;importorg.openjdk.jmh.annotations.*;importjava.util.concurrent.TimeUnit;@State(Scope.Thread)@BenchmarkMode(Mode.Throughput)@OutputTimeUnit(TimeUnit.SECONDS)publicclassDomainSpecificUpperCase{privatestaticfinalStringSOURCE="The quick brown fox jumps over the lazy dog";publicStringtoUpperCaseASCII(Stringsource){intlen=source.length();char[]result=newchar[len];for(inti=0;i<len;i++){charc=source.charAt(i);if(c>='a'&&c<='z'){c-=32;}result[i]=c;}returnnewString(result);}@BenchmarkpublicStringtestStringToUpperCase(){returnSOURCE.toUpperCase();}@BenchmarkpublicStringtestCustomToUpperCase(){returntoUpperCaseASCII(SOURCE);}}
Comparing the performance of the custom implementation against the core library’s String.toUpperCase() method shows the following results:
Benchmark                                   Mode  Cnt     Score   Error  Units
DomainS...UpperCase.testCustomToUpperCase  thrpt  200  20138368 ± 17807  ops/s
DomainS...UpperCase.testStringToUpperCase  thrpt  200   8350400 ±  7199  ops/s
In this benchmark the domain-specific version performed approximately 2.4x the number of operations per second as the core library version.
Benefits of small methods
Another benefit of keeping methods small is that it increases the number of inlining permutations. Varying runtime data can result in different paths through the code becoming “hot.”
By keeping methods small, we can build different inlining trees to optimize more of these hot paths. With larger methods, inlining size limits may be reached earlier, leaving some paths unoptimized.
Upper Method Size Limit for Compilation
There is one more limit inside HotSpot that we will now demonstrate. It is the bytecode size above which methods will not be compiled: 8,000 bytes. In the production JVM this limit cannot be changed, but if you are running a debug JVM you can use the switch -XX:HugeMethodLimit=<n> to set the maximum bytecode size for a method to be compilable.
Find these methods in the JDK core libraries using JarScan as follows:
./jarScan.sh --mode=maxMethodSize --limit=8000 /path/to/java/jre/lib/rt.jar
The results are as shown in Table 10-4.
| Method | Size (bytes) |
|---|---|
|
23,103 |
|
22,832 |
|
17,818 |
|
17,441 |
|
15,361 |
|
14,060 |
|
12,087 |
|
11,759 |
|
10,921 |
|
8,578 |
|
8,152 |
|
8,152 |
None of these huge methods are likely to be found in hot code. They are mostly UI subsystem initializers or provide resources for lists of currencies, countries, or locale names.
To demonstrate the effect of losing JIT compilation, we will look at a benchmark of two near-identical methods, one just under the limit and one just over the HugeMethodLimit size:
privatejava.util.Randomr=newjava.util.Random();@BenchmarkpubliclonglessThan8000(){returnr.nextInt()+r.nextInt()+...// for a total method size of just under 8000 bytes of bytecode}@BenchmarkpubliclongmoreThan8000(){returnr.nextInt()+r.nextInt()+...// for a total method size of just over 8000 bytes of bytecode}
This results in the following output:
Benchmark                 Mode  Cnt      Score     Error  Units
HugeMethod.lessThan8000  thrpt  100  89550.631 ±  77.703  ops/s
HugeMethod.moreThan8000  thrpt  100  44429.392 ± 102.076  ops/s
The method moreThan8000() was not JIT-compiled and ran at approximately half the speed of the method lessThan8000() that did get JIT-compiled. There are many reasons not to create such huge methods (e.g., readability, maintenance, debugging), but this gives you one more.
A real-world situation where huge methods may get created is in autogenerated code. Some software autogenerates code to represent queries on a data store. The query code is then compiled so that it can be executed on the JVM for performance. If a query were of a high enough complexity it could hit this HotSpot limit, so checking method sizes with a tool such as JarScan may be helpful.
Summary
In this chapter, we have covered the basics of HotSpot’s JIT compilation subsystem and examined how some of its optimizations are performed. We have looked at the parameters that can be used to tune the JIT compilers and inspected some of the assembly produced.
In terms of actionable, practical techniques, we can use the -XX:+PrintCompilation flag and the technique introduced in the last chapter to confirm the optimization of individual methods.
The general principle of “write good code first, optimize only when required” definitely applies here.
A knowledge of the limits for inlining and other compilation thresholds will allow developers to refactor and stay within those limits (or, in rare cases, alter the thresholds).
Understanding the existence of monomorphic dispatch and type sharpening means that applications can be written according to a classic principle: design for interfaces, even if there’s just a single implementation.
This gives the best of two approaches—the class can still be dummied up or mocked for testing, but the single implementation preserves monomorphic dispatch.