Table of Contents for
Optimizing Java
 Optimizing Java
Published by
O'Reilly Media, Inc., 2018
Optimizing Java
Published by
O'Reilly Media, Inc., 2018
- nav
- Cover
- Optimizing Java
- Optimizing Java
- Dedication
- Foreword
- Preface
- 1. Optimization and Performance Defined
- 2. Overview of the JVM
- 3. Hardware and Operating Systems
- 4. Performance Testing Patterns and Antipatterns
- 5. Microbenchmarking and Statistics
- 6. Understanding Garbage Collection
- 7. Advanced Garbage Collection
- 8. GC Logging, Monitoring, Tuning, and Tools
- 9. Code Execution on the JVM
- 10. Understanding JIT Compilation
- 11. Java Language Performance Techniques
- 12. Concurrent Performance Techniques
- 13. Profiling
- 14. High-Performance Logging and Messaging
- 15. Java 9 and the Future
- Index
- About the Authors
- Colophon
Chapter 7. Advanced Garbage Collection
In the last chapter we introduced the basic theory of Java garbage collection. From that starting point, we will move forward to introduce the theory of modern Java garbage collectors. This is an area that has unavoidable tradeoffs that guide the engineer’s choice of collector.
To begin with we’ll introduce and delve into the other collectors the HotSpot JVM provides. These include the ultra low-pause, mostly concurrent collector (CMS) and the modern general-purpose collector (G1).
We will also consider some more rarely seen collectors. These are:
-
Shenandoah
-
C4
-
Balanced
-
Legacy HotSpot collectors
Not all of these collectors are used in the HotSpot virtual machine—we will also be discussing the collectors of two other virtual machines: IBM J9 (a formerly closed source JVM that IBM is in the process of opening) and Azul Zing (a proprietary JVM). We have previously introduced both of these VMs in “Meet the JVMs”.
Tradeoffs and Pluggable Collectors
One aspect of the Java platform that beginners don’t always immediately recognize is that while Java has a garbage collector, the language and VM specifications do not say how GC should be implemented. In fact, there have been Java implementations (e.g., Lego Mindstorms) that didn’t implement any kind of GC at all!1
Within the Sun (now Oracle) environment, the GC subsystem is treated as a pluggable subsystem. This means that the same Java program can execute with different garbage collectors without changing the semantics of the program, although the performance of the program may vary considerably based on which collector is in use.
The primary reason for having pluggable collectors is that GC is a very general computing technique. In particular, the same algorithm may not be appropriate for every workload. As a result, GC algorithms represent a compromise or tradeoff between competing concerns.
Note
There is no single general-purpose GC algorithm that can optimize for all GC concerns simultaneously.
The main concerns that developers often need to consider when choosing a garbage collector include:
-
Pause time (aka pause length or duration)
-
Throughput (as a percentage of GC time to application runtime)
-
Pause frequency (how often the collector needs to stop the application)
-
Reclamation efficiency (how much garbage can be collected on a single GC duty cycle)
-
Pause consistency (are all pauses roughly the same length?)
Of these, pause time often attracts a disproportionate amount of attention. While important for many applications, it should not be considered in isolation.
Tip
For many workloads pause time is not an effective or useful performance characteristic.
For example, a highly parallel batch processing or Big Data application is likely to be much more concerned with throughput rather than pause length. For many batch jobs, pause times of even tens of seconds are not really relevant, so a GC algorithm that favors CPU efficiency of GC and throughput is greatly preferred to an algorithm that is low-pause at any cost.
The performance engineer should also note that there are a number of other tradeoffs and concerns that are sometimes important when considering the choice of collector. However, in the case of HotSpot, the choice is constrained by the available collectors.
Within Oracle/OpenJDK, as of version 10, there are three mainstream collectors for general production use. We have already met the parallel (aka throughput) collectors, and they are the easiest to understand from a theoretical and algorithmic point of view. In this chapter, we will meet the two other mainstream collectors and explain how they differ from Parallel GC.
Toward the end of the chapter, in “Shenandoah” and beyond, we will also meet some other collectors that are available, but please note that not all of them are recommended for production use, and some are now deprecated. We also provide a short discussion of collectors available in non-HotSpot JVMs.
Concurrent GC Theory
In specialized systems, such as graphics or animation display systems, there is often a fixed frame rate, which provides a regular, fixed opportunity for GC to be performed.
However, garbage collectors intended for general-purpose use have no such domain knowledge with which to improve the determinism of their pauses. Worse still, nondeterminism is directly caused by allocation behavior, and many of the systems that Java is used for exhibit highly variable allocation.
The minor disadvantage of this arrangement is the delay of the computation proper; its major disadvantage is the unpredictability of these garbage collecting interludes.
Edsger Dijkstra
The starting point for modern GC theory is to try to address Dijkstra’s insight that the nondeterministic nature of STW pauses (both in duration and in frequency) is the major annoyance of using GC techniques.
One approach is to use a collector that is concurrent (or at least partially or mostly concurrent) in order to reduce pause time by doing some of the work needed for collection while the application threads are running. This inevitably reduces the processing power available for the actual work of the application, as well as complicating the code needed to perform collection.
Before discussing concurrent collectors, though, there is an important piece of GC terminology and technology that we need to address, as it is essential to understanding the nature and behavior of modern garbage collectors.
JVM Safepoints
In order to carry out an STW garbage collection, such as those performed by HotSpot’s parallel collectors, all application threads must be stopped. This seems almost a tautology, but until now we have not discussed exactly how the JVM achieves this.
The JVM is not actually a fully preemptive multithreading environment.
A Secret
This does not mean that it is purely a cooperative environment—quite the opposite. The operating system can still preempt (remove a thread from a core) at any time. This is done, for example, when a thread has exhausted its timeslice or put itself into a wait().
As well as this core OS functionality, the JVM also needs to perform coordinated actions. In order to facilitate this, the runtime requires each application thread to have special execution points, called safepoints, where the thread’s internal data structures are in a known-good state. At these times, the thread is able to be suspended for coordinated actions.
Note
We can see the effects of safepoints in STW GC (the classic example) and thread synchronization, but there are others as well.
To understand the point of safepoints, consider the case of a fully STW garbage collector. For this to run, it requires a stable object graph. This means that all application threads must be paused. There is no way for a GC thread to demand that the OS enforces this demand on an application thread, so the application threads (which are executing as part of the JVM process) must cooperate to achieve this. There are two primary rules that govern the JVM’s approach to safepointing:
-
The JVM cannot force a thread into the safepoint state.
-
The JVM can prevent a thread from leaving the safepoint state.
This means that the implementation of the JVM interpreter must contain code to yield at a barrier if safepointing is required. For JIT-compiled methods, equivalent barriers must be inserted into the generated machine code. The general case for reaching safepoints then looks like this:
-
The JVM sets a global “time to safepoint” flag.
-
Individual application threads poll and see that the flag has been set.
-
They pause and wait to be woken up again.
When this flag is set, all app threads must stop. Threads that stop quickly must wait for slower stoppers (and this time may not be fully accounted for in the pause time statistics).
Normal app threads use this polling mechanism. They will always check in between executing any two bytecodes in the interpreter. In compiled code, the most common cases where the JIT compiler has inserted a poll for safepoints are exiting a compiled method and when a loop branches backward (e.g., to the top of the loop).
It is possible for a thread to take a long time to safepoint, and even theoretically to never stop (but this is a pathological case that must be deliberately provoked).
Note
The idea that all threads must be fully stopped before the STW phase can commence is similar to the use of latches, such as that implemented by CountDownLatch in the java.util.concurrent library.
Some specific cases of safepoint conditions are worth mentioning here.
A thread is automatically at a safepoint if it:
-
Is blocked on a monitor
-
Is executing JNI code
A thread is not necessarily at a safepoint if it:
-
Is partway through executing a bytecode (interpreted mode)
-
Has been interrupted by the OS
We will meet the safepointing mechanism again later on, as it is a critical piece of the internal workings of the JVM.
Tri-Color Marking
Dijkstra and Lamport’s 1978 paper describing their tri-color marking algorithm was a landmark for both correctness proofs of concurrent algorithms and GC, and the basic algorithm it describes remains an important part of garbage collection theory.2
The algorithm works like this:
-
GC roots are colored gray.
-
All other objects are colored white.
-
A marking thread moves to a random gray node.
-
If the node has any white children, the marking thread first colors them gray, then colors the node black.
-
This process is repeated until there are no gray nodes left.
-
All black objects have been proven to be reachable and must remain alive.
-
White nodes are eligible for collection and correspond to objects that are no longer reachable.
There are some complications, but this is the basic form of the algorithm. An example is shown in Figure 7-1.
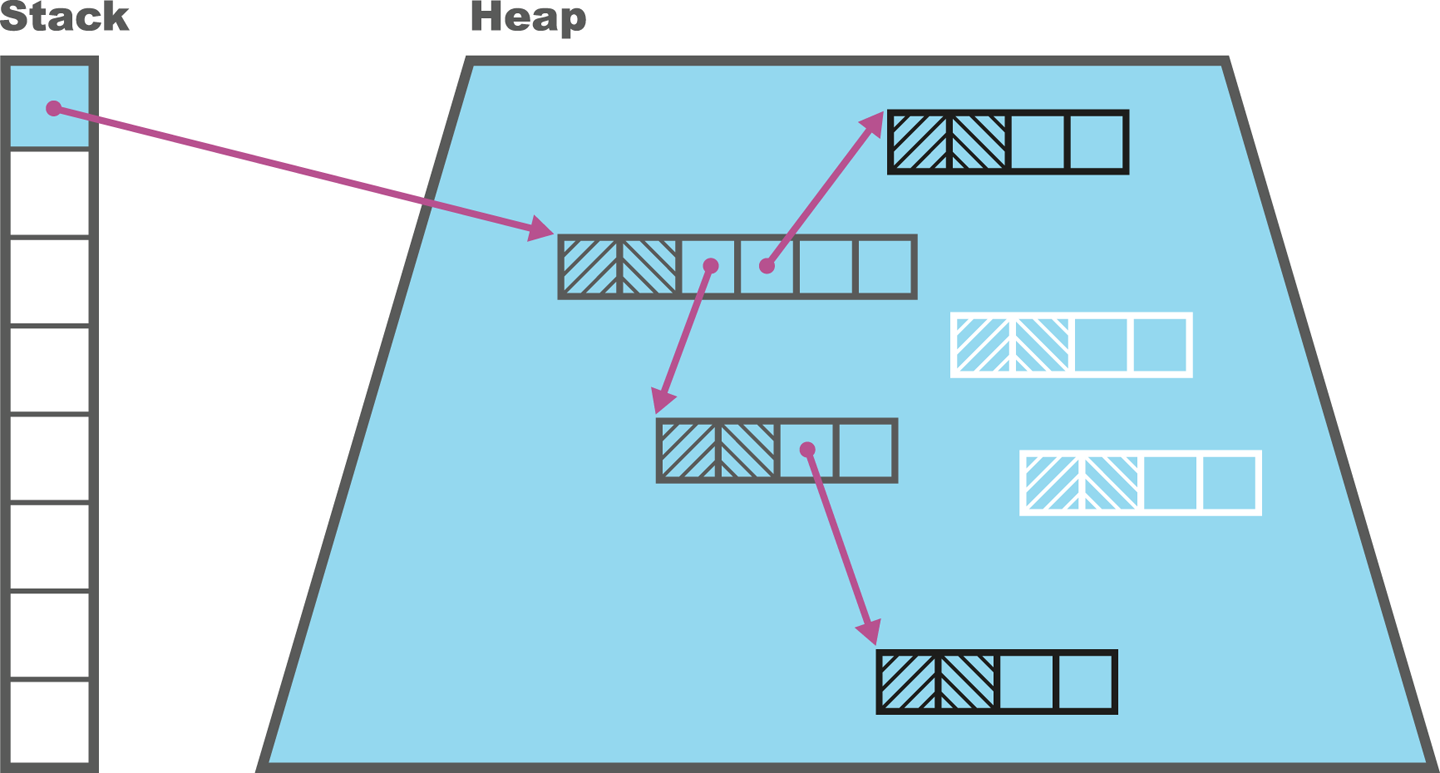
Figure 7-1. Tri-color marking
Concurrent collection also frequently makes use of a technique called snapshot at the beginning (SATB). This means that the collector regards objects as live if they were reachable at the start of the collection cycle or have been allocated since. This adds some minor wrinkles to the algorithm, such as mutator threads needing to create new objects in the black state if a collection is running, and in the white state if no collection is in progress.
The tri-color marking algorithm needs to be combined with a small amount of additional work in order to ensure that the changes introduced by the running application threads do not cause live objects to be collected. This is because in a concurrent collector, application (mutator) threads are changing the object graph, while marking threads are executing the tri-color algorithm.
Consider the situation where an object has already been colored black by a marking thread, and then is updated to point at a white object by a mutator thread. This is the situation shown in Figure 7-2.
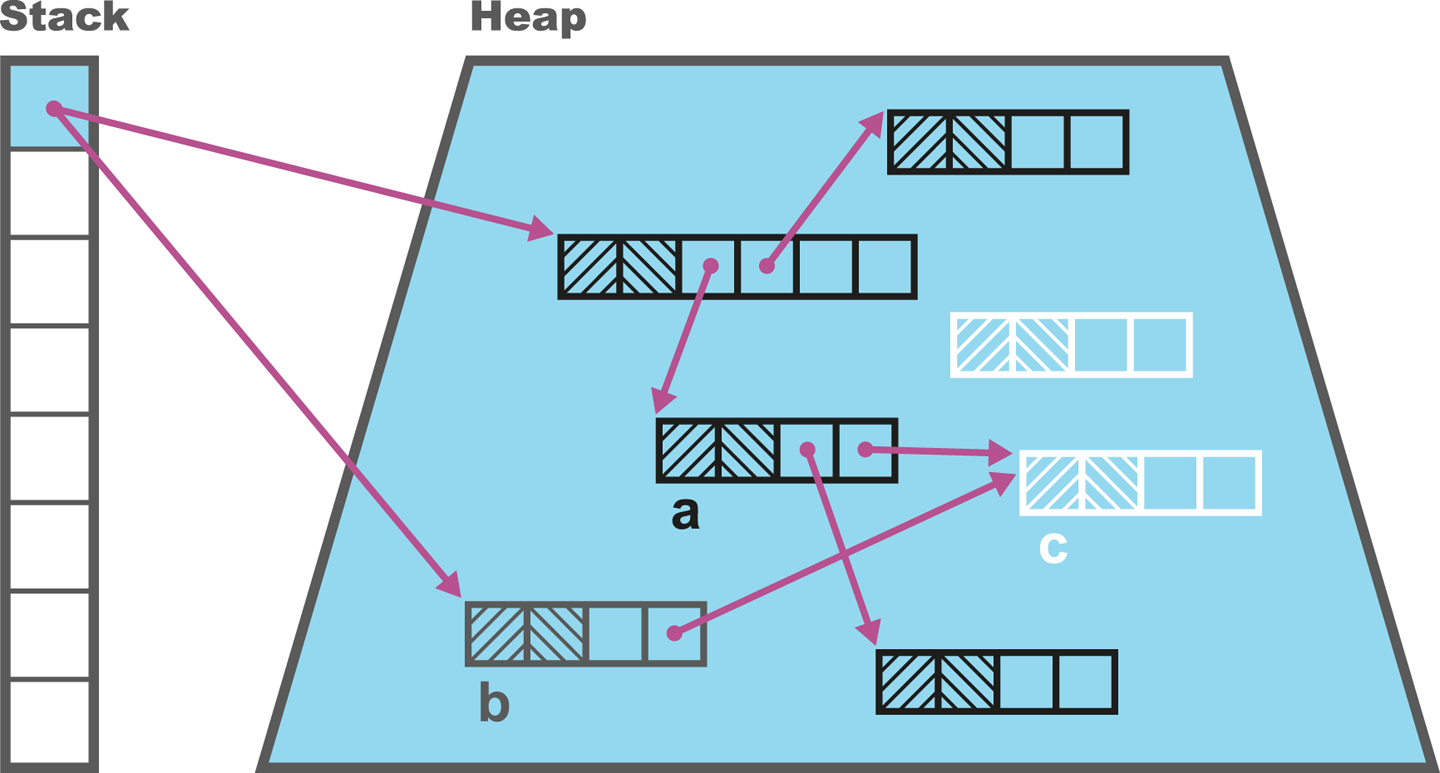
Figure 7-2. A mutator thread could invalidate tri-color marking
If all references from gray objects to the new white object are now deleted, we have a situation where the white object should still be reachable but will be deleted, as it will not be found, according to the rules of the algorithm.
This problem can be solved in several different ways. We could, for example, change the color of the black object back to gray, adding it back to the set of nodes that need processing as the mutator thread processes the update.
That approach, using a “write barrier” for the update, would have the nice algorithmic property that it would maintain the tri-color invariant throughout the whole of the marking cycle.
No black object node may hold a reference to a white object node during concurrent marking.
Tri-color invariant
An alternative approach would be to keep a queue of all changes that could potentially violate the invariant, and then have a secondary “fixup” phase that runs after the main phase has finished. Different collectors can resolve this problem with tri-color marking in different ways, based on criteria such as performance or the amount of locking required.
In the next section we will meet the low-pause collector, CMS. We are introducing this collector before the others despite it being a collector with only a limited range of applicability. This is because developers are frequently unaware of the extent to which GC tuning requires tradeoffs and compromises.
By considering CMS first, we can showcase some of the practical issues that performance engineers should be aware of when thinking about garbage collection. The hope is that this will lead to a more evidence-based approach to tuning and the inherent tradeoffs in the choice of collector, and a little less Tuning by Folklore.
CMS
The Concurrent Mark and Sweep (CMS) collector is designed to be an extremely low-pause collector for the Tenured (aka old generation) space only. It is usually paired with a slightly modified parallel collector for collecting the young generation (called ParNew rather than Parallel GC).
CMS does as much work as possible while application threads are still running, so as to minimize pause time. The marking algorithm used is a form of tri-color marking, and this means, of course, that the object graph may be mutating while the collector is scanning the heap. As a result, CMS must fix up its records to avoid violating the second rule of garbage collectors, and collecting an object that is still alive.
This leads to a more complex set of phases in CMS than is seen in the parallel collectors. These phases are usually referred to as follows:
-
Initial Mark (STW)
-
Concurrent Mark
-
Concurrent Preclean
-
Remark (STW)
-
Concurrent Sweep
-
Concurrent Reset
For most of the phases, GC runs alongside application threads. However, for two phases (Initial Mark and Remark), all application threads must be stopped. The overall effect should be to replace a single long STW pause with two STW pauses, which are usually very short.
The purpose of the Initial Mark phase is to provide a stable set of starting points for GC that are within the region; these are known as the internal pointers and provide an equivalent set to the GC roots for the purposes of the collection cycle. The advantage of this approach is that it allows the marking phase to focus on a single GC pool without having to consider other memory regions.
After the Initial Mark has concluded, the Concurrent Mark phase commences. This essentially runs the tri-color marking algorithm on the heap, keeping track of any changes that might later require fixup.
The Concurrent Preclean phase appears to try to reduce the length of the STW Remark phase as much as possible. The Remark phase uses the card tables to fix up the marking that might have been affected by mutator threads during the Concurrent Mark phase.
The observable effects of using CMS are as follows, for most workloads:
-
Application threads don’t stop for as long.
-
A single full GC cycle takes longer (in wallclock time).
-
Application throughput is reduced while a CMS GC cycle is running.
-
GC uses more memory for keeping track of objects.
-
Considerably more CPU time is needed overall to perform GC.
-
CMS does not compact the heap, so Tenured can become fragmented.
The careful reader will note that not all of these characteristics are positive. Remember that with GC there is no silver bullet, merely a set of choices that are appropriate (or acceptable) to the specific workload an engineer is tuning.
How CMS Works
One of the most often overlooked aspects of CMS is, bizarrely, its great strength. CMS mostly runs concurrently with application threads. By default, CMS will use half of the available threads to perform the concurrent phases of GC, and leave the other half for application threads to execute Java code—and this inevitably involves allocating new objects. This sounds like a flash of the blindingly obvious, but it has an immediate consequence. What happens if Eden fills up while CMS is running?
The answer is, unsurprisingly, that because application threads cannot continue, they pause and a (STW) young GC runs while CMS is running. This young GC run will usually take longer than in the case of the parallel collectors, because it only has half the cores available for young generation GC (the other half of the cores are running CMS).
At the end of this young collection, some objects will usually be eligible for promotion to Tenured. These promoted objects need to be moved into Tenured while CMS is still running, which requires some coordination between the two collectors. This is why CMS requires a slightly different young collector.
Under normal circumstances, the young collection promotes only a small amount of objects to Tenured, and the CMS old collection completes normally, freeing up space in Tenured. The application then returns to normal processing, with all cores released for application threads.
However, consider the case of very high allocation, perhaps causing premature promotion (discussed at the end of “The Role of Allocation”) in the young collection. This can cause a situation in which the young collection has too many objects to promote for the available space in Tenured. This can be seen in Figure 7-3.
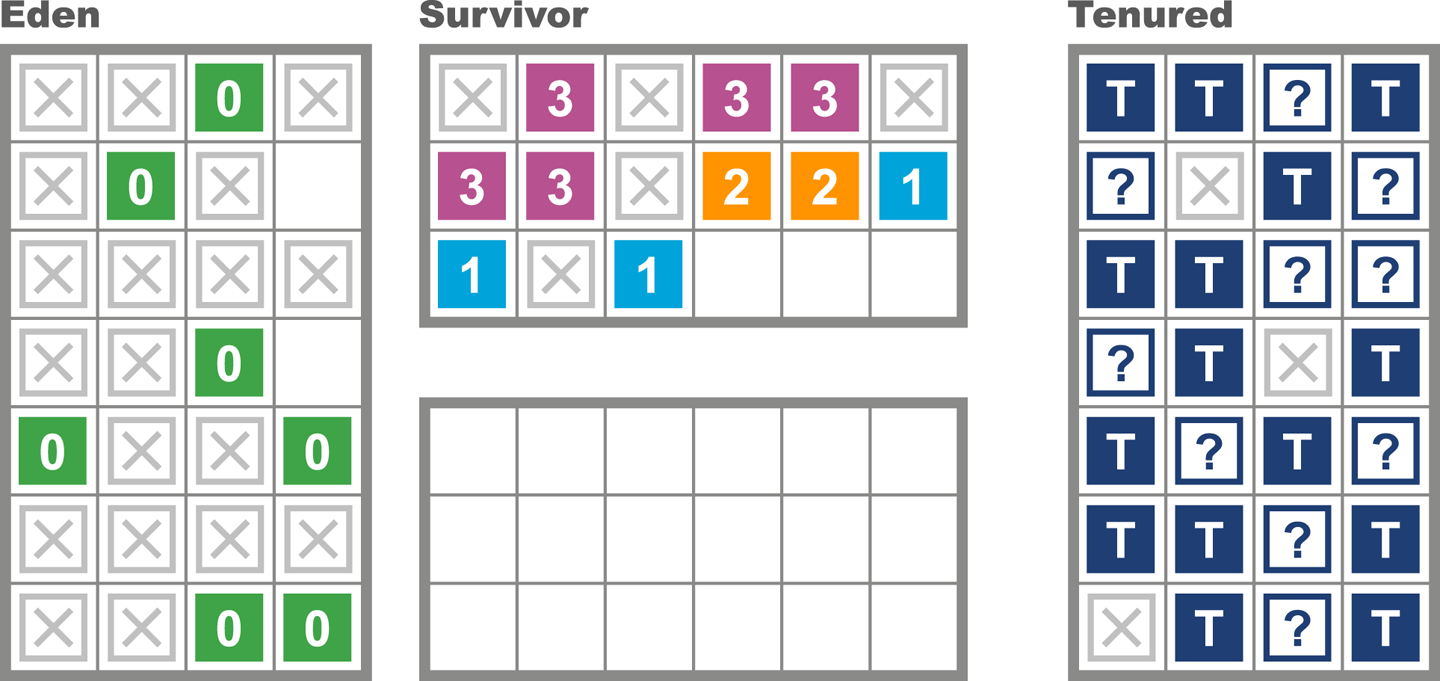
Figure 7-3. Concurrent mode failure from allocation pressure
This is known as a concurrent mode failure (CMF), and the JVM has no choice at this point but to fall back to a collection using ParallelOld, which is fully STW. Effectively, the allocation pressure was so high that CMS did not have time to finish processing the old generation before all the “headroom” space to accommodate newly promoted objects filled up.
To avoid frequent concurrent mode failures, CMS needs to start a collection cycle before Tenured is completely full. The heap occupancy level of Tenured at which CMS will start to collect is controlled by the observed behavior of the heap. It can be affected by switches, and starts off defaulted to 75% of Tenured.
There is one other situation that can lead to a concurrent mode failure, and this is heap fragmentation. Unlike ParallelOld, CMS does not compact Tenured as it runs. This means that after a completed run of CMS, the free space in Tenured is not a single contiguous block, and objects that are promoted have to be filled into the gaps between existing objects.
At some point, a young collection may encounter a situation where an object can’t be promoted into Tenured due to a lack of sufficient contiguous space to copy the object into. This can be seen in Figure 7-4.
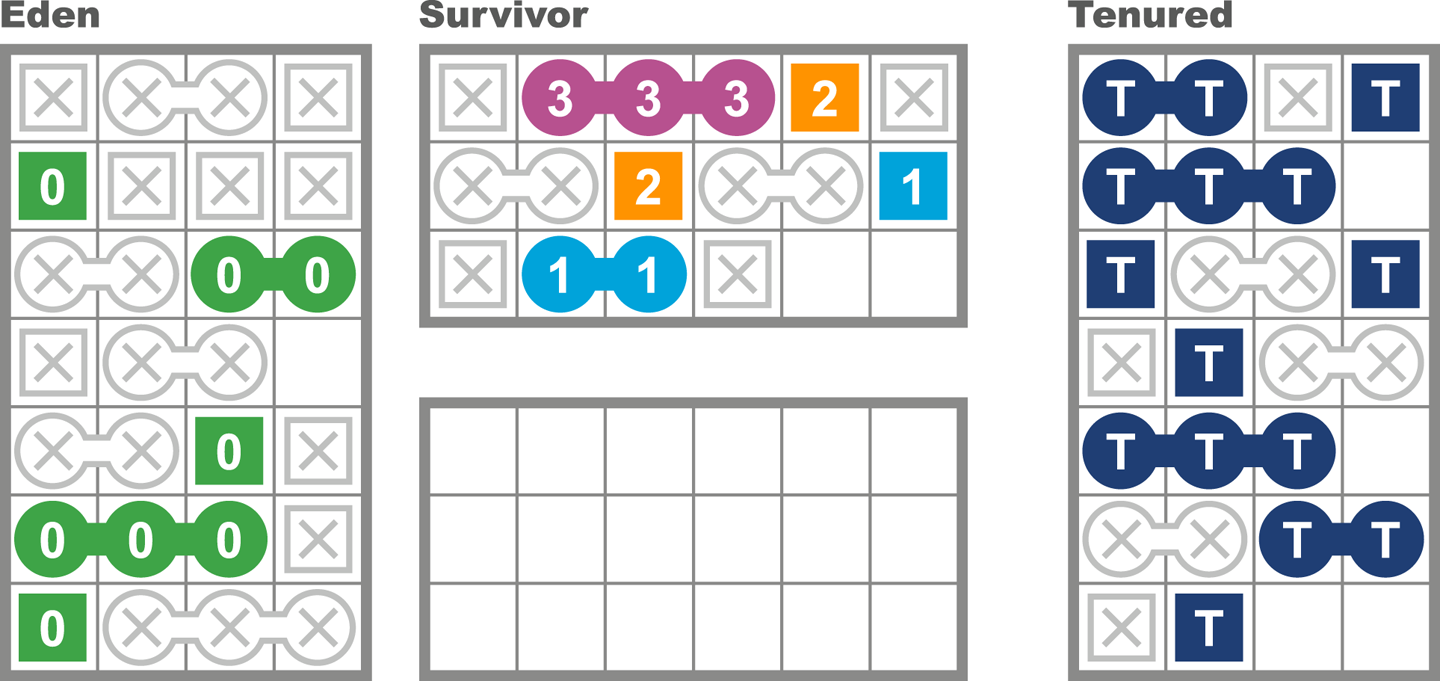
Figure 7-4. Concurrent mode failure from fragmentation
This is a concurrent mode failure caused by heap fragmentation, and as before, the only solution is to fall back to a full collection using ParallelOld (which is compacting), as this should free up enough contiguous space to allow the object to be promoted.
In both the heap fragmentation case and the case where young collections outpace CMS, the need to fall back to a fully STW ParallelOld collection can be a major event for an application. In fact, the tuning of low-latency applications that use CMS in order to avoid ever suffering a CMF is a major topic in its own right.
Internally, CMS uses a free list of chunks of memory to manage the available free space. During the final phase, Concurrent Sweep, contiguous free blocks will be coalesced by the sweeper threads. This is to provide larger blocks of free space and try to avoid CMFs caused by fragmentation.
However, the sweeper runs concurrently with mutators. Thus, unless the sweeper and the allocator threads synchronize properly, a freshly allocated block might get incorrectly swept up. To prevent this, the sweeper locks the free lists while it is sweeping.
Basic JVM Flags for CMS
The CMS collector is activated with this flag:
-XX:+UseConcMarkSweepGC
On modern versions of HotSpot, this flag will activate ParNewGC (a slight variation of the parallel young collector) as well.
In general, CMS provides a very large number of flags (over 60) that can be adjusted. It can sometimes be tempting to engage in benchmarking exercises that attempt to optimize performance by carefully adjusting the various options that CMS provides. This should be resisted, as in most cases this is actually the Missing the Bigger Picture or Tuning by Folklore (see the “Performance Antipatterns Catalogue”) antipattern in disguise.
We will cover CMS tuning in more detail in “Tuning Parallel GC”.
G1
G1 (the “Garbage First” collector) is a very different style of collector than either the parallel collectors or CMS. It was first introduced in a highly experimental and unstable form in Java 6, but was extensively rewritten throughout the lifetime of Java 7, and only really became stable and production-ready with the release of Java 8u40.
Tip
We do not recommend using G1 with any version of Java prior to 8u40, regardless of the type of workload being considered.
G1 was originally intended to be a replacement low-pause collector that was:
-
Much easier to tune than CMS
-
Less susceptible to premature promotion
-
Capable of better scaling behavior (especially pause time) on big heaps
-
Able to eliminate (or greatly reduce the need to fall back to) full STW collections
However, over time, G1 evolved into being thought of as more of a general-purpose collector that had better pause times on larger heaps (which are increasingly thought of as “the new normal”).
Note
Oracle insisted that G1 became the default collector in Java 9, taking over from the parallel collectors, regardless of the impact on end users. It is therefore very important that performance analysts have a good understanding of G1, and that any applications moving from 8 to 9 are properly retested as part of the move.
The G1 collector has a design that rethinks the notion of generations as we have met them so far. Unlike the parallel or CMS collectors, G1 does not have dedicated, contiguous memory spaces per generation. In addition, it does not follow the hemispherical heap layout, as we will see.
G1 Heap Layout and Regions
The G1 heap is based upon the concept of regions. These are areas which are by default 1 MB in size (but are larger on bigger heaps). The use of regions allows for noncontiguous generations and makes it possible to have a collector that does not need to collect all garbage on each run.
Note
The overall G1 heap is still contiguous in memory—it’s just that the memory that makes up each generation no longer has to be.
The region-based layout of the G1 heap can be seen in Figure 7-5.
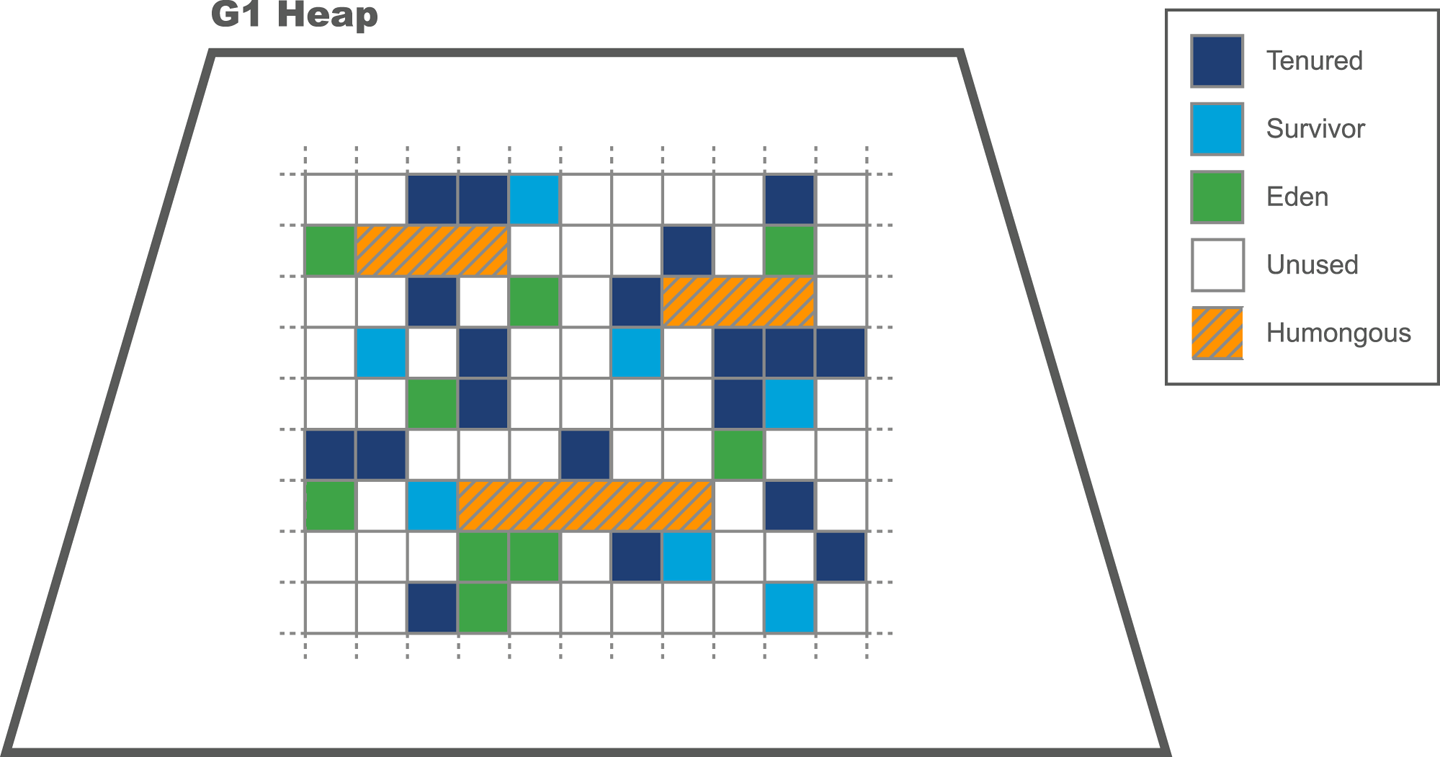
Figure 7-5. G1 regions
G1’s algorithm allows regions of either 1, 2, 4, 8, 16, 32, or 64 MB. By default, it expects between 2,048 and 4,095 regions in the heap and will adjust the region size to achieve this.
To calculate the region size, we compute this value:
<Heap size> / 2048
and then round it down to the nearest permitted region size value. Then the number of regions can be calculated:
Number of regions = <Heap size> / <region size>
As usual, we can change this value by applying a runtime switch.
G1 Algorithm Design
The high-level picture of the collector is that G1:
-
Uses a concurrent marking phase
-
Is an evacuating collector
-
Provides “statistical compaction”
While warming up, the collector keeps track of the statistics of how many “typical” regions can be collected per GC duty cycle. If enough memory can be collected to balance the new objects that have been allocated since the last GC, then G1 is not losing ground to allocation.
The concepts of TLAB allocation, evacuation to survivor space, and promoting to Tenured are broadly similar to the other HotSpot GCs that we’ve already met.
Note
Objects that occupy more space than half a region size are considered humongous objects. They are directly allocated in special humongous regions, which are free, contiguous regions that are immediately made part of the Tenured generation (rather than Eden).
G1 still has a concept of a young generation made up of Eden and survivor regions, but of course the regions that make up a generation are not contiguous in G1. The size of the young generation is adaptive and is based on the overall pause time goal.
Recall that when we met the ParallelOld collector, the heuristic “few references from old to young objects” was discussed, in “Weak Generational Hypothesis”. HotSpot uses a mechanism called card tables to help take advantage of this phenomenon in the parallel and CMS collectors.
The G1 collector has a related feature to help with region tracking. The Remembered Sets (usually just called RSets) are per-region entries that track outside references that point into a heap region. This means that instead of tracing through the entire heap for references that point into a region, G1 just needs to examine the RSets and then scan those regions for references.
Figure 7-6 shows how the RSets are used to implement G1’s approach to dividing up the work of GC between allocator and collector.
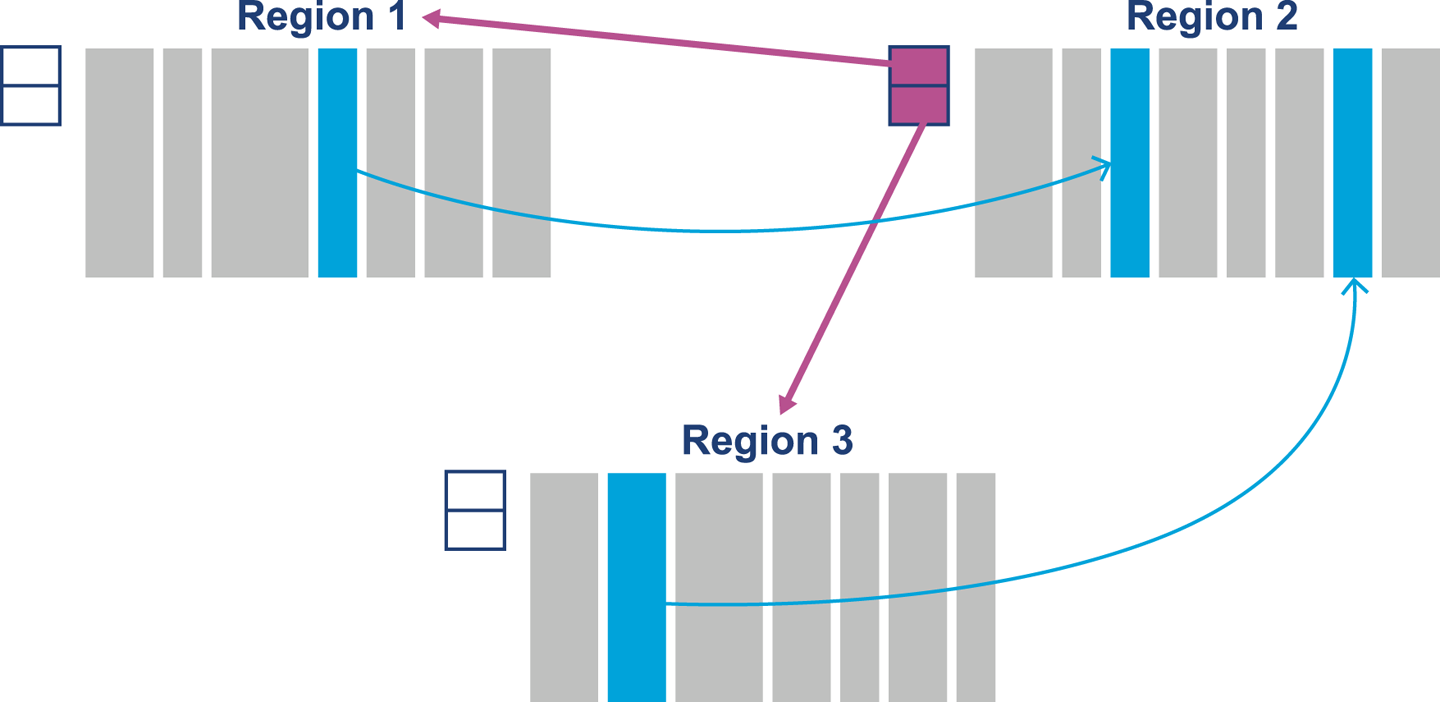
Figure 7-6. Remembered Sets
Both RSets and card tables are approaches that can help with a GC problem called floating garbage. This is an issue that is caused when objects that are otherwise dead are kept alive by references from dead objects outside the current collection set. That is, on a global mark they can be seen to be dead, but a more limited local marking may incorrectly report them as alive, depending on the root set used.
G1 Phases
G1 has a collection of phases that are somewhat similar to the phases we’ve already met, especially in CMS:
-
Initial Mark (STW)
-
Concurrent Root Scan
-
Concurrent Mark
-
Remark (STW)
-
Cleanup (STW)
The Concurrent Root Scan is a concurrent phase that scans survivor regions of the Initial Mark for references to the old generation. This phase must complete before the next young GC can start. In the Remark phase, the marking cycle is completed. This phase also performs reference processing (including weak and soft references) and handles cleanup relating to implementing the SATB approach.
Cleanup is mostly STW, and comprises accounting and RSet “scrubbing.” The accounting task identifies regions that are now completely free and ready to be reused (e.g., as Eden regions).
Basic JVM Flags for G1
The switch that you need to enable G1 (in Java 8 and before) is:
+XX:UseG1GC
Recall that G1 is based around pause goals. These allow the developer to specify the desired maximum amount of time that the application should pause on each garbage collection cycle. This is expressed as a goal, and there is no guarantee that the application will be able to meet it. If this value is set too low, then the GC subsystem will be unable to meet the goal.
Note
Garbage collection is driven by allocation, which can be highly unpredictable for many Java applications. This can limit or destroy G1’s ability to meet pause goals.
The switch that controls the core behavior of the collector is:
-XX:MaxGCPauseMillis=200
This means that the default pause time goal is 200 ms. In practice, pause times under 100 ms are very hard to achieve reliably, and such goals may not be met by the collector. One other option that may also be of use is the option of changing the region size, overriding the default algorithm:
-XX:G1HeapRegionSize=<n>
Note that <n> must be a power of 2, between 1 and 64, and indicates a value in MB. We will meet other G1 flags when we discuss tuning G1 in Chapter 8.
Overall, G1 is stable as an algorithm and is fully supported by Oracle (and recommended as of 8u40). For truly low-latency workloads it is still not as low-pause as CMS for most workloads, and it is unclear whether it will ever be able to challenge a collector like CMS on pure pause time; however, the collector is still improving and is the focus of Oracle’s GC engineering efforts within the JVM team.
Shenandoah
As well as the Oracle-led effort to produce a next-generation, general-purpose collector, Red Hat has been working on its own collector, called Shenandoah, within the OpenJDK project. This is still an experimental collector and not ready for production use at the time of writing. However, it shows some promising characteristics and deserves at least an introduction.
Like G1, the aim of Shenandoah is to bring down pause times (especially on large heaps). Shenandoah’s approach to this is to perform concurrent compaction. The resulting phases of collection in Shenandoah are:
-
Initial Mark (STW)
-
Concurrent Marking
-
Final Marking (STW)
-
Concurrent Compaction
These phases may initially seem similar to those seen in CMS and G1, and some similar approaches (e.g., SATB) are used by Shenandoah. However, there are some fundamental differences.
One of the most striking and important aspects of Shenandoah is its use of a Brooks pointer.3 This technique uses an additional word of memory per object to indicate whether the object has been relocated during a previous phase of garbage collection and to give the location of the new version of the object’s contents.
The resulting heap layout used by Shenandoah for its oops can be seen in Figure 7-7. This mechanism is sometimes called a “forwarding pointer” approach. If the object has not been relocated, then the Brooks pointer simply points at the next word of memory.
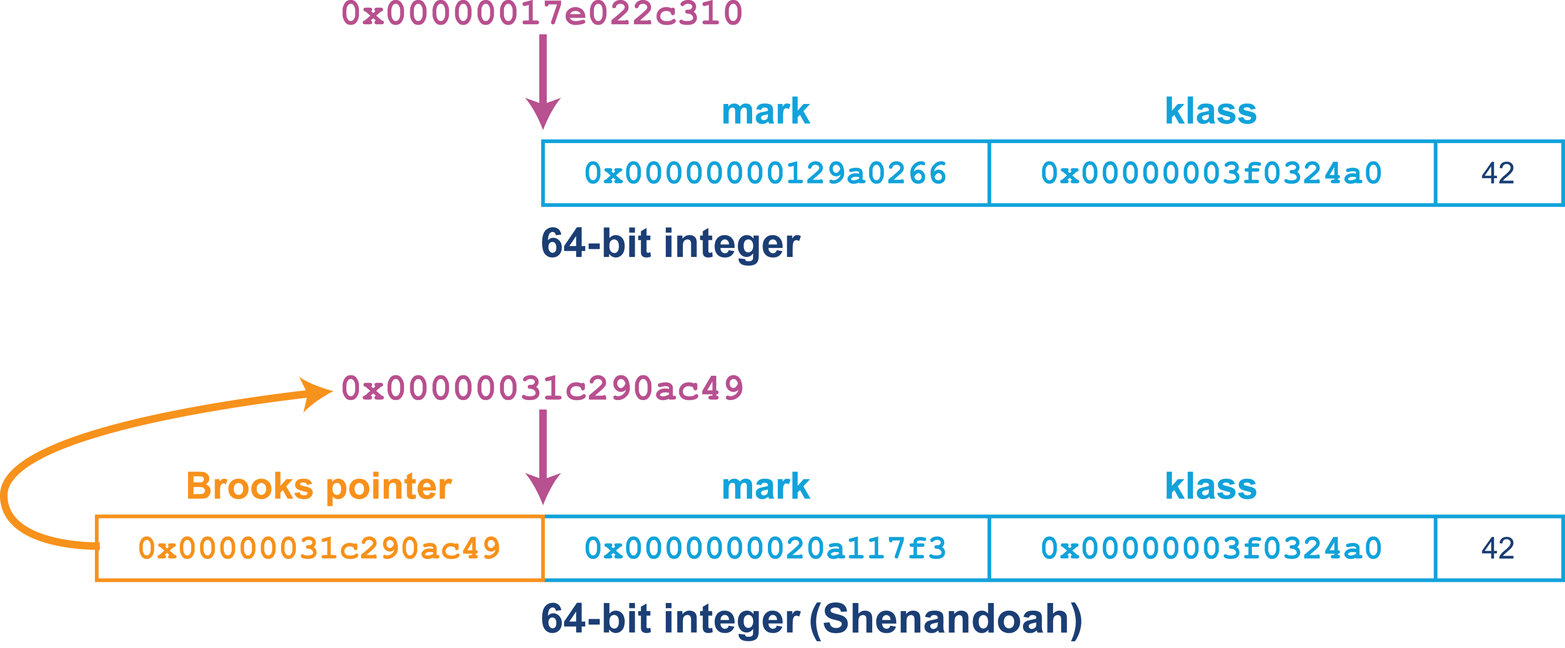
Figure 7-7. The Brooks pointer
Note
The Brooks pointer mechanism relies upon the availability of hardware compare-and-swap (CAS) operations to provide atomic updates of the forwarding address.
The Concurrent Marking phase traces through the heap and marks any live objects. If an object reference points to an oop that has a forwarding pointer, then the reference is updated to point directly at the new oop location. This can be seen in Figure 7-8.

Figure 7-8. Updating the forwarding pointer
In the Final Marking phase, Shenandoah stops the world to rescan the root set, then copy and update roots to point to the evacuated copies.
Concurrent Compaction
The GC threads (which are running concurrently with app threads) now perform evacuation as follows:
-
Copy the object into a TLAB (speculatively).
-
Use a CAS operation to update the Brooks pointer to point at the speculative copy.
-
If this succeeds, then the compaction thread won the race, and all future accesses to this version of the object will be via the Brooks pointer.
-
If it fails, the compaction thread lost. It undoes the speculative copy, and follows the Brooks pointer left by the winning thread.
As Shenandoah is a concurrent collector, while a collection cycle is running, more garbage is being created by the application threads. Therefore, over an application run, collection has to keep up with allocation.
Obtaining Shenandoah
The Shenandoah collector is not currently available as part of a shipping Oracle Java build, or in most OpenJDK distributions. It is shipped as part of the IcedTea binaries in some Linux distros, including Red Hat Fedora.
For other users, compilation from source will be necessary (at the time of writing). This is straightforward on Linux, but may be less so on other operating systems, due to differences in compilers (macOS uses clang rather than gcc, for example) and other aspects of the operating environment.
Once a working build has been obtained, Shenandoah can be activated with this switch:
-XX:+UseShenandoahGC
A comparison of Shenandoah’s pause times as compared to other collectors can be seen in Figure 7-9.
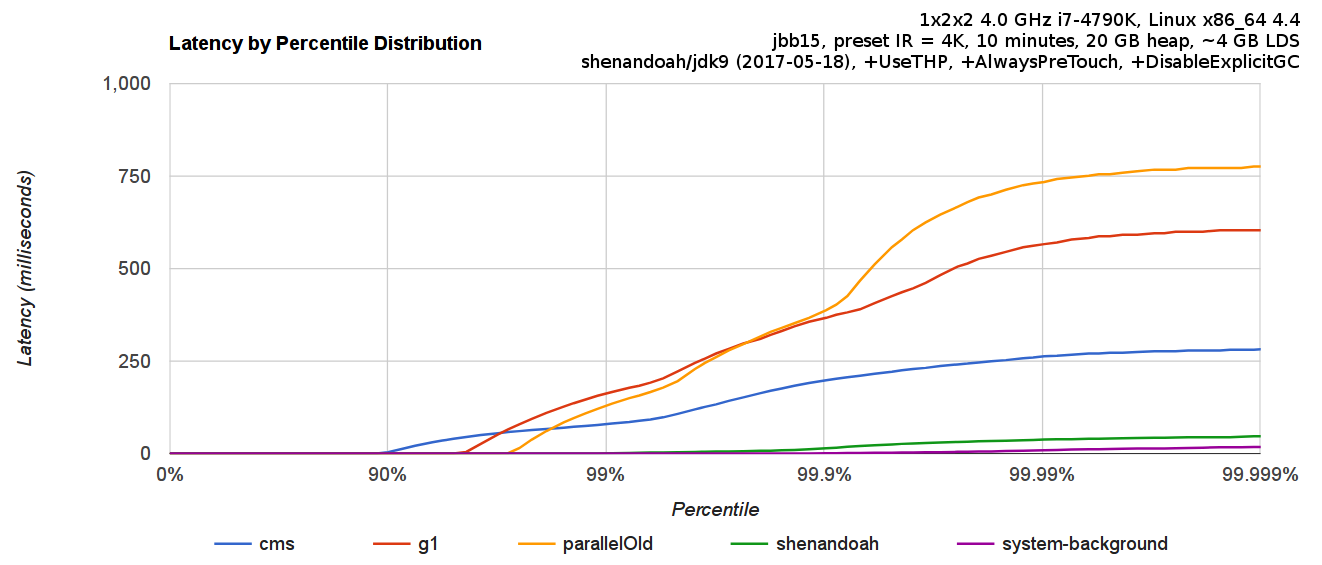
Figure 7-9. Shenandoah compared to other collectors (Shipilëv)
One aspect of Shenandoah that is underappreciated is that it is not a generational collector. As it moves closer to being a production-capable collector, the consequences of this design decision will become clearer, but this is a potential source of concern for performance-sensitive applications.
C4 (Azul Zing)
Azul Systems produces two different Java platform offerings. One of them, Zulu, is an OpenJDK-based FOSS solution available for multiple platforms. The other is Zing, which is a commercial and proprietary platform available for Linux only. It uses a version of the Java class libraries derived from OpenJDK (albeit under an Oracle proprietary license), but a completely different virtual machine.
Note
One important aspect of Zing is that it was designed for 64-bit machines from the start, and never had any intention of supporting 32-bit architectures.
The Zing VM contains several novel software technologies, including the C4 (Continuously Concurrent Compacting Collector) garbage collector and some novel JIT technology, including ReadyNow and a compiler called Falcon.
Like Shenandoah, Zing uses a concurrent compaction algorithm, but it does not utilize a Brooks pointer. Instead, Zing’s object header is a single 64-bit word (rather than the two-word header that HotSpot uses). The single header word contains a kid, which is a numeric klass ID (around 25 bits long) rather than a klass pointer.
In Figure 7-10 we can see the Zing object header, including the use of some of the oop reference bits for the loaded value barrier (LVB) rather than as address bits.
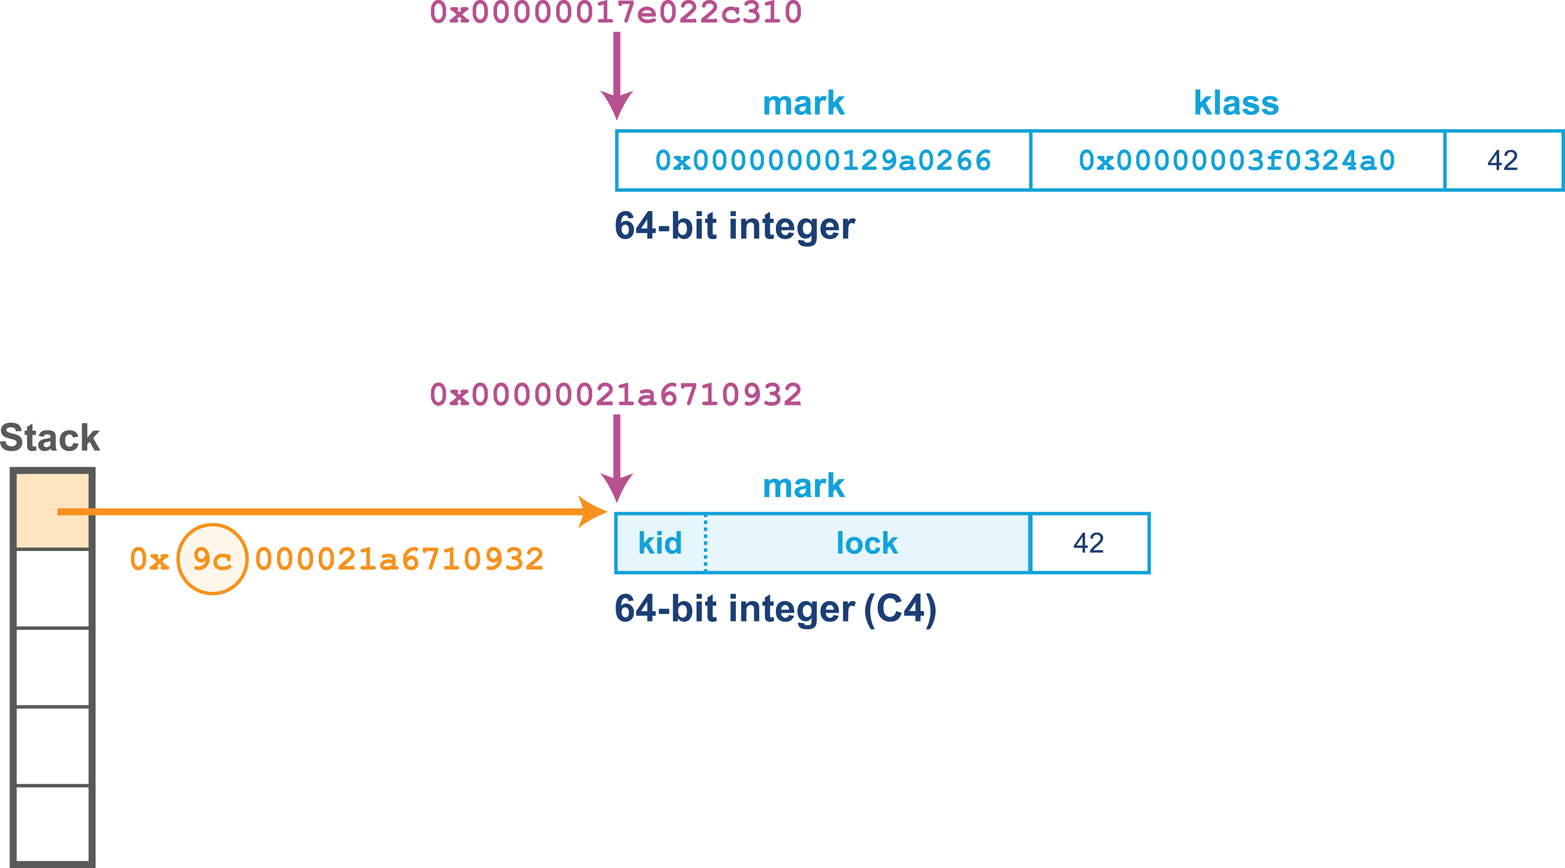
Figure 7-10. Object header layout in Zing
The bottom 32 bits of the header word are used for lock information. This includes the lock state, but also additional information depending on the state of the lock. For example, in the case of a thin lock this will be the owning thread ID for thin locks. See “Building Concurrency Libraries” for more details about thin locks.
Note
Zing does not support compressed oops or an equivalent technology, so for heaps smaller than ~30 GB the object headers are larger and will take up more space in the heap than in the equivalent HotSpot heap.
The design choice of implementing only on 64-bit architectures meant that Zing’s metadata never needed to fit into 32 bits (or to allocate extended structures to be addressed via pointer indirection), thereby avoiding some of the pointer gymnastics present in 32-bit HotSpot.
The Loaded Value Barrier
In the Shenandoah collector, application threads can load references to objects that might have been relocated, and the Brooks pointer is used to keep track of their new location. The central idea of the LVB is to avoid this pattern, and instead provide a solution where every loaded reference is pointing directly at the current location of the object as soon as the load has completed. Azul refers to this as a self-healing barrier.
If Zing follows a reference to an object that has been relocated by the collector, then before doing anything else, the application thread updates the reference to the new location of the object, thus “healing” the cause of the relocation problem. This means that each reference is updated at most once, and if the reference is never used again, no work is done to keep it up to date.
As well as the header word, Zing’s object references (e.g., from a local variable located on the stack to the object stored on the heap) use some of the bits of the reference to indicate metadata about the GC state of the object. This saves some space by using bits of the reference itself, rather than bits of the single header word.
Zing defines a Reference structure, which is laid out like this:
struct Reference {
    unsigned inPageVA : 21;     // bits 0-20
    unsigned PageNumber: 21;    // bits 21-41
    unsigned NMT : 1;           // bit 42
    unsigned SpaceID : 2;       // bits 43-44
    unsigned unused : 19;       // bits 45-63
};

int Expected_NMT_Value[4] = {0, 0, 0, 0};

// Space ID values:
// 00 NULL and non-heap pointers
// 01 Old Generation references
// 10 New Generation references
// 11 Unused
The NMT (Not Marked Through) metadata bit is used to indicate whether the object has already been marked in the current collection cycle. C4 maintains a target state that live objects should be marked as, and when an object is located during the mark, the NMT bit is set so that it is equal to the target state. At the end of the collection cycle, C4 flips the target state bit, so now all surviving objects are ready for the next cycle.
The overall phases of the GC cycle in C4 are:
-
Mark
-
Relocate
-
Remap
The Relocation phase, like with G1, will focus on the sparsest from-pages. This is to be expected, given that C4 is an evacuating collector.
C4 uses a technique called hand-over-hand compaction to provide continuous compaction. This relies upon a feature of the virtual memory system—the disconnect between physical and virtual addresses. In normal operation, the virtual memory subsystem maintains a mapping between a virtual page in the process address space and an underlying physical page.
Note
Unlike HotSpot, which does not use system calls to manage Java heap memory, Zing does make use of calls into the kernel as part of its GC cycle.
With Zing’s evacuation technique, objects are relocated by being copied to a different page, which naturally corresponds to a different physical address. Once all objects from a page have been copied, the physical page can be freed and returned to the operating system. There will still be application references that point into this now-unmapped virtual page. However, the LVB will take care of such references and will fix them before a memory fault occurs.
Zing’s C4 collector runs two collection algorithms at all times, one for young and one for old objects. This obviously has an overhead, but as we will examine in Chapter 8, when tuning a concurrent collector (such as CMS) it is useful for overhead and capacity planning reasons to assume that the collector may be in back-to-back mode when running. This is not so different from the continuously running mode that C4 exhibits.
Ultimately, the performance engineer should examine the benefits and tradeoffs of moving to Zing and the C4 collector carefully. The “measure, don’t guess” philosophy applies to the choice of VM as much as it does anywhere else.
Balanced (IBM J9)
IBM produces a JVM called J9. This has historically been a proprietary JVM, but IBM is now in the process of open-sourcing it and renaming it Open J9. The VM has several different collectors that can be switched on, including a high-throughput collector similar to the parallel collector HotSpot defaults to.
In this section, however, we will discuss the Balanced GC collector. It is a region-based collector available on 64-bit J9 JVMs and designed for heaps in excess of 4 GB. Its primary design goals are to:
-
Improve scaling of pause times on large Java heaps.
-
Minimize worst-case pause times.
-
Utilize awareness of non-uniform memory access (NUMA) performance.
To achieve the first goal, the heap is split into a number of regions, which are managed and collected independently. Like G1, the Balanced collector wants to manage at most 2,048 regions, and so will choose a region size to achieve this. The region size is a power of 2, as for G1, but Balanced will permit regions as small as 512 KB.
As we would expect from a generational region-based collector, each region has an associated age, with age-zero regions (Eden) used for allocation of new objects. When the Eden space is full, a collection must be performed. The IBM term for this is a partial garbage collection (PGC).
A PGC is an STW operation that collects all Eden regions, and may additionally choose to collect regions with a higher age, if the collector determines that they are worth collecting. In this manner, PGCs are similar to G1’s mixed collections.
Note
Once a PGC is complete, the age of regions containing the surviving objects is increased by 1. These are sometimes referred to as generational regions.
Another benefit, as compared to other J9 GC policies, is that class unloading can be performed incrementally. Balanced can collect classloaders that are part of the current collection set during a PGC. This is in contrast to other J9 collectors, where classloaders could only be collected during a global collection.
One downside is that because a PGC only has visibility of the regions it has chosen to collect, this type of collection can suffer from floating garbage. To resolve this problem, Balanced employs a global mark phase (GMP). This is a partially concurrent operation that scans the entire Java heap, marking dead objects for collection. Once a GMP completes, the following PGC acts on this data. Thus, the amount of floating garbage in the heap is bounded by the number of objects that died since the last GMP started.
The final type of GC operation that Balanced carried out is global garbage collection (GGC). This is a full STW collection that compacts the heap. It is similar to the full collections that would be triggered in HotSpot by a concurrent mode failure.
J9 Object Headers
The basic J9 object header is a class slot, the size of which is 64 bits, or 32 bits when Compressed References is enabled.
Note
Compressed References is the default for heaps smaller than 57 GB and is similar to HotSpot’s compressed oops technique.
However, the header may have additional slots depending on the type of object:
-
Synchronized objects will have monitor slots.
-
Objects put into internal JVM structures will have hashed slots.
In addition, the monitor and hashed slots are not necessarily adjacent to the object header—they may be stored anywhere in the object, taking advantage of otherwise wasted space due to alignment. J9’s object layout can be seen in Figure 7-11.
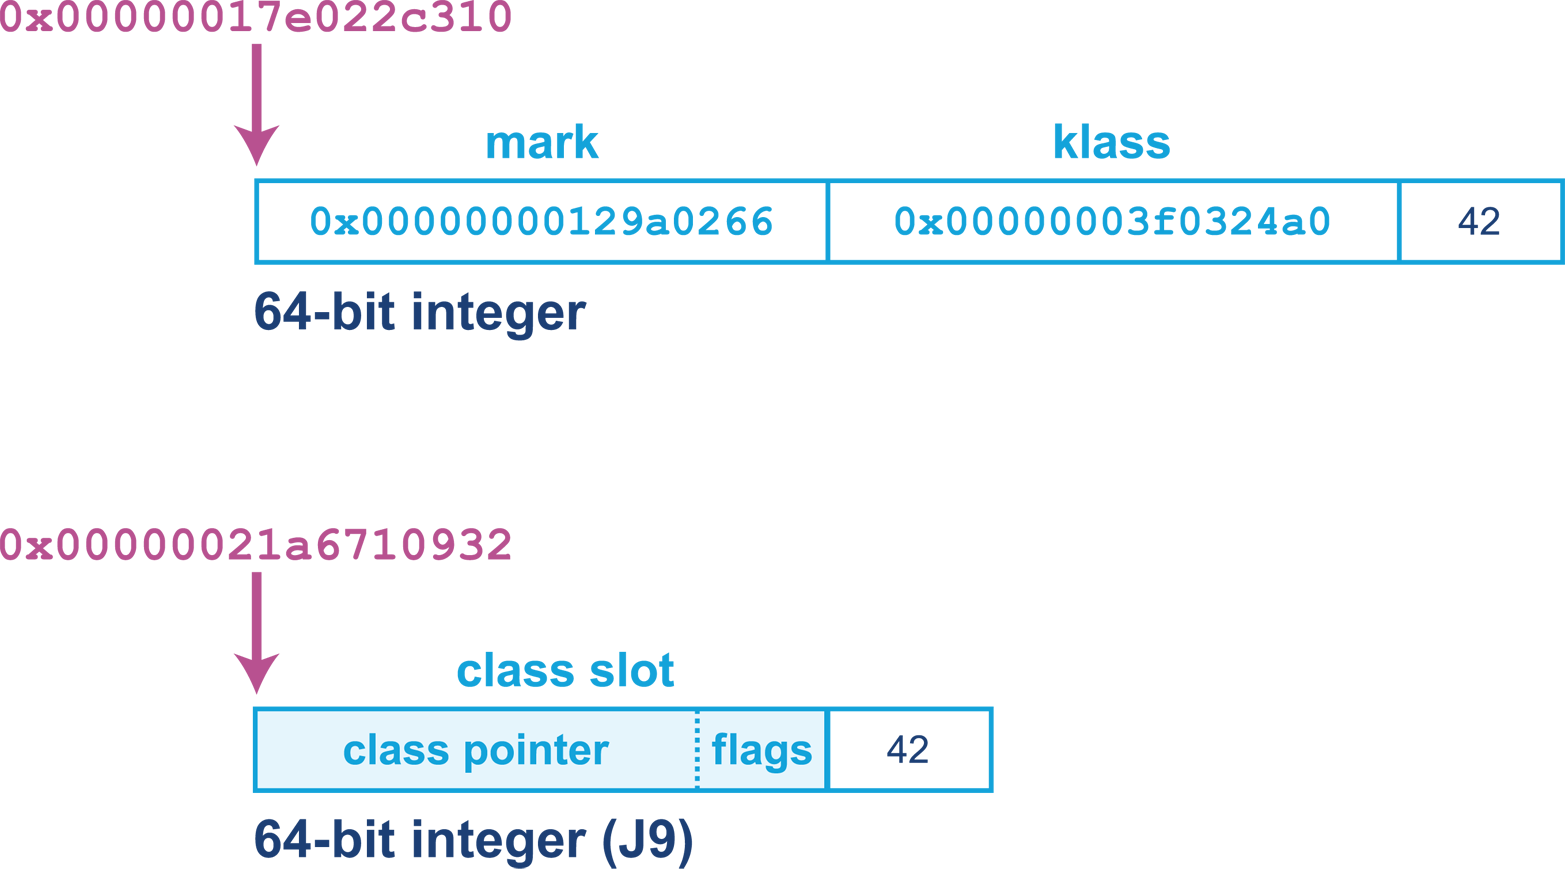
Figure 7-11. J9 object layout
The highest 24 (or 56) bits of the class slot are a pointer to the class structure, which is off-heap, similarly to Java 8’s Metaspace. The lower 8 bits are flags that are used for various purposes depending on the GC policy in use.
Large Arrays in Balanced
Allocating large arrays in Java is a common trigger for compacting collections, as enough contiguous space must be found to satisfy the allocation. We saw one aspect of this in the discussion of CMS, where free list coalescing is sometimes insufficient to free up enough space for a large allocation, and a concurrent mode failure results.
For a region-based collector, it is entirely possible to allocate an array object in Java that exceeds the size of a single region. To address this, Balanced uses an alternate representation for large arrays that allows them to be allocated in discontiguous chunks. This representation is known as arraylets, and this is the only circumstance under which heap objects can span regions.
The arraylet representation is invisible to user Java code, and instead is handled transparently by the JVM. The allocator will represent a large array as a central object, called the spine, and a set of array leaves that contain the actual entries of the array and which are pointed to by entries of the spine. This enables entries to be read with only the additional overhead of a single indirection. An example can be seen in Figure 7-12.
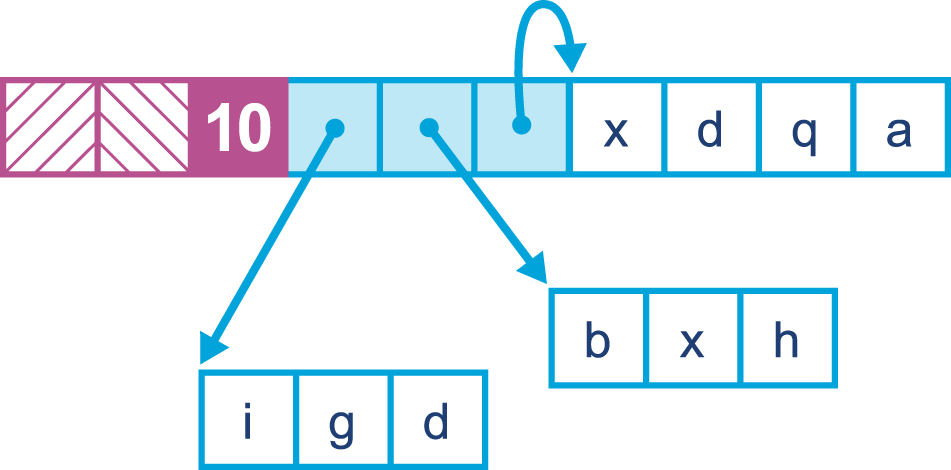
Figure 7-12. Arraylets in J9
Note
The arraylet representation is potentially visible through JNI APIs (although not from regular Java), so the programmer should be aware that when porting JNI code from another JVM, the spine and leaf representation may need to be taken into account.
Performing partial GCs on regions reduces average pause time, although overall time spent performing GC operations may be higher due to the overhead of maintaining information about the regions of a referrer and referent.
Crucially, the likelihood of requiring a global STW collection or compaction (the worst case for pause times) is greatly reduced, with this typically occurring as a last resort when the heap is full.
There is an overhead to managing regions and discontiguous large arrays, and thus, Balanced is suited to applications where avoiding large pauses is more important than outright throughput.
NUMA and Balanced
Non-uniform memory access is a memory architecture used in multiprocessor systems, typically medium to large servers. Such a system involves a concept of distance between memory and a processor, with processors and memory arranged into nodes. A processor on a given node may access memory from any node, but access time is significantly faster for local memory (that is, memory belonging to the same node).
For JVMs that are executing across multiple NUMA nodes, the Balanced collector can split the Java heap across them. Application threads are arranged such that they favor execution on a particular node, and object allocations favor regions in memory local to that node. A schematic view of this arrangement can be seen in Figure 7-13.
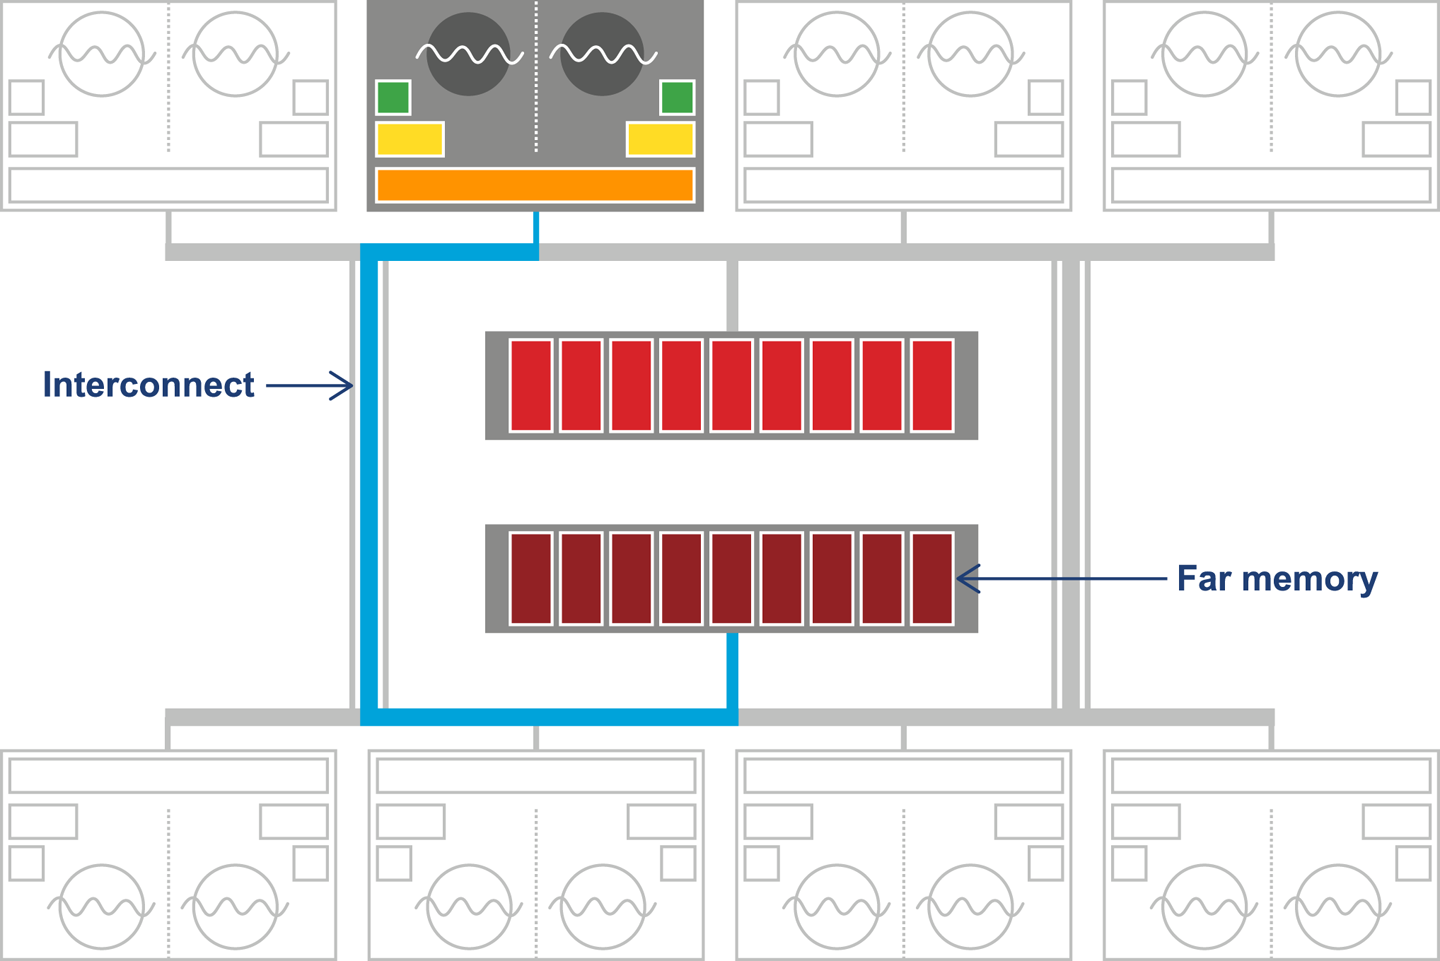
Figure 7-13. Non-uniform memory access
In addition, a partial garbage collection will attempt to move objects closer (in terms of memory distance) to the objects and threads that refer to them. This means the memory referenced by a thread is more likely to be local, improving performance. This process is invisible to the application.
Legacy HotSpot Collectors
In earlier versions of HotSpot, various other collectors were available. We mention them for completeness here, but none of them are recommended for production use anymore, and several combinations were deprecated in Java 8 and have been disallowed (or removed) as of Java 9.
Serial and SerialOld
The Serial and SerialOld collectors operated in a similar fashion to the Parallel GC and ParallelOld collectors, with one important difference: they only used a single CPU core to perform GC. Despite this, they were not concurrent collectors and were still fully STW. On modern multicore systems there is, of course, no possible performance benefit from using these collectors, and so they should not be used.
As a performance engineer, you should be aware of these collectors and their activation switches simply to ensure that if you ever encounter an application that sets them, you can recognize and remove them.
These collectors were deprecated as part of Java 8, so they will only ever be encountered on earlier legacy applications that are still using very old versions of Java.
Incremental CMS (iCMS)
The incremental CMS collector, normally referred to as iCMS, was an older attempt to do concurrent collection that tried to introduce into CMS some of the ideas that would later result in G1. The switch to enable this mode of CMS was:
-XX:+CMSIncrementalMode
Some experts still maintain that corner cases exist (for applications deployed on very old hardware with only one or two cores) where iCMS can be a valid choice from a performance point of view. However, virtually all modern server-class applications should not use iCMS and it was removed in Java 9.
Warning
Unless extraordinary evidence exists that your workload will benefit from incremental mode, you should not use it, due to the safepointing behavior and other negatives.
Deprecated and Removed GC Combinations
The current usual cadence of deprecation and removal is that features are marked as deprecated in one Java version and then removed in the next version, or subsequently. Accordingly, in Java 8, the GC flag combinations in Table 7-1 were marked as deprecated, and were removed in Java 9.
| Combination | Flags |
|---|---|
DefNew + CMS |
|
ParNew + SerialOld |
|
ParNew + iCMS |
|
ParNew + iCMS |
|
DefNew + iCMS |
|
CMS foreground |
|
CMS foreground |
|
CMS foreground |
|
You should consult this table when starting a new engagement, in order to confirm at the start that the application to be tuned is not using a deprecated configuration.
Epsilon
The Epsilon collector is not a legacy collector. However, it is included here because it must not be used in production under any circumstances. While the other collectors, if encountered within your environment, should be immediately flagged as extremely high-risk and marked for immediate removal, Epsilon is slightly different.
Epsilon is an experimental collector designed for testing purposes only. It is a zero-effort collector. This means it makes no effort to actually collect any garbage. Every byte of heap memory that is allocated while running under Epsilon is effectively a memory leak. It cannot be reclaimed and will eventually cause the JVM (probably very quickly) to run out of memory and crash.
Develop a GC that only handles memory allocation, but does not implement any actual memory reclamation mechanism. Once available Java heap is exhausted, perform the orderly JVM shutdown.
Epsilon JEP
Such a “collector” would be very useful for the following purposes:
-
Performance testing and microbenchmarks
-
Regression testing
-
Testing low/zero-allocation Java application or library code
In particular, JMH tests would benefit from the ability to confidently exclude any GC events from disrupting performance numbers. Memory allocation regression tests, ensuring that changed code does not greatly alter allocation behavior, would also become easy to do. Developers could write tests that run with an Epsilon configuration that accepts only a bounded number of allocations, and then fails on any further allocation due to heap exhaustion.
Finally, the proposed VM-GC interface would also benefit from having Epsilon as a minimal test case for the interface itself.
Summary
Garbage collection is a truly fundamental aspect of Java performance analysis and tuning. Java’s rich landscape of garbage collectors is a great strength of the platform, but it can be intimidating for the newcomer, especially given the scarcity of documentation that considers the tradeoffs and performance consequences of each choice.
In this chapter, we have outlined the decisions that face performance engineers, and the tradeoffs that they must make when deciding on an appropriate collector to use for their applications. We have discussed some of the underlying theory and met a range of modern GC algorithms that implement these ideas.
In the next chapter, we will put some of this theory to work and introduce logging, monitoring, and tooling as a way to bring some scientific rigor to our discussion of performance-tuning garbage collection.
1 Such a system is very difficult to program in, as every object that’s created has to be reused, and any object that goes out of scope effectively leaks memory.
2 Edsger Dijkstra, Leslie Lamport, A. J. Martin, C. S. Scholten, and E. F. M. Steffens, “On-the-Fly Garbage Collection: An Exercise in Cooperation,” Communications of the ACM 21 (1978): 966–975.
3 Rodney Brooks, “Trading Data Space for Reduced Time and Code Space in Real-Time Garbage Collection on Stock Hardware,” in LFP’84, Proceedings of the 1984 ACM Symposium on LISP and Functional Programming (New York: ACM, 1984), 256–262.