Table of Contents for
Optimizing Java
 Optimizing Java
Published by
O'Reilly Media, Inc., 2018
Optimizing Java
Published by
O'Reilly Media, Inc., 2018
- nav
- Cover
- Optimizing Java
- Optimizing Java
- Dedication
- Foreword
- Preface
- 1. Optimization and Performance Defined
- 2. Overview of the JVM
- 3. Hardware and Operating Systems
- 4. Performance Testing Patterns and Antipatterns
- 5. Microbenchmarking and Statistics
- 6. Understanding Garbage Collection
- 7. Advanced Garbage Collection
- 8. GC Logging, Monitoring, Tuning, and Tools
- 9. Code Execution on the JVM
- 10. Understanding JIT Compilation
- 11. Java Language Performance Techniques
- 12. Concurrent Performance Techniques
- 13. Profiling
- 14. High-Performance Logging and Messaging
- 15. Java 9 and the Future
- Index
- About the Authors
- Colophon
Chapter 2. Overview of the JVM
There is no doubt that Java is one of the largest technology platforms on the planet, boasting roughly 9–10 million developers (according to Oracle). By design, many developers do not need to know about the low-level intricacies of the platform they work with. This leads to a situation where developers only meet these aspects when a customer complains about performance for the first time.
For developers interested in performance, however, it is important to understand the basics of the JVM technology stack. Understanding JVM technology enables developers to write better software and provides the theoretical background required for investigating performance-related issues.
This chapter introduces how the JVM executes Java in order to provide a basis for deeper exploration of these topics later in the book. In particular, Chapter 9 has an in-depth treatment of bytecode. One strategy for the reader could be to read this chapter now, and then reread it in conjunction with Chapter 9, once some of the other topics have been understood.
Interpreting and Classloading
According to the specification that defines the Java Virtual Machine (usually called the VM Spec), the JVM is a stack-based interpreted machine. This means that rather than having registers (like a physical hardware CPU), it uses an execution stack of partial results and performs calculations by operating on the top value (or values) of that stack.
The basic behavior of the JVM interpreter can be thought of as essentially “a switch inside a while loop”—processing each opcode of the program independently of the last, using the evaluation stack to hold intermediate values.
Note
As we will see when we delve into the internals of the Oracle/OpenJDK VM (HotSpot), the situation for real production-grade Java interpreters can be more complex, but switch-inside-while is an acceptable mental model for the moment.
When we launch our application using the java HelloWorld command, the operating system starts the virtual machine process (the java binary). This sets up the Java virtual environment and initializes the stack machine that will actually execute the user code in the HelloWorld class file.
The entry point into the application will be the main() method of HelloWorld.class. In order to hand over control to this class, it must be loaded by the virtual machine before execution can begin.
To achieve this, the Java classloading mechanism is used. When a new Java process is initializing, a chain of classloaders is used. The initial loader is known as the Bootstrap classloader and contains classes in the core Java runtime. In versions of Java up to and including 8, these are loaded from rt.jar. In version 9 and later, the runtime has been modularised and the concepts of classloading are somewhat different.
The main point of the Bootstrap classloader is to get a minimal set of classes (which includes essentials such as java.lang.Object, Class, and Classloader) loaded to allow other classloaders to bring up the rest of the system.
Note
Java models classloaders as objects within its own runtime and type system, so there needs to be some way to bring an initial set of classes into existence. Otherwise, there would be a circularity problem in defining what a classloader is.
The Extension classloader is created next; it defines its parent to be the Bootstrap classloader and will delegate to its parent if needed. Extensions are not widely used, but can supply overrides and native code for specific operating systems and platforms. Notably, the Nashorn JavaScript runtime introduced in Java 8 is loaded by the Extension loader.
Finally, the Application classloader is created; it is responsible for loading in user classes from the defined classpath. Some texts unfortunately refer to this as the “System” classloader. This term should be avoided, for the simple reason that it doesn’t load the system classes (the Bootstrap classloader does). The Application classloader is encountered extremely frequently, and it has the Extension loader as its parent.
Java loads in dependencies on new classes when they are first encountered during the execution of the program. If a classloader fails to find a class, the behavior is usually to delegate the lookup to the parent. If the chain of lookups reaches the Bootstrap classloader and it isn’t found, a ClassNotFoundException will be thrown. It is important that developers use a build process that effectively compiles with the exact same classpath that will be used in production, as this helps to mitigate this potential issue.
Under normal circumstances Java only loads a class once and a Class object is created to represent the class in the runtime environment. However, it is important to realize that the same class can potentially be loaded twice by different classloaders. As a result, a class in the system is identified by the classloader used to load it as well as the fully qualified class name (which includes the package name).
Executing Bytecode
It is important to appreciate that Java source code goes through a significant number of transformations before execution. The first is the compilation step using the Java compiler javac, often invoked as part of a larger build process.
The job of javac is to convert Java code into .class files that contain bytecode. It achieves this by doing a fairly straightforward translation of the Java source code, as shown in Figure 2-1. Very few optimizations are done during compilation by javac, and the resulting bytecode is still quite readable and recognizable as Java code when viewed in a disassembly tool, such as the standard javap.
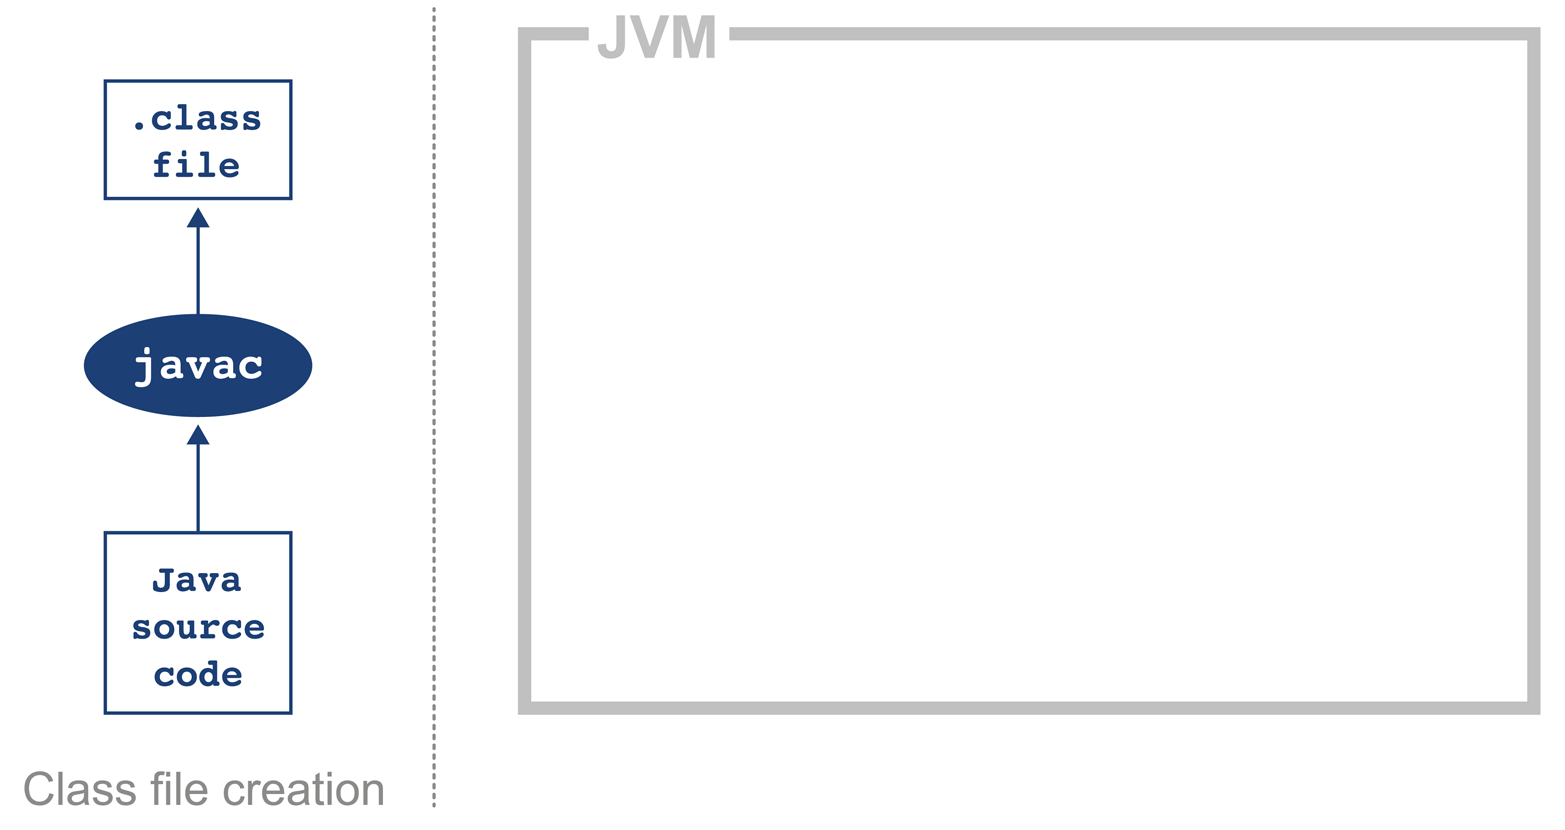
Figure 2-1. Java class file compilation
Bytecode is an intermediate representation that is not tied to a specific machine architecture. Decoupling from the machine architecture provides portability, meaning already developed (or compiled) software can run on any platform supported by the JVM and provides an abstraction from the Java language. This provides our first important insight into the way the JVM executes code.
Note
The Java language and the Java Virtual Machine are now to a degree independent, and so the J in JVM is potentially a little misleading, as the JVM can execute any JVM language that can produce a valid class file. In fact, Figure 2-1 could just as easily show the Scala compiler scalac generating bytecode for execution on the JVM.
Regardless of the source code compiler used, the resulting class file has a very well-defined structure specified by the VM specification (Table 2-1). Any class that is loaded by the JVM will be verified to conform to the expected format before being allowed to run.
| Component | Description |
|---|---|
Magic number |
|
Version of class file format |
The minor and major versions of the class file |
Constant pool |
The pool of constants for the class |
Access flags |
Whether the class is abstract, static, and so on |
This class |
The name of the current class |
Superclass |
The name of the superclass |
Interfaces |
Any interfaces in the class |
Fields |
Any fields in the class |
Methods |
Any methods in the class |
Attributes |
Any attributes of the class (e.g., name of the source file, etc.) |
Every class file starts with the magic number 0xCAFEBABE, the first 4 bytes in hexadecimal serving to denote conformance to the class file format. The following 4 bytes represent the minor and major versions used to compile the class file, and these are checked to ensure that the target JVM is not of a lower version than the one used to compile the class file. The major and minor version are checked by the classloader to ensure compatibility; if these are not compatible an UnsupportedClassVersionError will be thrown at runtime, indicating the runtime is a lower version than the compiled class file.
Note
Magic numbers provide a way for Unix environments to identify the type of a file (whereas Windows will typically use the file extension). For this reason, they are difficult to change once decided upon. Unfortunately, this means that Java is stuck using the rather embarrassing and sexist 0xCAFEBABE for the foreseeable future, although Java 9 introduces the magic number 0xCAFEDADA for module files.
The constant pool holds constant values in code: for example, names of classes, interfaces, and fields. When the JVM executes code, the constant pool table is used to refer to values rather than having to rely on the layout of memory at runtime.
Access flags are used to determine the modifiers applied to the class. The first part of the flag identifies general properties, such as whether a class is public, followed by whether it is final and cannot be subclassed. The flag also determines whether the class file represents an interface or an abstract class. The final part of the flag indicates whether the class file represents a synthetic class that is not present in source code, an annotation type, or an enum.
The this class, superclass, and interface entries are indexes into the constant pool to identify the type hierarchy belonging to the class. Fields and methods define a signature-like structure, including the modifiers that apply to the field or method. A set of attributes is then used to represent structured items for more complicated and non-fixed-size structures. For example, methods make use of the Code attribute to represent the bytecode associated with that particular method.
Figure 2-2 provides a mnemonic for remembering the structure.
Figure 2-2. Mnemonic for class file structure
In this very simple code example, it is possible to observe the effect of running javac:
publicclassHelloWorld{publicstaticvoidmain(String[]args){for(inti=0;i<10;i++){System.out.println("Hello World");}}}
Java ships with a class file disassembler called javap, allowing inspection of .class files. Taking the HelloWorld class file and running javap -c HelloWorld gives the following output:
publicclassHelloWorld{publicHelloWorld();Code:0:aload_01:invokespecial#1// Method java/lang/Object."<init>":()V4:returnpublicstaticvoidmain(java.lang.String[]);Code:0:iconst_01:istore_12:iload_13:bipush105:if_icmpge228:getstatic#2// Field java/lang/System.out ...11:ldc#3// String Hello World13:invokevirtual#4// Method java/io/PrintStream.println ...16:iinc1,119:goto222:return}
This layout describes the bytecode for the file HelloWorld.class. For more detail javap also has a -v option that provides the full class file header information and constant pool details. The class file contains two methods, although only the single main() method was supplied in the source file; this is the result of javac automatically adding a default constructor to the class.
The first instruction executed in the constructor is aload_0, which places the this reference onto the first position in the stack. The invokespecial command is then called, which invokes an instance method that has specific handling for calling superconstructors and creating objects. In the default constructor, the invoke matches the default constructor for Object, as an override was not supplied.
Note
Opcodes in the JVM are concise and represent the type, the operation, and the interaction between local variables, the constant pool, and the stack.
Moving on to the main() method, iconst_0 pushes the integer constant 0 onto the evaluation stack. istore_1 stores this constant value into the local variable at offset 1 (represented as i in the loop). Local variable offsets start at 0, but for instance methods, the 0th entry is always this. The variable at offset 1 is then loaded back onto the stack and the constant 10 is pushed for comparison using if_icmpge (“if integer compare greater or equal”). The test only succeeds if the current integer is >= 10.
For the first few iterations, this comparison test fails and so we continue to instruction 8. Here the static method from System.out is resolved, followed by the loading of the “Hello World” string from the constant pool. The next invoke, invokevirtual, invokes an instance method based on the class. The integer is then incremented and goto is called to loop back to instruction 2.
This process continues until the if_icmpge comparison eventually succeeds (when the loop variable is >= 10); on that iteration of the loop, control passes to instruction 22 and the method returns.
Introducing HotSpot
In April 1999 Sun introduced one of the biggest changes to Java in terms of performance. The HotSpot virtual machine is a key feature of Java that has evolved to enable performance that is comparable to (or better than) languages such as C and C++ (see Figure 2-3). To explain how this is possible, let’s delve a little deeper into the design of languages intended for application development.
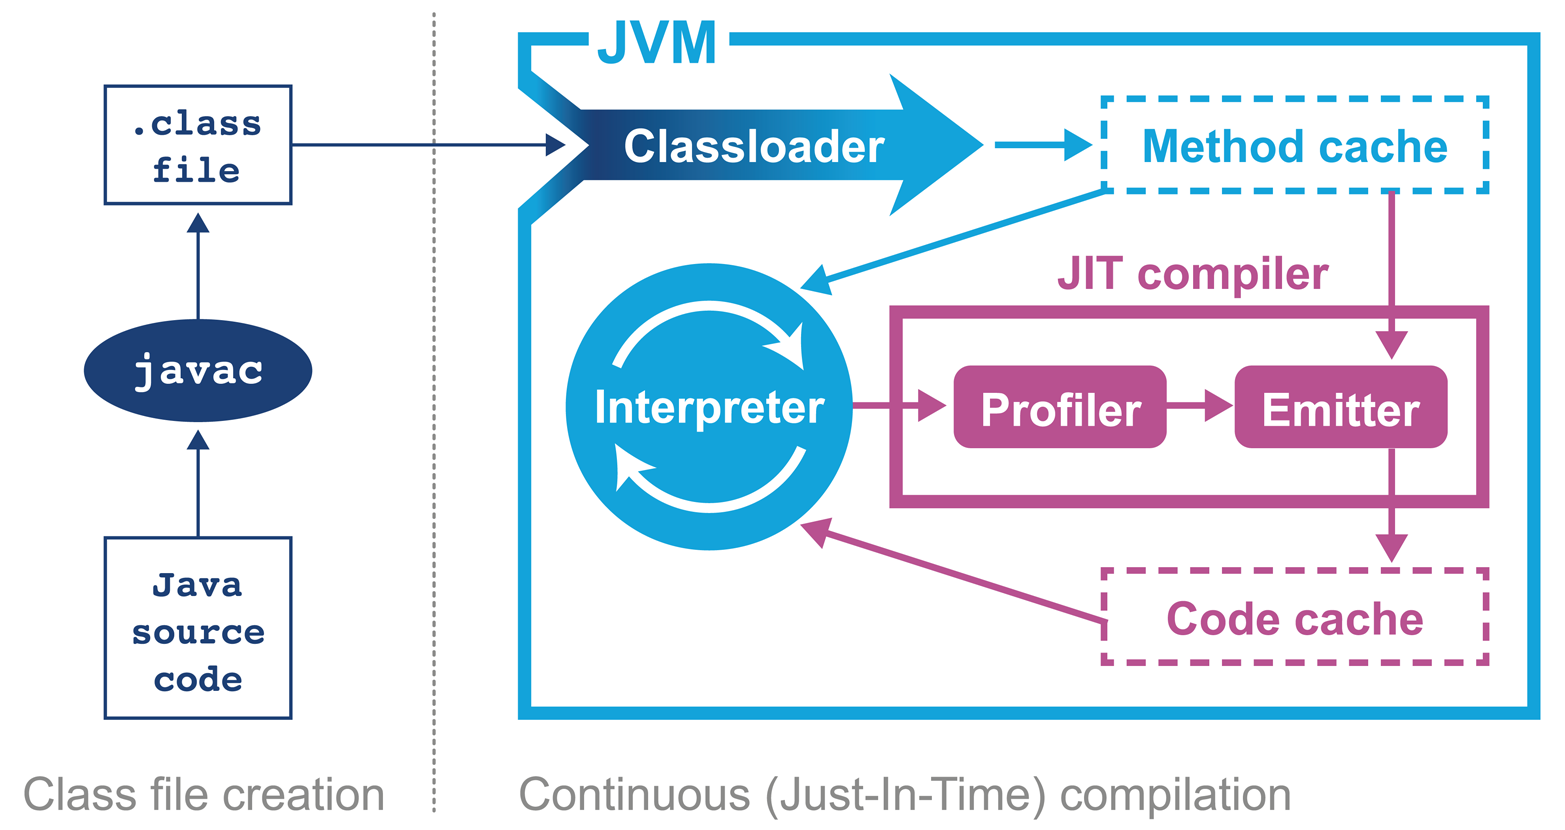
Figure 2-3. The HotSpot JVM
Language and platform design frequently involves making decisions and tradeoffs between desired capabilities. In this case, the division is between languages that stay “close to the metal” and rely on ideas such as “zero-cost abstractions,” and languages that favor developer productivity and “getting things done” over strict low-level control.
C++ implementations obey the zero-overhead principle: What you don’t use, you don’t pay for. And further: What you do use, you couldn’t hand code any better.
Bjarne Stroustrup
The zero-overhead principle sounds great in theory, but it requires all users of the language to deal with the low-level reality of how operating systems and computers actually work. This is a significant extra cognitive burden that is placed upon developers who may not care about raw performance as a primary goal.
Not only that, but it also requires the source code to be compiled to platform-specific machine code at build time—usually called Ahead-of-Time (AOT) compilation. This is because alternative execution models such as interpreters, virtual machines, and portablity layers all are most definitely not zero-overhead.
The principle also hides a can of worms in the phrase “what you do use, you couldn’t hand code any better.” This presupposes a number of things, not least that the developer is able to produce better code than an automated system. This is not a safe assumption at all. Very few people want to code in assembly language anymore, so the use of automated systems (such as compilers) to produce code is clearly of some benefit to most programmers.
Java has never subscribed to the zero-overhead abstraction philosophy. Instead, the approach taken by the HotSpot virtual machine is to analyze the runtime behavior of your program and intelligently apply optimizations where they will benefit performance the most. The goal of the HotSpot VM is to allow you to write idiomatic Java and follow good design principles rather then contort your program to fit the VM.
Introducing Just-in-Time Compilation
Java programs begin their execution in the bytecode interpreter, where instructions are performed on a virtualized stack machine. This abstraction from the CPU gives the benefit of class file portability, but to get maximum performance your program must execute directly on the CPU, making use of its native features.
HotSpot achieves this by compiling units of your program from interpreted bytecode into native code. The units of compilation in the HotSpot VM are the method and the loop. This is known as Just-in-Time (JIT) compilation.
JIT compilation works by monitoring the application while it is running in interpreted mode and observing the parts of code that are most frequently executed. During this analysis process, programmatic trace information is captured that allows for more sophisticated optimization. Once execution of a particular method passes a threshold, the profiler will look to compile and optimize that particular section of code.
There are many advantages to the JIT approach to compilation, but one of the main ones is that it bases compiler optimization decisions on trace information that is collected during the interpreted phase, enabling HotSpot to make more informed optimizations.
Not only that, but HotSpot has had hundreds of engineering years (or more) of development attributed to it and new optimizations and benefits are added with almost every new release. This means that any Java application that runs on top of a new release of HotSpot will be able to take advantage of new performance optimizations present in the VM, without even needing to be recompiled.
Tip
After being translated from Java source to bytecode and now going through another step of (JIT) compilation, the code actually being executed has changed very significantly from the source code as written. This is a key insight, and it will drive our approach to dealing with performance-related investigations. JIT-compiled code executing on the JVM may well look nothing like the original Java source code.
The general picture is that languages like C++ (and the up-and-coming Rust) tend to have more predictable performance, but at the cost of forcing a lot of low-level complexity onto the user.
Note that “more predictable” does not necessarily mean “better.” AOT compilers produce code that may have to run across a broad class of processors, and may not be able to assume that specific processor features are available.
Environments that use profile-guided optimization (PGO), such as Java, have the potential to use runtime information in ways that are simply impossible to most AOT platforms. This can offer improvements to performance, such as dynamic inlining and optimizing away virtual calls. HotSpot can even detect the precise CPU type it is running on at VM startup, and can use this information to enable optimizations designed for specific processor features if available.
Tip
The technique of detecting precise processor capabilities is known as JVM intrinsics, and is not to be confused with the intrinsic locks introduced by the synchronized keyword.
A full discussion of PGO and JIT compilation can be found in Chapters 9 and 10.
The sophisticated approach that HotSpot takes is a great benefit to the majority of ordinary developers, but this tradeoff (to abandon zero-overhead abstractions) means that in the specific case of high-performance Java applications, the developer must be very careful to avoid “common sense” reasoning and overly simplistic mental models of how Java applications actually execute.
Note
Analyzing the performance of small sections of Java code (microbenchmarks) is usually actually harder than analyzing entire applications, and is a very specialized task that the majority of developers should not undertake. We will return to this subject in Chapter 5.
HotSpot’s compilation subsystem is one of the two most important subsystems that the virtual machine provides. The other is automatic memory management, which was one of the major selling points of Java in the early years.
JVM Memory Management
In languages such as C, C++, and Objective-C the programmer is responsible for managing the allocation and release of memory. The benefits of managing memory and lifetime of objects yourself are more deterministic performance and the ability to tie resource lifetime to the creation and deletion of objects. But these benefits come at a huge cost—for correctness, developers must be able to accurately account for memory.
Unfortunately, decades of practical experience showed that many developers have a poor understanding of idioms and patterns for memory management. Later versions of C++ and Objective-C have improved this using smart pointer idioms in the standard library. However, at the time Java was created poor memory management was a major cause of application errors. This led to concern among developers and managers about the amount of time spent dealing with language features rather than delivering value for the business.
Java looked to help resolve the problem by introducing automatically managed heap memory using a process known as garbage collection (GC). Simply put, garbage collection is a nondeterministic process that triggers to recover and reuse no-longer-needed memory when the JVM requires more memory for allocation.
However, the story behind GC is not quite so simple, and various algorithms for garbage collection have been developed and applied over the course of Java’s history. GC comes at a cost: when it runs, it often stops the world, which means while GC is in progress the application pauses. Usually these pause times are designed to be incredibly small, but as an application is put under pressure they can increase.
Garbage collection is a major topic within Java performance optimization, so we will devote Chapters 6, 7, and 8 to the details of Java GC.
Threading and the Java Memory Model
One of the major advances that Java brought in with its first version was built-in support for multithreaded programming. The Java platform allows the developer to create new threads of execution. For example, in Java 8 syntax:
Threadt=newThread(()->{System.out.println("Hello World!");});t.start();
Not only that, but the Java environment is inherently multithreaded, as is the JVM. This produces additional, irreducible complexity in the behavior of Java programs, and makes the work of the performance analyst even harder.
In most mainstream JVM implementations, each Java application thread corresponds precisely to a dedicated operating system thread. The alternative, using a shared pool of threads to execute all Java application threads (an approach known as green threads), proved not to provide an acceptable performance profile and added needless complexity.
Note
It is safe to assume that every JVM application thread is backed by a unique OS thread that is created when the start() method is called on the corresponding Thread object.
Java’s approach to multithreading dates from the late 1990s and has these fundamental design principles:
-
All threads in a Java process share a single, common garbage-collected heap.
-
Any object created by one thread can be accessed by any other thread that has a reference to the object.
-
Objects are mutable by default; that is, the values held in object fields can be changed unless the programmer explicitly uses the
finalkeyword to mark them as immutable.
The Java Memory Model (JMM) is a formal model of memory that explains how different threads of execution see the changing values held in objects.
That is, if threads A and B both have references to object obj, and thread A alters it, what happens to the value observed in thread B?
This seemingly simple question is actually more complicated than it seems, because the operating system scheduler (which we will meet in Chapter 3) can forcibly evict threads from CPU cores. This can lead to another thread starting to execute and accessing an object before the original thread had finished processing it, and potentially seeing the object in a damaged or invalid state.
The only defense the core of Java provides against this potential object damage during concurrent code execution is the mutual exclusion lock, and this can be very complex to use in real applications. Chapter 12 contains a detailed look at how the JMM works, and the practicalities of working with threads and locks.
Meet the JVMs
Many developers may only be immediately familiar with the Java implementation produced by Oracle. We have already met the virtual machine that comes from the Oracle implementation, HotSpot. However, there are several other implementations that we will discuss in this book, to varying degrees of depth:
- OpenJDK
-
OpenJDK is an interesting special case. It is an open source (GPL) project that provides the reference implementation of Java. The project is led and supported by Oracle and provides the basis of its Java releases.
- Oracle
-
Oracle’s Java is the most widely known implementation. It is based on OpenJDK, but relicensed under Oracle’s proprietary license. Almost all changes to Oracle Java start off as commits to an OpenJDK public repository (with the exception of security fixes that have not yet been publicly disclosed).
- Zulu
-
Zulu is a free (GPL-licensed) OpenJDK implementation that is fully Java-certified and provided by Azul Systems. It is unencumbered by proprietary licenses and is freely redistributable. Azul is one of the few vendors to provide paid support for OpenJDK.
- IcedTea
-
Red Hat was the first non-Oracle vendor to produce a fully certified Java implementation based on OpenJDK. IcedTea is fully certified and redistributable.
- Zing
-
Zing is a high-performance proprietary JVM. It is a fully certified implementation of Java and is produced by Azul Systems. It is 64-bit Linux only, and is designed for server-class systems with large heaps (10s of 100s of GB) and a lot of CPU.
- J9
-
IBM’s J9 started life as a proprietary JVM but was open-sourced partway through its life (just like HotSpot). It is now built on top of an Eclipse open runtime project (OMR), and forms the basis of IBM’s proprietary product. It is fully compliant with Java certification.
- Avian
-
The Avian implementation is not 100% Java conformant in terms of certification. It is included in this list because it is an interesting open source project and a great learning tool for developers interested in understanding the details of how a JVM works, rather than as a 100% production-ready solution.
- Android
-
Google’s Android project is sometimes thought of as being “based on Java.” However, the picture is actually a little more complicated. Android originally used a different implementation of Java’s class libraries (from the clean-room Harmony project) and a cross compiler to convert to a different (.dex) file format for a non-JVM virtual machine.
Of these implementations, the great majority of the book focuses on HotSpot. This material applies equally to Oracle Java, Azul Zulu, Red Hat IcedTea, and all other OpenJDK-derived JVMs.
Note
There are essentially no performance-related differences between the various HotSpot-based implementations, when comparing like-for-like versions.
We also include some material related to IBM J9 and Azul Zing. This is intended to provide an awareness of these alternatives rather than a definitive guide. Some readers may wish to explore these technologies more deeply, and they are encouraged to proceed by setting performance goals, and then measuring and comparing, in the usual manner.
Android is moving to use the OpenJDK 8 class libraries with direct support in the Android runtime. As this technology stack is so far from the other examples, we won’t consider Android any further in this book.
A Note on Licenses
Almost all of the JVMs we will discuss are open source, and in fact, most of them are derived from the GPL-licensed HotSpot. The exceptions are IBM’s Open J9, which is Eclipse-licensed, and Azul Zing, which is commercial (although Azul’s Zulu product is GPL).
The situation with Oracle Java (as of Java 9) is slightly more complex. Despite being derived from the OpenJDK code base, it is proprietary, and is not open source software. Oracle achieves this by having all contributors to OpenJDK sign a license agreement that permits dual licensing of their contribution to both the GPL of OpenJDK and Oracle’s proprietary license.
Each update release to Oracle Java is taken as a branch off the OpenJDK mainline, which is not then patched on-branch for future releases. This prevents divergence of Oracle and OpenJDK, and accounts for the lack of meaningful difference between Oracle JDK and an OpenJDK binary based on the same source.
This means that the only real difference between Oracle JDK and OpenJDK is the license. This may seem an irrelevance, but the Oracle license contains a few clauses that developers should be aware of:
-
Oracle does not grant the right to redistribute its binaries outside of your own organization (e.g., as a Docker image).
-
You are not permitted to apply a binary patch to an Oracle binary without its agreement (which will usually mean a support contract).
There are also several other commercial features and tools that Oracle makes available that will only work with Oracle’s JDK, and within the terms of its license. This situation will be changing with future releases of Java from Oracle, however, as we will discuss in Chapter 15.
When planning a new greenfield deployment, developers and architects should consider carefully their choice of JVM vendor. Some large organizations, notably Twitter and Alibaba, even maintain their own private builds of OpenJDK, although the engineering effort required for this is beyond the reach of many companies.
Monitoring and Tooling for the JVM
The JVM is a mature execution platform, and it provides a number of technology alternatives for instrumentation, monitoring, and observability of running applications. The main technologies available for these types of tools for JVM applications are:
-
Java Management Extensions (JMX)
-
Java agents
-
The JVM Tool Interface (JVMTI)
-
The Serviceability Agent (SA)
JMX is a powerful, general-purpose technology for controlling and monitoring JVMs and the applications running on them. It provides the ability to change parameters and call methods in a general way from a client application. A full treatment is, unfortunately, outside the scope of this book. However, JMX (and its associated network transport, RMI) is a fundamental aspect of the management capabilities of the JVM.
A Java agent is a tooling component, written in Java (hence the name), that makes use of the interfaces in java.lang.instrument to modify the bytecode of methods.
To install an agent, provide a startup flag to the JVM:
-javaagent:<path-to-agent-jar>=<options>
The agent JAR must contain a manifest and include the attribute Premain-Class.
This attribute contains the name of the agent class, which must implement a public static premain() method that acts as the registration hook for the Java agent.
If the Java instrumentation API is not sufficient, then the JVMTI may be used instead. This is a native interface of the JVM, so agents that make use of it must be written in a native compiled language—essentially, C or C++. It can be thought of as a communication interface that allows a native agent to monitor and be informed of events by the JVM. To install a native agent, provide a slightly different flag:
-agentlib:<agent-lib-name>=<options>
or:
-agentpath:<path-to-agent>=<options>
The requirement that JVMTI agents be written in native code means that it is much easier to write code that can damage running applications and even crash the JVM.
Where possible, it is usually preferable to write a Java agent over JVMTI code. Agents are much easier to write, but some information is not available through the Java API, and to access that data JVMTI may be the only possibility available.
The final approach is the Serviceability Agent. This is a set of APIs and tools that can expose both Java objects and HotSpot data structures.
The SA does not require any code to be run in the target VM. Instead, the HotSpot SA uses primitives like symbol lookup and reading of process memory to implement debugging capability. The SA has the ability to debug live Java processes as well as core files (also called crash dump files).
VisualVM
The JDK ships with a number of useful additional tools along with the well-known binaries such as javac and java.
One tool that is often overlooked is VisualVM, which is a graphical tool based on the NetBeans platform.
Tip
jvisualvm is a replacement for the now obsolete jconsole tool from earlier Java versions.
If you are still using jconsole, you should move to VisualVM (there is a compatibility plug-in to allow jconsole plug-ins to run inside VisualVM).
Recent versions of Java have shipped solid versions of VisualVM, and the version present in the JDK is now usually sufficient.
However, if you need to use a more recent version, you can download the latest version from http://visualvm.java.net/.
After downloading, you will have to ensure that the visualvm binary is added to your path or you’ll get the JRE default binary.
Tip
From Java 9 onward, VisualVM is being removed from the main distribution, so developers will have to download the binary separately.
When VisualVM is started for the first time it will calibrate the machine it is running on, so there should be no other applications running that might affect the performance calibration. After calibration, VisualVM will finish starting up and show a splash screen. The most familiar view of VisualVM is the Monitor screen, which is similar to that shown in Figure 2-4.
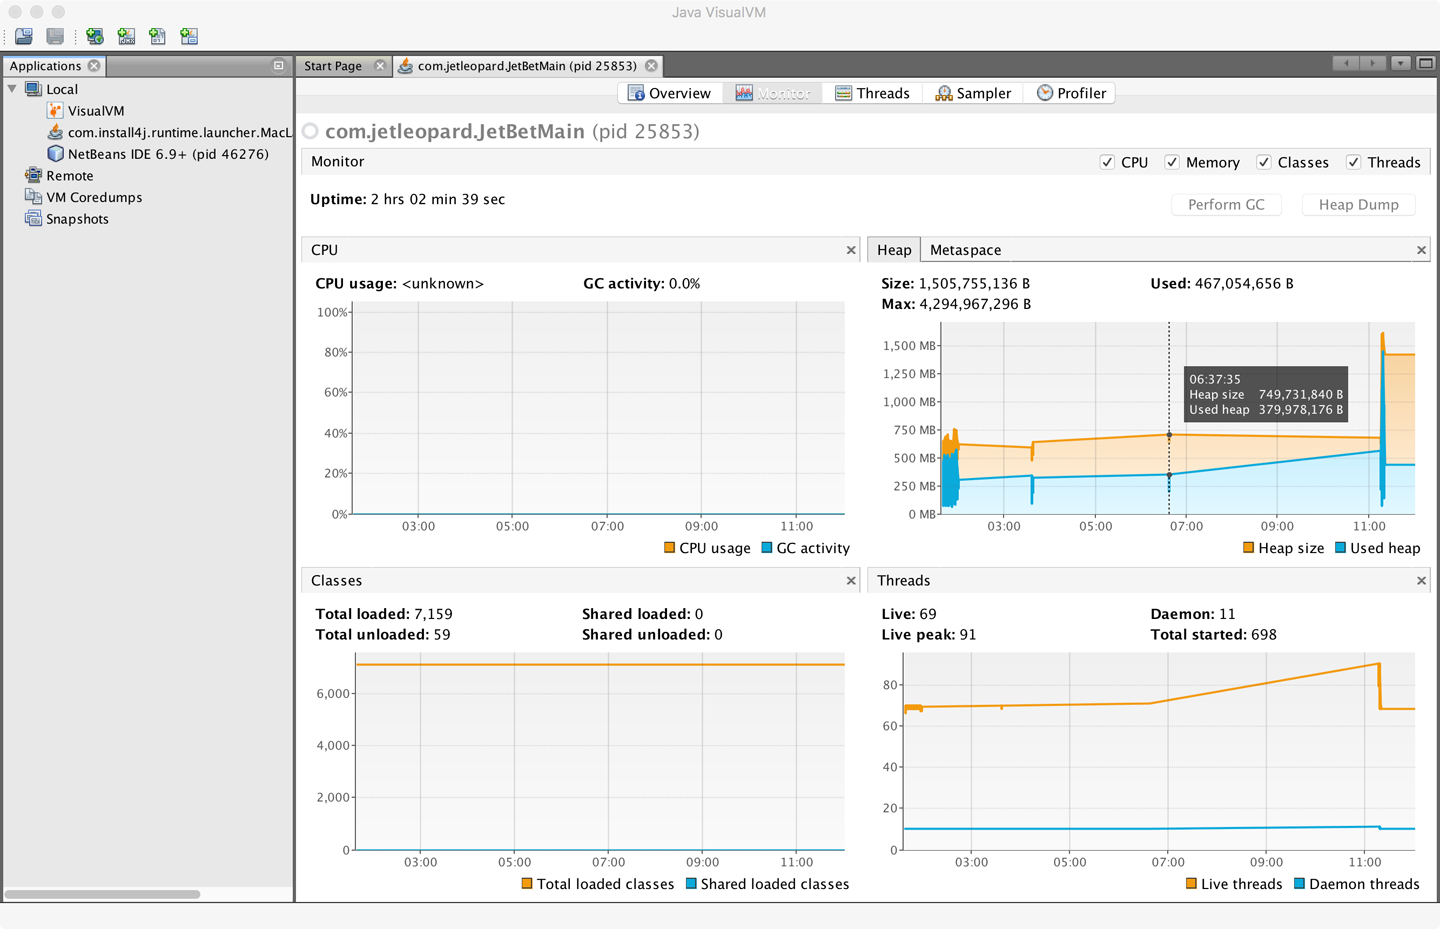
Figure 2-4. VisualVM Monitor screen
VisualVM is used for live monitoring of a running process, and it uses the JVM’s attach mechanism. This works slightly differently depending on whether the process is local or remote.
Local processes are fairly straightforward. VisualVM lists them down the lefthand side of the screen. Double-clicking on one of them causes it to appear as a new tab in the righthand pane.
To connect to a remote process, the remote side must accept inbound connections (over JMX). For standard Java processes, this means jstatd must be running on the remote host (see the manual page for jstatd for more details).
Note
Many application servers and execution containers provide an equivalent capability to jstatd directly in the server. Such processes do not need a separate jstatd process.
To connect to a remote process, enter the hostname and a display name that will be used on the tab. The default port to connect to is 1099, but this can be changed easily.
Out of the box, VisualVM presents the user with five tabs:
- Overview
-
Provides a summary of information about your Java process. This includes the full flags that were passed in and all system properties. It also displays the exact Java version executing.
- Monitor
-
This is the tab that is the most similar to the legacy JConsole view. It shows high-level telemetry for the JVM, including CPU and heap usage. It also shows the number of classes loaded and unloaded, and an overview of the numbers of threads running.
- Threads
-
Each thread in the running application is displayed with a timeline. This includes both application threads and VM threads. The state of each thread can be seen, with a small amount of history. Thread dumps can also be generated if needed.
- Sampler and Profiler
-
In these views, simplified sampling of CPU and memory utilization can be accessed. This will be discussed more fully in Chapter 13.
The plug-in architecture of VisualVM allows additional tools to be easily added to the core platform to augment the core functionality. These include plug-ins that allow interaction with JMX consoles and bridging to legacy JConsole, and a very useful garbage collection plug-in, VisualGC.
Summary
In this chapter we have taken a quick tour through the overall anatomy of the JVM. It has only been possible to touch on some of the most important subjects, and virtually every topic mentioned here has a rich, full story behind it that will reward further investigation.
In Chapter 3 we will discuss some details of how operating systems and hardware work. This is to provide necessary background for the Java performance analyst to understand observed results. We will also look at the timing subsystem in more detail, as a complete example of how the VM and native subsystems interact.