Table of Contents for
Node.js for Embedded Systems
 Node.js for Embedded Systems
Published by
O'Reilly Media, Inc., 2016
Node.js for Embedded Systems
Published by
O'Reilly Media, Inc., 2016
- Cover
- nav
- Node.js for Embedded Systems
- Node.js for Embedded Systems
- Foreword
- Preface
- 1. Connecting Worlds
- 2. Blink with Arduino
- 3. Espruino
- 4. The Tessel 2
- 5. Particle Photon
- 6. Single-Board Computers
- 7. Components for Prototyping
- 8. Node.js Libraries for Hardware
- 9. Exploring Network Protocols
- 10. Web Frontends for Things
- 11. Entering the Cloud
- 12. Making Robots with Node.js
- 13. Wireless Data with Bluetooth
- 14. Toward the Physical Internet
- 15. From Products to Toolkits
- A. Node.js
- B. Early Hardware for IoT Systems
- Index
- About the Authors
- Colophon
Chapter 10. Web Frontends for Things
Screens and displays are useful ways to give a device user direction and feedback. Some embedded devices operate “headless,” meaning without an attached display, which reduces the complexity and power requirements. Others build displays into the device design. Internet-connected and embedded devices can compromise: the device itself can be headless, but it can provide a display (and sometimes interactivity) on another Internet-connected device, such as a phone or computer. In this chapter, we’ll discuss building displays and interactions with embedded devices through web browsers.
Web browsers render documents in HTML. Combined with JavaScript, HTML increasingly allows humans to interact with hardware remotely over a physical link or a network.
With the newer HTML5 standard, browsers also support new ways of rendering graphics and video. When HTML was first conceived in 1989, computers were dealing mainly with textual documents. The modern landscape has evolved to meet the ever-expanding variety of digital media. This chapter discusses some new concepts and special libraries to handle graphics with JavaScript.
For many programmers, the first steps into browser and graphical programming start with jQuery, a popular library that we will briefly review in this chapter. From there, separation between application state and rendering logic is discussed. This is commonly called the model-view-controller (MVC) pattern, and you will find some variations in the JavaScript community.
The Processing library for JavaScript P5.js offers the opportunity for new abstractions within browser experiences. As an example, you’ll learn how graphics in a browser can be controlled by physical devices.
Adding Static Pages
In our discussion of network protocols in the previous chapter, most examples used the command line. While command-line user agents are great for development, users of devices generally prefer working with a web browser.
Web browsers render HTML documents that might contain information from embedded devices. Besides providing an output, web browsers can also capture user input with forms. In sum, serving HTML is an important task of web application development.
So far in this book, we have explored HTTP mainly to transport data to and from another machine. But HTTP can also transport “resources” that are interesting to users, such as text, pictures, or HTML. With HTML, you can provide forms, buttons, and other inputs to control the state of a device.
The easiest way to render an HTML page is as a “static page”: a page whose content is not generated through a script but rendered just as it is stored.
Let’s add ecstatic, a Node.js middleware that can filter requests for static content. In a fresh directory, initialize Node with:
$ npm init -y
Then install ecstatic with:
$ npm install --save ecstatic
Next, in a file called static/index.html, save the following HTML:
<html><head><title>testpage</title></head><body><formaction="/api/message"method="POST"><textareaname="message"></textarea><buttontype="submit">Update</button></form></body></html>
Based on the web server from Chapter 8, let’s add a route to serve all files from the static directory:
// static_server.jsvarecstatic=require('ecstatic');router.use(ecstatic({root:__dirname+'/static'}));
Now you can serve a page of static HTML! Before you point your browser to the route localhost:3000, you should add a route to handle the form submission:
varmessage='';functionupdateMessage(err,body){message=body.message;}varapi=Router();api.post('/message',function(req,res){formBody(req,{},updateMessage)res.writeHead(301,{Location:'/'});res.end();});router.use('/api',api);
To process the form, you must include a Node.js library to process data in the body of a form. In this example, the body module is used.
To see how everything works, you can now run the server:
$ node static_server.js
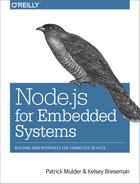
You should see something similar to Figure 10-1.
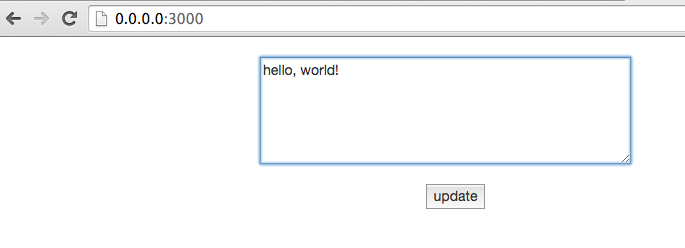
Figure 10-1. Update form
If you press the “update” button, the new message is sent back to the server. Once updated, the browser is redirected back to the form. With this web interface you can easily send commands to an embedded device. Static pages can be extended with JavaScript and jQuery to build interactive user interfaces. Let’s discuss some basics next.
Basic jQuery
Browsers are nice because they render HTML documents that can be styled and include graphics. However, with different browser vendors, there are different APIs used to support rendering and browser events.
To improve compatibility of JavaScript APIs across web browsers, John Resig started work on jQuery in 2005. jQuery makes it easier to work with JavaScript in the browser on a number of fronts: with jQuery, you can easily select “nodes” in a rendered HTML document. Then, jQuery simplifies working with events from these nodes. Finally, jQuery provides shims for graphical effects in older browsers too.
Let’s look at an example of a basic user interface that utilizes jQuery. When working on a frontend, the first thing you need is some basic HTML, from which you load JavaScript and stylesheets.
The basic user interface is provided by a static page. Here’s a basic index.html file to get started:
<html><head><metacharset="utf-8"><metahttp-equiv="X-UA-Compatible"content="IE=edge"><title>Blinking LED UI</title><style>body{font:50014px/21px'Helvetica Neue',Helvetica,Arials;padding:40px;}</style></head><body></body></html>
As a first example, let’s create a web page button that can be used to toggle a light:
<p>Toggle the light</p><buttonid="toggle">Toggle!</button>
Next, let’s add jQuery to the HTML:
<scriptsrc="https://cdnjs.cloudflare.com/ajax/libs/jquery/2.0.3/jquery.js"></script>
In a web browser, JavaScript is imported with <script> tags. You can either serve JavaScript directly from your server, or if libraries are common enough, you will find a version on a content delivery network (CDN). With a CDN, you can use an online version of a JavaScript library instead of a local download. This can save time but requires a stable internet connection.
Now, we need to attach an event handler that is executed when a user clicks:
$('#toggle').click(function(){toggleLight();});
Another way to deal with events is with the on(event, callback) idiom from earlier examples:
$('#toggle').on('click',function(e){toggleLight();})
The “on” syntax is common in JavaScript. You attach an “event handler” to an event. In this case, you observe “click” events from the button. When the event is fired, you will see an output in the developer console.
This toggleLight function can then make an Ajax request to the server:
varstate=0;functiontoggleLight(){state=!state;$.post('/LED','{"led": '+state+'}');}
If you now go to the web browser and type localhost:4000 into the address bar, you’ll see a web page similar to the one shown in Figure 10-2.
If everything works, you’ll now be able to switch LED 13 on and off.
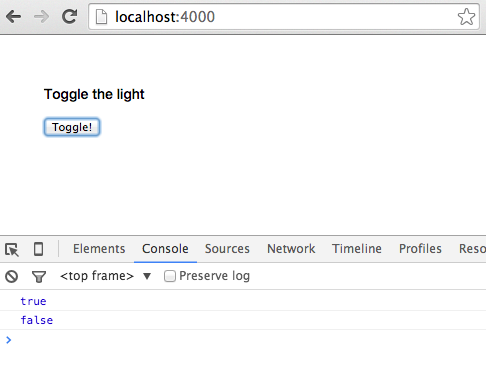
Figure 10-2. Toggle the button to turn the light on/off
When events like the click event happen, you want to update other places on a page. To prevent cumbersome code, we’ll next look at the model-view-controller (MVC) pattern. With the MVC pattern, you can easily “structure” events.
Adding the Model-View-Controller
The MVC is important only if you need to build more complicated user interfaces. You might want to skip this section and revisit it later if you prefer more artistic and experimental graphical setups at first.
In the previous example, the toggleLight function could grow quickly with user-facing features—for example, to make the click event update parts of the browser interface. For example, you might add code to the function to make the interface show if the LED is ON or OFF.
The MVC pattern was created to better structure user interfaces. In a nutshell, MVC is about separating abstract objects (i.e., “models”) and the way they are rendered (i.e., “views”). “Controllers” provide a bridge for communication between views and models.
MVC is used to build all kinds of software interfaces, from large painting programs on workstations up to calendars on mobile phones. Over the last few years, MVC has also captured many aspects of web applications and user interactions in web browsers.
Although there are a number of JavaScript libraries that solve the MVC problem in browsers, one of the simplest ones to use is Backbone.js by Jeremy Ashkenas. Similar to Arduino, there is a large ecosystem around Backbone.js that facilitates building large projects, too.
Here is an overview of view and model classes in Backbone:
Backbone.View-
A view renders things on a screen with a
render()function. Additionally, the view captures events from a user, such as mouse clicks or key presses.Backbone.Viewis usually bound to a model. If the model changes, the view re-renders. Backbone.Model-
An abstract data model that captures state changes of objects. For example, if an LED should toggle from ON to OFF, a
Backbone.Modelsends notifications to its observers (aBackbone.View, for example).
Now, to make the previous page interactive, you need to load the Backbone.js libraries and its dependencies jQuery and Underscore.js first. You add these dependencies in the static/index.html file. We will add the links to the CDNs for these dependencies just below our jQuery CDN link:
<scriptsrc="https://cdnjs.cloudflare.com/ajax/libs/jquery/2.0.3/jquery.js"></script><scriptsrc="https://cdnjs.cloudflare.com/ajax/libs/underscore.js/1.5.2/underscore-min.js"></script><scriptsrc="https://cdnjs.cloudflare.com/ajax/libs/backbone.js/1.1.0/backbone-min.js"></script>
While jQuery provides helpers to simplify the manipulation of a web page in the browser, Underscore.js fixes some weakenesses in the JavaScript language—for example, for iterating on collections or managing function scope.
Note
This tutorial doesn’t go into a lot of detail on the libraries we’re using, but we encourage you to check out the documentation and tutorials for those libraries in order to understand them better. The “Third-Party JavaScript” section of JavaScript for Cats (a beginner introduction to JavaScript) offers a good introduction to the idea of plugins, and to Underscore.js in particular.
To show how this works, let’s consider the following example. We’ll create a “brighter” button that lets users brighten up the light, and a “darker” button that will dim the LED. Additionally, we’ll render information about the state of the LED.
For this, you need two Backbone.Views—one view for the controls and one view for the status information:
varControlsView=Backbone.View.extend({template:_.template('\<button id="darken">darken</button> \<button id="brighten">brighten</button> \'),events:{'click #brighten':'handleBright','click #darken':'handleDarken'},handleBright:function(){this.model.brighten();},handleDarken:function(){this.model.darken();},render:function(){this.$el.html(this.template());returnthis;}});varStatusView=Backbone.View.extend({template:_.template('\<h1>Current intensity: <%= intensity %> \'),render:function(){this.$el.html(this.template({intensity:this.model.get('intensity')}));},initialize:function(){this.listenTo(this.model,'change',this.render);}});
Both views observe changes in the same model. While the ControlsView provides buttons for changes, the StatusView should rerender after changes. The communication between the views happens through a model.
A simple model for the LED could look as follows:
varLEDModel=Backbone.Model.extend({defaults:{intensity:0},url:'/LED',brighten:function(){varintensity=this.get('intensity');if(intensity<255){intensity++}this.set('intensity',intensity);this.save();},darken:function(){varintensity=this.get('intensity');if(intensity>1){intensity--}this.set('intensity',intensity);this.save();}});
Last, you must tie everything together as follows (the views should listen to events from the model):
varled=newLEDModel();varcontrols=newControlsView({el:'#controls',model:led});varstatusView=newStatusView({el:'#status',model:led});
And render everything:
$(document).ready(function(){controls.render();statusView.render();});
When you now go to the browser, you should see something similar to the page shown in Figure 10-3.
Figure 10-3. Adjust light brightness with controls
You now have separation of concerns in terms of user-visible entities and communication to the server.
Note
More ideas about building web applications with Backbone.js can be found in the book Full Stack Web Applications with Backbone.js (O’Reilly, 2014). To get an idea of how the previous example might look for a small LED matrix, check out http://vcard.pipefishbook.com. The editor can be used to translate visual pixels into hex numbers for a microcontroller.
Now let’s look into another library for graphics and interactions in the browser.
Websockets in a Browser
Toggling state with HTTP is important, but more often, you want to subscribe to a device with real-time updates. For these cases, there are websockets.
A Bare Minimum Websocket Connection
For the following experiments, you need a server that sends updates from websockets. Based on the server examples from the previous chapter, this looks as follows:
// websockets_server.jsvarexpress=require('express');varmorgan=require('morgan')('dev');varecstatic=require('ecstatic');// set up servervarapp=express();app.use(morgan);app.use(ecstatic({root:__dirname+'/static'}));varport=4000;// set up boardvarfive=require('johnny-five');// adapters// var Edison = require('edison-io');// var Galileo = require('galileo-io');// var BeagleBone = require('beaglebone-io');varboard=newfive.Board({repl:false});board.on("ready",function(){varled=newfive.Led(13);varslider=newfive.Sensor("A1");led.blink(500);startupServer(slider);});functionstartupServer(slider){// prepare servervarserver=app.listen(port);// sockets to push bytesvarWebSocketServer=require('ws').Server;varwss=newWebSocketServer({server:server});wss.on('connection',functionconnection(ws){console.log('websocket connected');ws.on('message',functionincoming(message){console.log('received: %s',message);});slider.scale([0,100]).on("slide",function(){ws.send(JSON.stringify({data:this.value}));});});wss.on('close',functionclose(){console.log('disconnected');});}
Modern web browsers support the Websockets protocol very well. To subscribe to updates from a device, you use the following approach:
<html><head><metacharset="utf-8"><metahttp-equiv="X-UA-Compatible"content="IE=edge"><title>Blinking LED UI</title><style>body{font:50014px/21px'Helvetica Neue',Helvetica,Arials;padding:40px;}</style><scriptsrc="https://cdnjs.cloudflare.com/ajax/libs/jquery/2.0.3/jquery.js"></script></head><body><divid="state"></div><script>varws=newWebSocket('ws://localhost:4000');ws.onmessage=function(e){$('#state').html(e.data);};</script></html>
To show how this works, let’s connect a potentiometer to a device:
Now, run the server with:
$ node server.js
When you go to the browser, you’ll see updates from the device (see Figure 10-4).
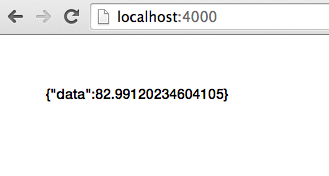
Figure 10-4. Receive data from browser
The D3.js Library for Plotting Data
D3 is a popular JavaScript library written by Michael Bostock to visualize data in a web browser. D3 stands for “Data-Driven Documents.” According to the D3 documentation, the library “allows you to bind arbitrary data to a Document Object Model (DOM), and then apply data-driven transformations to the document.”
This means that D3 provides a means for mapping JavaScript arrays and objects to DOM elements that a web browser can render. To show how this works, let’s consider a simple example of loading D3 and plotting data from a device.
First, you must set up an empty index.html and load D3. The easiest way to load D3 is by loading the script from a CDN, such as:
<scriptsrc="https://cdnjs.cloudflare.com/ajax/libs/d3/3.4.1/d3.min.js"></script>
Alternatively, you can copy the library from the GitHub repository or the project website.
By adding a script reference to the library, you obtain a d3 object in the browser to work with.
The d3 object is somewhat similar to the $ object in jQuery. This means that you can select DOM nodes. And you can build new nodes with a .append. For drawing, you need an svg-based canvas first. Adding this “svg” is the first step to building a graph. Therefore, we define the following construct:
varvis=d3.select("#graph").append("svg");
You can modify the canvas with attributes such as width and height of the graph with:
varw=900,h=400;vis.attr("width",w).attr("height",h);
We can also add text with:
vis.text("Our Graph").select("#graph")
Next, let’s plot some data. In D3, you start with data that might look like:
vardataset=[{coord:[10,20,30,40]}];
The main point is that coordinates are wrapped in some property of a data element. The power of D3 is the “mapping” or “binding” of data to a visual language of shapes and colors. Besides data binding, the toolbox of D3 provides many abstractions and tricks to process data and set up basic user interactions.
Another important part of D3 is “chaining” commands. So, once you have bound data to properties of HTML or svg tags, you can add more visual transformations, or add event bindings.
Drawing a line with D3 might then look like:
<script>vardataset=[[0,20,0,300],[0,20,0,300]];varw=900,h=400;varvis;functionsetup(){vis=d3.select("#plot").append("svg");vis.attr("width",w).attr("height",h);vis.text("The Plot").select("#plot")}functiondraw(dataset){vis.selectAll('line').data(dataset).enter().append('line').attr('stroke','#000').attr('x1',function(d){returnd[0]}).attr('y1',function(d){returnd[1]}).attr('x2',function(d){returnd[2]}).attr('y2',function(d){returnd[3]})}setup();draw(dataset);varws=newWebSocket('ws://localhost:4000');ws.onmessage=function(e){varpoint=JSON.parse(e.data);dataset[1]=[point.data,20,point.data,300];vis.remove();setup();draw(dataset);};</script>
Notice how using D3 can easily abstract away the coordinate system. Generally, this simplifies focus and play with data instead of graphical layout of chart.
If everything works, you should see two lines, as shown in Figure 10-5. The coordinates of the second line can be controlled with a physical device, such as a slider on the Arduino.
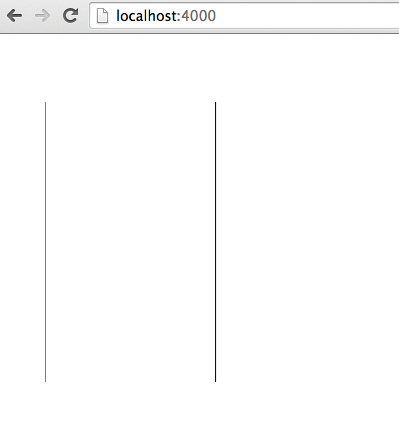
Figure 10-5. Drawing two lines with D3
D3 is also an important building block in projects dealing with data management, such as charting libraries as Epoch.
P5.js
A very popular library for graphics is Processing, which has its roots in the Processing framework developed by Ben Fry and Casey Reas. As such, it has the same roots as the original Arduino IDE. There is also a Processing-inspired JavaScript library: P5.js.
P5.js gives you the possibility to create and mix media in a web browser with physical devices.
To get started, you need to add p5.js in a file called static/index.html:
<scriptsrc="http://cdnjs.cloudflare.com/ajax/libs/p5.js/0.4.19/p5.js"></script>
Then, you need to define a Processing “sketch.” This looks similar to the Arduino IDE, as Processing and the Arduino IDE have the same roots.
To start, insert the following sketch:
<script>functionsetup(){}functiondraw(){}</script>
The draw() function is repeated continuously, while the setup() function is only executed once. For example, you could draw a rotating rectangle with:
<script>varyPos=0;functionsetup(){createCanvas(900,600);x=width/2;y=height;frameRate(30);}functiondraw(){background(20);rect(width/4,yPos,width/2,height/2);}// Connection with websocketsvarws=newWebSocket('ws://localhost:4000');ws.onmessage=function(e){varpoint=JSON.parse(e.data);yPos=point.data;console.log(yPos);};</script>
This works very similar to the previous example with D3.js. The Arduino sends data from its analog input via sockets to the client. The client subscribes to the events from the websocket and updates the data points. The result is shown in Figure 10-6.
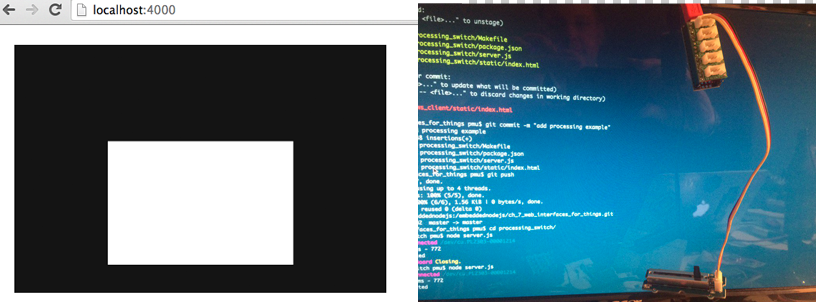
Figure 10-6. Controlling effects in the browser with Arduino and P5.js
Processing is great for all kinds of creative experiments. You could change the speed of the rectangle, let the rectangle rotate, or change the color. You might even want to play with video controls and the <video> tag in the browser.