
Chapter 10
Identifying Fraud Using the Largest Subsets and Largest Growth Tests
The Nigrini Cycle looked at the data in a single field only. The data profile and the histogram gave us information on the distribution of the numbers. The periodic chart gave us the monthly totals. The first-order, summation, second-order, and last-two digits tests all analyzed the digit patterns in a single field. The number duplication test also looked at the duplications of specific numbers in a single field. In the parallel scan we also looked at a single field of data but we compared the numerical and graphical statistics over two time periods. In the next four chapters the forensic tests will analyze two or more fields at a time. These tests are drill-down tests that will give us small samples of highly suspicious records. The tests in the next four chapters are called the advanced tests because of the use of more than one field in the analysis.
The first test described is the largest subsets test. The test uses two fields, one with transaction or balance numbers (such as dollars, inventory counts, vote counts, population counts) and another field to indicate the subset (e.g., vendor number, credit card number, or branch number). The word subset is borrowed from mathematics where we know a set to be a collection of distinct objects and a subset to be a set whose members are all contained in another set. In our case our subset is a group of records that have something in common. This could be all the sales rung up by a cashier or all the purchasing card expenses for a cardholder for the fourth quarter of 2011.
Choosing the subsets requires some imagination. The data can often be divided into several subset groupings. For example, purchasing card data can be grouped by cardholder, or it can be grouped by merchant (the entities that sell the goods or services, e.g., the local car rental agency). The data can also be grouped by time period (e.g., by month) or by the merchant classification.
Accounts payable data could be grouped by vendor or by the type of purchase (purchase order, no purchase order) or by time. There are often a few different ways that data can be divided into subsets. For frequent-flyer miles the grouping could be by customer account number. For inventory data the grouping could be by location. For health care claims the groupings could be providers, employees, or Current Procedural Terminology (CPT) codes. For airline ticket refunds or retail customer refunds the groupings could be the credit card that received the refund. The goal in a forensic investigation is to think of subsets where abnormal duplications could signal errors, fraud, or processing inefficiencies.
The largest subset test has worked well as an error-detecting and a fraud-detecting test. This is particularly so when the data has not yet been the subject of a proactive fraud audit. The first analysis of any data set need not use sophisticated mathematics or statistics. The largest subsets test will usually show valuable results. The goal of the test is to find subsets that are highly inflated due to the error or fraud. Had the largest subsets test been run on the IRS data at the time when 3,000 taxpayers were each billed $300 million, the errors would have been found quite easily. A listing of employees by overtime dollars might point to suspicious behavior, a listing of retail stores authorizing the largest refund totals, or in banking, those employees with the most transactions in their personal accounts might point to suspicious behavior. An example of the largest subsets test is shown in Figure 10.1.
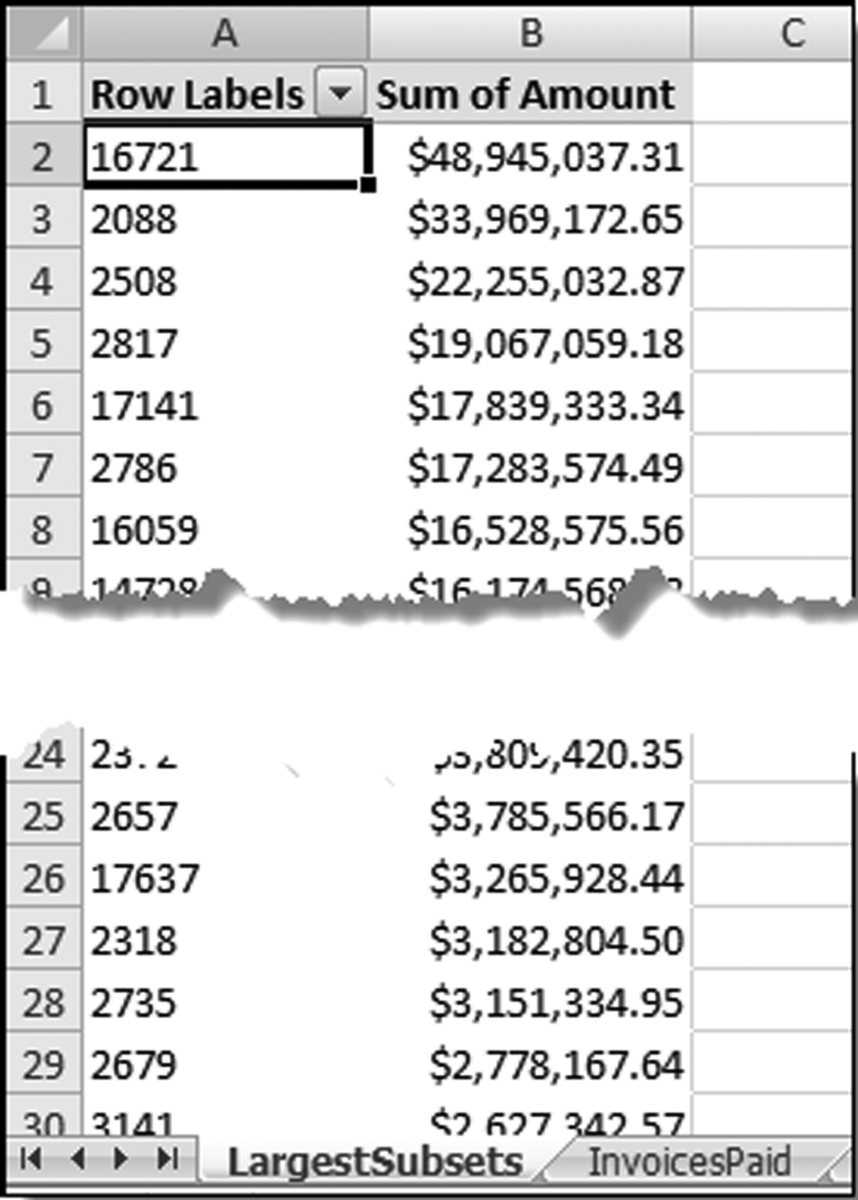
Figure 10.1 The Largest Vendors for 2010
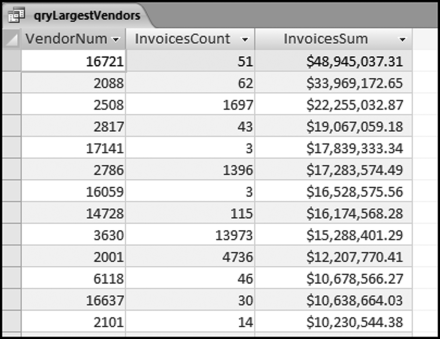
The largest subsets table in Figure 10.1 shows the vendor number, the invoice count, and the total dollars invoiced by the vendor in 2010. The table shows that the largest vendor (#16721) invoiced 51 times for a total amount of $48,945,037.31. The next section reviews some findings from the largest subsets test.
Findings from the Largest Subsets Test
The largest subsets test has produced interesting and useful results. Experience has shown that fraudsters (at least, the ones that were caught) do not know when to stop. They keep up with the scheme to the point that they are likely to show up as a large subset. This is the pattern from the hotel check-in clerk that put their own Hotel Club points on the invoice for everyone that checked in and was not a member of the hotel's loyalty program, to the vice chairman of a major retail company that pled guilty to purchasing card improprieties of $500,000 (including CDS, beer, and a customized dog kennel).
This test should be included on every forensic analytics project. The findings from the test have been very valuable and examples of these forensic findings are described here:
- A company was processing 35,000 invoices per year from a single supplier (Hewlett-Packard). By coincidence another analysis about a year later showed another company processing 42,000 invoices from Hewlett-Packard. This is an efficiency issue in that if any company is transacting in large volumes with another entity then these transactions should be done as efficiently as possible. It would be very inefficient to have 35,000 paper invoices submitted for processing and 35,000 checks mailed to the supplier. Eliminating the paper and streamlining these transactions would result in large savings.
- A controller in Phoenix, Arizona, running the largest subsets test against overtime dollars found that the employee at the top of the list was “working” 1,300 overtime hours in a year. Experience has shown that when employees have figured out how to manipulate the system they do not know when to stop. Even if a finding of 1,300 hours turns out not to be fraud it would still show that staffing levels were inadequate and that the company would benefit from improved planning.
- A company in Chicago, Illinois, found 12,000 invoices each for $8.20 from a printing shop down the road from the head office. The printer supplied business cards for head-office employees and each invoice was being processed individually by accounts payable.
- A company in Dallas, Texas, found that the company was processing 100,000 FedEx invoices per month. The review showed that the courier was used for expedited shipments to customers and that these charges (plus a healthy markup) were recovered from customers. The auditors found that the invoices were being entered electronically and that the transactions were not being entered manually by accounts payable personnel. The problem though with adding 100,000 records to the AP file every month was that this bloated the invoices table. The larger file required more mainframe storage space. Queries against the invoices table took more CPU seconds, which was a waste of valuable resources.
- A Texas-based airline used credit card numbers as the subset variable and then tested passenger ticket refunds using the largest subsets test. The results showed that some credit cards were getting thousands of dollars of refunds every year. No fraud was found after a number of these high-refund cards were reviewed. However, in a related case (also in Texas) a university bookstore employee (a student) repeatedly processed refunds against his own personal credit card. A largest subsets test of the refunds and credit card numbers would have detected his scheme. The fraud was detected by other means after having run its course for a few years and the employee did not graduate from the university.
- A company in Orlando, Florida, used the largest subsets test against perpetual inventory records and identified the locations with the most dollars of negative inventory. The auditors ran the test against the extended values (quantity times cost) in the inventory table. A number of locations (by coincidence all in the Dallas-Fort Worth area) had high levels of negative inventory. The review showed that this was because managers were invoicing customers for goods before the goods were received into inventory. As a result of the pre invoicing the quantity on hand was negative. Experience has shown that managers that get up to tricks like pre-invoicing are prone to later on move ahead to bigger and grander accounting mischief.
- A company in Ventura, California, used the largest subsets test as a purely exploratory test against the checks written to vendors. The results showed that two vendors were each being paid 100 checks per month, which would sum to 2,400 checks per year to each of the two vendors. The vendors were local telephone companies and the company had about 100 branches in each telephone company's calling area. Processing 2,400 telephone bills individually was inefficient. The modern day equivalent is for companies to process employee cell phone bills individually.
- A company in the Dallas-Fort Worth area ran the largest subsets against employee reimbursements. The results showed that one employee was reimbursed for a total of $620,000 for the year. The investigation showed that a check was erroneously made out to the employee for $608,000. Accounts payable personnel confirmed that the check was prepared but that the error was detected before the check was given to the employee. The investigators suggested that flags be put into the system to flag potential high dollar errors before the checks were printed.
- An analysis of employee purchasing cards at a government agency in Washington, DC, showed a number of merchants on the list that violated the rules of the purchasing cards. For example, the cards were not supposed to be used for motor vehicle expenses. The largest subsets analysis includes running the test by cardholder, by merchant, and by date. The investigation was undertaken in response to an employee who used the card repeatedly for personal use at an x-rated video store.
- An analysis of motor vehicle expenses at a company based in San Diego, California, showed a vendor for car batteries appearing near the top if the list. The investigator then calculated how many car batteries each car in the fleet was using. It turned out that each car in their fleet was using two car batteries per year!
This test is a relatively simple test that has given very good results. Several employee frauds were detected at an airline where the test looked to see which “passengers” were accumulating the most frequent-flyer miles in a year. The employee fraud had annual totals way in excess of the 400,000 or so miles accumulated by the most loyal frequent flyers. The frauds had annual totals that were almost impossibly high unless someone was flying every day.
Running the largest subsets test is quite straightforward in Access. The largest subsets test is quite straightforward using Excel's pivot table capabilities. The largest growth test is somewhat complicated in Excel and it gives us some good practice with Excel's computational capabilities.
Running the Largest Subsets Test in Access
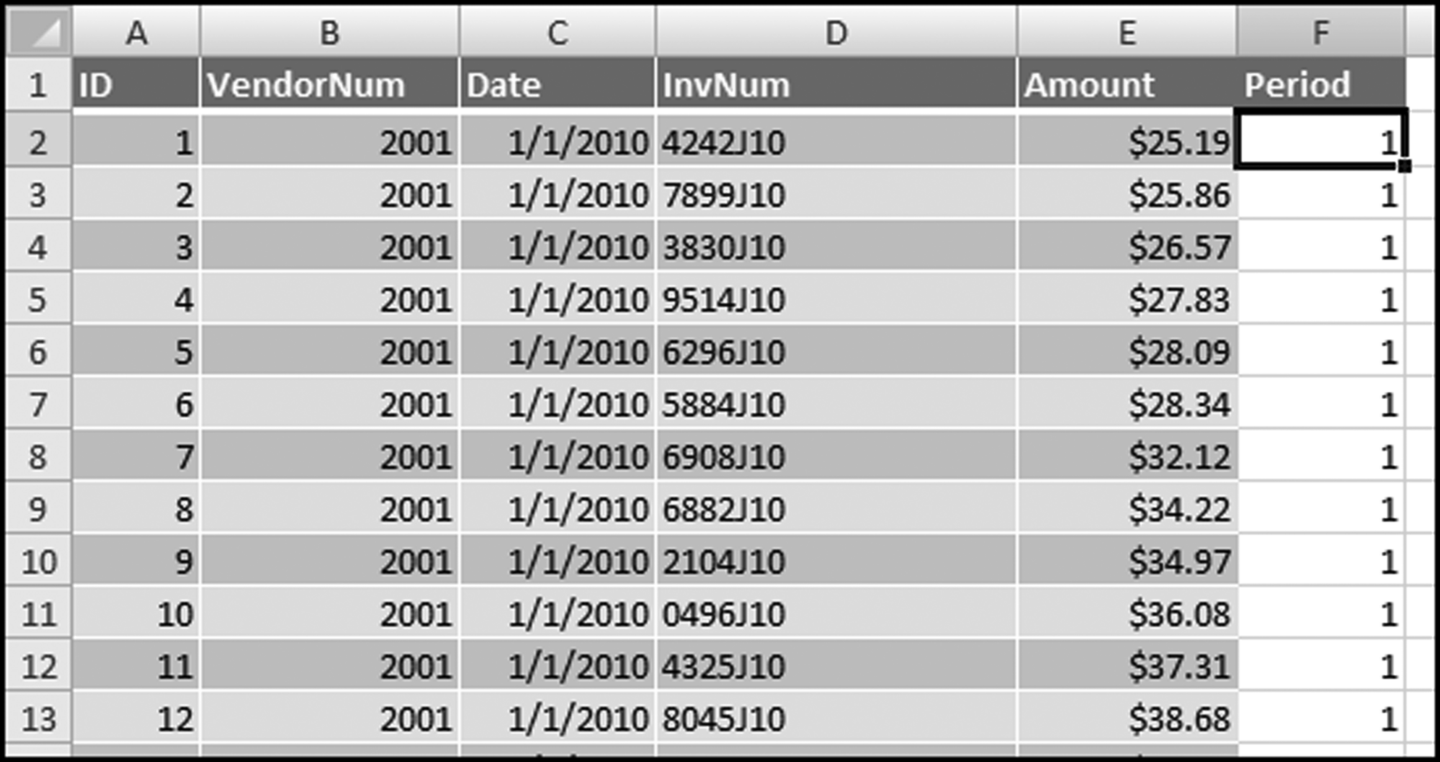
The logic in Access is to (a) identify the subset field and the numeric field that will be counted and summed, (b) to use the Group By, Count, and Sum functions to identify the largest subsets, and (c) to sort by Sum or Count descending. Adding some bells and whistles requires some design grid gymnastics. We will continue with the InvoicesPaid data from Chapter 4 using vendors as our subset variable with a sum and count of the Amount field.
Figure 10.2 The Access Query Used to Identify the Largest Subsets
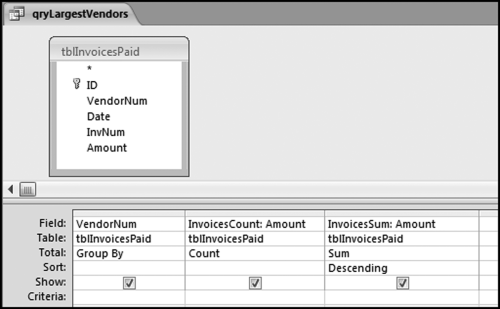
The largest subset's Access query is shown in Figure 10.2 and the result was shown earlier in Figure 10.1. The result is a listing of the largest subsets ranked by total dollars. The results can be changed to list the vendors with the largest counts at the top of the report. The fields are named InvoicesCount and InvoicesSum to slightly shorten the field names. The field names will be used in subsequent queries.
The Figure 10.2 query gives a listing of 26,166 vendors each with a count of the invoices and the total dollars. A look at the bottom of the table shows that there are about 3,000 vendors with total dollars of less than $10. The creation of a vendor account for such small amounts is very inefficient. Also, every valid vendor account could be used to commit a fraud and also each unnecessary vendor number could be the recipient of an unintentional payment in error. The largest subset results can be kept to a manageable size by using the Top Values property. Use Design→Show/Hide→Property Sheet to give the property sheet shown in Figure 10.3.
Figure 10.3 The Query Property Sheet
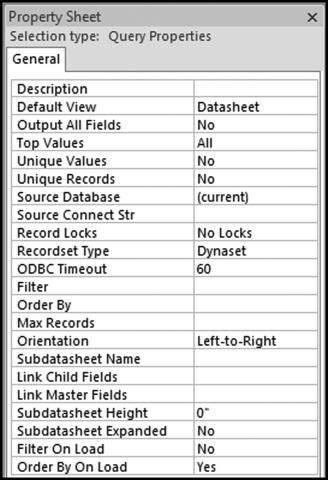
The Top Values option is shown in Figure 10.3. This control (the fourth line on the sheet) allows us to have Access only return the (say) top 100 values. Change the All default to 100 and then close the property sheet. There is no message from Access saying that the changes have been accepted. This will only be clear when the query is run. The result of running the query with the 100 top values selected on the invoices data is shown in Figure 10.4.
Figure 10.4 The 100 Largest Vendors
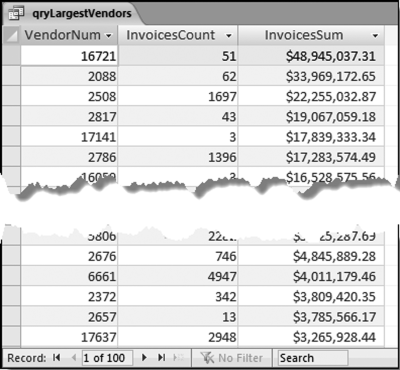
The results are limited to the 100 largest vendors in Figure 10.4. The results are easier to interpret when the output includes vendor names as well as numbers. A recent analysis of purchasing card data included a restaurant on a largest subsets list for $31,000. Although the total dollars were not particularly high, the fact that it was a small hole-in-the-wall restaurant next to their factory raised more than just a few eyebrows. The auditor knew that this was not an eatery used to conduct company business. It was a lunchtime eatery for employees. In another analysis of purchasing card data an electronics store was on the largest subsets list with a total of $87,000. This total was also not especially high, but in a corporate setting, purchases from electronics stores are very suspicious. The largest subsets analysis sometimes also requires a review of the medium-size totals for suspicious items.
Running the Largest Growth Test in Access
This test uses some of the logic of the current period and prior period comparisons and some of the logic of the largest subsets test from this chapter. This test identifies cases where a subset had a growth spurt over some period of time. This growth spurt could be due to fraud, error, or simply a change in circumstances. A purchasing cardholder might have new job responsibilities requiring more travel than before. In forensic work we are not only interested in growth. A large decrease in dollars might also signal fraud. For example, a hotel might report substantially lower sales for tax purposes or a franchisee might report substantially lower sales to the franchise holder.
This test has been used successfully by a consumer goods company looking at coupon redemptions by merchants (stores). A large increase in coupons redeemed was found to be due to fraud. A fast-foods franchising company reviewed large decreases in sales by individual restaurants to determine whether it was due to sales underreporting.
This would be an easy test to run in Access if every subset in period 0 (the prior period) also had sales in period 1 (the current period). This is not always the case. Stores open and stores close and restaurants open and restaurants close. Purchasing cardholders become purchasing cardholders in some periods and stop being cardholders in other periods. The challenge in Access is to change a null (missing) total for a period to a zero for the period.
The first step in the largest growth test is to create a master list (as a table) of all the subsets that had activity in either period. This is done with a make-table query as is shown in Figure 10.5.
Figure 10.5 The Make Table Query Used to Create a Master List of Subsets
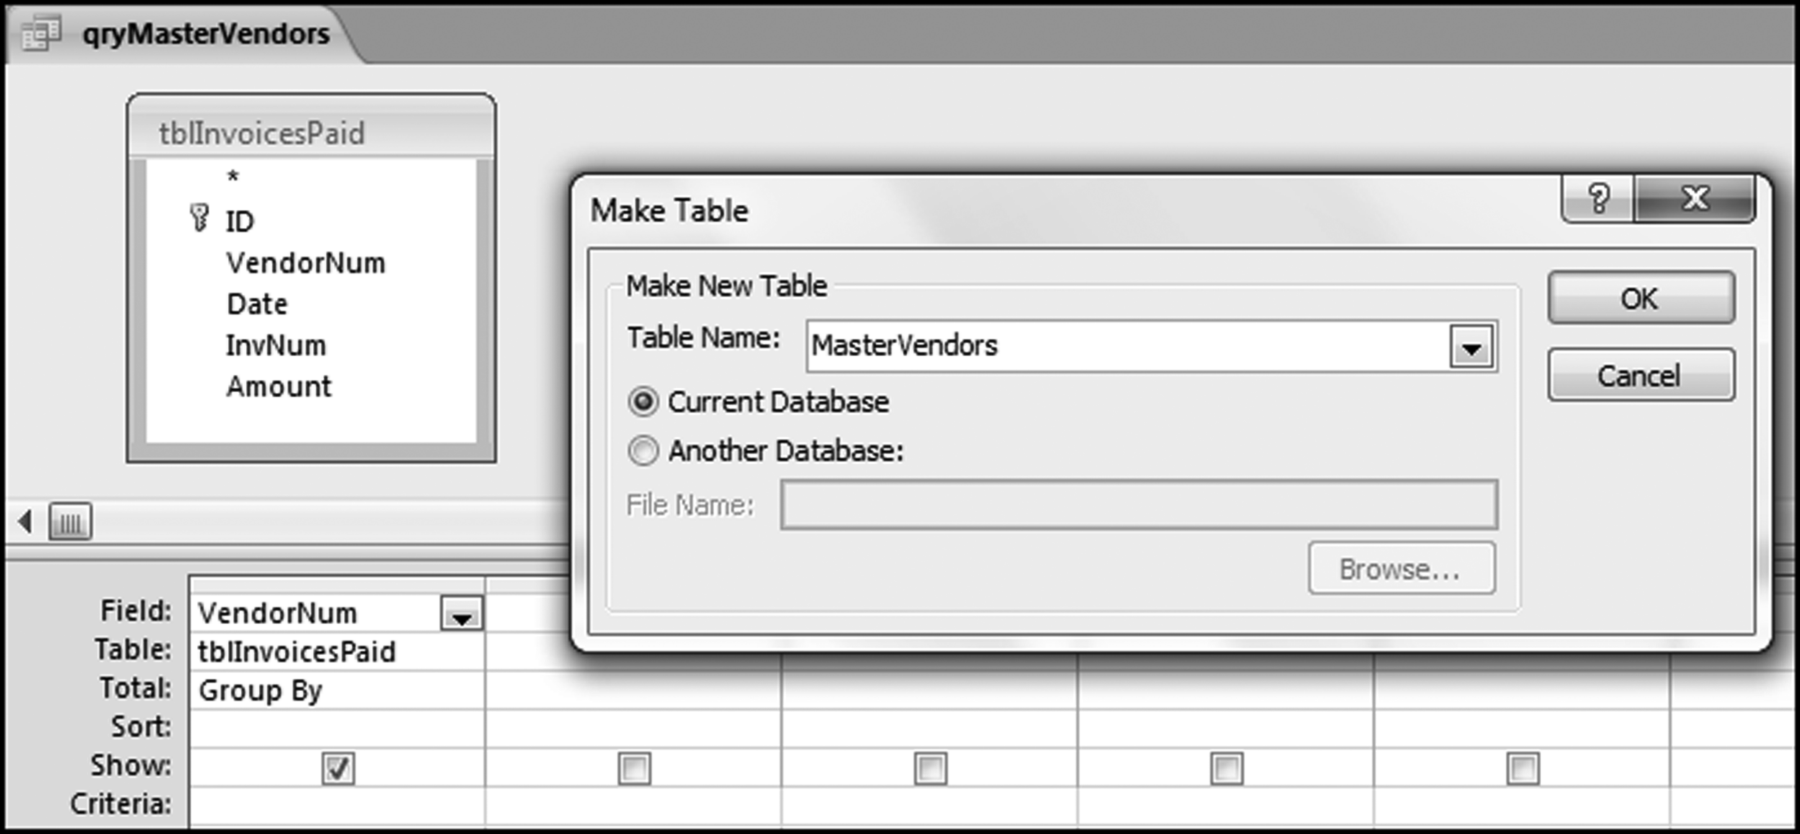
The make table query dialog screen shown in Figure 10.5 is accessed by using Design→Query Type→Make Table. Click OK. The query will create a table of all the vendors. The query must be run using Design→Results→Run. Click Yes for the warning message about pasting 26,166 rows into a new table. This result of the qryMasterVendors query is a table called MasterVendors.
For the largest growth test we will use the invoices data and the comparison will be between the totals for each vendor for the first half and the second half of the year. We will use the abbreviations H1 and H2 to refer to the first period (the first six months) and H2 to refer to the second period (the last six months) of our 2010 data. The next step is to calculate the total for each vendor for each of H1 and H2. The query to calculate the total for H1 is shown in Figure 10.6.
Figure 10.6 The Query Used to Calculate the H1 Sum
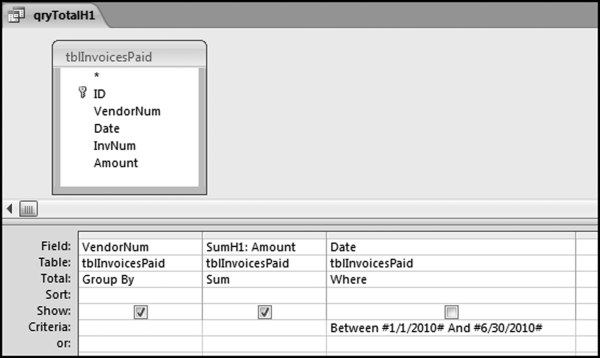
The query to calculate the H1 totals in Figure 10.6 uses number signs # at the start and the end of each date. This tells Access that the reference is to a date. The result of running qryTotalH1 is a sum for each vendor for the first six months for all the vendors that had transactions in the first six months. There were 20,339 such vendors. A query for the last six months also needs to be created. The date range will be #7/1/2010# to #12/31/2010# when written as an Access criterion. This query would be named qryTotalH2. The results should show that there were transactions for 9,952 vendors in the last half of the year. When we are likely to reuse queries it is better to use short names. The first stage of the query to get the totals for both H1 and H2 is shown in Figure 10.7.
Figure 10.7 The Query to Get the Totals for Both H1 and H2
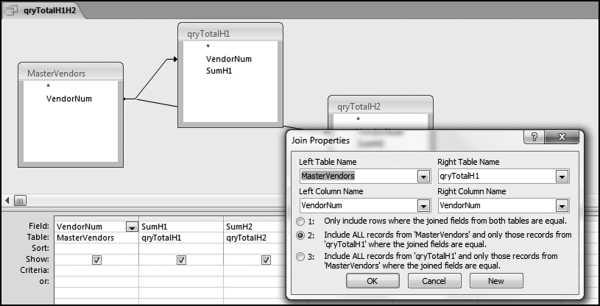
To get the H1 and H2 totals for each vendor side by side we need to set up a query as is shown in Figure 10.7 with a left outer join. The join is from MasterVendors to qryLargestH1 and also from MasterVendors to qryLargestH2.
The next step is to change the null (blank) values to zeroes, and then to calculate the change from H1 to H2. Because we cannot have two fields with the same name SumH1 and SumH2 need to be renamed when we do the calculations. The Change formula needs to avoid any division by zero. A vendor with no transactions in H1 is given a percentage increase of 200 percent. The results are rounded to keep the results nice and tidy. The query is shown in Figure 10.8
Figure 10.8 The Query to Calculate the Amounts for Each Period
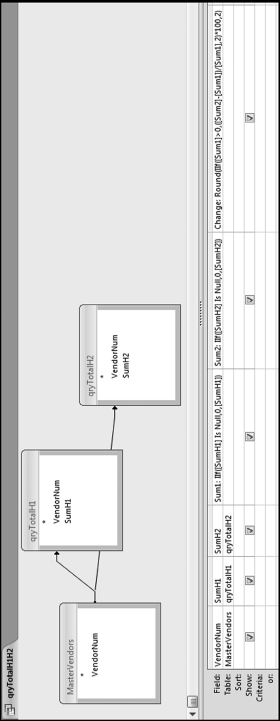
Figure 10.8 shows the query to calculate the H1 and H2 totals. The calculated fields use the If function, which is spelled IIf in Access (for Immediate If). The query also uses the Is Null function. The formulas in the query are
Sum1: IIf([SumH1]Is Null,0,[SumH1])
Sum2: IIf([SumH2]Is Null,0,[SumH2])
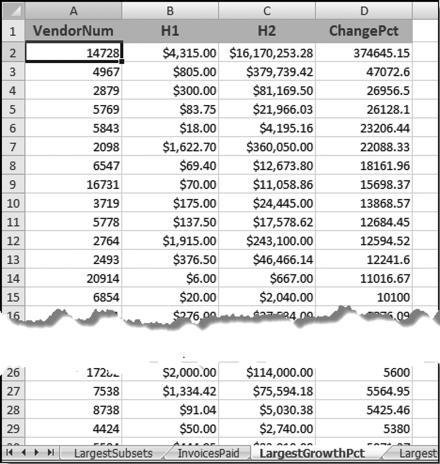
From time to time Access balks at sorting the results when the query has many calculated fields and the sort is run on a calculated field. It is generally good practice to use another query to sort the results. In this case the query would be called qryTotalSorted. The query selects the VendorNum, Sum1, Sum2, and Change fields from qryTotalH1H2 and sorts on Change descending. Change should be renamed to ChangePct and formatted as Standard with 1 decimal place for neat and tidy results. The results are shown in Figure 10.9
Figure 10.9 The Results of the Largest Growth Test
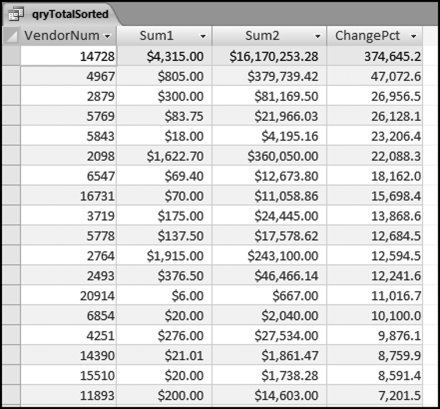
This largest growth results in Figure 10.9 needs to be carefully reviewed. We are interested in large percentage increases, but not necessarily when the base is small. For example, an increase from $6.00 to $667.00 is an 11,017 percent increase, but the base is small. However, in this case it is a possibility that the second period amount was really for $6.67 (which sounds like a better match to $6.00) and the amount was incorrectly entered as $667.00 and not $6.67.
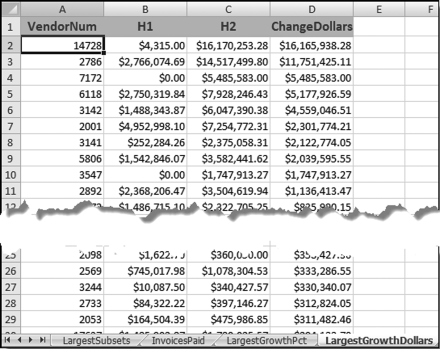
Also, the 200 percent section of the results is in reality all those cases of zero activity in H1 and activity in H2. In addition to the percentage increases qryTotalH1H2 can be revised to show the absolute dollar amount as the increase. For example, the increase for the first row would be $16,165,938.28, which is the H2 total minus the H1 total.
Running the Largest Subsets Test in Excel
Running this test in Excel is reasonably straightforward. We will use the invoices data that was used for the Access tests. The test will use vendors as the subset variable and we will sum and count the Amount field.
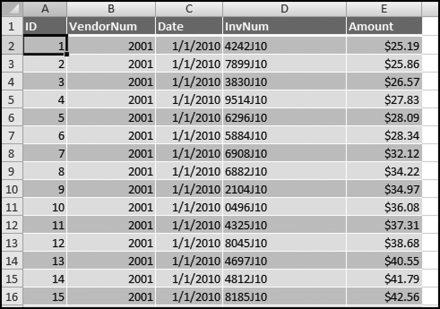
In the number duplication test we counted how many times each number occurred. We could use an adaptation of those indicator variables for the largest subsets tests. The choice here is to use pivot tables. Pivot tables work well for the largest subsets test. We will use a new spreadsheet as opposed to adding yet more sheets to the NigriniCycle.xlsx template. The Excel spreadsheet with the InvoicesPaid data is shown in Figure 10.10.
Figure 10.10 The Invoices Data in an Excel Worksheet
The data was imported from Access using Data→Get External Data→From Access. The Excel table was converted to a range and this removed the filters in the first row and the connection to the source data in Access. The next step is to use the pivot table function using Insert→Tables→Pivot Table→Pivot Table. This will give the dialog box shown in Figure 10.11.
Figure 10.11 The Pivot Table Dialog Box
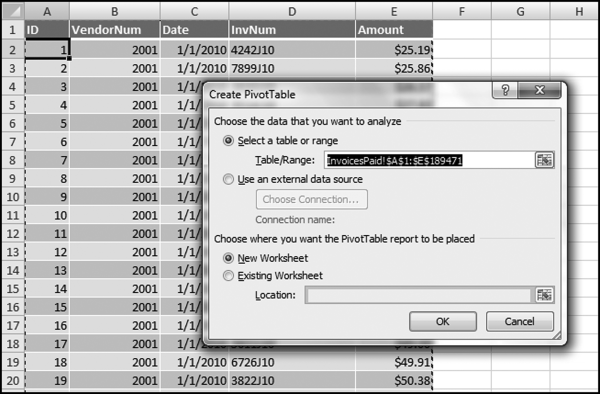
Excel has correctly identified the data source and the preferred choice is to show the output on a new worksheet. Click OK to give the next dialog box as is shown in Figure 10.12.
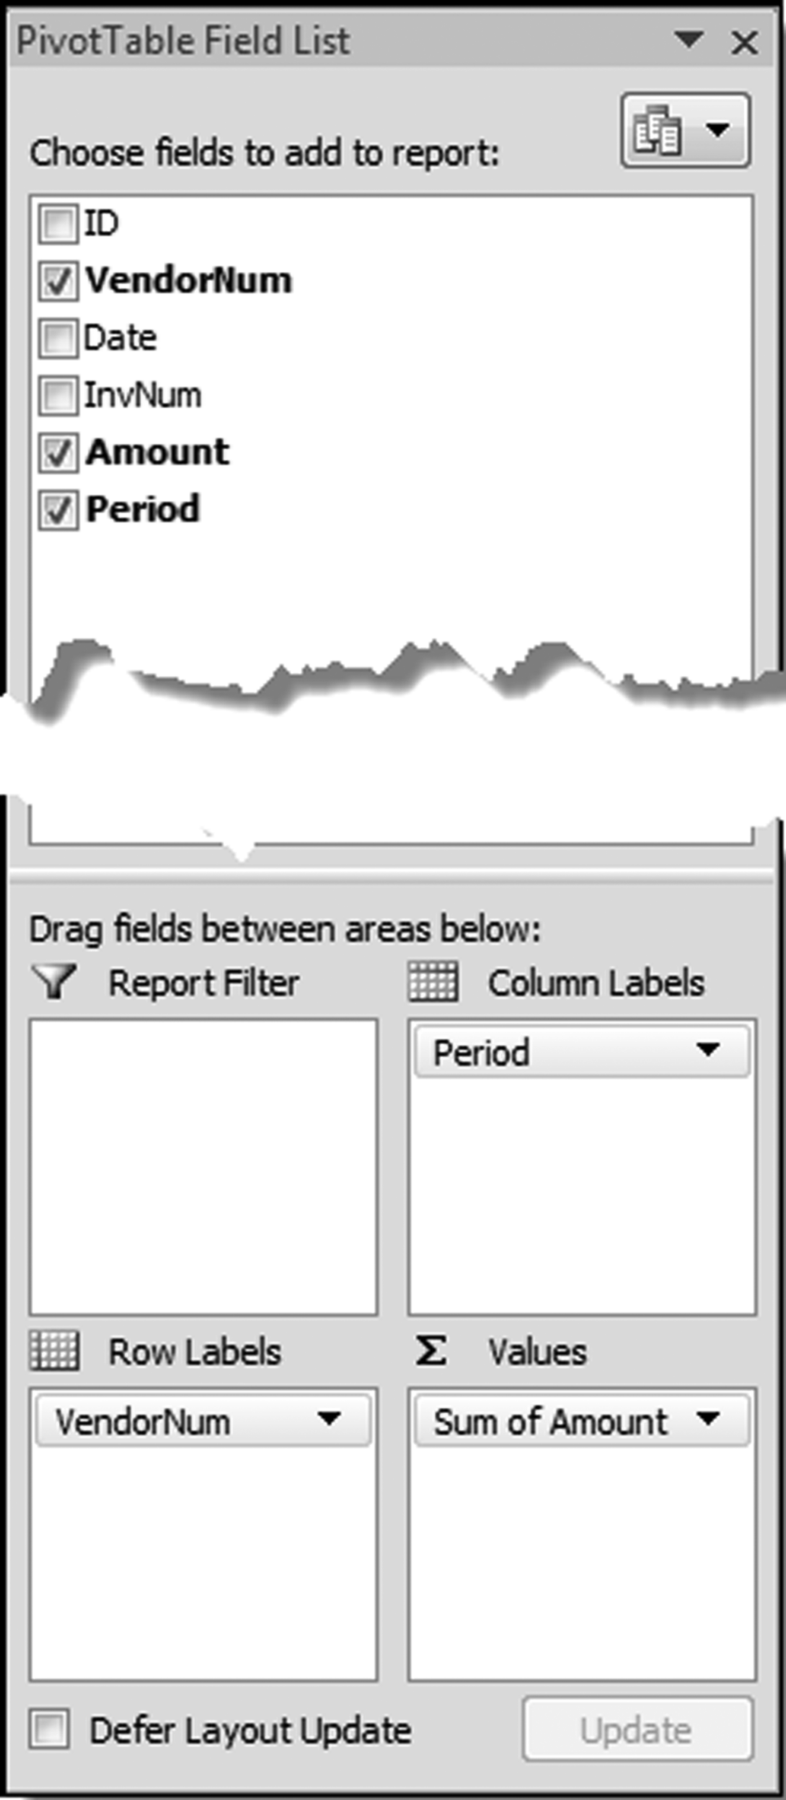
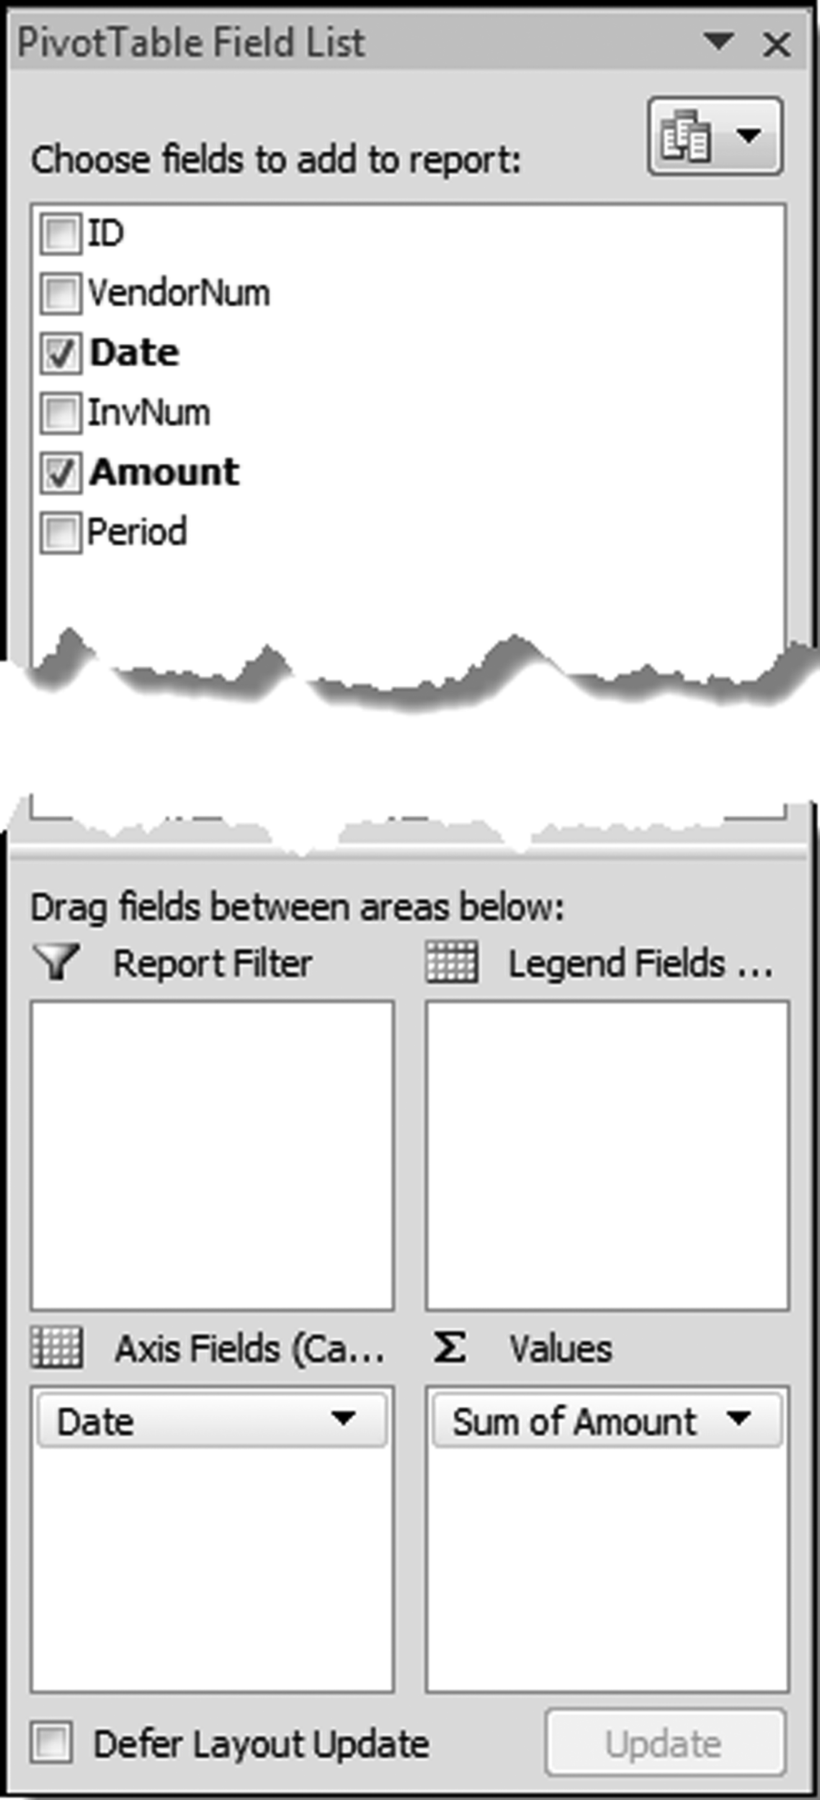
Figure 10.12 The Pivot Table Field List
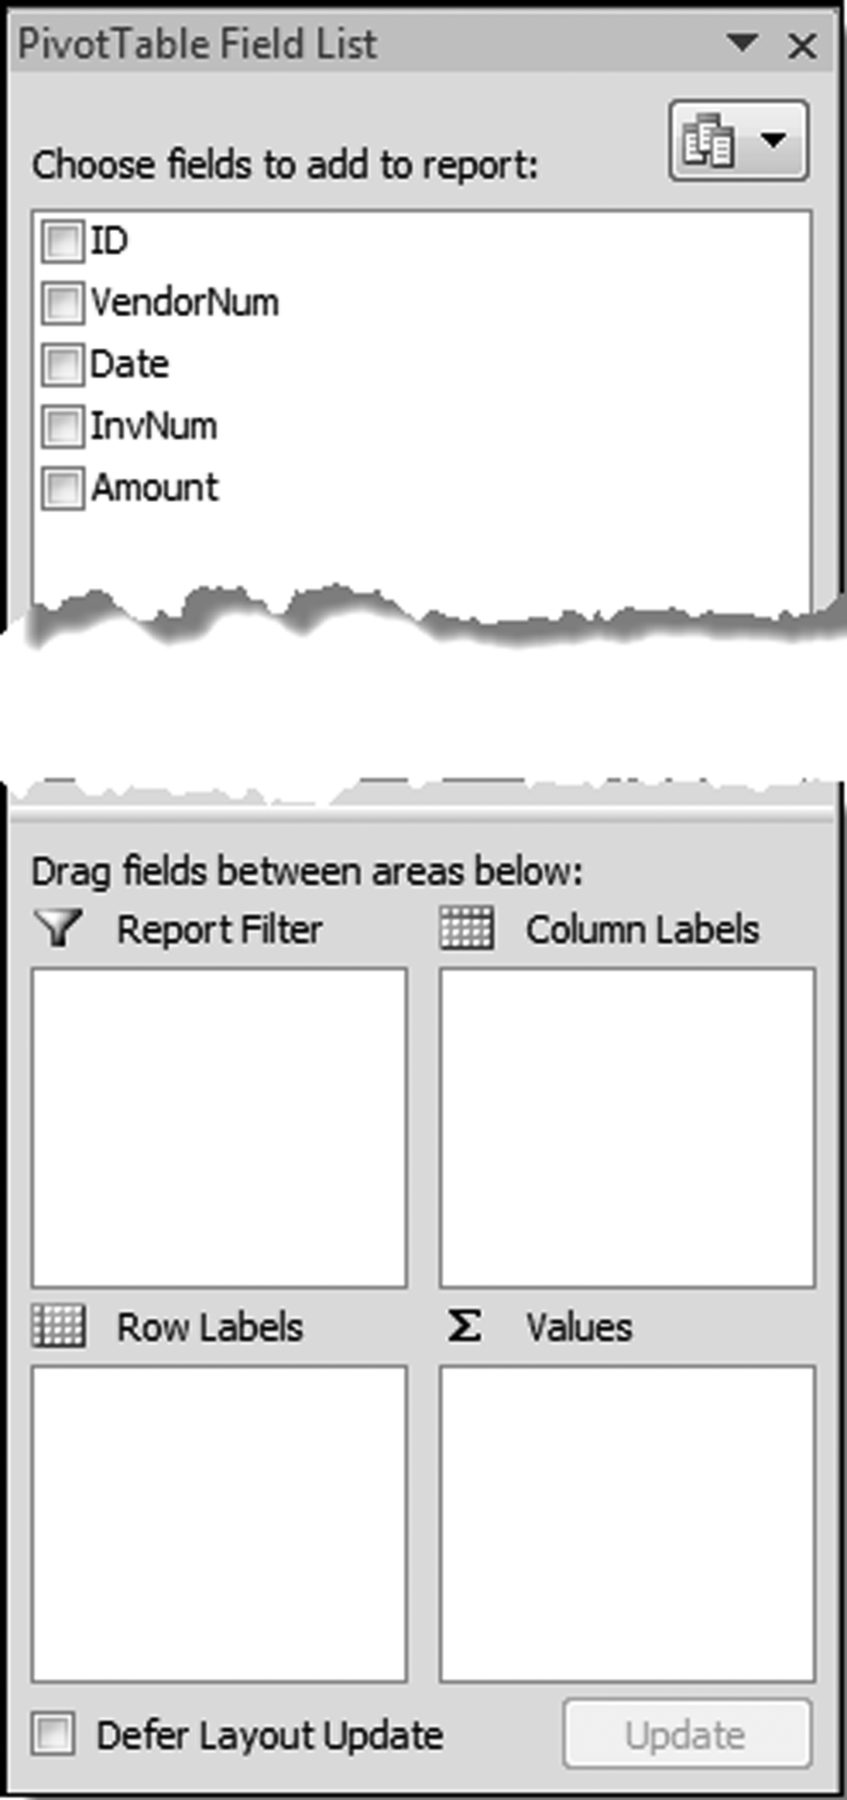
The next step is to identify the fields that will be used in the pivot table and then placing the fields in the boxes at the bottom of the field list box. The first step is to drag the field VendorNum to the Row Labels box and Amount to the Sum Values (∑ Values) box. The subsets and their sums are shown in columns A and B. These results now need to be sorted by Amount descending and the SumOfAmount field needs to be formatted as currency with two decimal places. To run the sort command use Home→Editing→Sort&Filter with the cursor in cell B4. The tidying up steps include closing the pivot table dialog box and deleting the top two rows. The final result is shown in Figure 10.13.
Figure 10.13 The Results of Running the Largest Subset Test Using Pivot Tables
The largest subsets result in Figure 10.13 agrees with the Access result in Figure 10.4. The last row of the Excel output (row 26168) shows the grand total and this grand total agrees with the data profile total in Figure 4.1. Excel's pivot tables are a useful tool for forensic analytics.
Running the Largest Growth Test in Excel
This test identifies subsets that have shown large increases in the past. In this section we use a little sleight of hand with pivot tables to get our required result. With Excel we do not need to create a master list of the subsets that had activity in either period. We do need to use an indicator variable to indicate whether the invoice belongs to H1 (the first half of the period) or H2 (the second half of the period). This is done using the IF function and the function and the result is shown in Figure 10.14.
Figure 10.14 The Indicator Variable Used to Indicate Whether the Period Is H1 or H2
The formula used to identify the period is shown in Figure 10.14. The formula is shown below:
= IF(MONTH(C2)< = 6,1,2)
With each transaction now coded as to H1 or H2 we can run the largest subset growth test in Excel using pivot tables. The goal is to get the result shown in Figure 10.9. Calculating the change percentage and formatting the table will take some additional work after the pivot table has run. The pivot table is created using Insert→Tables→Pivot Table→Pivot Table. The default settings are usually appropriate for the largest subsets test or the largest growth test. Click OK to activate the pivot table dialog box.
Figure 10.15 The Pivot Table Setup for the Largest Subsets Growth Test
The pivot table is set up as is shown in Figure 10.15. The result needs a bit of tidying up work. The first step is to close the Pivot Table Field List box. The next step is to delete the first two (blank) rows of the spreadsheet. Put the cursor in cell A2. With the pivot table results being the active sheet use Options→Pivot Table→Options→Options to get to the pivot table options dialog box shown in Figure 10.16.
Figure 10.16 The Pivot Table Options Dialog Box
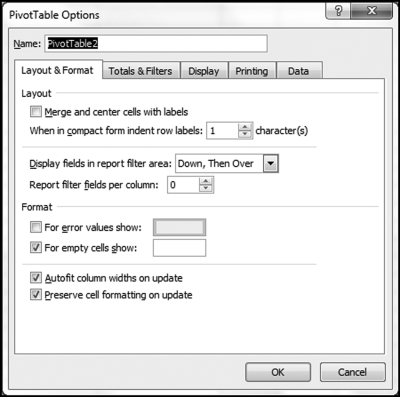
The Pivot Table Options dialog box is shown in Figure 10.16. In the Layout & Format tab (the visible tab in Figure 10.16) use the Format section to show 0 for empty cells. This is done by entering a zero (0) in the third line from the bottom in Figure 10.16. In the Totals & Filters tab unselect both boxes related to the grand totals. In the Display tab unselect Display field captions and filter drop downs. Click OK to activate the changes and to exit from the Pivot Table Options dialog box.
The next step is to calculate the percentage change. Insert the column heading ChangePct in cell D2. The formula for cell D3 is

We then need to get the results into a format that is not constrained by pivot table formatting. This is a little bit tricky because Excel does not really want to add our ChangePct field in column D to the pivot table report. The quickest way to do things is to add a formula in F3, which is = A3. Copy this formula across to I3. We now have a copy of the first row in cells F3:I3. Copy down as far as is needed (to the bottom of the pivot table report). Highlight the entire set of formulas (F3:I26168) and use the Paste Special feature to convert the formulas to values. Now delete the entire pivot table. Remove the extra header row, add the field names, and format the range neatly. Sort the data by ChangePct descending (largest to smallest).
Figure 10.17 The Excel Results for the Subset Growth Test
The subsets with the largest percentage growth numbers are shown in Figure 10.17. For the subsets growth test we are interested in subsets that have a large percentage growth and also subsets that have a large growth measured in dollars. The step to convert the changes to dollars and to sort the results requires changing the formula in column D and then sorting the data from largest to smallest. Creating a copy of the worksheet means that both sets of results are easily accessible.
Figure 10.18 The Subsets Sorted by the Growth in Dollars
The largest growth subsets as measured by the change in dollars are shown in Figure 10.18. More sophisticated methods are available to calculate the growth in subsets. For example, each month could be given a numeric value of 1 to 12. Thereafter, the total dollars per month would be calculated much like the H1 and H2 totals. The next step would be to use regression to calculate the slope of the best fitting line. Subsets with positive slopes would be subsets that show an increase from month-to-month. The slope would be the average monthly increase in dollars. The subsets with the largest positive slopes would be those subsets with the largest increases (as measured by total dollars). Excel has a built-in regression function that can be activated using Data→Analysis→Data Analysis. The regression tool will analyze subsets one at a time (vendor by vendor) and what we really want is an analysis of all vendors at the same time followed by an evaluation of all the results (sorted by slopes descending). This issue will be looked at in Chapter 13.
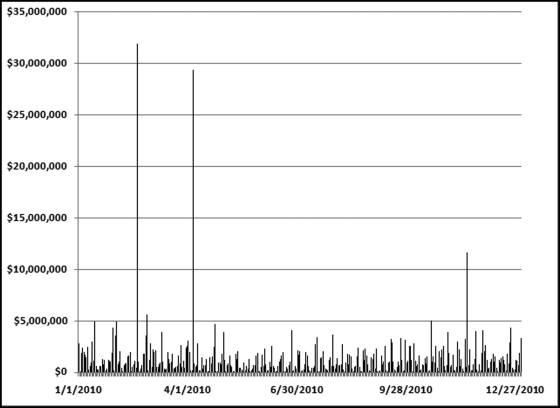
The data could also be analyzed using dates as the subset variable. The test is useful for purchasing card irregularities and prior work has found excessive purchases at or near the end of the fiscal year and also excessive purchases around the holiday season. Excel allows us to create a pivot table and a chart at the same time. Place the cursor in cell A2 of the data table and then click Insert→Tables→Pivot Table→Pivot Chart. Excel should correctly see where your data is located. Accept the default selection of the data. The pivot table setup would be as shown in Figure 10.19.
Figure 10.19 The Creation of a Pivot Chart
The pivot table dialog box is shown in Figure 10.19. The pivot chart is created on the same sheet as the pivot table. The chart can be moved by right clicking in the chart and using Move Chart and then New Sheet. The graphical result after a little formatting here and there is shown in Figure 10.20.
Figure 10.20 The Pivot Chart Showing Total Dollars per Day
The tests in Chapters 4 through 9 looked at the data in a single field only. In this chapter the complexity of using a second field was added. The chapter described two tests and findings from these tests together with the steps to running the tests in Access and Excel.
The largest subsets test uses one field with transaction or balance numbers and another field to indicate subset membership. Examples of transaction or balance numbers include invoiced dollars, inventory counts, vote counts, and population counts. Examples of subset fields include vendor numbers, credit card numbers, branch numbers, or customer numbers. The word subset is borrowed from mathematics where a set is a collection of distinct objects and a subset is a set whose members are all contained in another set. In our forensic tests a subset is a group of records that have something in common. All the sales rung up by a cashier have that cashier in common. Similarly, all the purchasing card expenses for a cardholder have that cardholder in common.
Findings from the largest subsets test have included fraudulent overtime payments, fraudulent customer refunds, and fraudulent mileage awards by airline employees. The findings have also included processing inefficiencies and the inefficient use of database resources. In the data cleansing stage the largest subsets test has also detected data errors where some subsets showed unrealistically high totals.
The largest growth test identifies subsets that have had very high growth over two or more time periods. The growth can be measured as a percentage or in absolute dollar terms. The largest subsets and the largest growth tests can be run in Excel using the pivot table function. Running the tests in Access uses some reasonably straightforward queries.
Identifying relevant subsets requires some creativity. The data can usually be divided into several subset groupings. For example, purchasing card data can be grouped by cardholder, by merchant, by merchant category, or by date. Accounts payable data could be grouped by vendor. This data could also be grouped by the type of purchase (purchase order, no purchase order) or by time. For frequent-flyer miles the subset could be account number. For inventory data the subsets could be location. For health care claims the subsets could be providers, employees, or CPT codes. The goal in forensic analytics is to think of subsets such that abnormal duplications for a subset could signal errors, fraud, or processing inefficiencies.