Table of Contents for
Learning Linux Binary Analysis
 Learning Linux Binary Analysis
Published by
Packt Publishing, 2016
Learning Linux Binary Analysis
Published by
Packt Publishing, 2016
- Cover
- Table of Contents
- Learning Linux Binary Analysis
- Learning Linux Binary Analysis
- Credits
- About the Author
- Acknowledgments
- About the Reviewers
- www.PacktPub.com
- Preface
- What you need for this book
- Who this book is for
- Conventions
- Reader feedback
- Customer support
- 1. The Linux Environment and Its Tools
- Useful devices and files
- Linker-related environment points
- Summary
- 2. The ELF Binary Format
- ELF program headers
- ELF section headers
- ELF symbols
- ELF relocations
- ELF dynamic linking
- Coding an ELF Parser
- Summary
- 3. Linux Process Tracing
- ptrace requests
- The process register state and flags
- A simple ptrace-based debugger
- A simple ptrace debugger with process attach capabilities
- Advanced function-tracing software
- ptrace and forensic analysis
- Process image reconstruction – from the memory to the executable
- Code injection with ptrace
- Simple examples aren't always so trivial
- Demonstrating the code_inject tool
- A ptrace anti-debugging trick
- Summary
- 4. ELF Virus Technology �� Linux/Unix Viruses
- ELF virus engineering challenges
- ELF virus parasite infection methods
- The PT_NOTE to PT_LOAD conversion infection method
- Infecting control flow
- Process memory viruses and rootkits – remote code injection techniques
- ELF anti-debugging and packing techniques
- ELF virus detection and disinfection
- Summary
- 5. Linux Binary Protection
- Stub mechanics and the userland exec
- Other jobs performed by protector stubs
- Existing ELF binary protectors
- Downloading Maya-protected binaries
- Anti-debugging for binary protection
- Resistance to emulation
- Obfuscation methods
- Protecting control flow integrity
- Other resources
- Summary
- 6. ELF Binary Forensics in Linux
- Detecting other forms of control flow hijacking
- Identifying parasite code characteristics
- Checking the dynamic segment for DLL injection traces
- Identifying reverse text padding infections
- Identifying text segment padding infections
- Identifying protected binaries
- IDA Pro
- Summary
- 7. Process Memory Forensics
- Process memory infection
- Detecting the ET_DYN injection
- Linux ELF core files
- Summary
- 8. ECFS – Extended Core File Snapshot Technology
- The ECFS philosophy
- Getting started with ECFS
- libecfs – a library for parsing ECFS files
- readecfs
- Examining an infected process using ECFS
- The ECFS reference guide
- Process necromancy with ECFS
- Learning more about ECFS
- Summary
- 9. Linux /proc/kcore Analysis
- stock vmlinux has no symbols
- /proc/kcore and GDB exploration
- Direct sys_call_table modifications
- Kprobe rootkits
- Debug register rootkits – DRR
- VFS layer rootkits
- Other kernel infection techniques
- vmlinux and .altinstructions patching
- Using taskverse to see hidden processes
- Infected LKMs – kernel drivers
- Notes on /dev/kmem and /dev/mem
- /dev/mem
- K-ecfs – kernel ECFS
- Kernel hacking goodies
- Summary
- Index
In the previous chapter, we examined the key methods and ways to approach the analysis of an ELF binary in Linux, especially when concerning malware, and ways to detect the presence of a parasite within executable code.
Just as an attacker may patch a binary on disk, they may also patch a running program in memory to achieve similar goals, while avoiding being detected by programs that look for file modification, such as a tripwire. This sort of hot patching of a process image can be used to hijack functions, inject shared libraries, execute parasite shellcode, and so on. These types of infections are often the components needed for memory-resident backdoors, viruses, key loggers, and hidden processes.
Note
An attacker can run sophisticated programs that will run cloaked within an existing process address space. This has been demonstrated with Saruman v0.1, which is available at http://www.bitlackeys.org/#saruman.
The examination of a process image when performing forensics or runtime analysis is rather similar to looking at a regular ELF binary. There are more segments and overall moving pieces in a process address space, and the ELF executable will undergo some changes, such as runtime relocations, segment alignment, and .bss expansion.
However, in reality, the investigation steps are very similar for an ELF executable and an actual running program. The running program was initially created by the ELF images that are loaded into the address space. Therefore, understanding the ELF format will help understand how a process looks in memory.
One important file on any Linux system is the /proc/$pid/maps file. This file shows the entire process address space of a running program, and it is something that I often parse in order to determine the location of certain files or memory mappings within a process.
On Linux kernels that have the Grsecurity patches, there is a kernel option called
GRKERNSEC_PROC_MEMMAP that, if enabled, will zero out the /proc/$pid/maps file so that you cannot see the address space values. This makes parsing a process from the outside a bit more difficult, and you must rely on other techniques such as parsing the ELF headers and going from there.
Here's an example of the process memory layout of the hello_world program:
$ cat /proc/`pidof hello_world`/maps
00400000-00401000 r-xp 00000000 00:1b 8126525    /home/ryan/hello_world
00600000-00601000 r--p 00000000 00:1b 8126525    /home/ryan/hello_world
00601000-00602000 rw-p 00001000 00:1b 8126525    /home/ryan/hello_world
0174e000-0176f000 rw-p 00000000 00:00 0          [heap]
7fed9c5a7000-7fed9c762000 r-xp 00000000 08:01 11406096   /lib/x86_64-linux-gnu/libc-2.19.so
7fed9c762000-7fed9c961000 ---p 001bb000 08:01 11406096   /lib/x86_64-linux-gnu/libc-2.19.so
7fed9c961000-7fed9c965000 r--p 001ba000 08:01 11406096   /lib/x86_64-linux-gnu/libc-2.19.so
7fed9c965000-7fed9c967000 rw-p 001be000 08:01 11406096   /lib/x86_64-linux-gnu/libc-2.19.so
7fed9c967000-7fed9c96c000 rw-p 00000000 00:00 0
7fed9c96c000-7fed9c98f000 r-xp 00000000 08:01 11406093   /lib/x86_64-linux-gnu/ld-2.19.so
7fed9cb62000-7fed9cb65000 rw-p 00000000 00:00 0
7fed9cb8c000-7fed9cb8e000 rw-p 00000000 00:00 0
7fed9cb8e000-7fed9cb8f000 r--p 00022000 08:01 11406093   /lib/x86_64-linux-gnu/ld-2.19.so
7fed9cb8f000-7fed9cb90000 rw-p 00023000 08:01 11406093   /lib/x86_64-linux-gnu/ld-2.19.so
7fed9cb90000-7fed9cb91000 rw-p 00000000 00:00 0
7fff0975f000-7fff09780000 rw-p 00000000 00:00 0          [stack]
7fff097b2000-7fff097b4000 r-xp 00000000 00:00 0          [vdso]
ffffffffff600000-ffffffffff601000 r-xp 00000000 00:00 0  [vsyscall]
The preceding maps file output shows the process address space of a very simple Hello World program. Let's go over it in several chunks, explaining each part.
The first three lines are the memory mappings for the executable itself. This is quite obvious because it shows the executable path at the end of the file mapping:
00400000-00401000 r-xp 00000000 00:1b 8126525  /home/ryan/hello_world
00600000-00601000 r--p 00000000 00:1b 8126525  /home/ryan/hello_world
00601000-00602000 rw-p 00001000 00:1b 8126525  /home/ryan/hello_world
We can see that:
- The first line is the text segment, which is easy to tell because the permissions are read plus execute
- The second line is the first part of the data segment, which has been marked as read-only due to RELRO (read-only relocation) security protection
- The third mapping is the remaining part of the data segment that is still writable
The heap is typically grown right after the data segment. Before ASLR existed, it was extended from the end of the data segment address. Nowadays, the heap segment is randomly memory-mapped, but it can be found in the maps file right after the end of the data segment:
0174e000-0176f000 rw-p 00000000 00:00 0 [heap]
There are also anonymous memory mappings that may be created when a call to malloc() requests a chunk of memory that exceeds MMAP_THRESHOLD in size. These types of anonymous memory segments will not be marked with the [heap] label.
The next four lines are the memory mappings for the shared library, libc-2.19.so. Notice that there is a memory mapping marked with no permissions between the text and data segments. This is simply for occupying space in that area so that no other arbitrary memory mappings may be created to use the space between the text and data segments:
7fed9c5a7000-7fed9c762000 r-xp 00000000 08:01 11406096   /lib/x86_64-linux-gnu/libc-2.19.so
7fed9c762000-7fed9c961000 ---p 001bb000 08:01 11406096   /lib/x86_64-linux-gnu/libc-2.19.so
7fed9c961000-7fed9c965000 r--p 001ba000 08:01 11406096   /lib/x86_64-linux-gnu/libc-2.19.so
7fed9c965000-7fed9c967000 rw-p 001be000 08:01 11406096   /lib/x86_64-linux-gnu/libc-2.19.so
In addition to regular shared libraries, there is the dynamic linker, which is also technically a shared library. We can see that it is mapped to the address space by looking at the file mappings right after the libc mappings:
7fed9c96c000-7fed9c98f000 r-xp 00000000 08:01 11406093   /lib/x86_64-linux-gnu/ld-2.19.so
7fed9cb62000-7fed9cb65000 rw-p 00000000 00:00 0
7fed9cb8c000-7fed9cb8e000 rw-p 00000000 00:00 0
7fed9cb8e000-7fed9cb8f000 r--p 00022000 08:01 11406093   /lib/x86_64-linux-gnu/ld-2.19.so
7fed9cb8f000-7fed9cb90000 rw-p 00023000 08:01 11406093   /lib/x86_64-linux-gnu/ld-2.19.so
7fed9cb90000-7fed9cb91000 rw-p 00000000 00:00 0
At the end of the maps file, you will see the stack segment, followed by VDSO (short for Virtual Dynamic Shared Object) and vsyscall:
7fff0975f000-7fff09780000 rw-p 00000000 00:00 0          [stack]
7fff097b2000-7fff097b4000 r-xp 00000000 00:00 0          [vdso]
ffffffffff600000-ffffffffff601000 r-xp 00000000 00:00 0  [vsyscall]
VDSO is used by glibc to invoke certain system calls that are frequently called and would otherwise create a performance issue. VDSO helps speed this up by executing certain syscalls in userland. The vsyscall page is deprecated on x86_64, but on 32-bit, it accomplishes the same thing as VDSO.
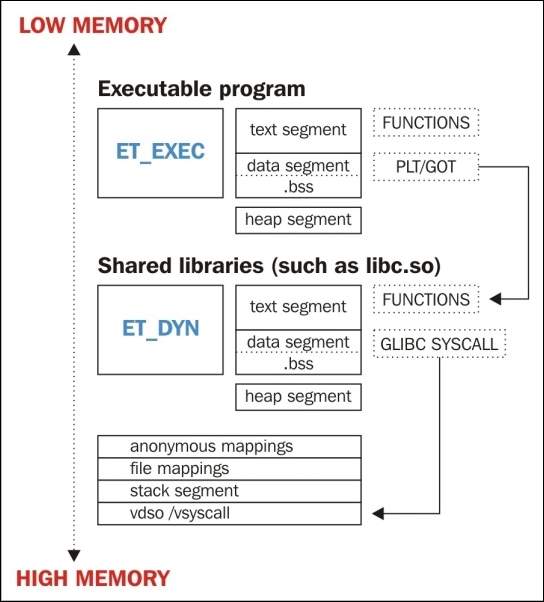
What the process looks like