Table of Contents for
Spring Microservices in Action
 Spring Microservices in Action
Published by
Manning Publications, 2017
Spring Microservices in Action
Published by
Manning Publications, 2017
- Cover
- Spring Microservices in Action
- Copyright
- Spring Microservices in Action
- Brief Table of Contents
- Table of Contents
- Preface
- Acknowledgments
- About this Book
- About the Author
- About the Cover Illustration
- Chapter 1. Welcome to the cloud, Spring
- Chapter 2. Building microservices with Spring Boot
- Chapter 3. Controlling your configuration with Spring Cloud configuration server
- Chapter 4. On service discovery
- Chapter 5. When bad things happen: client resiliency patterns with Spring Cloud and Netflix Hystrix
- Chapter 6. Service routing with Spring Cloud and Zuul
- Chapter 7. Securing your microservices
- Chapter 8. Event-driven architecture with Spring Cloud Stream
- Chapter 9. Distributed tracing with Spring Cloud Sleuth and Zipkin
- Chapter 10. Deploying your microservices
- Appendix A. Running a cloud on your desktop
- Appendix B. OAuth2 grant types
- Index
- List of Figures
- List of Tables
- List of Listings
Chapter 10. Deploying your microservices
- Understanding why the DevOps movement is critical to microservices
- Configuring the core Amazon infrastructure used by EagleEye services
- Manually deploying EagleEye services to Amazon
- Designing a build and deployment pipeline for your services
- Moving from continuous integration to continuous deployment
- Treating your infrastructure as code
- Building the immutable server
- Testing in deployment
- Deploying your application to the cloud
We’re at the end of the book, but not the end of our microservices journey. While most of this book has focused on designing, building, and operationalizing Spring-based microservices using the Spring Cloud technology, we haven’t yet touched on how to build and deploy microservices. Creating a build and deployment pipeline might seem like a mundane task, but in reality it’s one of the most important pieces of your microservices architecture.
Why? Remember, one of the key advantages of a microservices architecture is that microservices are small units of code that can be quickly built, modified, and deployed to production independently of one another. The small size of the service means that new features (and critical bug fixes) can be delivered with a high degree of velocity. Velocity is the key word here because velocity implies that little to no friction exists between making a new feature or fixing a bug and getting your service deployed. Lead times for deployment should be minutes, not days.
To accomplish this, the mechanism that you use to build and deploy your code needs to be
- Automated— When you build your code, there should be no human intervention in the build and deployment process, particularly in the lower environments. The process of building the software, provisioning a machine image, and then deploying the service should be automated and should be initiated by the act of committing code to the source repository.
- Repeatable— The process you use to build and deploy your software should be repeatable so that the same thing happens every time a build and deploy kicks off. Variability in your process is often the source of subtle bugs that are difficult to track down and resolve.
- Complete— The outcome of your deployed artifact should be a complete virtual machine or container image (Docker) that contains the “complete” run-time environment for the service. This is an important shift in the way you think about your infrastructure. The provisioning of your machine images needs to be completely automated via scripts and kept under source control with the service source code. In a microservice environment, this responsibility usually shifts from an operations team to the development team owning the service. Remember, one of the core tenants of microservice development is pushing complete operational responsibility for the service down to the developers.
- Immutable— Once the machine image containing your service is built, the runtime configuration of the image should not be touched or changed after the image has been deployed. If changes need to be made, the configuration needs to happen in the scripts kept under source control and the service and infrastructure need to go through the build process again. Runtime configuration changes (garbage collection settings, Spring profile being used) should be passed as environment variables to the image while application configuration should be kept separate from the container (Spring Cloud Config).
Building a robust and generalized build deployment pipeline is a significant amount of work and is often specifically designed toward the runtime environment your services are going to run. It often involves a specialized team of DevOps (developer operations) engineers whose sole job is to generalize the build process so that each team can build their microservices without having to reinvent the entire build process for themselves. Unfortunately, Spring is a development framework and doesn’t offer a significant amount of capabilities for implementing a build and deployment pipeline.
For this chapter, we’re going to see how to implement a build and deployment pipeline using a number of non-Spring tools. You’re going to take the suite of microservices you’ve been building for this book and do the following:
- Integrate the Maven build scripts you’ve been using into a continuous integration/deployment cloud-tool called Travis CI
- Build immutable Docker images for each service and push those images to a centralized repository
- Deploy the entire suite of microservices to Amazon’s Cloud using Amazon’s EC2 Container Service (ECS)
- Run platform tests that will test that the service is functioning properly
I want to start our discussion with the end goal in mind: a deployed set of services to AWS Elastic Container Service (ECS). Before we get into all the details of how you’re going to implement a build/deployment pipeline, let’s walk through how the EagleEye services are going to look running in Amazon’s cloud. Then we’ll discuss how to manually deploy the EagleEye services to the AWS cloud. Once that’s done, we will automate the entire process.
10.1. EagleEye: setting up your core infrastructure in the cloud
Throughout all the code examples in this book, you’ve run all of your applications inside a single virtual machine image with each individual service running as a Docker container. You’re going to change that now by separating your database server (PostgreSQL) and caching server (Redis) away from Docker into Amazon’s cloud. All the other services will remain running as Docker containers running inside a single-node Amazon ECS cluster. Figure 10.1 shows the deployment of the EagleEye services to the Amazon cloud.
Figure 10.1. By using Docker, all your services can be deployed to a cloud provider such as Amazon ECS.
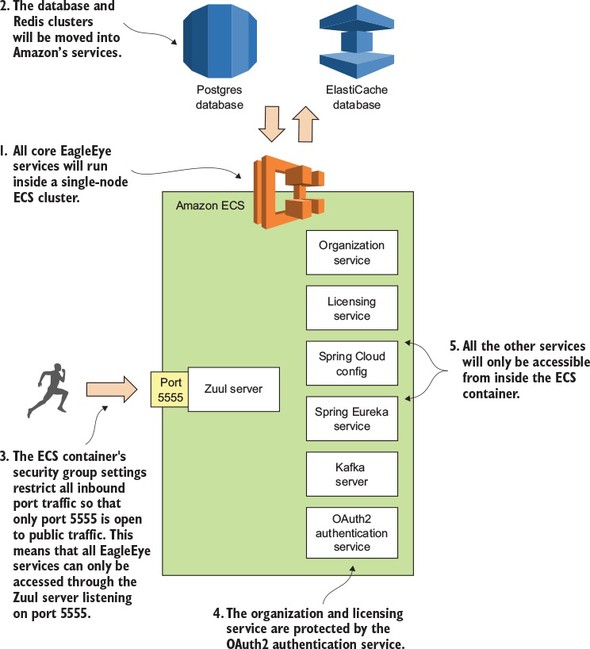
Let’s walk through figure 10.1 and dive into more detail:
- All your EagleEye services (minus the database and the Redis cluster) are going to be deployed as Docker containers running inside of a single-node ECS cluster. ECS configures and sets up all the servers needed to run a Docker cluster. ECS also can monitor the health of containers running in Docker and restart services if the service crashes.
- With the deployment to the Amazon cloud, you’re going to move away from using your own PostgreSQL database and Redis server and instead use the Amazon RDS and Amazon ElastiCache services. You could continue to run the Postgres and Redis datastores in Docker, but I wanted to highlight how easy it is to move from infrastructure that’s owned and managed by you to infrastructure managed completely by the cloud provider (in this case, Amazon). In a real-world deployment you’re more often than not going to deploy your database infrastructure to virtual machines before you would Docker containers.
- Unlike your desktop deployment, you want all traffic for the server to go through your Zuul API gateway. You’re going to use an Amazon security group to only allow port 5555 on the deployed ECS cluster to be accessible to the world.
- You’ll still use Spring’s OAuth2 server to protect your services. Before the organization and licensing services can be accessed, the user will need to authenticate with your authentication services (see chapter 7 for details on this) and present a valid OAuth2 token on every service call.
- All your servers, including your Kafka server, won’t be publicly accessible to the outside world via their exposed Docker ports.
To set up your Amazon infrastructure, you’re going to need the following:
- Your own Amazon Web Services (AWS) account. You should have a basic understanding of the AWS console and the concepts behind working in the environment.
- A web browser. For the manual setup, you’re going to set up everything from the console.
- The Amazon ECS command-line client (https://github.com/aws/amazon-ecs-cli) to do a deployment.
If you don’t have any experience with using Amazon’s Web Services, I’d set up an AWS account and install the tools in the list. I’d also spend time familiarizing yourself with the platform.
If you’re completely new to AWS, I highly recommend you pick up a copy of Michael and Andreas Wittig’s book Amazon Web Services in Action (Manning, 2015). The first chapter of the book (https://www.manning.com/books/amazon-web-services-in-action#downloads) is available for download and includes a well-written tutorial at the end of the chapter on how to sign up and configure your AWS account. Amazon Web Services in Action is a well-written and comprehensive book on AWS. Even though I’ve been working with the AWS environment for years, I still find it a useful resource.
Finally, in this chapter I’ve tried as much as possible to use the free-tier services offered by Amazon. The only place where I couldn’t do this is when setting up the ECS cluster. I used a t2.large server that costs approximately .10 cents per hour to run. Make sure that you shut down your services after you’re done if you don’t want to incur significant costs.
Note
There’s no guarantee that the Amazon resources (Postgres, Redis, and ECS) that I’m using in this chapter will be available if you want to run this code yourself. If you’re going to run the code from this chapter, you need to set up your own GitHub repository (for your application configuration), your own Travis CI account, Docker Hub (for your Docker images), and Amazon account, and then modify your application configuration to point to your account and credentials.
10.1.1. Creating the PostgreSQL database using Amazon RDS
Before we begin this section, you need to set up and configure your Amazon AWS account. Once this is done, your first task is to create the PostgreSQL database that you’re going to use for your EagleEye services. To do this you’re going to log in into the Amazon AWS console (https://aws.amazon.com/console/) and do the following:
- When you first log into the console you’ll be presented with a list of Amazon web services. Locate the link called RDS. Click on the link and this will take you to the RDS dashboard.
- On the dashboard, you’ll find a big button that says “Launch a DB Instance.” Click on it.
- Amazon RDS supports different database engines. You should see a list of databases. Select PostgreSQL and click the “Select” button. This will launch the database creation wizard.
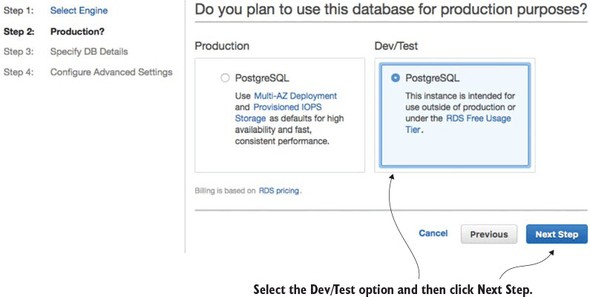
The first thing the Amazon database creation wizard will ask you is whether this is a production database or a dev/test database. You’re going to create a dev/test database using the free tier. Figure 10.2 shows this screen.
Figure 10.2. Selecting whether the database is going to be a production database or a test database
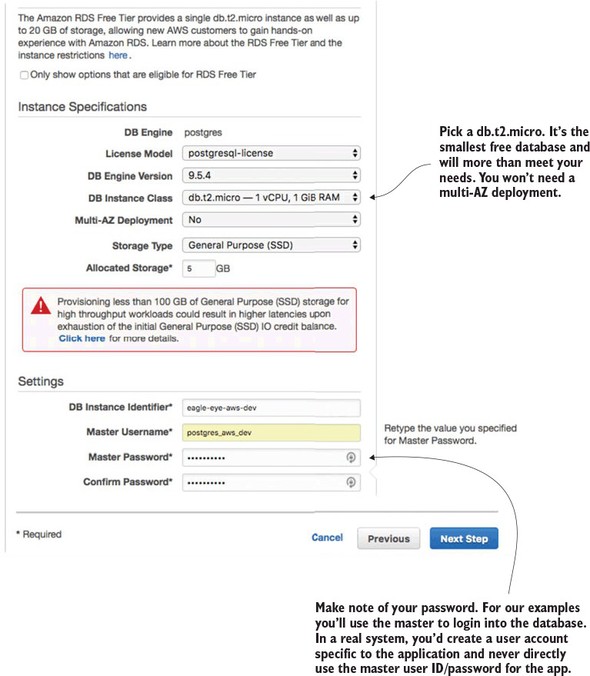
Next, you’re going to set up basic information about your PostgreSQL database and also set the master user ID and password you’re going to use to log into the database. Figure 10.3 shows this screen.
Figure 10.3. Setting up the basic database configuration
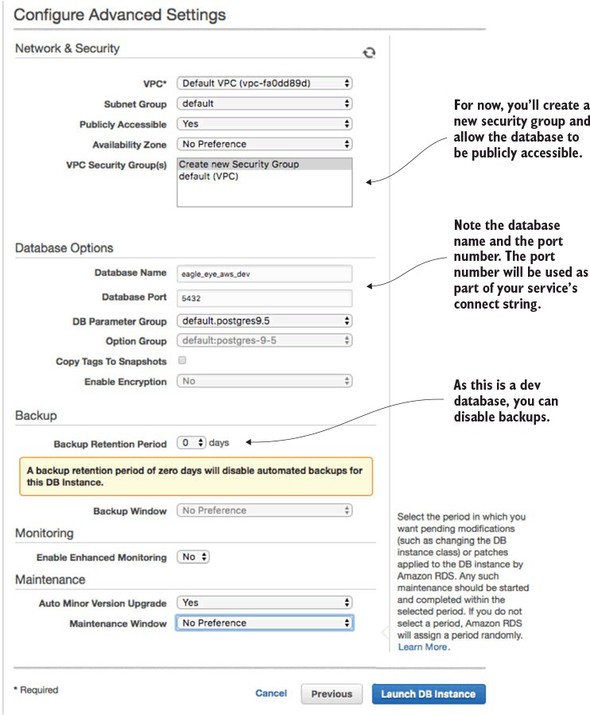
The last and final step of the wizard is to set up the database security groups, port information, and database backup information. Figure 10.4 shows the contents of this screen.
Figure 10.4. Setting up the security group, port, and backup options for the RDS database
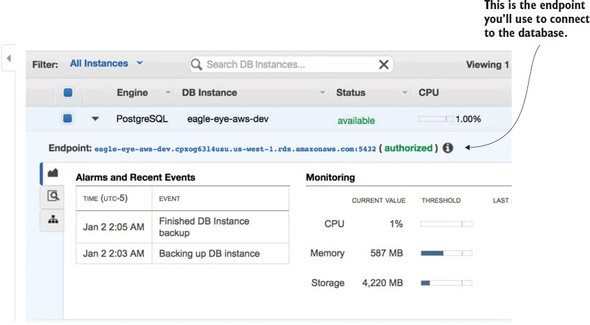
At this point, your database creation process will begin (it can take several minutes). Once it’s done, you’ll need to configure the Eagle Eye services to use the database. After the database is created (this will take several minutes), you’ll navigate back to the RDS dashboard and see your database created. Figure 10.5 shows this screen.
Figure 10.5. Your created Amazon RDS/PostgreSQL database
For this chapter, I created a new application profile called aws-dev for each microservice that needs to access the Amazon-base PostgreSQL database. I added a new Spring Cloud Config server application profile in the Spring Cloud Config GitHub repository (https://github.com/carnellj/config-repo) containing the Amazon database connection information. The property files follow the naming convention (service-name)-aws-dev.yml in each of the property files using the new database (licensing service, organization service, and authentication service).
At this point your database is ready to go (not bad for setting it up in approximately five clicks). Let’s move to the next piece of application infrastructure and see how to create the Redis cluster that your EagleEye licensing service is going to use.
10.1.2. Creating the Redis cluster in Amazon
To set up the Redis cluster, you’re going to use the Amazon ElastiCache service. Amazon ElastiCache allows you to build in-memory data caches using Redis or Memcached (https://memcached.org/). For the EagleEye services, you’re going to move the Redis server you were running in Docker to ElastiCache.
To begin, navigate back to the AWS Console’s main page (click the orange cube on the upper left-hand side of the page) and click the ElastiCache link.
From the ElastiCache console, select the Redis link (left-hand side of the screen), and then hit the blue Create button at the top of the screen. This will bring up the ElastiCache/Redis creation wizard.
Figure 10.6 shows the Redis creation screen.
Figure 10.6. With a few clicks you can set up a Redis cluster whose infrastructure is managed by Amazon.
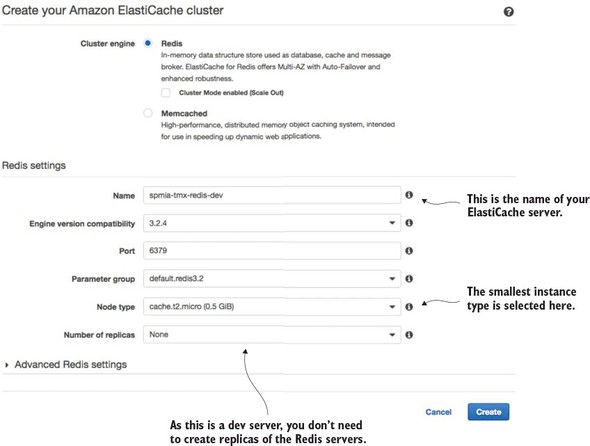
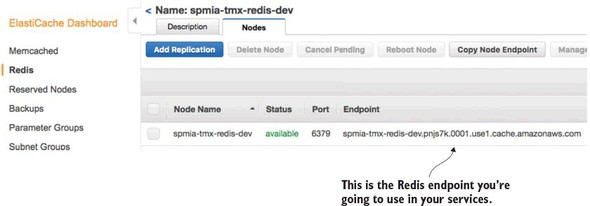
Go ahead and hit the create button once you’ve filled in all your data. Amazon will begin the Redis cluster creation process (this will take several minutes). Amazon will build a single-node Redis server running on the smallest Amazon server instance available. Once you hit the button you’ll see your Redis cluster being created. Once the cluster is created, you can click on the name of the cluster and it will bring you to a detailed screen showing the endpoint used in the cluster. Figure 10.7 shows the details of the Redis clustered after it has been created.
Figure 10.7. The Redis endpoint is the key piece of information your services need to connect to Redis.
The licensing service is the only one of your services to use Redis, so make sure that if you deploy the code examples in this chapter to your own Amazon instance, you modify the licensing service’s Spring Cloud Config files appropriately.
10.1.3. Creating an ECS cluster
The last and final step before you deploy the EagleEye services is to set up an Amazon ECS cluster. Setting up an Amazon ECS cluster provisions the Amazon machines that are going to host your Docker containers. To do this you’re going to again go to the Amazon AWS console. From there you’re going to click on the Amazon EC2 Container Service link.
This brings you to the main EC2 Container service page, where you should see a “Getting Started” button.
Click on the “Start” button. This will bring you to the “Select options to Configure” screen shown in figure 10.8.
Figure 10.8. ECS offers a wizard to bootstrap a new service container. You’re not going to use it.
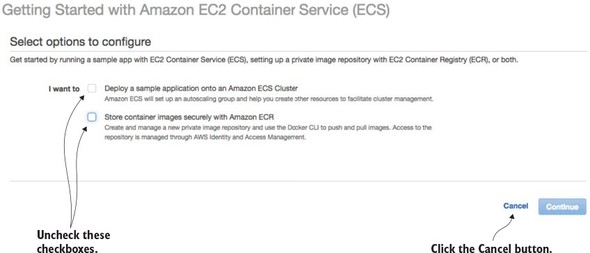
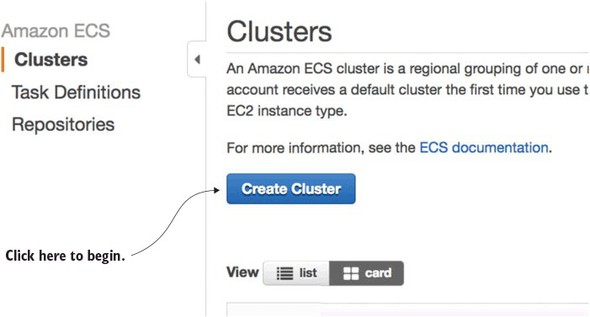
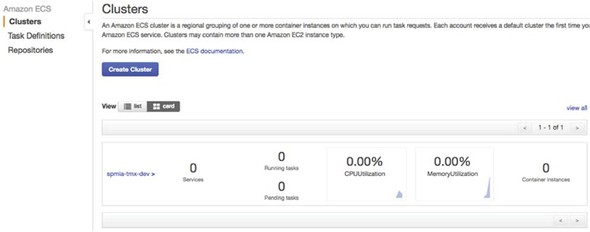
Uncheck the two checkboxes on the screen and click the cancel button. ECS offers a wizard for setting up an ECS container based on a set of predefined templates. You’re not going to use this wizard. Once you cancel out of the ECS set-up wizard, you should see the “Clusters” tab on the ECS home page. Figure 10.9 shows this screen. Hit the “Create Cluster” button to begin the process of creating an ECS cluster.
Figure 10.9. Starting the process of creating an ECS cluster
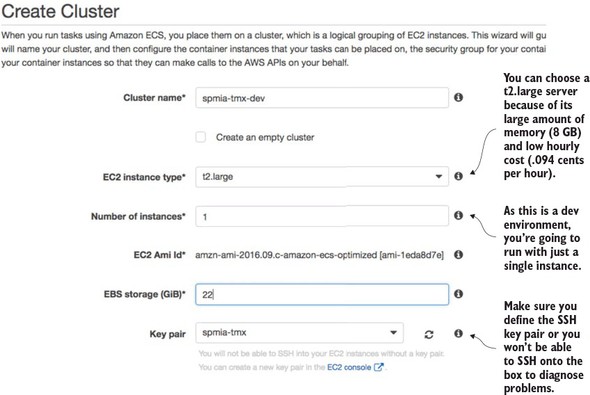
Now you’ll see a screen called “Create Cluster” that has three major sections. The first section is going to define the basic cluster information. Here you’re going to enter the
- Name of your ECS cluster.
- Size of the Amazon EC2 virtual machine you’re going to run the cluster in
- Number of instances you’re going to run in your cluster.
- Amount of Elastic Block Storage (EBS) disk space you’re going to allocate to each node in the cluster
Figure 10.10 shows the screen as I populated it for the test examples in this book.
Figure 10.10. In the “Create Cluster” screen size the EC2 instances used to host the Docker cluster.
Note
One of the first tasks you do when you set up an Amazon account is define a key pair for SSHing into any EC2 servers you start. We’re not going to cover setting up a key pair in this chapter, but if you’ve never done this before, I recommend you look at Amazon’s directions regarding this (http://docs.aws.amazon.com/AWSEC2/latest/UserGuide/ec2-key-pairs.html).
Next, you’re going to set up the network configuration for the ECS cluster. Figure 10.11 shows the networking screen and the values you’re configuring.
Figure 10.11. Once the servers are set up, configure the network/AWS security groups used to access them.
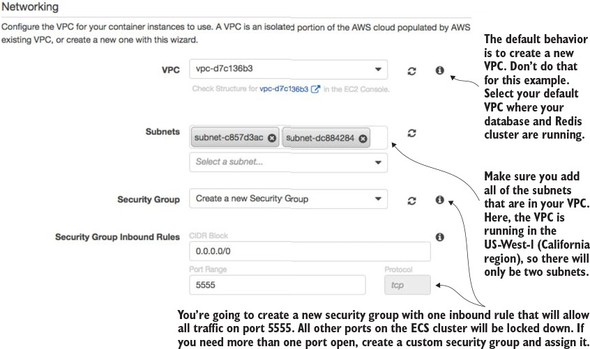
The first thing to note is selecting the Amazon Virtual Private Cloud (VPC) that the ECS cluster will run. By default, the ECS set-up wizard will offer to set up a new VPC. I’ve selected to run the ECS cluster in my default VPC. The default VPC houses the database server and Redis cluster. In Amazon’s cloud, an Amazon-managed Redis server can only be accessed by servers that are in the same VPC as the Redis server.
Next, you have to select the subnets in the VPC that you want to give access to the ECS cluster. Because each subnet corresponds to an Amazon availability zone, I usually select all subnets in the VPC to make the cluster available.
Finally, you have to select to create a new security group or select an existing Amazon security group that you’ve created to apply to the new ECS cluster. Because you’re running Zuul, you want all traffic to flow through a single port, port 5555. You’re going to configure the new security group being created by the ECS wizard to allow all in-bound traffic from the world (0.0.0.0/0 is the network mask for the entire internet).
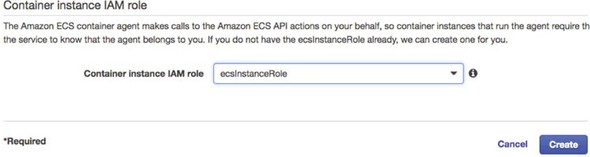
The last step that has to be filled out in the form is the creation of an Amazon IAM Role for the ECS container agent that runs on the server. The ECS agent is responsible for communicating with Amazon about the status of the containers running on the server. You’re going to allow the ECS wizard to create a IAM role, called ecsInstanceRole, for you. Figure 10.12 shows this configuration step.
Figure 10.12. Configuring the Container IAM role
At this point you should see a screen tracking the status of the cluster creation. Once the cluster is created, you should see a blue button on the screen called “View Cluster.” Click on the “View Cluster” button. Figure 10.13 shows the screen that will appear after the “View Cluster” button has been pressed.
Figure 10.13. The ECS cluster up and running
At this point, you have all the infrastructure you need to successfully deploy the EagleEye microservices.
Right now, you’re doing everything via the Amazon AWS console. In a real environment, you’d have scripted the creation of all this infrastructure using Amazon’s CloudFormation scripting DSL (domain specific language) or a cloud infrastructure scripting tool like HashiCorp’s Terraform (https://www.terraform.io/). However, that’s an entire topic to itself and far outside the scope of this book. If you’re using Amazon’s cloud, you’re probably already familiar with CloudFormation. If you’re new to Amazon’s cloud, I recommend you take the time to learn it before you get too far down the road of setting up core infrastructure via the Amazon AWS Console.
Again, I want to point the reader back to Amazon Web Services in Action (Manning, 2015) by Michael and Andreas Wittig. They walk through the majority of Amazon Web Services and demonstrate how to use CloudFormation (with examples) to automate the creation of your infrastructure.
10.2. Beyond the infrastructure: deploying EagleEye
At this point you have the infrastructure set up and can now move into the second half of the chapter. In this second part, you’re going to deploy the EagleEye services to your Amazon ECS container. You’re going to do this in two parts. The first part of your work is for the terminally impatient (like me) and will show how to deploy EagleEye manually to your Amazon instance. This will help you understand the mechanics of deploying the service and see the deployed services running in your container. While getting your hands dirty and manually deploying your services is fun, it isn’t sustainable or recommended.
This is where the second part of this section comes into play. You’re going to automate the entire build and deployment process and take the human being out of the picture. This is your targeted end state and really caps the work you’ve been doing in the book by demonstrating how to design, build, and deploy microservices to the cloud.
10.2.1. Deploying the EagleEye services to ECS manually
To manually deploy your EagleEye services, you’re going to switch gears and move away from the Amazon AWS console. To deploy the EagleEye services, you’re going to use the Amazon ECS command-line client (https://github.com/aws/amazon-ecs-cli). After you’ve installed the ECS command-line client, you need to configure the ecs-cli run-time environment to
- Configure the ECS client with your Amazon credentials
- Select the region the client is going to work in
- Define the default ECS cluster the ECS client will be working against
- This work is done by running the ecs-cli configure command:
ecs-cli configure --region us-west-1 \
                  --access-key $AWS_ACCESS_KEY \
                  --secret-key $AWS_SECRET_KEY \
                  --cluster spmia-tmx-dev
The ecs-cli configure command will set the region where your cluster is located, your Amazon access and secret key, and the name of the cluster (spmia-tmx-dev) you’ve deployed to. If you look at the previous command, I’m using environment variables ($AWS_ACCESS_KEY and $AWS_SECRET_KEY) to hold my Amazon access and secret key.
Note
I selected the us-west-1 region for purely demonstrative purposes. Depending on the country you’re located in, you might choose an Amazon region more specific to your part of the world.
Next, let’s see how to do a build. Unlike in other chapters, you have to set the build name because the Maven scripts in this chapter are going to be used in the build-deploy pipeline being set up later on in the chapter. You’re going to set an environment variable called $BUILD_NAME. The $BUILD_NAME environment variable is used to tag the Docker image that’s created by the build script. Change to the root directory of the chapter 10 code you downloaded from GitHub and issue the following two commands:
export BUILD_NAME=TestManualBuild
mvn clean package docker:build
This will execute a Maven build using a parent POM located at the root of the project directory. The parent pom.xml is set up to build all the services you’ll deploy in this chapter. Once the Maven code is done executing, you can deploy the Docker images to the ECS instance you set up earlier in the section 10.1.3. To do the deployment, issue the following command:
ecs-cli compose --file docker/common/docker-compose.yml up
The ECS command line client allows you to deploy containers using a Docker-compose file. By allowing you to reuse your Docker-compose file from your desktop development environment, Amazon has significantly simplified the deployment of your services to Amazon ECS. After the ECS client has run, you can validate that the services are running and discover the IP address of the servers by issuing the following command:
ecs-cli ps
Figure 10.14 shows the output from the ecs-cli ps command.
Figure 10.14. Checking the status of the deployed services
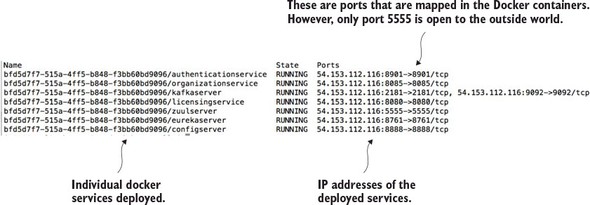
Note three things from the output in figure 10.14:
- You can see that seven Docker containers have been deployed, with each Docker container running one of your services.
- You can see the IP address of the ECS cluster (54.153.122.116).
- It looks like you have ports other than port 5555 open. That is not the case. The port identifiers in figure 10.14 are the port mappings for the Docker container. However, the only port that’s open to the outside world is port 5555. Remember that when you set up your ECS cluster, the ECS set-up wizard created an Amazon security group that only allowed traffic from port 5555.
At this point you’ve successfully deployed your first set of services to an Amazon ECS client. Now, let’s build on this by looking at how to design a build and deployment pipeline that can automate the process of compiling, packaging, and deploying your services to Amazon.
ECS has limited tools to debug why a container doesn’t start. If you have problems with an ECS deployed service starting or staying up, you’ll need to SSH onto the ECS cluster to look at the Docker logs. To do this you need to add port 22 to the security group that the ECS cluster runs with, and then SSH onto the box using the Amazon key pair you defined at the time the cluster was set (see figure 10.9) as the ec2-user. Once you’re on the server, you can get a list of all the Docker containers running on the server by running the docker ps command. Once you’ve located the container image that you want to debug, you can run a docker logs –f <<container id>> command to tail the logs of the targeted Docker container.
This is a primitive mechanism for debugging an application, but sometimes you only need to log on to a server and see the actual console output to determine what’s going on.
10.3. The architecture of a build/deployment pipeline
The goal of this chapter is to provide you with the working pieces of a build/deployment pipeline so that you can take these pieces and tailor them to your specific environment.
Let’s start our discussion by looking at the general architecture of your build deployment pipeline and several of the general patterns and themes that it represents. To keep the examples flowing, I’ve done a few things that I wouldn’t normally do in my own environment and I’ll call those pieces out accordingly.
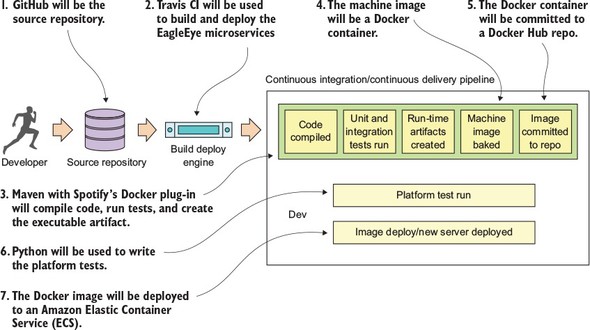
Our discussion on deploying microservices is going to begin with a picture you saw way back in chapter 1. Figure 10.15 is a duplicate of the diagram we saw in chapter 1 and shows the pieces and steps involved in building a microservices build and deployment pipeline.
Figure 10.15. Each component in the build and deployment pipeline automates a task that would have been manually done.
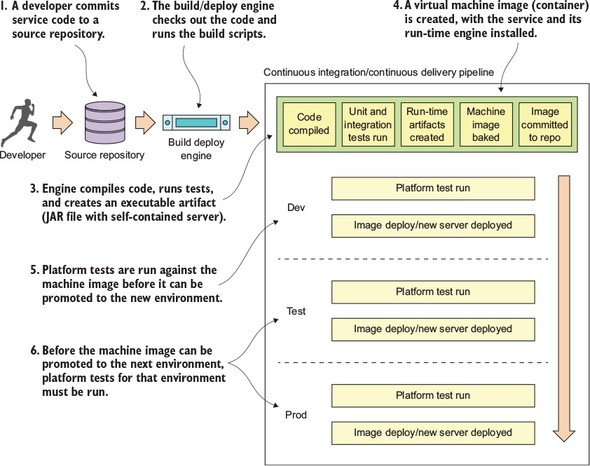
Figure 10.15 should look somewhat familiar, because it’s based on the general build-deploy pattern used for implementing Continuous Integration (CI):
- A developer commits their code to the source code repository.
- A build tool monitors the source control repository for changes and kicks off a build when a change is detected.
- During the build, the application’s unit and integration tests are run and if everything passes, a deployable software artifact is created (a JAR, WAR, or EAR).
- This JAR, WAR, or EAR might then be deployed to an application server running on a server (usually a development server).
With the build and deployment pipeline (shown in figure 10.15), a similar process is followed up until the code is ready to be deployed. In the build and deployment shown in figure 10.15, you’re going to tack Continuous Delivery (CD) onto the process:
- A developer commits their service code to a source repository.
- A build/deploy engine monitors the source code repository for changes. If code is committed, the build/deploy engine will check out the code and run the code’s build scripts.
- The first step in the build/deploy process is to compile the code, run its unit and integration tests, and then compile the service to an executable artifact. Because your microservices are built using Spring Boot, your build process will create an executable JAR file that contains both the service code and self-contained Tomcat server.
- This is where your build/deploy pipeline begins to deviate from a traditional Java CI build process. After your executable JAR is built you’re going to “bake” a machine image with your microservice deployed to it. This baking process will basically create a virtual machine image or container (Docker) and install your service onto it. When the virtual machine image is started, your service will be started and will be ready to begin taking requests. Unlike a traditional CI build process where you might (and I mean might) deploy the compiled JAR or WAR to an application server that’s independently (and often with a separate team) managed from the application, with the CI/CD process you’re deploying the microservice, the runtime engine for the service, and the machine image all as one co-dependent unit that’s managed by the development team that wrote the software.
- Before you officially deploy to a new environment, the machine image is started and a series of platform tests are run against the running image to determine if everything is running correctly. If the platform tests pass, the machine image is promoted to the new environment and made available for use.
- Before a service is promoted to the next environment, the platform tests for the environment must be run. The promotion of the service to the new environment involves starting up the exact machine image that was used in the lower environment to the next environment. This is the secret sauce of the whole process. The entire machine image is deployed. No changes are made to any installed software (including the operating system) after the server is created. By promoting and always using the same machine image, you guarantee the immutability of the server as it’s promoted from one environment to the next).
You’ll see from figure 10.15 that I do several types of testing (unit, integration, and platform) during the build and deployment of a service. Three types of testing are typical in a build and deployment pipeline:
Unit tests—Unit tests are run immediately before the compiliation of the service code, but before it’s deployed to an environment. They’re designed to run in complete isolation, with each unit test being small and narrow in focus. A unit test should have no dependencies on third-party infrastructure databases, services, and so on. Usually a unit test scope will encompass the testing of a single method or function.
Integration tests—Integration tests are run immediately after packaging the service code. These tests are designed to test an entire workflow and stub or mock out major services or components that would need to be called off box. During an integration test, you might be running an in-memory database to hold data, mocking out third-party service calls, and so on. Integration tests test an entire workflow or code path. For integration tests, third-party dependencies are mocked or stubbed so that any calls that would invoke a remote service are mocked or stubbed so that calls never leave the build server.
Platform tests—Platform tests are run right before a service is deployed to an environment. These tests typically test an entire business flow and also call all the third-party dependencies that would normally be called in a production system. Platform tests are running live in a particular environment and don’t involve any mocked-out services. Platform tests are run to determine integration problems with third-party services that would normally not be detected when a third-party service is stubbed out during an integration test.
This build/deploy process is built on four core patterns. These patterns aren’t my creation but have emerged from the collective experience of development teams building microservice and cloud-based applications. These patterns include
- Continuous Integration/Continuous Delivery (CI/CD)— With CI/CD, your application code isn’t only being built and tested when it is committed; it’s also constantly being deployed. The deployment of your code should go something like this: if the code passes its unit, integration, and platform tests, it should be immediately promoted to the next environment. The only stopping point in most organizations is the push to production.
- Infrastructure as code— The final software artifact that will be pushed to development and beyond is a machine image. The machine image and your microservice installed on it will be provisioned time immediately after your microservice’s source code is compiled and tested. The provisioning of the machine image occurs through a series of scripts that are run with each build. No human hands should ever touch the server after it’s been built. The provisioning scripts are kept under source control and managed like any other piece of code.
- Immutable servers— Once a server image is built, the configuration of the server and microservice is never touched after the provisioning process. This guarantees that your environment won’t suffer from “configuration drift” where a developer or system administrator made “one small change” that later caused an outage. If a change needs to be made, the provisioning scripts that provision the server are changed and a new build is kicked off.
With the concept of immutable servers, we should always be guaranteed that a server’s configuration matches exactly with what the machine image for the server says it does. A server should have the option to be killed and restarted from the machine image without any changes in the service or microservices behavior. This killing and resurrection of a new server was termed “Phoenix Server” by Martin Fowler (http://martinfowler.com/bliki/PhoenixServer.html) because when the old server is killed, the new server should rise from the ashes. The Phoenix server pattern has two key benefits.
First, it exposes and drives configuration drift out of your environment. If you’re constantly tearing down and setting up new servers, you’re more likely to expose configuration drift early. This is a tremendous help in ensuring consistency. I’ve has spent way too much of my time and life away from my family on “critical situation” calls because of configuration drift.
Second, the Phoenix server pattern helps to improve resiliency by helping find situations where a server or service isn’t cleanly recoverable after it has been killed and restarted. Remember, in a microservice architecture your services should be stateless and the death of a server should be a minor blip. Randomly killing and restarting servers quickly exposes situations where you have state in your services or infrastructure. It’s better to find these situations and dependencies early in your deployment pipeline, rather than when you’re on the phone with an angry company.
The organization where I work uses Netflix’s Chaos Monkey (https://github.com/-Netflix/SimianArmy/wiki/Chaos-Monkey) to randomly select and kill servers. Chaos Monkey is an invaluable tool for testing the immutability and recoverability of your microservice environment. Chaos Monkey randomly selects server instances in your environment and kills them. The idea with using Chaos Monkey is that you’re looking for services that can’t recover from the loss of a server, and when a new server is started, it will behave in the same fashion as the server that was killed.
10.4. Your build and deployment pipeline in action
From the general architecture laid out in section 10.3, you can see that there are many moving pieces behind a build/deployment pipeline. Because the purpose of this book is to show you things “in action,” we’re going to walk through the specifics of implementing a build/deployment pipeline for the EagleEye services. Figure 10.16 lays out the different technologies you’re going to use to implement your pipeline:
- GitHub (http://github.com)—GitHub is our source control repository. All the application code for this book is in GitHub. There are two reasons why GitHub was chosen as the source control repository. First, I didn’t want to manage and maintain my own Git source control server. Second, GitHub offers a wide variety of web-hooks and strong REST-based APIs for integrating GitHub into your build process.
- Travis CI (http://travis-ci.org)—Travis CI is the continuous integration engine I used for building and deploying the EagleEye microservices and provisioning the Docker image that will be deployed. Travis CI is a cloud-based, file-based CI engine that’s easy to set up and has strong integration capabilities with GitHub and Docker. While Travis CI isn’t as full-featured as a CI engine like Jenkins (https://jenkins.io), it’s more than adequate for our uses. I describe using GitHub and Travis CI in section 10.5 and 10.6.
- Maven/Spotify Docker Plugin (https://github.com/spotify/docker-maven--plugin)—While we use vanilla Maven to compile, test, and package Java code, a key Maven plug-in we use is Spotify’s Docker plugin. This plugin allows us to kick off the creation of a Docker build right from within Maven.
- Docker (https://www.docker.com/)—I chose Docker as our container platform for two reasons. First, Docker is portable across multiple cloud providers. I can take the same Docker container and deploy it to AWS, Azure, or Cloud Foundry with a minimal amount of work. Second, Docker is lightweight. By the end of this book, you’ve built and deployed approximately 10 Docker containers (including a database server, messaging platform, and a search engine). Deploying the same number of virtual machines on a local desktop would be difficult due to the sheer size and speed of each image. The setup and configuration of Docker, Maven, and Spotify won’t be covered in this chapter, but is instead covered in appendix A.
- Docker Hub (https://hub.docker.com)—After a service has been built and a Docker image has been created, it’s tagged with a unique identifier and pushed to a central repository. For the Docker image repository, I chose to use Docker hub, Docker corporation’s public image repository.
- Python (https://python.org)—For writing the platform tests that are executed before a Docker image is deployed, I chose Python as my tool for writing the platform tests. I’m a firm believer in using the right tools for the job, and frankly, I think Python is a fantastic programming language, especially for writing REST-based test cases.
- Amazon’s EC2 Container Service (ECS)—The final destination for our microservices will be Docker instances deployed to Amazon’s Docker platform. I chose Amazon as my cloud platform because it’s by far the most mature of the cloud providers and makes it trivial to deploy Docker services.
Figure 10.16. Technologies used in the EagleEye build
You might find it a little odd that I wrote the platform tests in Python rather than Java. I did this purposefully. Python (like Groovy) is a fantastic scripting language for writing REST-based test cases. I believe in using the right tool for the job. One of the biggest mind shifts I’ve seen for organizations adopting microservices is that the responsibility for picking the language should lie with the development teams. In too many organizations, I’ve seen a dogmatic embrace of standards (“our enterprise standard is Java . . . and all code must be written in Java”). As a result, I’ve seen development teams jump through hoops to write large amounts of Java code when a 10-line Groovy or Python script would do the job.
The second reason I chose Python is that unlike unit and integration tests, platform tests are truly “black box” tests where you’re acting like an actual API consumer running in a real environment. Unit tests exercise the lowest level of code and shouldn’t have any external dependencies when they run. Integration tests come up a level and test the API, but key external dependencies, like calls to other services, database calls, and so on, are mocked or stubbed out. Platform tests should be truly independent tests of the underlying infrastructure.
10.5. Beginning your build deploy/pipeline: GitHub and Travis CI
Dozens of source control engines and build deploy engines (both on-premise and cloud-based) can implement your build and deploy pipeline. For the examples in this book, I purposely chose GitHub as the source control repository and Travis CI as the build engine. The Git source control repository is an extremely popular repository and GitHub is one of the largest cloud-based source control repositories available today.
Travis CI is a build engine that integrates tightly with GitHub (it also supports Subversion and Mercurial). It’s extremely easy to use and is completely driven off a single configuration file (.travis.yml) in your project’s root directory. Its simplicity and opinionated nature make it easy to get a simple build pipeline off the ground
Up to now, all of the code examples in this book could be run solely from your desktop (with the exception of connectivity out to GitHub). For this chapter, if you want to completely follow the code examples, you’ll need to set up your own GitHub, Travis CI, and Docker hub accounts. We’re not going to walk through how to set up these accounts, but the setup of a personal Travis CI account and your GitHub account can all be done right from the Travis CI web page (http://travis-ci.org).
For the purposes of this book (and my sanity), I set up a separate GitHub repository for each chapter in the book. All the source code for the chapter can be built and deployed as a single unit. However, outside this book, I highly recommend that you set up each microservice in your environment with its own repository with its own independent build processes. This way each service can be deployed independently of one another. With the build process, I’m deploying all of the services as a single unit only because I wanted to push the entire environment to the Amazon cloud with a single build script and not manage build scripts for each individual service.
10.6. Enabling your service to build in Travis CI
At the heart of every service built in this book has been a Maven pom.xml file that’s used to build the Spring Boot service, package it into an executable JAR, and then build a Docker image that can be used to launch the service. Up until this chapter, the compilation and startup of the services occurred by
- Opening a command-line window on your local machine.
- Running the Maven script for the chapter. This builds all the services for the chapter and then packages them into a Docker image that would be pushed to a locally running Docker repository.
- Launching the newly created Docker images from your local Docker repo, by using docker-compose and docker-machine to launch all the services for the chapter.
The question is, how do you repeat this process in Travis CI? It all begins with a single file called .travis.yml. The .travis.yml is a YAML-based file that describes the actions you want taken when Travis CI executes your build. This file is stored in the root directory of your microservice’s GitHub repository. For chapter 10, this file can be found in spmia-chapter10-code/. travis.yml.
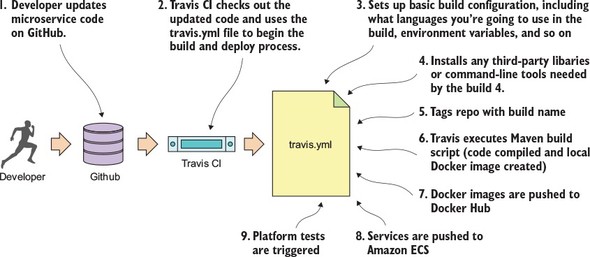
When a commit occurs on a GitHub repository Travis CI is monitoring, it will look for the .travis.yml file and then initiate the build process. Figure 10.17 shows the steps your .travis.yml file will undertake when a commit is made to the GitHub repository used to hold the code for this chapter (https://github.com/carnellj/spmia-chapter10).
- A developer makes a change to one of the microservices in the chapter 10 GitHub repository.
- Travis CI is notified by GitHub that a commit has occurred. This notification configuration occurs seamlessly when you register with Travis and provide your GitHub account notification. Travis CI will start a virtual machine that will be used to execute the build. Travis CI will then check out the source code from GitHub and then use the .travis.yml file to begin the overall build and deploy process.
- Travis CI sets up the basic configuration in the build and installs any dependencies. The basic configuration includes what language you’re going to use in the build (Java), whether you’re going to need Sudo to perform software installs and access to Docker (for creating and tagging Docker containers), setting any secure environment variables needed in the build, and defining how you should be notified on the success or failure of the build.
- Before the actual build is executed, Travis CI can be instructed to install any third-party libraries or command-line tools that might be needed as part of the build process. You use two such tools, the travis and Amazon ecs-cli (EC2 Container Service client) command-line tools.
- For your build process, always begin by tagging the code in the source repository so that at any point in the future you can pull out the complete version of the source code based on the tag for the build.
- Your build process will then execute the Maven scripts for the services. The Maven scripts will compile your Spring microservice, run the unit and integration tests, and then build a Docker image based on the build.
- Once the Docker image for the build is complete, the build process will push the image to the Docker hub with the same tag name you used to tag your source code repository.
- Your build process then will use the project’s docker-compose file and Amazon’s ecs-cli to deploy all the services you’ve built to Amazon’s Docker service, Amazon ECS.
- Once the deploy of the services is complete, your build process will initiate a completely separate Travis CI project that will run the platform tests against the development environment.
Figure 10.17. The concrete steps undertaken by the .travis.yml file to build and deploy your software
Now that we’ve walked through the general steps involved in the .travis.yml file, let’s look at the specifics of your .travis.yml file. Listing 10.1 shows the different pieces of the .travis.yml file.
Note
The code annotations in listing 10.1 are lined up with the numbers in figure 10.17.
Listing 10.1. Anatomy of the .travis.yml build
We’re now going to walk through each of the steps involved in the build process in more detail.
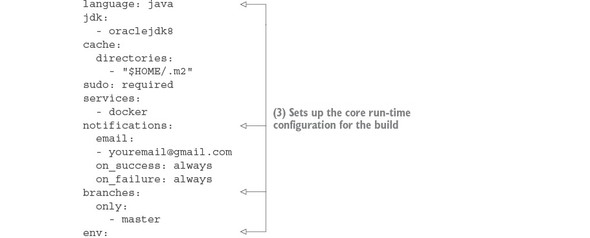
10.6.1. Core build run-time configuration
The first part of the travis.yml file deals with configuring the core runtime configuration of your Travis build. Typically this section of the .travis.yml file will contain Travis-specific functions that will do things like
- Tell Travis what programming language you’re going to be working in
- Define whether you need Sudo access for your build process
- Define whether you want to use Docker in your build process
- Declare secure environment variables you are going to use
The next listing shows this specific section of the build file.
Listing 10.2. Configuring the core run-time for your build
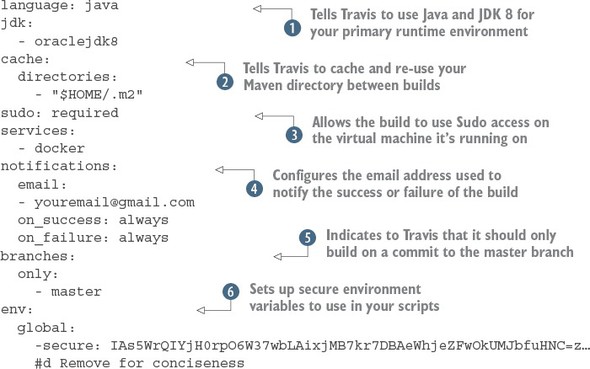
The first thing your Travis build script is doing is telling Travis what primary language is going to be used for performing
the build. By specifying the language as java and jdk attributes as java and oraclejdk8,  Travis will ensure that the JDK is installed and configured for your project.
The next part of your .travis.yml file, the cache.directories attribute  , tells Travis to cache the results of this directory when a build is executed and reuse it across multiple builds. This is
extremely useful when dealing with package managers such as Maven, where it can take a significant amount of time to download
fresh copies of jar dependencies every time a build is kicked off. Without the cache.directories attribute set, the build for this chapter can take up to 10 minutes to download all of the dependent jars.
, tells Travis to cache the results of this directory when a build is executed and reuse it across multiple builds. This is
extremely useful when dealing with package managers such as Maven, where it can take a significant amount of time to download
fresh copies of jar dependencies every time a build is kicked off. Without the cache.directories attribute set, the build for this chapter can take up to 10 minutes to download all of the dependent jars.
The next two attributes in listing 10.2 are the sudo attribute and the service attribute.  The sudo attribute is used to tell Travis that your build process will need to use sudo as part of the build. The UNIX sudo command is used to temporarily elevate a user to root privileges. Generally, you use sudo when you need to install third-party tools. You do exactly this later in the build when you need to install the Amazon ECS
tools.
The sudo attribute is used to tell Travis that your build process will need to use sudo as part of the build. The UNIX sudo command is used to temporarily elevate a user to root privileges. Generally, you use sudo when you need to install third-party tools. You do exactly this later in the build when you need to install the Amazon ECS
tools.
The services attribute is used to tell Travis whether you’re going to use certain key services while executing your build. For instance, if your integration tests need a local database available for them to run, Travis allows you start a MySQL or PostgreSQL database right on your build box. In this case, you need Docker running to build your Docker images for each of your EagleEye services and push your images to the Docker hub. You’ve set the services attribute to start Docker when the build is kicked off.
The next attribute, notifications  defines the communication channel to use whenever a build succeeds or fails. Right now, you always communicate the build
results by setting the notification channel for the build to email. Travis will notify you via email on both the success and
failure of the build. Travis CI can notify via multiple channels besides email, including Slack, IRC, HipChat, or a custom
web hook.
defines the communication channel to use whenever a build succeeds or fails. Right now, you always communicate the build
results by setting the notification channel for the build to email. Travis will notify you via email on both the success and
failure of the build. Travis CI can notify via multiple channels besides email, including Slack, IRC, HipChat, or a custom
web hook.
The branches.only  attribute tells Travis what branches Travis should build against. For the examples in this chapter, you’re only going to
perform a build off the master branch of Git. This prevents you from kicking off a build every time you tag a repo or commit to a branch within GitHub.
This is important because GitHub does a callback into Travis every time you tag a repo or create a release. The presence of
the branches.only attribute being set to master prevents Travis from going into an endless build.
attribute tells Travis what branches Travis should build against. For the examples in this chapter, you’re only going to
perform a build off the master branch of Git. This prevents you from kicking off a build every time you tag a repo or commit to a branch within GitHub.
This is important because GitHub does a callback into Travis every time you tag a repo or create a release. The presence of
the branches.only attribute being set to master prevents Travis from going into an endless build.
The last part of the build configuration is the setting of sensitive environment variables  . In your build process, you might communicate with third-party vendors such as Docker, GitHub, and Amazon. Sometimes you’re
communicating via their command line tools and other times you’re using the APIs. Regardless, you often have to present sensitive
credentials. Travis CI gives you the ability to add encrypted environment variables to protect these credentials.
. In your build process, you might communicate with third-party vendors such as Docker, GitHub, and Amazon. Sometimes you’re
communicating via their command line tools and other times you’re using the APIs. Regardless, you often have to present sensitive
credentials. Travis CI gives you the ability to add encrypted environment variables to protect these credentials.
To add an encrypted environment variable, you must encrypt the environment variable using the travis command line tool on your desk in the project directory where you have your source code. To install the Travis command-line tool locally, review the documentation for the tool at https://github.com/travis-ci/travis.rb. For the .travis.yml used in this chapter, I created and encrypted the following environment variables:
- DOCKER_USERNAME—Docker hub user name.
- DOCKER_PASSWORD—Docker hub password.
- AWS_ACCESS_KEY—AWS access key used by the Amazon ecs-cli command line client.
- AWS_SECRET_KEY—AWS secret key used by the Amazon ecs-cli command-line client.
- GITHUB_TOKEN—GitHub generated token that’s used to indicate the access level the calling-in application is allowed to perform against the server. This token has to be generated first with the GitHub application.
Once the travis tool is installed, the following command will add the encrypted environment variable DOCKER_USERNAME to the env.global section of you .travis.yml file:
travis encrypt DOCKER_USERNAME=somerandomname --add env.global
Once this command is run, you should now see in the env.global section of your .travis.yml file a secure attribute tag followed by a long string of text. Figure 10.18 shows what an encrypted environment variable looks like.
Figure 10.18. Encrypted Travis environment variables are placed directly in the .travis.yml file.
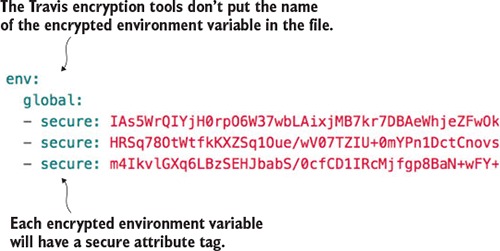
Unfortunately, Travis doesn’t label the names of your encrypted environment variables in your .travis.yml file.
Note
Encrypted variables are only good for the single GitHub repository they’re encrypted in and Travis is building against. You can’t cut and paste an encrypted environment variable across multiple .travis.yml files. Your builds will fail to run because the encrypted environment variables won’t decrypt properly.
Even though all our examples use Travis CI as the build tool, all modern build engines allow you to encrypt your credentials and tokens. Please, please, please make sure you encrypt your credentials. Credentials embedded in a source repository are a common security vulnerability. Don’t rely on the belief that your source control repository is secure and therefore the credentials in it are secure.
10.6.2. Pre-build tool installations
Wow, the pre-build configuration was huge, but the next section is small. Build engines are often a source of a significant amount of “glue code” scripting to tie together different tools used in the build process. With your Travis script, you need to install two command-line tools:
- Travis— This command line tool is used to interact with the Travis build. You’ll use it later in the chapter to retrieve a GitHub token to programmatically trigger another Travis build.
- ecs-cli— This is the command-line tool for interacting with the Amazon Elastic Container service.
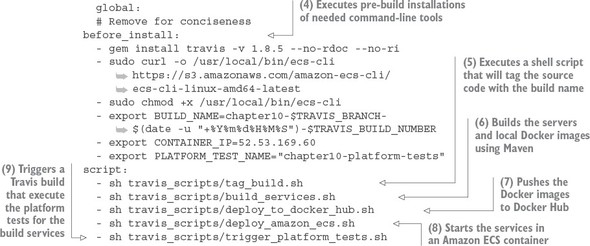
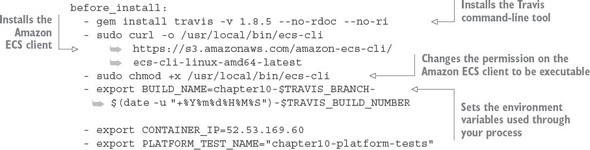
Each item listed in the before_install section of the .travis.yml file is a UNIX command that will be executed before the build kicks off. The following listing shows the before_install attribute along with the commands that need to be run.
Listing 10.3. Pre-build installation steps
The first thing to do in the build process is install the travis command-line tool on the remote build server:
gem install travis -v 1.8.5 --no-rdoc --no-ri
Later on in the build you’re going to kick off another Travis job via the Travis REST API. You need the travis command line tool to get a token for invoking this REST call.
After you’ve installed the travis tool, you’re going to install the Amazon ecs-cli tool. This is a command-line tool used for deploying, starting, and stopping Docker containers running within Amazon. You install the ecs-cli by first downloading the binary and then changing the permission on the downloaded binary to be executable:
- sudo curl -o /usr/local/bin/ecs-cli https://s3.amazonaws.com/amazon-ecs-cli/ecs-cli-linux-amd64-latest
- sudo chmod +x /usr/local/bin/ecs-cli
The last thing you do in the before_install section of the .travis.yml is set three environment variables in your build. These three environment variables will help drive the behavior of your builds. These environment variables are
The actual values set in these environment variables are
- export BUILD_NAME=chapter10-$TRAVIS_BRANCH-$(date -u "+%Y%m%d%H%M%S")-$TRAVIS_BUILD_NUMBER - export CONTAINER_IP=52.53.169.60 - export PLATFORM_TEST_NAME="chapter10-platform-tests"
The first environment variable, BUILD_NAME, generates a unique build name that contains the name of the build, followed by the date and time (down to the seconds field) and then the build number in Travis. This BUILD_NAME will be used to tag your source code in GitHub and your Docker image when it’s pushed to the Docker hub repository.
The second environment variable, CONTAINER_IP, contains the IP address of the Amazon ECS virtual machine that your Docker containers will run on. This CONTAINER_IP will be passed later to another Travis CI job that will execute your platform tests.
Note
I’m not assigning a static IP address to the Amazon ECS server that’s spun. If I tear down the container completely, I’ll be given a new IP. In a real production environment, the servers in your ECS cluster will probably have static (non-changing) IPs assigned to them, and the cluster will have an Amazon Enterprise Load Balancer (ELB) and an Amazon Route 53 DNS name so that the actual IP address of the ECS server would be transparent to the services. However, setting up this much infrastructure is outside the scope of the example I’m trying to demonstrate in this chapter.
The third environment variable, PLATFORM_TEST_NAME, contains the name of the build job being executed. We’ll explore its use later in the chapter.
A common requirement in many financial services and healthcare companies is that they have to prove traceability of the deployed software in production, all the way back through all the lower environments, back to the build job that built the software, and then back to when the code was checked into the source code repository. The immutable server pattern really shines in helping organizations meet this requirement. As you saw in our build example, you tagged the source control repository and the container image that’s going to be deployed with the same build name. That build name is unique and tied into a Travis build number. Because you only promote the container image through each environment and each container image is labeled with the build name, you’ve established traceability of that container image back to the source code associated with it. Because the containers are never changed once they’re tagged, you have a strong audit position to show that the deployed code matches the underlying source code repository. Now, if you wanted to play it extra safe, at the time you labeled the project source code, you could also label the application configuration residing in the Spring Cloud Config repository with the same label generated for the build.
10.6.3. Executing the build
At this point, all the pre-build configuration and dependency installation is complete. To execute your build, you’re going to use the Travis script attribute. Like the before_install attribute, the script attribute takes a list of commands that will be executed. Because these commands are lengthy, I chose to encapsulate each major step in the build into its own shell script and have Travis execute the shell script. The following listing shows the major steps that are going to be undertaken in the build.
Listing 10.4. Executing the build
script:
  - sh travis_scripts/tag_build.sh
  - sh travis_scripts/build_services.sh
  - sh travis_scripts/deploy_to_docker_hub.sh
  - sh travis_scripts/deploy_amazon_ecs.sh
  - sh travis_scripts/trigger_platform_tests.sh
Let’s walk through each of the major steps execute in the script step.
10.6.4. Tagging the source control code
The travis_scripts/tag_build.sh script takes care of tagging code in the repository with a build name. For the example here, I’m creating a GitHub release via the GitHub REST API. A GitHub release will not only tag the source control repository, but will also allow you to post things like release notes to the GitHub web page along with whether the source code is a pre-release of the code.
Because the GitHub release API is a REST-based call, you’ll use curl in your shell script to do the actual invocation. The following listing shows the code from the travis_scripts/tag_build.sh script.
Listing 10.5. Tagging the chapter 10 code repository with the GitHub release API
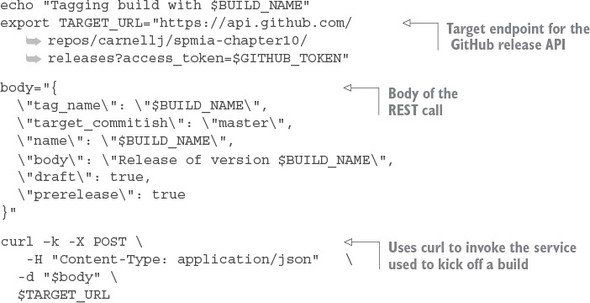
This script is simple. The first thing you do is build the target URL for the GitHub release API:
export TARGET_URL="https://api.github.com/repos/
In the TARGET_URL you’re passing an HTTP query parameter called access_token. This parameter contains a GitHub personal access token set up to specifically allow your script to take action via the REST API. Your GitHub personal access token is stored in an encrypted environment variable called GITHUB_TOKEN. To generate a personal access token, log in to your GitHub account and navigate to https://github.com/settings/tokens. When you generate a token, make sure you cut and paste it right away. When you leave the GitHub screen it will be gone and you’ll need to regenerate it.
The second step in your script is to set up the JSON body for the REST call:
body="{
  \"tag_name\": \"$BUILD_NAME\",
  \"target_commitish\": \"master\",
  \"name\": \"$BUILD_NAME\",
  \"body\": \"Release of version $BUILD_NAME\",
  \"draft\": true,
  \"prerelease\": true
}"
In the previous code snippet you’re supplying the $BUILD_NAME for a tag_name value and the setting basic release notes using the body field.
Once the JSON body for the call is built, executing the call via the curl command is trivial:
curl –k -X POST \
  -H "Content-Type: application/json"   \
  -d "$body" \
  $TARGET_URL
10.6.5. Building the microservices and creating the Docker images
The next step in the Travis script attribute is to build the individual services and then create Docker container images for each service. You do this via a small script called travis_scripts/build_services.sh. This script will execute the following command:
mvn clean package docker:build
This Maven command executes the parent Maven spmia-chapter10-code/pom.xml file for all of the services in the chapter 10 code repository. The parent pom.xml executes the individual Maven pom.xml for each service. Each individual service builds the service source code, executes any unit and integration tests, and then packages the service into an executable jar.
The last thing that happens in the Maven build is the creation of a Docker container image that’s pushed to the local Docker repository running on your Travis build machine. The creation of the Docker image is carried out using the Spotify Docker plugin (https://github.com/spotify/docker-maven-plugin). If you’re interested in how the Spotify Docker plug-in works within the build process, please refer to appendix A, “Setting up your desktop environment”. The Maven build process and the Docker configuration are explained there.
10.6.6. Pushing the images to Docker Hub
At this point in the build, the services have been compiled and packaged and a Docker container image has been created on the Travis build machine. You’re now going to push the Docker container image to a central Docker repository via your travis_scripts/deploy_to_docker_hub.sh script. A Docker repository is like a Maven repository for your created Docker images. Docker images can be tagged and uploaded to it, and other projects can download and use the images.
For this code example, you’re going to use the Docker hub (https://hub.docker.com/). The following listing shows the commands used in the travis_scripts/deploy_to_docker_hub.sh script.
Listing 10.6. Pushing created Docker images to Docker Hub
echo "Pushing service docker images to docker hub ...."
docker login -u $DOCKER_USERNAME -p $DOCKER_PASSWORD
docker push johncarnell/tmx-authentication-service:$BUILD_NAME
docker push johncarnell/tmx-licensing-service:$BUILD_NAME
docker push johncarnell/tmx-organization-service:$BUILD_NAME
docker push johncarnell/tmx-confsvr:$BUILD_NAME
docker push johncarnell/tmx-eurekasvr:$BUILD_NAME
docker push johncarnell/tmx-zuulsvr:$BUILD_NAME
The flow of this shell script is straightforward. The first thing you have to do is log in to Docker hub using the Docker command line-tools and the user credentials of the Docker Hub account the images are going to be pushed to. Remember, your credentials for Docker Hub are stored as encrypted environment variables:
docker login -u $DOCKER_USERNAME -p $DOCKER_PASSWORD
Once the script has logged in, the code will push each individual microservice's Docker image residing in the local Docker repository running on the Travis build server, to the Docker Hub repository:
docker push johncarnell/tmx-confsvr:$BUILD_NAME
In the previous command you tell the Docker command line tool to push to the Docker hub (which is the default hub that the Docker command line tools use) to the johncarnell account. The image being pushed will be the tmx-confsvr image with the tag name of the value from the $BUILD_NAME environment variable.
10.6.7. Starting the services in Amazon ECS
At this point, all of the code has been built and tagged and a Docker image has been created. You’re now ready to deploy your services to the Amazon ECS container you created back in section 10.1.3. The work to do this deployment is found in travis_scripts/deploy_to_amazon_ecs.sh. The following listing shows the code from this script.
Listing 10.7. Deploying Docker Images to EC2
echo "Launching $BUILD_NAME IN AMAZON ECS"
ecs-cli configure --region us-west-1 \
                  --access-key $AWS_ACCESS_KEY
                  --secret-key $AWS_SECRET_KEY
                  --cluster spmia-tmx-dev
ecs-cli compose --file docker/common/docker-compose.yml up
rm –rf ~/.ecs
Note
In the Amazon console, Amazon only shows the name of the state/city/country the region is in and not the actual region name (us-west-1, us-east-1, and so on). For example, if you were to look in the Amazon console and wanted to see the Northern California region, there would be no indication that the region name is us-west-1. For a list of all the Amazon regions (and endpoints for each service), please refer to http://docs.aws.amazon.com/general/latest/gr/rande.html.
Because a new build virtual machine is kicked off by Travis with every build, you need to configure your build environment’s ecs-cli client with your AWS access and secret key. Once that’s complete, you can then kick off a deploy to your ECS cluster using the ecs-cli compose command and a docker-compose.yml file. Your docker-compose.yml is parameterized to use the build name (contained in the environment variable $BUILD_NAME).
10.6.8. Kicking off the platform tests
You have one last step to your build process: kicking off a platform test. After every deployment to a new environment, you kick off a set of platform tests that check to make sure all your services are functioning properly. The goal of the platform tests is to call the microservices in the deployed build and ensure that the services are functioning properly.
I’ve separated the platform test job from the main build so that it can be invoked independently of the main build. To do this, I use the Travis CI REST API to programmatically invoke the platform tests. The travis_scripts/trigger_platform_tests.sh script does this work. The following listing shows the code from this script.
Listing 10.8. Kicking off the platform tests using Travis CI REST API
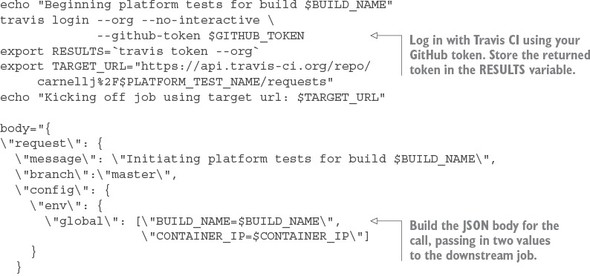
The first thing you do in listing 10.8 is use the Travis CI command-line tool to log in to Travis CI and get an OAuth2 token you can use to call other Travis REST APIs. You store this OAUTH2 token in the $RESULTS environment variable.
Next, you build the JSON body for the REST API call. Your downstream Travis CI job kicks off a series of Python scripts that tests your API. This downstream job expects two environment variables to be set. In the JSON body being built in listing 10.8, you’re passing in two environment variables, $BUILD_NAME and $CONTAINER_IP, that will be passed to your testing job:
\"env\": {
 \"global\": [\"BUILD_NAME=$BUILD_NAME\",
              \"CONTAINER_IP=$CONTAINER_IP\"]
}
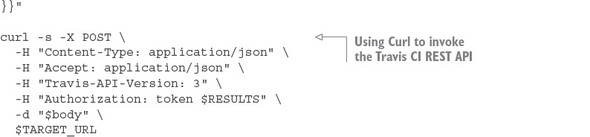
The last action in your script is to invoke the Travis CI build job that runs your platform test scripts. This is done by using the curl command to call the Travis CI REST endpoint for your test job:
 curl -s -X POST \
  -H "Content-Type: application/json" \
  -H "Accept: application/json" \
  -H "Travis-API-Version: 3" \
  -H "Authorization: token $RESULTS" \
  -d "$body" \
  $TARGET_URL
The platform test scripts are stored in a separate GitHub repository called chapter10-platform-tests (https://github.com/carnellj/chapter10-platform-tests). This repository has three Python scripts that test the Spring Cloud Config server, the Eureka server, and the Zuul server. The Zuul server platform tests also test the licensing and organization services. These tests aren’t comprehensive in the sense that they exercise every aspect of the services, but they do exercise enough of the service to ensure they’re functioning.
Note
We’re not going to walk through the platform tests. The tests are straightforward and a walk-through of the tests would not add a significant amount of value to this chapter.
10.7. Closing thoughts on the build/deployment pipeline
As this chapter (and the book) closes out, I hope you’ve gained an appreciation for the amount of work that goes into building a build/deployment pipeline. A well-functioning build and deployment pipeline is critical to the deployment of services. The success of your microservice architecture depends on more than just the code involved in the service:
- Understand that the code in this build/deploy pipeline is simplified for the purposes of this book. A good build/deployment pipeline will be much more generalized. It will be supported by the DevOps team and broken into a series of independent steps (compile > package > deploy > test) that the development teams can use to “hook” their microservice build scripts into.
- The virtual machine imaging process used in this chapter is simplistic, with each microservice being built using a Docker file to define the software that’s going to be installed on the Docker container. Many shops will use provisioning tools like Ansible (https://github.com/ansible/ansible), Puppet (https://github.com/puppetlabs/puppet), or Chef (https://github.com/chef/chef) to install and configure the operating systems onto the virtual machine or container images being built.
- The cloud deployment topology for your application has been consolidated to a single server. In the real build/deployment pipeline, each microservice would have its own build scripts and would be deployed independently of each other to a cluster ECS container.
10.8. Summary
- The build and deployment pipeline is a critical part of delivering microservices. A well-functioning build and deployment pipeline should allow new features and bug fixes to be deployed in minutes.
- The build and deployment pipeline should be automated with no direct human interaction to deliver a service. Any manual part of the process represents an opportunity for variability and failure.
- The build and deployment pipeline automation does require a great deal of scripting and configuration to get right. The amount of work needed to build it shouldn’t be underestimated.
- The build and deployment pipeline should deliver an immutable virtual machine or container image. Once a server image has been created, it should never be modified.
- Environment-specific server configuration should be passed in as parameters at the time the server is set up.