
![]()
For online information and ordering of this and other Manning books, please visit www.manning.com. The publisher offers discounts on this book when ordered in quantity. For more information, please contact
       Special Sales Department
       Manning Publications Co.
       20 Baldwin Road
       PO Box 761
       Shelter Island, NY 11964
       Email: orders@manning.com
©2017 by Manning Publications Co. All rights reserved.
No part of this publication may be reproduced, stored in a retrieval system, or transmitted, in any form or by means electronic, mechanical, photocopying, or otherwise, without prior written permission of the publisher.
Many of the designations used by manufacturers and sellers to distinguish their products are claimed as trademarks. Where those designations appear in the book, and Manning Publications was aware of a trademark claim, the designations have been printed in initial caps or all caps.
 Recognizing the importance of preserving what has been written, it is Manning’s policy to have the books we publish printed
on acid-free paper, and we exert our best efforts to that end. Recognizing also our responsibility to conserve the resources
of our planet, Manning books are printed on paper that is at least 15 percent recycled and processed without the use of elemental
chlorine.
Recognizing the importance of preserving what has been written, it is Manning’s policy to have the books we publish printed
on acid-free paper, and we exert our best efforts to that end. Recognizing also our responsibility to conserve the resources
of our planet, Manning books are printed on paper that is at least 15 percent recycled and processed without the use of elemental
chlorine.
 |
Manning Publications Co. 20 Baldwin Road PO Box 761 Shelter Island, NY 11964 |
Acquisition editor: Greg Wild
Development editor: Marina Michaels
Technical development editor: Raphael Villela
Copyeditor: Katie Petito
Proofreader: Melody Dolab
Technical proofreader: Joshua White
Review editor: Aleksandar Dragosavljevic
Typesetter: Marija Tudor
Cover designer: Marija Tudor
ISBN 9781617293986
Printed in the United States of America
1 2 3 4 5 6 7 8 9 10 – EBM – 22 21 20 19 18 17
To my brother Jason, who even in his darkest moments showed me the true meaning of strength and dignity. You are a role model as a brother, husband, and father.
Chapter 1. Welcome to the cloud, Spring
Chapter 2. Building microservices with Spring Boot
Chapter 3. Controlling your configuration with Spring Cloud configuration server
Chapter 4. On service discovery
Chapter 5. When bad things happen: client resiliency patterns with Spring Cloud and Netflix Hystrix
Chapter 6. Service routing with Spring Cloud and Zuul
Chapter 7. Securing your microservices
Chapter 8. Event-driven architecture with Spring Cloud Stream
Chapter 9. Distributed tracing with Spring Cloud Sleuth and Zipkin
Chapter 10. Deploying your microservices
Chapter 1. Welcome to the cloud, Spring
1.2. What is Spring and why is it relevant to microservices?
1.3. What you’ll learn in this book
1.4. Why is this book relevant to you?
1.5. Building a microservice with Spring Boot
1.6. Why change the way we build applications?
1.7. What exactly is the cloud?
1.8. Why the cloud and microservices?
1.9. Microservices are more than writing the code
1.9.1. Core microservice development pattern
1.9.2. Microservice routing patterns
1.9.3. Microservice client resiliency patterns
1.9.4. Microservice security patterns
1.10. Using Spring Cloud in building your microservices
1.10.3. Spring Cloud service discovery
1.10.4. Spring Cloud/Netflix Hystrix and Ribbon
Chapter 2. Building microservices with Spring Boot
2.1. The architect’s story: designing the microservice architecture
2.1.1. Decomposing the business problem
2.2. When not to use microservices
2.3. The developer’s tale: building a microservice with Spring Boot and Java
2.3.1. Getting started with the skeleton project
2.3.2. Booting your Spring Boot application: writing the Bootstrap class
2.3.3. Building the doorway into the microservice: the Spring Boot controller
2.4. The DevOps story: building for the rigors of runtime
2.4.1. Service assembly: packaging and deploying your microservices
2.4.2. Service bootstrapping: managing configuration of your microservices
2.4.3. Service registration and discovery: how clients communicate with your microservices
Chapter 3. Controlling your configuration with Spring Cloud configuration server
3.1. On managing configuration (and complexity)
3.2. Building our Spring Cloud configuration server
3.2.1. Setting up the Spring Cloud Config Bootstrap class
3.2.2. Using Spring Cloud configuration server with the filesystem
3.3. Integrating Spring Cloud Config with a Spring Boot client
3.3.1. Setting up the licensing service Spring Cloud Config server dependencies
3.3.2. Configuring the licensing service to use Spring Cloud Config
3.3.3. Wiring in a data source using Spring Cloud configuration server
3.3.4. Directly Reading Properties using the @Value Annotation
3.3.5. Using Spring Cloud configuration server with Git
3.3.6. Refreshing your properties using Spring Cloud configuration server
3.4. Protecting sensitive configuration information
3.4.1. Download and install Oracle JCE jars needed for encryption
3.4.2. Setting up an encryption key
3.4.3. Encrypting and decrypting a property
3.4.4. Configure microservices to use encryption on the client side
Chapter 4. On service discovery
4.2. On service discovery in the cloud
4.2.1. The architecture of service discovery
4.2.2. Service discovery in action using Spring and Netflix Eureka
4.3. Building your Spring Eureka Service
4.4. Registering services with Spring Eureka
4.5. Using service discovery to look up a service
4.5.1. Looking up service instances with Spring DiscoveryClient
4.5.2. Invoking services with Ribbon-aware Spring RestTemplate
Chapter 5. When bad things happen: client resiliency patterns with Spring Cloud and Netflix Hystrix
5.1. What are client-side resiliency patterns?
5.2. Why client resiliency matters
5.4. Setting up the licensing server to use Spring Cloud and Hystrix
5.5. Implementing a circuit breaker using Hystrix
5.7. Implementing the bulkhead pattern
5.8. Getting beyond the basics; fine-tuning Hystrix
5.9. Thread context and Hystrix
Chapter 6. Service routing with Spring Cloud and Zuul
6.1. What is a services gateway?
6.2. Introducing Spring Cloud and Netflix Zuul
6.2.1. Setting up the Zuul Spring Boot project
6.3. Configuring routes in Zuul
6.3.1. Automated mapping routes via service discovery
6.3.2. Mapping routes manually using service discovery
6.3.3. Manual mapping of routes using static URLs
6.4. The real power of Zuul: filters
6.5. Building your first Zuul pre-filter generating correlation IDs
6.6. Building a post filter receiving correlation IDs
6.7. Building a dynamic route filter
6.7.1. Building the skeleton of the routing filter
Chapter 7. Securing your microservices
7.2. Starting small: using Spring and OAuth2 to protect a single endpoint
7.2.1. Setting up the EagleEye OAuth2 authentication service
7.2.2. Registering client applications with the OAuth2 service
7.3. Protecting the organization service using OAuth2
7.3.1. Adding the Spring Security and OAuth2 jars to the individual services
7.3.2. Configuring the service to point to your OAuth2 authentication service
7.4. JavaScript Web Tokens and OAuth2
7.4.1. Modifying the authentication service to issue JavaScript Web Tokens
7.4.2. Consuming JavaScript Web Tokens in your microservices
7.5. Some closing thoughts on microservice security
Use HTTPS/Secure Sockets Layer (SSL) for all service communication
Use a services gateway to access your microservices
Zone your services into a public API and private API
Limit the attack surface of your microservices by locking down unneeded network ports
Chapter 8. Event-driven architecture with Spring Cloud Stream
8.1. The case for messaging, EDA, and microservices
8.1.1. Using synchronous request-response approach to communicate state change
8.1.2. Using messaging to communicate state changes between services
8.2. Introducing Spring Cloud Stream
8.3. Writing a simple message producer and consumer
8.3.1. Writing the message producer in the organization service
8.3.2. Writing the message consumer in the licensing service
8.4. A Spring Cloud Stream use case: distributed caching
8.4.1. Using Redis to cache lookups
8.4.2. Defining custom channels
8.4.3. Bringing it all together: clearing the cache when a message is received
Chapter 9. Distributed tracing with Spring Cloud Sleuth and Zipkin
9.1. Spring Cloud Sleuth and the correlation ID
9.1.1. Adding Spring Cloud sleuth to licensing and organization
9.2. Log aggregation and Spring Cloud Sleuth
9.2.1. A Spring Cloud Sleuth/Papertrail implementation in action
9.2.2. Create a Papertrail account and configure a syslog connector
9.2.3. Redirecting Docker output to Papertrail
9.2.4. Searching for Spring Cloud Sleuth trace IDs in Papertrail
9.2.5. Adding the correlation ID to the HTTP response with Zuul
9.3. Distributed tracing with Open Zipkin
9.3.1. Setting up the Spring Cloud Sleuth and Zipkin dependencies
9.3.2. Configuring the services to point to Zipkin
9.3.3. Installing and configuring a Zipkin server
9.3.5. Using Zipkin to trace transactions
9.3.6. Visualizing a more complex transaction
Chapter 10. Deploying your microservices
10.1. EagleEye: setting up your core infrastructure in the cloud
10.1.1. Creating the PostgreSQL database using Amazon RDS
10.2. Beyond the infrastructure: deploying EagleEye
10.3. The architecture of a build/deployment pipeline
10.4. Your build and deployment pipeline in action
10.5. Beginning your build deploy/pipeline: GitHub and Travis CI
10.6. Enabling your service to build in Travis CI
10.6.1. Core build run-time configuration
10.6.2. Pre-build tool installations
10.6.4. Tagging the source control code
10.6.5. Building the microservices and creating the Docker images
10.6.6. Pushing the images to Docker Hub
Appendix A. Running a cloud on your desktop
A.2. Downloading the projects from GitHub
A.4. Building and compiling the projects
Appendix B. OAuth2 grant types
It’s ironic that in writing a book, the last part of the book you write is often the beginning of the book. It’s also often the most difficult part to put down on paper. Why? Because you have to explain to everyone why you’re so passionate about a subject that you spent the last one and a half years of your life writing a book about it. It’s hard to articulate why anyone would spend such a large amount of time on a technical book. One rarely writes software books for the money or the fame.
Here’s the reason why I wrote this book: I love writing code. It’s a calling for me and it’s also a creative activity—akin to drawing, painting, or playing an instrument. Those outside the field of software development have a hard time understanding this. I especially like building distributed applications. For me, it’s an amazing thing to see an application work across dozens (even hundreds) of servers. It’s like watching an orchestra playing a piece of music. While the final product of an orchestra is beautiful, the making of it is often a lot of hard work and requires a significant amount of practice. The same goes for writing a massively distributed application.
Since I entered the software development field 25 years ago, I’ve watched the industry struggle with the “right” way to build distributed applications. I’ve seen distributed service standards such as CORBA rise and fall. Monstrously big companies have tried to push big and, often, proprietary protocols. Anyone remember Microsoft’s Distributed Component Object Model (DCOM) or Oracle’s J2EE’s Enterprise Java Beans 2 (EJB)? I watched as technology companies and their followers rushed to build service-oriented architectures (SOA) using heavy XML-based schemas.
In each case, these approaches for building distributed systems often collapsed under their own weight. I’m not saying that these technologies weren’t used to build some very powerful applications. The reality is that they couldn’t keep up with the demand of the users. Ten years ago, smartphones were just being introduced to the market and cloud computing was in the earliest stage of infancy. Also, the standards and technology for distributed application development were too complicated for the average developer to understand and easily use in practice. Nothing speaks truth in the software development industry like written code. When the standards get in the way of this, the standards quickly get discarded.
When I first heard of the microservices approach to building applications I was more than a little skeptical. “Great, another silver-bullet approach to building distributed applications,” I thought. However, as I started diving into the concepts, I realized the simplicity of microservices could be a game changer. A microservice architecture focuses on building small services that use simple protocols (HTTP and JSON) to communicate. That’s it. You can write a microservice with nearly any programming language. There’s beauty in this simplicity.
However, while building an individual microservice is easy, operationalizing and scaling it is difficult. Getting hundreds of small distributed components to work together and then building a resilient application from them can be incredibly difficult to do. In distributed computing, failure is a fact of life and how your application deals with it is incredibly difficult to get right. To paraphrase my colleagues Chris Miller and Shawn Hagwood: “If it’s not breaking once in a while, you’re not building.”
It’s these failures that inspired me to write this book. I hate to build things from scratch when I don’t have to. The reality is that Java is the lingua franca for most application development efforts, especially in the enterprise. The Spring framework has for many organizations become the de facto framework for most application development. I’d already been doing application development in Java for almost 20 years (I remember the Dancing Duke applet) and Spring for almost 10 years. As I began my microservices journey, I was delighted and excited to watch the emergence of Spring Cloud.
The Spring Cloud framework provides out-of-the-box solutions for many of the common development and operational problems you’ll run into as a microservice developer. Spring Cloud lets you use only the pieces you need and minimizes the amount of work you need to do to build and deploy production-ready Java micro-services. It does this by using other battle-hardened technologies from companies and groups such as Netflix, HashiCorp, and the Apache foundation.
I’ve always considered myself an average developer who, at the end of the day, has deadlines to meet. That’s why I undertook the project of writing this book. I wanted a book that I could use in my day-to-day work. I wanted something with direct (and hopefully) straightforward code examples. I always want to make sure that the material in this book can be consumed as individual chapters or in its entirety. I hope you find this book useful and I hope you enjoy reading it as much as I enjoyed writing it.
As I sit down to write these acknowledgments, I can’t help but think back to 2014 when I ran my first marathon. Writing a book is a lot like running a marathon. Writing the proposal and the outline for the book is much like the training process. It gets your thoughts in shape, it focuses you for what’s ahead and, yes, near the end of the process, it can be more than a little tedious and brutal.
When you start writing the book, it’s a lot like race day. You start the marathon excited and full of energy. You know you’re trying to do something bigger than anything you might have done before and it’s both exciting and nerve-wracking. This is what you’ve trained for, but at the same time, there’s always that small voice of doubt in the back of your mind that says you won’t finish what you started.
What I’ve learned from running is that races aren’t completed one mile at a time. Instead, they’re run one foot in front of the other. The miles run are the sum of the individual footsteps. When my children are struggling with something, I laugh and ask them, “How do you write a book? One word, one single step at a time.” They usually roll their eyes, but in the end there’s no other way around this indisputable and ironclad law.
However, when you run a marathon, you might be the one running the race, but you’re never running it alone. There’s a whole team of people there to give you support, time, and advice along the way. It has been the same experience writing this book.
I’d like to start by thanking Manning for the support they gave me in writing this book. It started with Greg Wild, my acquisitions editor, who patiently worked with me as I refined the core concepts in this book and guided me through the proposal process. Along the way, Marina Michaels, my development editor, kept me honest and challenged me to become a better author. I’d also like to thank Raphael Villela and Joshua White, my technical editors, who constantly checked my work and ensured the overall quality of the examples and the code I produced. I’m extremely grateful for the time, talent, and commitment each of these individuals put into into the overall project. I’d also like to thank the reviewers who provided feedback on the manuscript throughout the writing and development process: Aditya Kumar, Adrian M. Rossi, Ashwin Raj, Christian Bach, Edgar Knapp, Jared Duncan, Jiri Pik, John Guthrie, Mirko Bernardoni, Paul Balogh, Pierluigi Riti, Raju Myadam, Rambabu Posa, Sergey Evsikov, and Vipul Gupta.
I want to close these acknowledgments with a deep sense of thanks for the love and time my family has given me in working on this project. To my wife Janet, you have been my best friend and the love of my life. When I’m tired and want to give up, I only have to listen for the sound of your footsteps next to me to know that you’re always running beside me, never telling me no, and always pushing me forward.
To my son Christopher, you’re growing up to be an incredible young man. I cannot wait for the day when you truly discover your passion, because there will be nothing in this world that can stop you from reaching your goals.
To my daughter Agatha, I’d give all the money I have to see the world through your eyes for just 10 minutes. The experience would make me a better author and more importantly a better person. Your intellect, your power of observation, and creativity humble me.
To my four-year-old son, Jack: Buddy, thank you being patient with me whenever I said, “I can’t play right now because Daddy has to work on the book.” You always make me laugh and you make this whole family complete. Nothing makes me happier than when I see you being the jokester and playing with everyone in the family.
My race with this book is done. Like my marathon, I’ve left nothing on the table in writing this book. I have nothing but gratitude for the Manning team and the MEAP readers who bought this book early and gave me so much valuable feedback. I hope in the end that you enjoy this book as much as I enjoyed writing it. Thank you.
Spring Microservices in Action was written for the practicing Java/Spring developer who needs hands-on advice and examples of how to build and operationalize microservice-based applications. When I wrote this book, I wanted it to be based around core microservice patterns that aligned with Spring Boot and Spring Cloud examples that demonstrated the patterns in action. As such, you’ll find specific microservice design patterns discussed in almost every chapter, along with examples of the patterns implemented using Spring Boot and Spring Cloud.
Spring Microservices in Action consists of 10 chapters and two appendixes:
Spring Microservices in Action includes code in every chapter. All code examples are available in my GitHub repository, and each chapter has its own repository. You can find an overview page with links to each chapter’s code repository at https://github.com/carnellj/spmia_overview. A zip containing all source code is also available from the publisher’s website at www.manning.com/books/spring-microservices-in-action.
All code in this book is built to run on Java 8 using Maven as the main build tool. Please refer to appendix A of this book for full details on the software tools you’ll need to compile and run the code examples.
One of the core concepts I followed as I wrote this book was that the code examples in each chapter should run independently of those in the other chapters. As such, every service we create for a chapter builds to a corresponding Docker image. When code from previous chapters is used, it’s included as both source and a built Docker image. We use Docker compose and the built Docker images to guarantee that you have a reproducible run-time environment for every chapter.
This book contains many examples of source code both in numbered listings and in line with normal text. In both cases, source code is formatted in a fixed-width font like this to separate it from ordinary text. Sometimes code is also in bold to highlight code that has changed from previous steps in the chapter, such as when a new feature adds to an existing line of code.
In many cases, the original source code has been reformatted; we’ve added line breaks and reworked indentation to accommodate
the available page space in the book. In rare cases, even this wasn’t enough, and listings include line-continuation markers
( ). Additionally, comments in the source code have often been removed from the listings when the code is described in the text.
Code annotations accompany many of the listings, highlighting important concepts.
). Additionally, comments in the source code have often been removed from the listings when the code is described in the text.
Code annotations accompany many of the listings, highlighting important concepts.
Purchase of Spring Microservices in Action includes free access to a private web forum run by Manning Publications where you can make comments about the book, ask technical questions, and receive help from the author and from other users. To access the forum and subscribe to it, point your web browser to www.manning.com/books/spring-microservices-in-action. This page provides information on how to get on the forum once you’re registered, what kind of help is available, and the rules of conduct on the forum.
Manning’s commitment to our readers is to provide a venue where a meaningful dialog between individual readers and between readers and the author can take place. It is not a commitment to any specific amount of participation on the part of the author, whose contributions to the AO remain voluntary (and unpaid). We suggest you ask the author challenging questions, lest his interest stray!

JOHN CARNELL is a senior cloud engineer at Genesys, where he works in Genesys’s PureCloud division. John spends the majority of his day hands-on building telephony-based microservices using the AWS platform. His day-to-day job centers on designing and building microservices across a number of technology platforms including Java, Clojure, and Go.
John is a prolific speaker and writer. He regularly speaks at local user groups and has been a regular speaker on “The No Fluff Just Stuff Software Symposium.” Over the last 20 years, John has authored, co-authored, and been a technical reviewer for a number of Java-based technology books and industry publications.
John holds a Bachelor of the Arts (BA) from Marquette University and a Masters of Business Administration (MBA) from the University of Wisconsin Oshkosh.
John is a passionate technologist and is constantly exploring new technologies and programming languages. When John isn’t speaking, writing, or coding, he lives with his wife Janet, his three children, Christopher, Agatha, and Jack, and yes, his dog Vader, in Cary, North Carolina.
During his free time (which there’s very little of) John runs, chases after his children, and studies Filipino martial arts.
John can be reached at john_carnell@yahoo.com.
The figure on the cover of Spring Microservices in Action is captioned a “A Man from Croatia.” This illustration is taken from a recent reprint of Balthasar Hacquet’s Images and Descriptions of Southwestern and Eastern Wenda, Illyrians, and Slavs, published by the Ethnographic Museum in Split, Croatia, in 2008. Hacquet (1739–1815) was an Austrian physician and scientist who spent many years studying the botany, geology, and ethnography of many parts of the Austrian Empire, as well as the Veneto, the Julian Alps, and the western Balkans, inhabited in the past by peoples of the Illyrian tribes. Hand drawn illustrations accompany the many scientific papers and books that Hacquet published.
The rich diversity of the drawings in Hacquet’s publications speaks vividly of the uniqueness and individuality of the eastern Alpine and northwestern Balkan regions just 200 years ago. This was a time when the dress codes of two villages separated by a few miles identified people uniquely as belonging to one or the other, and when members of a social class or trade could be easily distinguished by what they were wearing. Dress codes have changed since then and the diversity by region, so rich at the time, has faded away. It is now often hard to tell the inhabitant of one continent from another, and today the inhabitants of the picturesque towns and villages in the Slovenian Alps or Balkan coastal towns are not readily distinguishable from the residents of other parts of Europe.
We at Manning celebrate the inventiveness, the initiative, and the fun of the computer business with book covers based on costumes from two centuries ago, brought back to life by illustrations such as this one.
The one constant in the field of software development is that we as software developers sit in the middle of a sea of chaos and change. We all feel the churn as new technologies and approaches appear suddenly on the scene, causing us to reevaluate how we build and deliver solutions for our customers. One example of this churn is the rapid adoption by many organizations of building applications using microservices. Microservices are distributed, loosely coupled software services that carry out a small number of well-defined tasks.
This book introduces you to the microservice architecture and why you should consider building your applications with them. We’re going to look at how to build microservices using Java and two Spring framework projects: Spring Boot and Spring Cloud. If you’re a Java developer, Spring Boot and Spring Cloud will provide an easy migration path from building traditional, monolithic Spring applications to microservice applications that can be deployed to the cloud.
Before the concept of microservices evolved, most web-based applications were built using a monolithic architectural style. In a monolithic architecture, an application is delivered as a single deployable software artifact. All the UI (user interface), business, and database access logic are packaged together into a single application artifact and deployed to an application server.
While an application might be a deployed as a single unit of work, most of the time there will be multiple development teams working on the application. Each development team will have their own discrete pieces of the application they’re responsible for and oftentimes specific customers they’re serving with their functional piece. For example, when I worked at a large financial services company, we had an in-house, custom-built customer relations management (CRM) application that involved the coordination of multiple teams including the UI, the customer master, the data warehouse, and the mutual funds team. Figure 1.1 illustrates the basic architecture of this application.
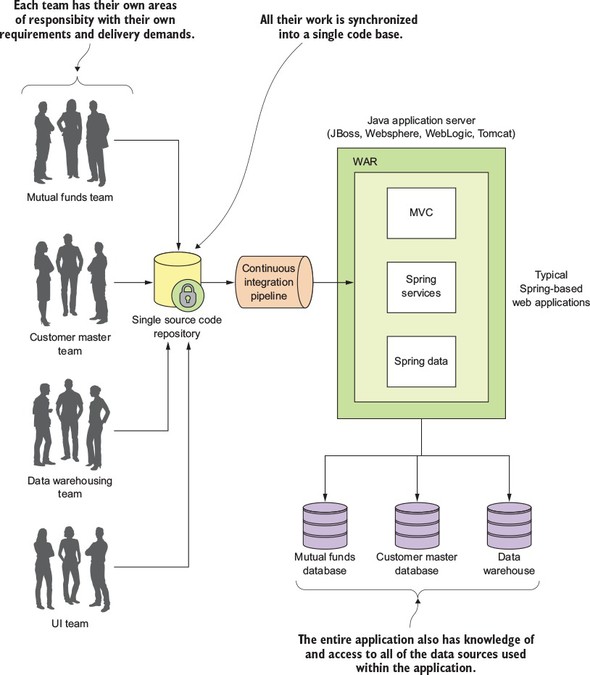
The problem here is that as the size and complexity of the monolithic CRM application grew, the communication and coordination costs of the individual teams working on the application didn’t scale. Every time an individual team needed to make a change, the entire application had to be rebuilt, retested and redeployed.
The concept of a microservice originally crept into the software development community’s consciousness around 2014 and was a direct response to many of the challenges of trying to scale both technically and organizationally large, monolithic applications. Remember, a microservice is a small, loosely coupled, distributed service. Microservices allow you to take a large application and decompose it into easy-to--manage components with narrowly defined responsibilities. Microservices help combat the traditional problems of complexity in a large code base by decomposing the large code base down into small, well-defined pieces. The key concept you need to embrace as you think about microservices is decomposing and unbundling the functionality of your applications so they’re completely independent of one another. If we take the CRM application we saw in figure 1.1 and decompose it into microservices, it might look like what’s shown in figure 1.2.
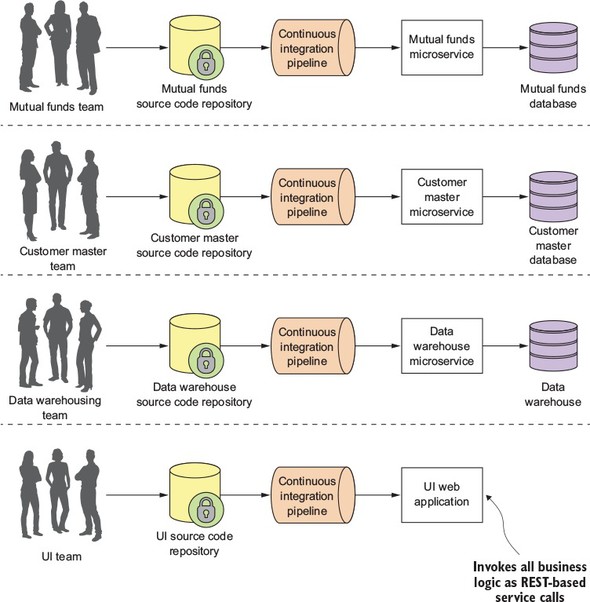
Looking at figure 1.2, you can see that each functional team completely owns their service code and service infrastructure. They can build, deploy, and test independently of each other because their code, source control repository, and the infrastructure (app server and database) are now completely independent of the other parts of the application.
A microservice architecture has the following characteristics:
I often joke with my colleagues that microservices are the gateway drug for building cloud applications. You start building microservices because they give you a high degree of flexibility and autonomy with your development teams, but you and your team quickly find that the small, independent nature of microservices makes them easily deployable to the cloud. Once the services are in the cloud, their small size makes it easy to start up large numbers of instances of the same service, and suddenly your applications become more scalable and, with forethought, more resilient.
Spring has become the de facto development framework for building Java-based applications. At its core, Spring is based on the concept of dependency injection. In a normal Java application, the application is decomposed into classes where each class often has explicit linkages to other classes in the application. The linkages are the invocation of a class constructor directly in the code. Once the code is compiled, these linkage points can’t be changed.
This is problematic in a large project because these external linkages are brittle and making a change can result in multiple downstream impacts to other code. A dependency injection framework, such as Spring, allows you to more easily manage large Java projects by externalizing the relationship between objects within your application through convention (and annotations) rather than those objects having hard-coded knowledge about each other. Spring sits as an intermediary between the different Java classes of your application and manages their dependencies. Spring essentially lets you assemble your code together like a set of Lego bricks that snap together.
Spring’s rapid inclusion of features drove its utility, and the framework quickly became a lighter weight alternative for enterprise application Java developers looking for a way to building applications using the J2EE stack. The J2EE stack, while powerful, was considered by many to be bloatware, with many features that were never used by application development teams. Further, a J2EE application forced you to use a full-blown (and heavy) Java application server to deploy your applications.
What’s amazing about the Spring framework and a testament to its development community is its ability to stay relevant and reinvent itself. The Spring development team quickly saw that many development teams were moving away from monolithic applications where the application’s presentation, business, and data access logic were packaged together and deployed as a single artifact. Instead, teams were moving to highly distributed models where services were being built as small, distributed services that could be easily deployed to the cloud. In response to this shift, the Spring development team launched two projects: Spring Boot and Spring Cloud.
Spring Boot is a re-envisioning of the Spring framework. While it embraces core features of Spring, Spring Boot strips away many of the “enterprise” features found in Spring and instead delivers a framework geared toward Java-based, REST-oriented (Representational State Transfer)[1] microservices. With a few simple annotations, a Java developer can quickly build a REST microservice that can be packaged and deployed without the need for an external application container.
While we cover REST later in chapter 2, it’s worthwhile to read Roy Fielding’s PHD dissertation on building REST-based applications (http://www.ics.uci.edu/~fielding/pubs/dissertation/top.htm). It’s still one of the best explanations of REST available.
While we cover REST in more detail in chapter 2, the core concept behind REST is that your services should embrace the use of the HTTP verbs (GET, POST, PUT, and DELETE) to represent the core actions of the service and use a lightweight web-oriented data serialization protocol, such as JSON, for requesting and receiving data from the service.
Because microservices have become one of the more common architectural patterns for building cloud-based applications, the Spring development community has given us Spring Cloud. The Spring Cloud framework makes it simple to operationalize and deploy microservices to a private or public cloud. Spring Cloud wraps several popular cloud-management microservice frameworks under a common framework and makes the use and deployment of these technologies as easy to use as annotating your code. I cover the different components within Spring Cloud later in this chapter.
This book is about building microservice-based applications using Spring Boot and Spring Cloud that can be deployed to a private cloud run by your company or a public cloud such as Amazon, Google, or Pivotal. With this book, we cover with hands-on examples
By the time you’re done reading this book, you should have the knowledge needed to build and deploy a Spring Boot-based microservice. You’ll also understand the key design decisions need to operationalize your microservices. You’ll understand how service configuration management, service discovery, messaging, logging and tracing, and security all fit together to deliver a robust microservices environment. Finally, you’ll see how your microservices can be deployed within a private or public cloud.
If you’ve gotten this far into reading chapter 1, I suspect that
I chose to write this book for two reasons. First, while I’ve seen many good books on the conceptual aspects of microservices, I couldn’t a find a good Java-based book on implementing microservices. While I’ve always considered myself a programming language polyglot (someone who knows and speaks several languages), Java is my core development language and Spring has been the development framework I “reach” for whenever I build a new application. When I first came across Spring Boot and Spring Cloud, I was blown away. Spring Boot and Spring Cloud greatly simplified my development life when it came to building microservice-based applications running in the cloud.
Second, as I’ve worked throughout my career as both an architect and engineer, I’ve found that many times the technology books that I purchase have tended to go to one of two extremes. They are either conceptual without concrete code examples, or are mechanical overviews of a particular framework or programming language. I wanted a book that would be a good bridge and middle ground between the architecture and engineering disciplines. As you read this book, I want to give you a solid introduction to the microservice patterns development and how they’re used in real-world application development, and then back these patterns up with practical and easy-to-understand code examples using Spring Boot and Spring Cloud.
Let’s shift gears for a moment and walk through building a simple microservice using Spring Boot.
I’ve always had the opinion that a software development framework is well thought out and easy to use if it passes what I affectionately call the “Carnell Monkey Test.” If a monkey like me (the author) can figure out a framework in 10 minutes or less, it has promise. That’s how I felt the first time I wrote a sample Spring Boot service. I want you to have to the same experience and joy, so let’s take a minute to see how to write a simple “Hello World” REST-service using Spring Boot.
In this section, we’re not going to do a detailed walkthrough of much of the code presented. Our goal is to give you a taste of writing a Spring Boot service. We’ll go into much more detail in chapter 2.
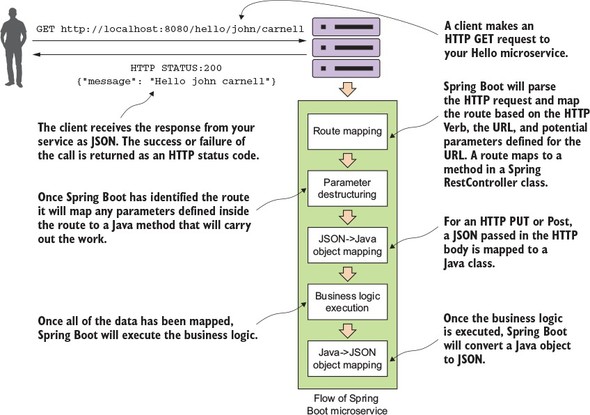
Figure 1.3 shows what your service is going to do and the general flow of how Spring Boot microservice will process a user’s request.
This example is by no means exhaustive or even illustrative of how you should build a production-level microservice, but it should cause you to take a pause because of how little code it took to write it. We’re not going to go through how to set up the project build files or the details of the code until chapter 2. If you’d like to see the Maven pom.xml file and the actual code, you can find it in the chapter 1 section of the downloadable code. All the source code for chapter 1 can be retrieved from the GitHub repository for the book at https://github.com/carnellj/spmia-chapter1.
Please make sure you read appendix A before you try to run the code examples for the chapters in this book. Appendix A covers the general pro-ject layout of all the projects in the book, how to run the build scripts, and how to fire up the Docker environment. The code examples in this chapter are simple and designed to be run natively right from your desktop without the information in additional chapters. However, in later chapters you’ll quickly begin using Docker to run all the services and infrastructure used in this book. Don’t go too far into the book without reading appendix A on setting up your desktop environment.
For this example, you’re going to have a single Java class called simpleservice/src/com/thoughtmechanix/application/simpleservice/Application.java that will be used to expose a REST endpoint called /hello.
The following listing shows the code for Application.java.
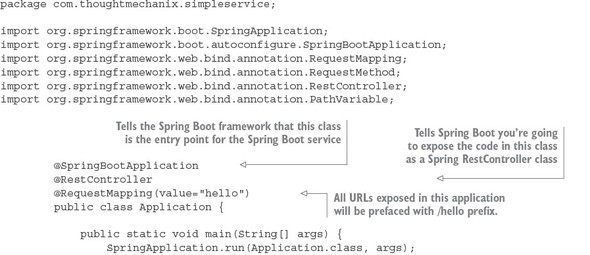
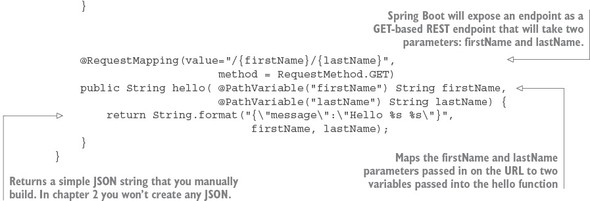
In listing 1.1 you’re basically exposing a single GET HTTP endpoint that will take two parameters (firstName and lastName) on the URL and then return a simple JSON string that has a payload containing the message “Hello firstName lastName”. If you were to call the endpoint /hello/john/carnell on your service (which I’ll show shortly) the return of the call would be
{"message":"Hello john carnell"}
Let’s fire up your service. To do this, go to the command prompt and issue the following command:
mvn spring-boot:run
This command, mvn, will use a Spring Boot plug-in to start the application using an embedded Tomcat server.
The Spring Boot framework has strong support for both Java and the Groovy programming languages. You can build microservices with Groovy and no project setup. Spring Boot also supports both Maven and the Gradle build tools. I’ve limited the examples in this book to Java and Maven. As a long-time Groovy and Gradle aficionado, I have a healthy respect for the language and the build tool, but to keep the book manageable and the material focused, I’ve chosen to go with Java and Maven to reach the largest audience possible.
If everything starts correctly, you should see what’s shown in figure 1.4 from your command-line window.
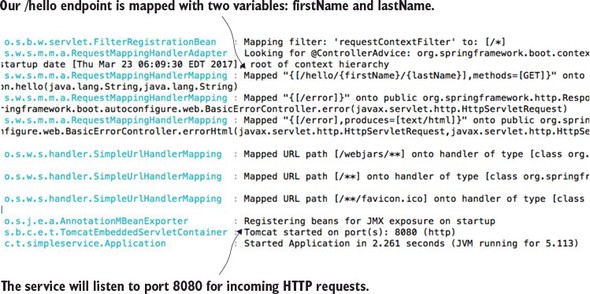
If you examine the screen in figure 1.4, you’ll notice two things. First, a Tomcat server was started on port 8080. Second, a GET endpoint of /hello/{firstName}/{lastName} is exposed on the server.
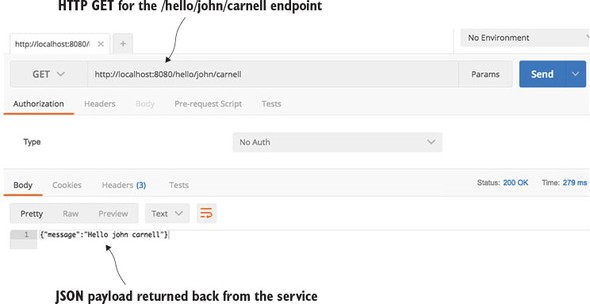
You’re going to call your service using a browser-based REST tool called POSTMAN (https://www.getpostman.com/). Many tools, both graphical and command line, are available for invoking a REST-based service, but I’ll use POSTMAN for all my examples in this book. Figure 1.5 shows the POSTMAN call to the http://localhost:8080/hello/john/carnell endpoint and the results returned from the service.
Obviously, this simple example doesn’t demonstrate the full power of Spring Boot. But what it should show is that you can write a full HTTP JSON REST-based service with route-mapping of URL and parameters in Java with as few as 25 lines of code. As any experienced Java developer will tell you, writing anything meaningful in 25 lines of code in Java is extremely difficult. Java, while being a powerful language, has acquired a reputation of being wordy compared to other languages.
We’re done with our brief tour of Spring Boot. We now have to ask this question: because we can write our applications using a microservice approach, does this mean we should? In the next section, we’ll walk through why and when a microservice approach is justified for building your applications.
We’re at an inflection point in history. Almost all aspects of modern society are now wired together via the internet. Companies that used to serve local markets are suddenly finding that they can reach out to a global customer base. However, with a larger global customer base also comes global competition. These competitive pressures mean the following forces are impacting the way developers have to think about building applications:
To meet these expectations, we, as application developers, have to embrace the paradox that to build high-scalable and highly redundant applications we need to break our applications into small services that can be built and deployed independently of one another. If we “unbundle” our applications into small services and move them away from a single monolithic artifact, we can build systems that are
To this end, as we begin our discussion of microservices keep the following in mind:
Small, Simple, and Decoupled Services = Scalable, Resilient, and Flexible Applications
The term “cloud” has become overused. Every software vendor has a cloud and everyone’s platform is cloud-enabled, but if you cut through the hype, three basic models exist in cloud-based computing. These are
To better understand these concepts, let’s map the everyday task of making a meal to the different models of cloud computing. When you want to eat a meal, you have four choices:
Figure 1.6 shows each model.
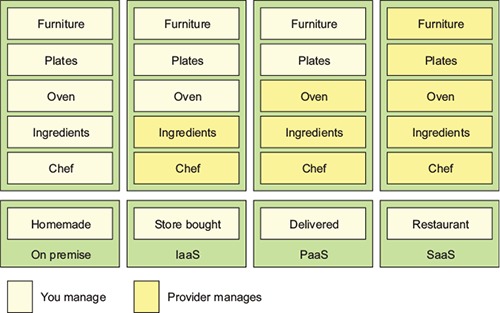
The difference between these options is about who’s responsible for cooking these meals and where the meal is going to be cooked. In the on-premise model, eating a meal at home requires you to do all the work, using your own oven and ingredients already in the home. A store-bought meal is like using the Infrastructure as a Service (IaaS) model of computing. You’re using the store’s chef and oven to pre-bake the meal, but you’re still responsible for heating the meal and eating it at the house (and cleaning up the dishes afterward).
In a Platform as a Service (PaaS) model you still have responsibility for the meal, but you further rely on a vendor to take care of the core tasks associated with making a meal. For example, in a PaaS model, you supply the plates and furniture, but the restaurant owner provides the oven, ingredients, and the chef to cook them. In the Software as a Service (SaaS) model, you go to a restaurant where all the food is prepared for you. You eat at the restaurant and then you pay for the meal when you’re done. you also have no dishes to prepare or wash.
The key items at play in each of these models are ones of control: who’s responsible for maintaining the infrastructure and what are the technology choices available for building the application? In a IaaS model, the cloud vendor provides the basic infrastructure, but you’re accountable for selecting the technology and building the final solution. On the other end of the spectrum, with a SaaS model, you’re a passive consumer of the service provided by the vendor and have no input on the technology selection or any accountability to maintain the infrastructure for the application.
I’ve documented the three core cloud platform types (IaaS, PaaS, SaaS) that are in use today. However, new cloud platform types are emerging. These new platforms include Functions as a Service (FaaS) and Container as a Service (CaaS). FaaS-based (https://en.wikipedia.org/wiki/Function_as_a_Service) applications use technologies like Amazon’s Lambda technologies and Google Cloud functions to build applications deployed as “serverless” chunks of code that run completely on the cloud provider’s platform computing infrastructure. With a FaaS platform, you don’t have to manage any server infrastructure and only pay for the computing cycles required to execute the function.
With the Container as a Service (CaaS) model, developers build and deploy their microservices as portable virtual containers (such as Docker) to a cloud provider. Unlike an IaaS model, where you the developer have to manage the virtual machine the service is deployed to, with CaaS you’re deploying your services in a lightweight virtual container. The cloud provider runs the virtual server the container is running on as well as the provider’s comprehensive tools for building, deploying, monitoring, and scaling containers. Amazon’s Elastic Container Service (ECS) is an example of a CaaS-based platform. In chapter 10 of this book, we’ll see how to deploy the microservices you’ve built to Amazon ECS.
It’s important to note that with both the FaaS and CaaS models of cloud computing, you can still build a microservice-based architecture. Remember, the concept of microservices revolves around building small services, with limited responsibility, using an HTTP-based interface to communicate. The emerging cloud computing platforms, such as FaaS and CaaS, are really about alternative infrastructure mechanisms for deploying microservices.
One of the core concepts of a microservice-based architecture is that each service is packaged and deployed as its own discrete and independent artifact. Service instances should be brought up quickly and each instance of the service should be indistinguishable from another.
As a developer writing a microservice, sooner or later you’re going to have to decide whether your service is going to be deployed to one of the following:
The advantage of cloud-based microservices centers around the concept of elasticity. Cloud service providers allow you to quickly spin up new virtual machines and containers in a matter of minutes. If your capacity needs for your services drop, you can spin down virtual servers without incurring any additional costs. Using a cloud provider to deploy your microservices gives you significantly more horizontal scalability (adding more servers and service instances) for your applications. Server elasticity also means that your applications can be more resilient. If one of your microservices is having problems and is falling over, spinning up new service instances can you keep your application alive long enough for your development team to gracefully resolve the issue.
For this book, all the microservices and corresponding service infrastructure will be deployed to an IaaS-based cloud provider using Docker containers. This is a common deployment topology used for microservices:
Earlier in the chapter we discussed three types of cloud platforms (Infrastructure as a Service, Platform as a Service, and Software as a Services). For this book, I’ve chosen to focus specifically on building microservices using an IaaS-based approach. While certain cloud providers will let you abstract away the deployment infrastructure for your microservice, I’ve chosen to remain vendor-independent and deploy all parts of my application (including the servers).
For instance, Amazon, Cloud Foundry, and Heroku give you the ability to deploy your services without having to know about the underlying application container. They provide a web interface and APIs to allow you to deploy your application as a WAR or JAR file. Setting up and tuning the application server and the corresponding Java container are abstracted away from you. While this is convenient, each cloud provider’s platform has different idiosyncrasies related to its individual PaaS solution.
An IaaS approach, while more work, is portable across multiple cloud providers and allows us to reach a wider audience with our material. Personally, I’ve found that PaaS-based cloud solutions can allow you to quickly jump start your development effort, but once your application reaches enough microservices, you start to need the flexibility the IaaS style of cloud development provides.
Earlier in the chapter, I mentioned new cloud computing platforms such as Function as a Service (FaaS) and Container as a Service (CaaS). If you’re not careful, FaaS-based platforms can lock your code into a cloud vendor platform because your code is deployed to a vendor-specific runtime engine. With a FaaS-based model, you might be writing your service using a general programming language (Java, Python, JavaScript, and so on), but you’re still tying yourself heavily to the underlying vendor APIs and runtime engine that your function will be deployed to.
The services built in this book are packaged as Docker containers. One of the reasons why I chose Docker is that as a container technology, Docker is deployable to all the major cloud providers. Later in chapter 10, I demonstrate how to package microservices using Docker and then deploy these containers to Amazon’s cloud platform.
While the concepts around building individual microservices are easy to understand, running and supporting a robust microservice application (especially when running in the cloud) involves more than writing the code for the service. Writing a robust service includes considering several topics. Figure 1.7 highlights these topics.
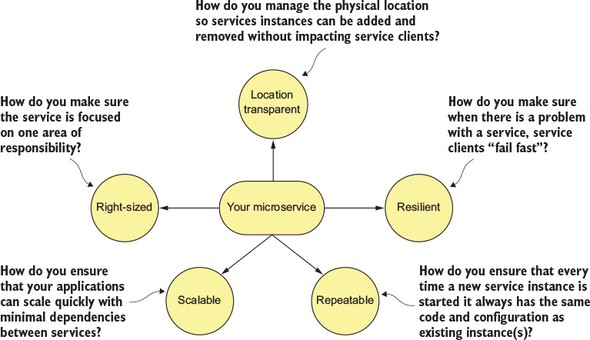
Let’s walk through the items in figure 1.7 in more detail:
This book takes a patterns-based approach as we answer these questions. With a patterns-based approach, we lay out common designs that can be used across different technology implementations. While we’ve chosen to use Spring Boot and Spring Cloud to implement the patterns we’re going to use in this book, nothing will keep you from taking the concepts presented here and using them with other technology platforms. Specifically, we cover the following six categories of microservice patterns:
Let’s walk through these patterns in more detail.
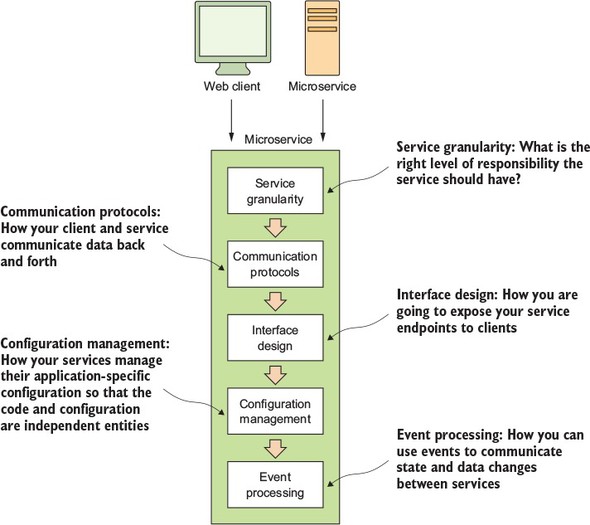
The core development microservice development pattern addresses the basics of building a microservice. Figure 1.8 highlights the topics we’ll cover around basic service design.
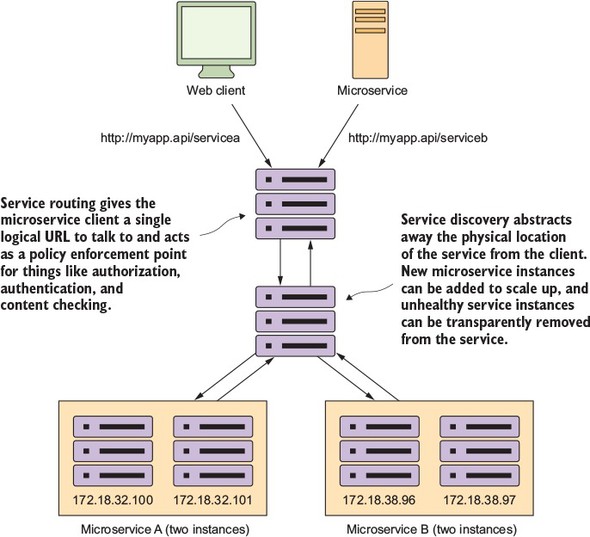
The microservice routing patterns deal with how a client application that wants to consume a microservice discovers the location of the service and is routed over to it. In a cloud-based application, you might have hundreds of microservice instances running. You’ll need to abstract away the physical IP address of these services and have a single point of entry for service calls so that you can consistently enforce security and content policies for all service calls.
Service discovery and routing answer the question, “How do I get my client’s request for a service to a specific instance of a service?”
In figure 1.9, service discovery and service routing appear to have a hard-coded sequence of events between them (first comes service routing and the service discovery). However, the two patterns aren’t dependent on one another. For instance, we can implement service discovery without service routing. You can implement service routing without service discovery (even though its implementation is more difficult).
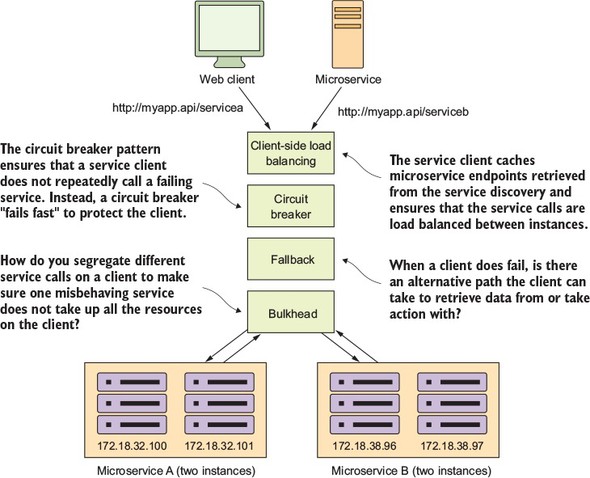
Because microservice architectures are highly distributed, you have to be extremely sensitive in how you prevent a problem in a single service (or service instance) from cascading up and out to the consumers of the service. To this end, we’ll cover four client resiliency patterns:
Figure 1.10 shows how these patterns protect the consumer of service from being impacted when a service is misbehaving. I cover these four topics in chapter 5.
I can’t write a book on microservices without talking about microservice security. In chapter 7 we’ll cover three basic security patterns. These patterns are
Figure 1.11 shows how you can implement the three patterns described previously to build an authentication service that can protect your microservices.
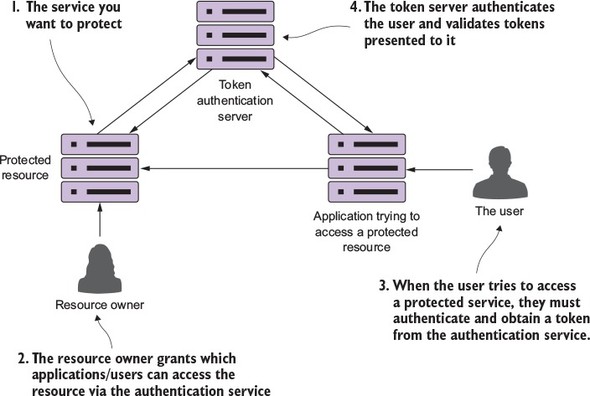
At this point I’m not going to go too deeply into the details of figure 1.10. There’s a reason why security requires a whole chapter. (It could honestly be a book in itself.)
The beauty of the microservice architecture is that a monolithic application is broken down into small pieces of functionality that can be deployed independently of one another. The downside of a microservice architecture is that it’s much more difficult to debug and trace what the heck is going on within your application and services.
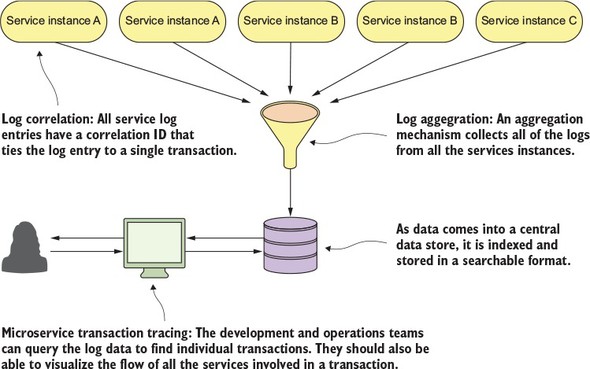
For this reason, we’ll look at three core logging and tracing patterns:
Figure 1.12 shows how these patterns fit together. We’ll cover the logging and tracing patterns in greater detail in chapter 9.
One of the core parts of a microservice architecture is that each instance of a microservice should be identical to all its other instances. You can’t allow “configuration drift” (something changes on a server after it’s been deployed) to occur, because this can introduce instability in your applications.
“I made only one small change on the stage server, but I forgot to make the change in production.” The resolution of many down systems when I’ve worked on critical situations teams over the years has often started with those words from a developer or system administrator. Engineers (and most people in general) operate with good intentions. They don’t go to work to make mistakes or bring down systems. Instead they’re doing the best they can, but they get busy or distracted. They tweak something on a server, fully intending to go back and do it in all the environments.
At a later point, an outage occurs and everyone is left scratching their heads wondering what’s different between the lower environments in production. I’ve found that the small size and limited scope of a microservice makes it the perfect opportunity to introduce the concept of “immutable infrastructure” into an organization: once a service is deployed, the infrastructure it’s running on is never touched again by human hands.
An immutable infrastructure is a critical piece of successfully using a microservice architecture, because you have to guarantee in production that every microservice instance you start for a particular microservice is identical to its brethren.
To this end, our goal is to integrate the configuration of your infrastructure right into your build-deployment process so that you no longer deploy software artifacts such as a Java WAR or EAR to an already-running piece of infrastructure. Instead, you want to build and compile your microservice and the virtual server image it’s running on as part of the build process. Then, when your microservice gets deployed, the entire machine image with the server running on it gets deployed.
Figure 1.13 illustrates this process. At the end of the book we’ll look at how to change your build and deployment pipeline so that your microservices and the servers they run on are deployed as a single unit of work. In chapter 10 we cover the following patterns and topics:
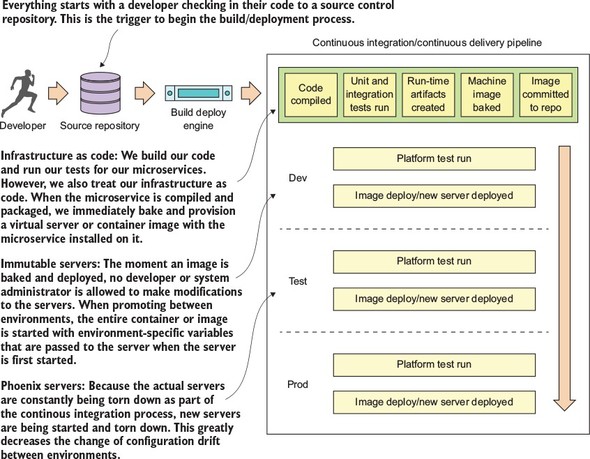
Our goal with these patterns and topics is to ruthlessly expose and stamp out configuration drift as quickly as possible before it can hit your upper environments, such as stage or production.
For the code examples in this book (except chapter 10), everything will run locally on your desktop machine. The first two chapters can be run natively directly from the command line. Starting in chapter 3, all the code will be compiled and run as Docker containers.
In this section, I briefly introduce the Spring Cloud technologies that you’ll use as you build out your microservices. This is a high-level overview; when you use each technology in this book, I’ll teach you the details on each as needed.
Implementing all these patterns from scratch would be a tremendous amount of work. Fortunately for us, the Spring team has integrated a wide number of battle-tested open source projects into a Spring subproject collectively known as Spring Cloud. (http://projects.spring.io/spring-cloud/).
Spring Cloud wraps the work of open source companies such as Pivotal, HashiCorp, and Netflix in delivering patterns. Spring Cloud simplifies setting up and configuring of these projects into your Spring application so that you can focus on writing code, not getting buried in the details of configuring all the infrastructure that can go with building and deploying a microservice application.
Figure 1.14 maps the patterns listed in the previous section to the Spring Cloud projects that implement them.
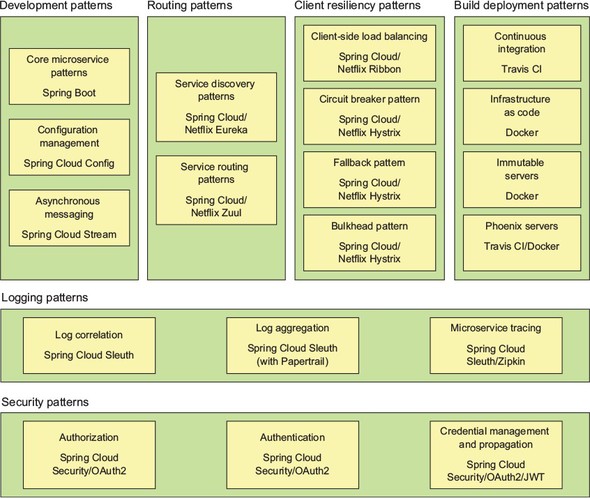
Let’s walk through these technologies in greater detail.
Spring Boot is the core technology used in our microservice implementation. Spring Boot greatly simplifies microservice development by simplifying the core tasks of building REST-based microservices. Spring Boot also greatly simplifies mapping HTTP-style verbs (GET, PUT, POST, and DELETE) to URLs and the serialization of the JSON protocol to and from Java objects, as well as the mapping of Java exceptions back to standard HTTP error codes.
Spring Cloud Config handles the management of application configuration data through a centralized service so your application configuration data (particularly your environment specific configuration data) is cleanly separated from your deployed microservice. This ensures that no matter how many microservice instances you bring up, they’ll always have the same configuration. Spring Cloud Config has its own property management repository, but also integrates with open source projects such as the following:
With Spring Cloud service discovery, you can abstract away the physical location (IP and/or server name) of where your servers are deployed from the clients consuming the service. Service consumers invoke business logic for the servers through a logical name rather than a physical location. Spring Cloud service discovery also handles the registration and deregistration of services instances as they’re started up and shut down. Spring Cloud service discovery can be implemented using Consul (https://www.consul.io/) and Eureka (https://github.com/Netflix/eureka) as its service discovery engine.
Spring Cloud heavily integrates with Netflix open source projects. For microservice client resiliency patterns, Spring Cloud wraps the Netflix Hystrix libraries (https://github.com/Netflix/Hystrix) and Ribbon project (https://github.com/Netflix/Ribbon) and makes using them from within your own microservices trivial to implement.
Using the Netflix Hystrix libraries, you can quickly implement service client resiliency patterns such as the circuit breaker and bulkhead patterns.
While the Netflix Ribbon project simplifies integrating with service discovery agents such as Eureka, it also provides client-side load-balancing of service calls from a service consumer. This makes it possible for a client to continue making service calls even if the service discovery agent is temporarily unavailable.
Spring Cloud uses the Netflix Zuul project (https://github.com/Netflix/zuul) to provide service routing capabilities for your microservice application. Zuul is a service gateway that proxies service requests and makes sure that all calls to your microservices go through a single “front door” before the targeted service is invoked. With this centralization of service calls, you can enforce standard service policies such as a security authorization authentication, content filtering, and routing rules.
Spring Cloud Stream (https://cloud.spring.io/spring-cloud-stream/) is an enabling technology that allows you to easily integrate lightweight message processing into your microservice. Using Spring Cloud Stream, you can build intelligent microservices that can use asynchronous events as they occur in your application. With Spring Cloud Stream, you can quickly integrate your microservices with message brokers such as RabbitMQ (https://www.rabbitmq.com/) and Kafka (http://kafka.apache.org/).
Spring Cloud Sleuth (https://cloud.spring.io/spring-cloud-sleuth/) allows you to integrate unique tracking identifiers into the HTTP calls and message channels (RabbitMQ, Apache Kafka) being used within your application. These tracking numbers, sometimes referred to as correlation or trace ids, allow you to track a transaction as it flows across the different services in your application. With Spring Cloud Sleuth, these trace IDs are automatically added to any logging statements you make in your microservice.
The real beauty of Spring Cloud Sleuth is seen when it’s combined with logging aggregation technology tools such as Papertrail (http://papertrailapp.com) and tracing tools such as Zipkin (http://zipkin.io). Papertail is a cloud-based logging platform used to aggregate logs in real time from different microservices into one queryable database. Open Zipkin takes data produced by Spring Cloud Sleuth and allows you to visualize the flow of your service calls involved for a single transaction.
Spring Cloud Security (https://cloud.spring.io/spring-cloud-security/) is an authentication and authorization framework that can control who can access your services and what they can do with your services. Spring Cloud Security is token-based and allows services to communicate with one another through a token issued by an authentication server. Each service receiving a call can check the provided token in the HTTP call to validate the user’s identity and their access rights with the service.
In addition, Spring Cloud Security supports the JavaScript Web Token (https://jwt.io). The JavaScript Web Token (JWT) framework standardizes the format of how a OAuth2 token is created and provides standards for digitally signing a created token.
For the provisioning implementations, we’re going to make a technology shift. The Spring framework(s) are geared toward application development. The Spring frameworks (including Spring Cloud) don’t have tools for creating a “build and deployment” pipeline. To implement a “build and deployment” pipeline you’re going to use the following tools: Travis CI (https://travis-ci.org) for your build tool and Docker (https://www.docker.com/) to build the final server image containing your microservice.
To deploy your built Docker containers, we end the book with an example of how to deploy the entire application stack built throughout this book to Amazon’s cloud.
In the last section, we walked through all the different Spring Cloud technologies that you’re going to use as you build out your microservices. Because each of these technologies are independent services, it’s obviously going to take more than one chapter to explain all of them in detail. However, as I wrap up this chapter, I want to leave you with a small code example that again demonstrates how easy it is to integrate these technologies into your own microservice development effort.
Unlike the first code example in listing 1.1, you can’t run this code example because a number of supporting services need to be set up and configured to be used. Don’t worry, though; the setup costs for these Spring Cloud services (configuration service, service discovery) are a one-time cost in terms of setting up the service. Once they’re set up, your individual microservices can use these capabilities over and over again. We couldn’t fit all that goodness into a single code example at the beginning of the book.
The code shown in the following listing quickly demonstrates how the service discovery, circuit breaker, bulkhead, and client-side load balancing of remote services were integrated into our “Hello World” example.
This code has a lot packed into it, so let’s walk through it. Keep in mind that this listing is only an example and isn’t found in the chapter 1 GitHub repository source code. I’ve included it here to give you a taste of what’s to come later in the book.
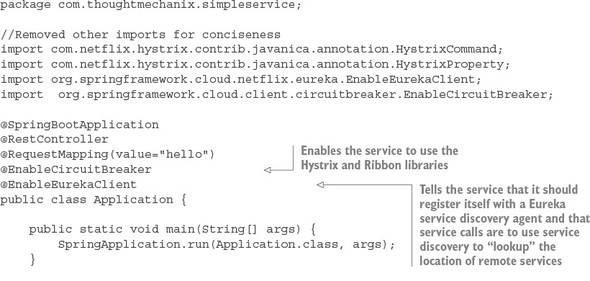
The first thing you should notice is the @EnableCircuitBreaker and @EnableEurekaClient annotations. The @EnableCircuitBreaker annotation tells your Spring microservice that you’re going to use the Netflix Hystrix libraries in your application. The @EnableEurekaClient annotation tells your microservice to register itself with a Eureka Service Discovery agent and that you’re going to use service discovery to look up remote REST services endpoints in your code. Note that configuration is happening in a property file that will tell the simple service the location and port number of a Eureka server to contact. You first see Hystrix being used when you declare your hello method:
@HystrixCommand(threadPoolKey = "helloThreadPool")
public String helloRemoteServiceCall(String firstName, String lastName)
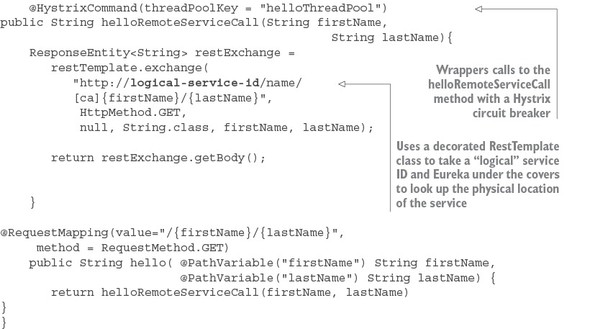
The @HystrixCommand annotation is doing two things. First, any time the helloRemoteServiceCall method is called, it won’t be directly invoked. Instead, the method will be delegated to a thread pool managed by Hystrix. If the call takes too long (default is one second), Hystrix steps in and interrupts the call. This is the implementation of the circuit breaker pattern. The second thing this annotation does is create a thread pool called helloThreadPool that’s managed by Hystrix. All calls to helloRemoteServiceCall method will only occur on this thread pool and will be isolated from any other remote service calls being made.
The last thing to note is what’s occurring inside the helloRemoteServiceCall method. The presence of the @EnableEurekaClient has told Spring Boot that you’re going to use a modified RestTemplate class (this isn’t how the Standard Spring RestTemplate would work out of the box) whenever you make a REST service call. This RestTemplate class will allow you to pass in a logical service ID for the service you’re trying to invoke:
ResponseEntity<String> restExchange = restTemplate.exchange (http://logical-service-id/name/{firstName}/{lastName}
Under the covers, the RestTemplate class will contact the Eureka service and look up the physical location of one or more of the “name” service instances. As a consumer of the service, your code never has to know where that service is located.
Also, the RestTemplate class is using Netflix’s Ribbon library. Ribbon will retrieve a list of all the physical endpoints associated with a service. Every time the service is called by the client, it “round-robins” the call to the different service instances on the client without having to go through a centralized load balancer. By eliminating a centralized load balancer and moving it to the client, you eliminate another failure point (load balancer going down) in your application infrastructure.
I hope that at this point you’re impressed, because you’ve added a significant number of capabilities to your microservice with only a few annotations. That’s the real beauty behind Spring Cloud. You as a developer get to take advantage of battle-hardened microservice capabilities from premier cloud companies like Netflix and Consul. These capabilities, if used outside of Spring Cloud, can be complex and obtuse to set up. Spring Cloud simplifies their use to literally nothing more than a few simple Spring Cloud annotations and configuration entries.
I want to make sure this book provides examples that you can relate to as you go about your day-to-day job. To this end, I’ve structured the chapters in this book and the corresponding code examples around the adventures (misadventures) of a fictitious company called ThoughtMechanix.
ThoughtMechanix is a software development company whose core product, EagleEye, provides an enterprise-grade software asset management application. It provides coverage for all the critical elements: inventory, software delivery, license management, compliance, cost, and resource management. Its primary goal is to enable organizations to gain an accurate point-in-time picture of its software assets.
The company is approximately 10 years old. While they’ve experienced solid revenue growth, internally they’re debating whether they should be re-platforming their core product from a monolithic on-premise-based application or move their application to the cloud. The re-platforming involved with EagleEye can be a “make or break” moment for a company.
The company is looking at rebuilding their core product EagleEye on a new architecture. While much of the business logic for the application will remain in place, the application itself will be broken down from a monolithic design to a much smaller microservice design whose pieces can be deployed independently to the cloud. The examples in this book won’t build the entire ThoughtMechanix application. Instead you’ll build specific microservices from the problem domain at hand and then build the infrastructure that will support these services using various Spring Cloud (and some non-Spring-Cloud) technologies.
The ability to successfully adopt cloud-based, microservice architecture will impact all parts of a technical organization. This includes the architecture, engineering, testing, and operations teams. Input will be needed from each group and, in the end, they’re probably going to need reorganization as the team reevaluates their responsibilities in this new environment. Let’s start our journey with ThoughtMechanix as you begin the fundamental work of identifying and building out several of the microservices used in EagleEye and then building these services using Spring Boot.
The history of software development is littered with the tales of large development projects that after an investment of millions of dollars and hundreds of thousands of software developer hours, and with many of the best and brightest minds in the industry working on them, somehow never managed to deliver anything of value to their customers and literally collapsed under their own complexity and weight.
These mammoth projects tended to follow large, traditional waterfall development methodologies that insisted that all the application’s requirements and design be defined at the beginning of the project. So much emphasis was placed on getting all the specifications for the software “correct” that there was little leeway to meet new business requirements, or refactor and learn from mistakes made in the early stages of development.
The reality, though, is that software development isn’t a linear process of definition and execution, but rather an evolutionary one where it takes several iterations of communicating with, learning from, and delivering to the customer before the development team truly understands the problem at hand.
Compounding the challenges of using traditional waterfall methodologies is that many times the granularity of the software artifacts being delivered in these projects are
A microservice-based architecture takes a different approach to delivering functionality. Specifically, microservice-based architectures have these characteristics:
Why are these microservice architecture attributes important to cloud-based development? Cloud-based applications in general have the following:
This chapter provides you with the foundation you need to target and identify microservices in your business problem, build the skeleton of a microservice, and then understand the operational attributes that need to be in place for a microservice to be deployed and managed successfully in production.
To successfully design and build microservices, you need to approach microservices as if you’re a police detective interviewing witnesses to a crime. Even though every witness saw the same events take place, their interpretation of the crime is shaped by their background, what was important to them (for example, what motivates them), and what environmental pressures were brought to bear at that moment they witnessed the event. Participants each have their own perspectives (and biases) of what they consider important.
Like a successful police detective trying to get to the truth, the journey to build a successful microservice architecture involves incorporating the perspectives of multiple individuals within your software development organization. Although it takes more than technical people to deliver an entire application, I believe that the foundation for successful microservice development starts with the perspectives of three critical roles:
In this chapter, I’ll demonstrate how to design and build a set of microservices from the perspective of each of these roles using Spring Boot and Java. By the time the chapter concludes, you’ll have a service that can be packaged and deployed to the cloud.
An architect’s role on a software project is to provide a working model of the problem that needs to be solved. The job of the architect is to provide the scaffolding against which developers will build their code so that all the pieces of the application fit together.
When building a microservices architecture, a project’s architect focuses on three key tasks:
In the face of complexity, most people try to break the problem on which they’re working into manageable chunks. They do this so they don’t have to try to fit all the details of the problem in their heads. Instead, they break the problem down abstractly into a few key parts and then look for the relationships that exist between these parts.
In a microservices architecture, the architect breaks the business problem into chunks that represent discrete domains of activity. These chunks encapsulate the business rules and the data logic associated with a particular part of the business domain.
Although you want microservices to encapsulate all the business rules for carrying out a single transaction, this isn’t always feasible. You’ll often have situations where you need to have groups of microservices working across different parts of the business domain to complete an entire transaction. An architect teases apart the service boundaries of a set of microservices by looking at where the data domain doesn’t seem to fit together.
For example, an architect might look at a business flow that’s to be carried out by code and realize that they need both customer and product information. The presence of two discrete data domains is a good indication that multiple microservices are at play. How the two different parts of the business transaction interact usually becomes the service interface for the microservices.
Breaking apart a business domain is an art form rather than a black-and-white science. Use the following guidelines for identifying and decomposing a business problem into microservice candidates:
Let’s take these guidelines and apply them to a real-world problem. Chapter 1 introduced an existing software product called EagleEye that’s used for managing software assets such as software licenses and secure socket layer (SSL) certificates. These items are deployed to various servers throughout an organization.
EagleEye is a traditional monolithic web application that’s deployed to a J2EE application server residing within a customer’s data center. Your goal is to tease apart the existing monolithic application into a set of services.
You’re going to start by interviewing all the users of the EagleEye application and discussing with them how they interact and use EagleEye. Figure 2.1 captures a summary of the conversations you might have with the different business customers. By looking at how the users of EagleEye interact with the application and how the data model for the application is broken out, you can decompose the EagleEye problem domain into the following microservice candidates.
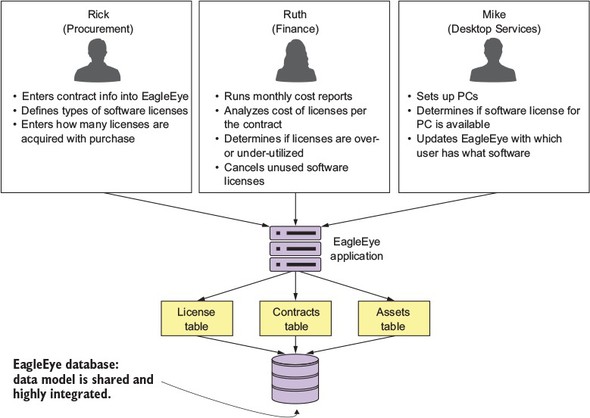
In the figure, I’ve highlighted a number of nouns and verbs that have come up during conversations with the business users. Because this is an existing application, you can look at the application and map the major nouns back to tables in the physical data model. An existing application may have hundreds of tables, but each table will usually map back to a single set of logical entities.
Figure 2.2 shows a simplified data model based on conversations with EagleEye customers. Based on the business interviews and the data model, the microservice candidates are organization, license, contract, and assets services.
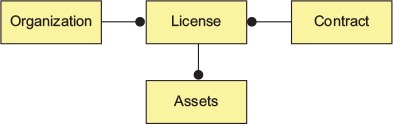
Once you have a simplified data model, you can begin the process of defining what microservices you’re going to need in the application. Based on the data model in figure 2.2, you can see the potential for four microservices based on the following elements:
The goal is to take these major pieces of functionality and extract them into completely self-contained units that can be built and deployed independently of each other. But extracting services from the data model involves more than repackaging code into separate projects. It’s also about teasing out the actual database tables the services are accessing and only allowing each individual service to access the tables in its specific domain. Figure 2.3 shows how the application code and the data model become “chunked” into individual pieces.
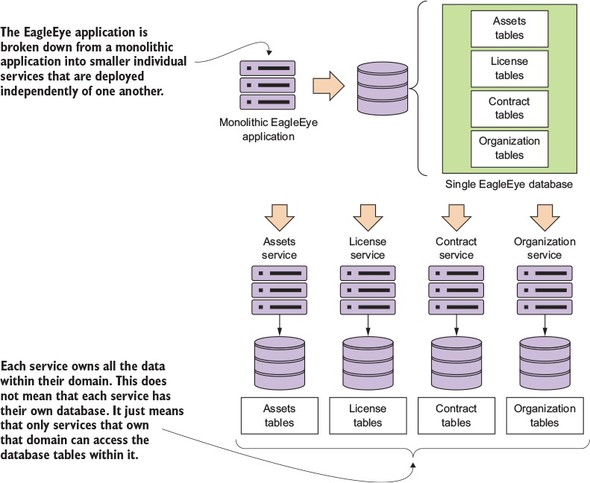
After you’ve broken a problem domain down into discrete pieces, you’ll often find yourself struggling to determine whether you’ve achieved the right level of granularity for your services. A microservice that’s too coarse- or fine-grained will have a number of telltale attributes that we’ll discuss shortly.
When you’re building a microservice architecture, the question of granularity is important, but you can use the following concepts to determine the correct solution:
How do you know whether your microservices are the right size? If a microservice is too coarse-grained, you’ll likely see the following:
A service with too many responsibilities—The general flow of the business logic in the service is complicated and seems to be enforcing an overly diverse array of business rules.
The service is managing data across a large number of tables—A microservice is the system of record for the data it manages. If you find yourself persisting data to multiple tables or reaching out to tables outside of the immediate database, this is a clue the service is too big. I like to use the guideline that a microservice should own no more than three to five tables. Any more, and your service is likely to have too much responsibility.
Too many test cases—Services can grow in size and responsibility over time. If you have a service that started with a small number of test cases and ends up with hundreds of unit and integration test cases, you might need to refactor.
What about a microservice that’s too fine-grained?
The microservices in one part of the problem domain breed like rabbits—If everything becomes a microservice, composing business logic out of the services becomes complex and difficult because the number of services needed to get a piece of work done grows tremendously. A common smell is when you have dozens of microservices in an application and each service interacts with only a single database table.
Your microservices are heavily interdependent on one another—You find that the microservices in one part of the problem domain keep calling back and forth between each other to complete a single user request.
Your microservices become a collection of simple CRUD (Create, Replace, Update, Delete) services—Microservices are an expression of business logic and not an abstraction layer over your data sources. If your microservices do nothing but CRUD-related logic, they’re probably too fine-grained.
A microservices architecture should be developed with an evolutionary thought process where you know that you aren’t going to get the design right the first time. That’s why it’s better to start with your first set of services being more coarse-grained than fine-grained. It’s also important not to be dogmatic with your design. You may run into physical constraints on your services where you’ll need to make an aggregation service that joins data together because two separate services will be too chatty, or where no clear boundaries exist between the domain lines of a service.
In the end, take a pragmatic approach and deliver, rather than waste time trying to get the design perfect and then have nothing to show for your effort.
The last part of the of the architect’s input is about defining how the microservices in your application are going to talk with one another. When building business logic with microservices, the interfaces for the services should be intuitive and developers should get a rhythm of how all the services work in the application by learning one or two of the services in the application.
In general, the following guidelines can be used for thinking about service interface design:
All the basic guidelines drive to one thing, making your service interfaces easy to understand and consumable. You want a developer to sit down and look at the service interfaces and start using them. If a microservice isn’t easy to consume, developers will go out of their way to work around and subvert the intention of the architecture.
We’ve spent this chapter talking about why microservices are a powerful architectural pattern for building applications. But I haven’t touched on when you shouldn’t use microservices to build your applications. Let’s walk through them:
Because microservices are distributed and fine-grained (small), they introduce a level of complexity into your application that wouldn’t be there in more monolithic applications. Microservice architectures require a high degree of operational maturity. Don’t consider using microservices unless your organization is willing to invest in the automation and operational work (monitoring, scaling) that a highly distributed application needs to be successful.
One of the most common deployment models for microservices is to have one microservice instance deployed on one server. In a large microservices-based application, you might end up with 50 to 100 servers or containers (usually virtual) that have to be built and maintained in production alone. Even with the lower cost of running these services in the cloud, the operational complexity of having to manage and monitor these servers can be tremendous.
The flexibility of microservices has to be weighed against the cost of running all of these servers.
Microservices are geared toward reusability and are extremely useful for building large applications that need to be highly resilient and scalable. This is one of the reasons why so many cloud-based companies have adopted microservices. If you’re building small, departmental-level applications or applications with a small user base, the complexity associated with building on a distributed model such as microservices might be more expense then it’s worth.
As you begin looking at microservices, you need to think through the data usage patterns of your services and how service consumers are going to use them. A microservice wraps around and abstracts away a small number of tables and works well as a mechanism for performing “operational” tasks such as creating, adding, and performing simple (non-complex) queries against a store.
If your applications need to do complex data aggregation or transformation across multiple sources of data, the distributed nature of microservices will make this work difficult. Your microservices will invariably take on too much responsibility and can also become vulnerable to performance problems.
Also keep in mind that no standard exists for performing transactions across microservices. If you need transaction management, you will need to build that logic yourself. In addition, as you’ll see in chapter 7, microservices can communicate amongst themselves by using messages. Messaging introduces latency in data updates. Your applications need to handle eventual consistency where updates that are applied to your data might not immediately appear.
When building a microservice, moving from the conceptual space to the implementation space requires a shift in perspective. Specifically, as a developer, you need to establish a basic pattern of how each of the microservices in your application is going to be implemented. While each service is going to be unique, you want to make sure that you’re using a framework that removes boilerplate code and that each piece of your microservice is laid out in the same consistent fashion.
In this section, we’ll explore the developer’s priorities in building the licensing microservice from your EagleEye domain model. Your licensing service is going to be written using Spring Boot. Spring Boot is an abstraction layer over the standard Spring libraries that allows developers to quickly build Groovy- and Java-based web applications and microservices with significantly less ceremony and configuration than a full-blown Spring application.
For your licensing service example, you’ll use Java as your core programming language and Apache Maven as your build tool.
Over the next several sections you’re going to
To begin, you’ll create a skeleton project for the licensing. You can either pull down the source code down from GitHub (https://github.com/carnellj/spmia-chapter2) or create a licensing-service project directory with the following directory structure:
Once you’ve pulled down or created this directory structure, begin by writing your Maven script for the project. This will be the pom.xml file located at the root of the project directory. The following listing shows the Maven POM file for your licensing service.
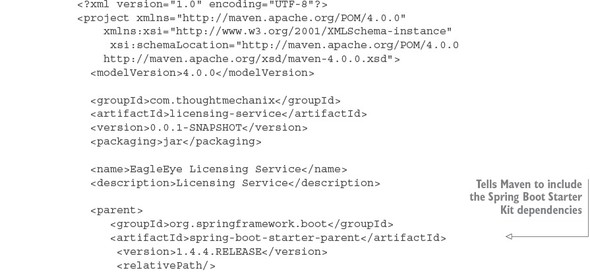
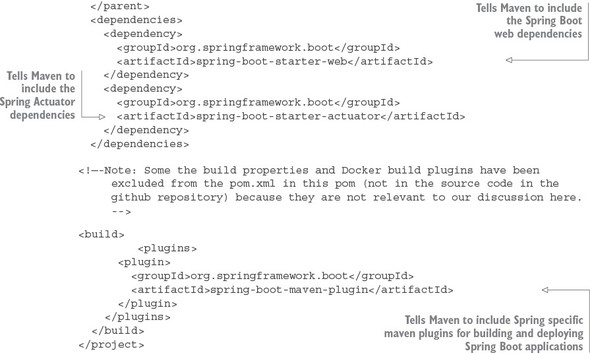
We won’t go through the entire script in detail, but note a few key areas as we begin. Spring Boot is broken into many individual projects. The philosophy is that you shouldn’t have to “pull down the world” if you aren’t going to use different pieces of Spring Boot in your application. This also allows the various Spring Boot projects to release new versions of code independently of one another. To help simplify the life of the developers, the Spring Boot team has gathered related dependent projects into various “starter” kits. In part 1 of the Maven POM you tell Maven that you need to pull down version 1.4.4 of the Spring Boot framework
In parts 2 and 3 of the Maven file, you identify that you’re pulling down the Spring Web and Spring Actuator starter kits. These two projects are at the heart of almost any Spring Boot REST-based service. You’ll find that as you build more functionality into your services, the list of these dependent projects becomes longer.
Also, Spring Source has provided Maven plugins that simplify the build and deployment of the Spring Boot applications. Step 4 tells your Maven build script to install the latest Spring Boot Maven plugin. This plugin contains a number of add-on tasks (such as spring-boot:run) that simplify your interaction between Maven and Spring Boot.
Finally, you’ll see a comment that sections of the Maven file have been removed. For the sake of the trees, I didn’t include the Spotify Docker plugins in listing 2.1.
Every chapter in this book includes Docker files for building and deploying the application as Docker containers. You can find details of how to build these Docker images in the README.md file in the code sections of each chapter.
Your goal is to get a simple microservice up and running in Spring Boot and then iterate on it to deliver functionality. To this end, you need to create two classes in your licensing service microservice:
As you’ll see shortly, Spring Boot uses annotations to simplify setting up and configuring the service. This becomes evident as you look at the bootstrap class in the following listing. This bootstrap class is in the src/main/java/com/thoughtmechanix/licenses/Application.java file.
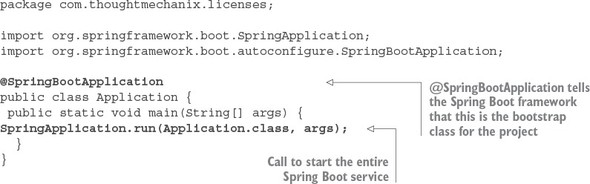
The first thing to note in this code is the use of the @SpringBootApplication annotation. Spring Boot uses this annotation to tell the Spring container that this class is the source of bean definitions for use in Spring. In a Spring Boot application, you can define Spring Beans by
Under the covers, the @SpringBootApplication annotation marks the Application class in listing 2.2 as a configuration class, then begins auto-scanning all the classes on the Java class path for other Spring Beans.
The second thing to note is the Application class’s main() method. In the main() method, the SpringApplication.run(Application.class, args), the call starts the Spring container and returns a Spring ApplicationContext object. (You aren’t doing anything with the ApplicationContext, so it isn’t shown in the code.)
The easiest thing to remember about the @SpringBootApplication annotation and the corresponding Application class is that it’s the bootstrap class for the entire microservice. Core initialization logic for the service should be placed in this class.
Now that you’ve gotten the build script out of the way and implemented a simple Spring Boot Bootstrap class, you can begin writing your first code that will do something. This code will be your Controller class. In a Spring boot application, a Controller class exposes the services endpoints and maps the data from an incoming HTTP request to a Java method that will process the request.
All the microservices in this book follow the REST approach to building your services. An in-depth discussion of REST is outside of the scope this book,[1] but for your purposes, all the services you build will have the following characteristics:
Probably the most comprehensive coverage of the design of REST services is the book REST in Practice by Ian Robinson, et al (O’Reilly, 2010).
Use HTTP as the invocation protocol for the service—The service will be exposed via HTTP endpoint and will use the HTTP protocol to carry data to and from the services.
Map the behavior of the service to standard HTTP verbs—REST emphasizes having services map their behavior to the HTTP verbs of POST, GET, PUT, and DELETE verbs. These verbs map to the CRUD functions found in most services.
Use JSON as the serialization format for all data going to and from the service—This isn’t a hard-and-fast principle for REST-based microservices, but JSON has become lingua franca for serializing data that’s going to be submitted and returned by a microservice. XML can be used, but many REST-based applications make heavy use of JavaScript and JSON (JavaScript Object Notation). JSON is the native format for serializing and deserializing data being consumed by JavaScript-based web front-ends and services.
Use HTTP status codes to communicate the status of a service call—The HTTP protocol has developed a rich set of status codes to indicate the success or failure of a service. REST-based services take advantage of these HTTP status codes and other web-based infrastructure, such as reverse proxies and caches, which can be integrated with your microservices with relative ease.
HTTP is the language of the web and using HTTP as the philosophical framework for building your service is a key to building services in the cloud.
Your first controller class is located in src/main/java/com/thoughtmechanix/licenses/controllers/LicenseServiceController.java. This class will expose four HTTP endpoints that will map to the POST, GET, PUT, and DELETE verbs.
Let’s walk through the controller class and look at how Spring Boot provides a set of annotations that keeps the effort needed to expose your service endpoints to a minimum and allows you to focus on building the business logic for the service. We’ll start by looking at the basic controller class definition without any class methods in it yet. The following listing shows the controller class that you built for your licensing service.
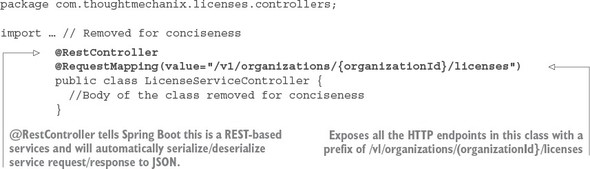
We’ll begin our exploration by looking at the @RestController annotation. The @RestController is a class-level Java annotation and tells the Spring Container that this Java class is going to be used for a REST-based service. This annotation automatically handles the serialization of data passed into the services as JSON or XML (by default the @RestController class will serialize returned data into JSON). Unlike the traditional Spring @Controller annotation, the @RestController annotation doesn’t require you as the developer to return a ResponseBody class from your controller class. This is all handled by the presence of the @RestController annotation, which includes the @ResponseBody annotation.
Multiple protocols can be used to send data back and forth between HTTP-based microservices. JSON has emerged as the de facto standard for several reasons.
First, compared to other protocols such as the XML-based SOAP (Simple Object Access Protocol), it’s extremely lightweight in that you can express your data without having much textual overhead.
Second, it’s easily read and consumed by a human being. This is an underrated quality for choosing a serialization protocol. When a problem arises, it’s critical for developers to look at a chunk of JSON and quickly, visually process what’s in it. The simplicity of the protocol makes this incredibly easy to do.
Third, JSON is the default serialization protocol used in JavaScript. Since the dramatic rise of JavaScript as a programming language and the equally dramatic rise of Single Page Internet Applications (SPIA) that rely heavily on JavaScript, JSON has become a natural fit for building REST-based applications because it’s what the front-end web clients use to call services.
Other mechanisms and protocols are more efficient than JSON for communicating between services. The Apache Thrift (http://thrift.apache.org) framework allows you to build multi-language services that can communicate with one another using a binary protocol. The Apache Avro protocol (http://avro.apache.org) is a data serialization protocol that converts data back and forth to a binary format between client and server calls.
If you need to minimize the size of the data you’re sending across the wire, I recommend you look at these protocols. But it has been my experience that using straight-up JSON in your microservices works effectively and doesn’t interpose another layer of communication to debug between your service consumers and service clients.
The second annotation shown in listing 2.3 is the @RequestMapping annotation. You can use the @RequestMapping annotation as a class-level and method-level annotation. The @RequestMapping annotation is used to tell the Spring container the HTTP endpoint that the service is going to expose to the world. When you use the class-level @RequestMapping annotation, you’re establishing the root of the URL for all the other endpoints exposed by the controller.
In listing 2.3, the @RequestMapping(value="/v1/organizations/{organizationId}/licenses") uses the value attribute to establish the root of the URL for all endpoints exposed in the controller class. All service endpoints exposed in this controller will start with /v1/organizations/{organizationId}/licenses as the root of their endpoint. The {organizationId} is a placeholder that indicates how you expect the URL to be parameterized with an organizationId passed in every call. The use of organizationId in the URL allows you to differentiate between the different customers who might use your service.
Now you’ll add the first method to your controller. This method will implement the GET verb used in a REST call and return a single License class instance, as shown in the following listing. (For purposes of this discussion you’ll instantiate a Java class called License.)
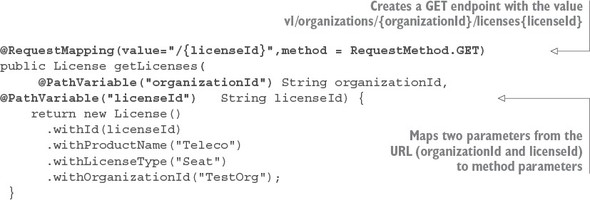
The first thing you’ve done in this listing is annotate the getLicenses() method with a method level @RequestMapping annotation, passing in two parameters to the annotation: value and method. With a method-level @RequestMapping annotation, you’re building on the root-level annotation specified at the top of the class to match all HTTP requests coming to the controller with the endpoint /v1/organizations/{organizationId}/licences/{licensedId}. The second parameter of the annotation, method, specifies the HTTP verb that the method will be matched on. In the previous example, you’re matching on the GET method as represented by the RequestMethod.GET enumeration.
The second thing to note about listing 2.4 is that you use the @PathVariable annotation in the parameter body of the getLicenses() method. (2) The @Path-Variable annotation is used to map the parameter values passed in the incoming URL (as denoted by the {parameterName} syntax) to the parameters of your method. In your code example from listing 2.4, you’re mapping two parameters from the URL, organizationId and licenseId, to two parameter-level variables in the method:
@PathVariable("organizationId") String organizationId,
@PathVariable("licenseId")   String licenseId)
Before you get too far down the path of writing microservices, make sure that you (and potentially other teams in your organization) establish standards for the endpoints that will be exposed via your services. The URLs (Uniform Resource Locator) for the microservice should be used to clearly communicate the intent of the service, the resources the service manages, and the relationships that exist between the resources managed within the service. I’ve found the following guidelines useful for naming service endpoints:
At this point you have something you can call as a service. From a command line window, go to your project directory where you’ve downloaded the sample code and execute the following Maven command:
mvn spring-boot:run
As soon as you hit the Return key, you should see Spring Boot launch an embedded Tomcat server and start listening on port 8080.
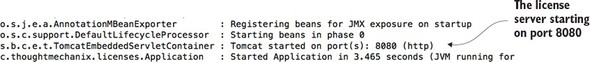
Once the service is started, you can directly hit the exposed endpoint. Because your first method exposed is a GET call, you can use a number of methods for invoking the service. My preferred method is to use a chrome-based tool like POSTMAN or CURL for calling the service. Figure 2.5 shows a GET performed on the http://localhost:8080/v1/organizations/e254f8c-c442-4ebe-a82a-e2fc1d1ff78a/licenses/f3831f8c-c338-4ebe-a82a-e2fc1d1ff78a endpoint.
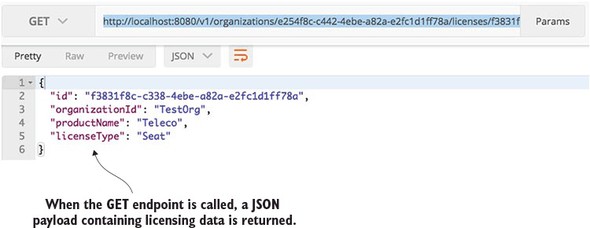
At this point you have a running skeleton of a service. But from a development perspective, this service isn’t complete. A good microservice design doesn’t eschew segregating the service into well-defined business logic and data access layers. As you progress in later chapters, you’ll continue to iterate on this service and delve further into how to structure it.
Let’s switch to the final perspective: exploring how a DevOps engineer would operationalize the service and package it for deployment to the cloud.
For the DevOps engineer, the design of the microservice is all about managing the service after it goes into production. Writing the code is often the easy part. Keeping it running is the hard part.
While DevOps is a rich and emerging IT field, you’ll start your microservice development effort with four principles and build on these principles later in the book. These principles are
These four principles expose the paradox that can exist with microservice development. Microservices are smaller in size and scope, but their use introduces more moving parts in an application, especially because microservices are distributed and running independently of each other in their own distributed containers. This introduces a high degree of coordination and more opportunities for failure points in the application.
From a DevOps perspective, you must address the operational needs of a microservice up front and translate these four principles into a standard set of lifecycle events that occur every time a microservice is built and deployed to an environment. The four principles can be mapped to the following operational lifecycle steps:
Figure 2.6 shows how these four steps fit together.
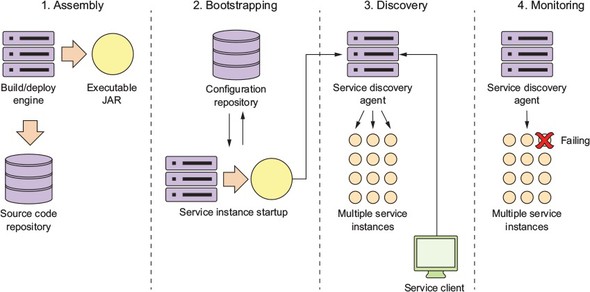
One of my biggest hopes with this book is that you realize that a successful microservice architecture requires strong application development and DevOps practices. One of the most succinct summaries of these practices can be found in Heroku’s Twelve-Factor Application manifesto (https://12factor.net/). This document provides 12 best practices you should always keep in the back of your mind when building microservices. As you read this book, you’ll see these practices intertwined into the examples. I’ve summarized them as follows:
Codebase—All application code and server provisioning information should be in version control. Each microservice should have its own independent code repository within the source control systems.
Dependencies—Explicitly declare the dependencies your application uses through build tools such as Maven (Java). Third-party JAR dependence should be declared using their specific version numbers. This allows your microservice to always be built using the same version of libraries.
Config—Store your application configuration (especially your environment-specific configuration) independently from your code. Your application configuration should never be in the same repository as your source code.
Backing services—Your microservice will often communicate over a network to a database or messaging system. When it does, you should ensure that at any time, you can swap out your implementation of the database from an in-house managed service to a third-party service. In chapter 10, we demonstrate this when you move your services away from a locally managed Postgres database to one managed by Amazon.
Build, release, run—Keep your build, release, and run pieces of deploying your application completely separate. Once code is built, the developer should never make changes to the code at runtime. Any changes need to go back to the build process and be redeployed. A built service is immutable and cannot be changed.
Processes—Your microservices should always be stateless. They can be killed and replaced at any timeout without the fear that a loss-of-a-service instance will result in data loss.
Port binding—A microservice is completely self-contained with the runtime engine for the service packaged in the service executable. You should run the service without the need for a separated web or application server. The service should start by itself on the command line and be accessed immediately through an exposed HTTP port.
Concurrency—When you need to scale, don’t rely on a threading model within a single service. Instead, launch more microservice instances and scale out horizontally. This doesn’t preclude using threading within your microservice, but don’t rely on it as your sole mechanism for scaling. Scale out, not up.
Disposability—Microservices are disposable and can be started and stopped on demand. Startup time should be minimized and processes should shut down gracefully when they receive a kill signal from the operating system.
Dev/prod parity—Minimize the gaps that exist between all of the environments in which the service runs (including the developer’s desktop). A developer should use the same infrastructure locally for the service development in which the actual service will run. It also means that the amount of time that a service is deployed between environments should be hours, not weeks. As soon as code is committed, it should be tested and then promoted as quickly as possible from Dev all the way to Prod.
Logs—Logs are a stream of events. As logs are written out, they should be streamable to tools, such as Splunk (http://splunk.com) or Fluentd (http://fluentd.org), that will collate the logs and write them to a central location. The microservice should never be concerned about the mechanics of how this happens and the developer should visually look at the logs via STDOUT as they’re being written out.
Admin processes—Developers will often have to do administrative tasks against their services (data migration or conversion). These tasks should never be ad hoc and instead should be done via scripts that are managed and maintained through the source code repository. These scripts should be repeatable and non-changing (the script code isn’t modified for each environment) across each environment they’re run against.
From a DevOps perspective, one of the key concepts behind a microservice architecture is that multiple instances of a microservice can be deployed quickly in response to a change application environment (for example, a sudden influx of user requests, problems within the infrastructure, and so on).
To accomplish this, a microservice needs to be packaged and installable as a single artifact with all of its dependencies defined within it. This artifact can then be deployed to any server with a Java JDK installed on it. These dependencies will also include the runtime engine (for example, an HTTP server or application container) that will host the microservice.
This process of consistently building, packaging, and deploying is the service assembly (step 1 in figure 2.6). Figure 2.7 shows additional details about the service assembly step.
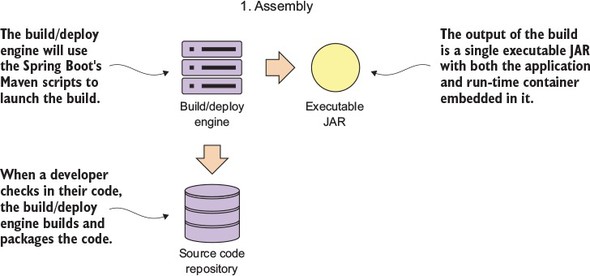
Fortunately, almost all Java microservice frameworks will include a runtime engine that can be packaged and deployed with the code. For instance, in the Spring Boot example in figure 2.7, you can use Maven and Spring Boot to build an executable Java jar file that has an embedded Tomcat engine built right into the JAR. In the following command-line example, you’re building the licensing service as an executable JAR and then starting the JAR file from the command-line:
mvn clean package && java –jar target/licensing-service-0.0.1-SNAPSHOT.jar
For certain operation teams, the concept of embedding a runtime environment right in the JAR file is a major shift in the way they think about deploying applications. In a traditional J2EE enterprise organization, an application is deployed to an application server. This model implies that the application server is an entity in and of itself and would often be managed by a team of system administrators who managed the configuration of the servers independently of the applications being deployed to them.
This separation of the application server configuration from the application introduces failure points in the deployment process, because in many organizations the configuration of the application servers isn’t kept under source control and is managed through a combination of the user interface and home-grown management scripts. It’s too easy for configuration drift to creep into the application server environment and suddenly cause what, on the surface, appear to be random outages.
The use of a single deployable artifact with the runtime engine embedded in the artifact eliminates many of these opportunities for configuration drift. It also allows you to put the whole artifact under source control and allows the application team to be able to better reason through how their application is built and deployed.
Service bootstrapping (step 2 in figure 2.6) occurs when the microservice is first starting up and needs to load its application configuration information. Figure 2.8 provides more context for the bootstrapping processing.
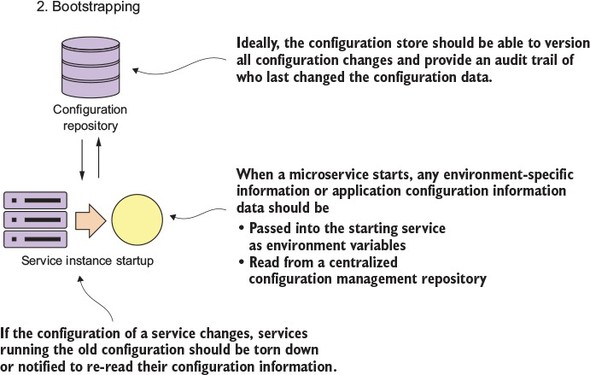
As any application developer knows, there will be times when you need to make the runtime behavior of the application configurable. Usually this involves reading your application configuration data from a property file deployed with the application or reading the data out of a data store such as a relational database.
Microservices often run into the same type of configuration requirements. The difference is that in microservice application running in the cloud, you might have hundreds or even thousands of microservice instances running. Further complicating this is that the services might be spread across the globe. With a high number of geographically dispersed services, it becomes unfeasible to redeploy your services to pick up new configuration data.
Storing the data in a data store external to the service solves this problem, but microservices in the cloud offer a set of unique challenges:
In chapter 3, I show how to manage your microservice application configuration data using things like a simple key-value data store.
From a microservice consumer perspective, a microservice should be location-transparent, because in a cloud-based environment, servers are ephemeral. Ephemeral means the servers that a service is hosted on usually have shorter lives then a service running in a corporate data center. Cloud-based services can be started and torn down quickly with an entirely new IP address assigned to the server on which the services are running.
By insisting that services are treated as short-lived disposable objects, microservice architectures can achieve a high-degree of scalability and availability by having multiple instances of a service running. Service demand and resiliency can be managed as quickly as the situation warrants. Each service has a unique and non-permanent IP address assigned to it. The downside to ephemeral services is that with services constantly coming up and down, managing a large pool of ephemeral services manually or by hand is an invitation to an outage.
A microservice instance needs to register itself with the third-party agent. This registration process is called service discovery (see step 3, service discovery, in figure 2.6; see figure 2.9 for details on this process). When a microservice instance registers with a service discovery agent, it will tell the discovery agent two things: the physical IP address or domain address of the service instance, and a logical name that an application can use to look up in a service. Certain service discovery agents will also require a URL back to the registering service that can be used by the service discovery agent to perform health checks.
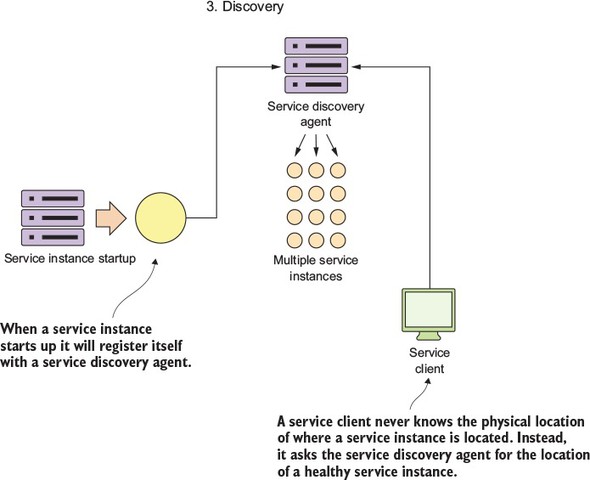
The service client then communicates with the discovery agent to look up the service’s location.
A service discovery agent doesn’t act only as a traffic cop that guides the client to the location of the service. In a cloud-based microservice application, you’ll often have multiple instances of a service running. Sooner or later, one of those service instances will fail. The service discovery agent monitors the health of each service instance registered with it and removes any service instances from its routing tables to ensure that clients aren’t sent a service instance that has failed.
After a microservice has come up, the service discovery agent will continue to monitor and ping the health check interface to ensure that that service is available. This is step 4 in figure 2.6. Figure 2.10 provides context for this step.
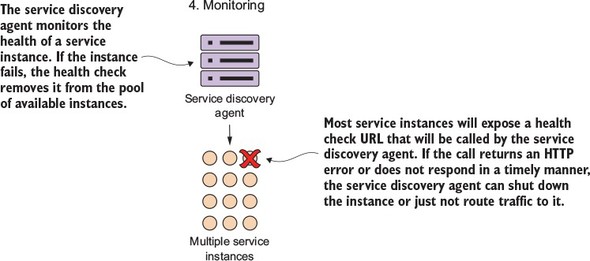
By building a consistent health check interface, you can use cloud-based monitoring tools to detect problems and respond to them appropriately.
If the service discovery agent discovers a problem with a service instance, it can take corrective action such as shutting down the ailing instance or bringing additional service instances up.
In a microservices environment that uses REST, the simplest way to build a health check interface is to expose an HTTP end-point that can return a JSON payload and HTTP status code. In a non-Spring-Boot-based microservice, it’s often the developer’s responsibility to write an endpoint that will return the health of the service.
In Spring Boot, exposing an endpoint is trivial and involves nothing more than modifying your Maven build file to include the Spring Actuator module. Spring Actuator provides out-of-the-box operational endpoints that will help you understand and manage the health of your service. To use Spring Actuator, you need to make sure you include the following dependencies in your Maven build file:
<dependency>
  <groupId>org.springframework.boot</groupId>
  <artifactId>spring-boot-starter-actuator</artifactId>
</dependency>
If you hit the http://localhost:8080/health endpoint on the licensing service, you should see health data returned. Figure 2.11 provides an example of the data returned.
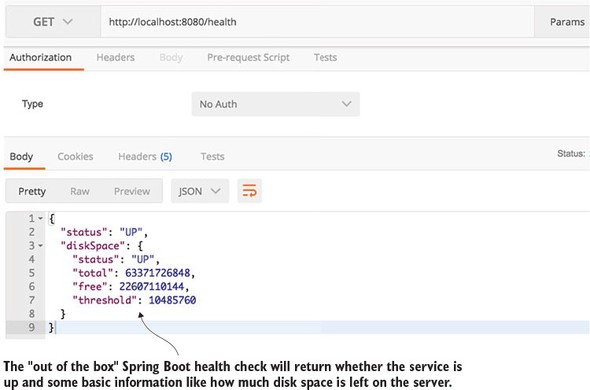
As you can see in figure 2.11, the health check can be more than an indicator of what’s up and down. It also can give information about the state of the server on which the microservice instance is running. This allows for a much richer monitoring experience.[2]
Spring Boot offers a significant number of options for customizing your health check. For more details on this, please check out the excellent book Spring Boot in Action (Manning Publications, 2015). Author Craig Walls gives an exhaustive overview of all the different mechanisms for configuring Spring Boot Actuators.
Microservices in the cloud seem deceptively simple. But to be successful with them, you need to have an integrated view that pulls the perspective of the architect, the developer, and DevOps engineer together into a cohesive vision. The key takeaways for each of these perspectives are
At one point or another, a developer will be forced to separate configuration information from their code. After all, it has been drilled into their heads since school that they shouldn’t hard-code values into the application code. Many developers will use a constants class file in their application to help centralize all their configuration in one place. Application configuration data written directly into the code is often problematic because every time a change to the configuration has to be made the application has to be recompiled and/or redeployed. To avoid this, developers will separate the configuration information from the application code completely. This makes it easy to make changes to configuration without going through a recompile process, but also introduces complexity because you now have another artifact that needs to be managed and deployed with the application.
Many developers will turn to the lowly property file (or YAML, JSON, or XML) to store their configuration information. This property file will sit out on a server often containing database and middleware connection information and metadata about the application that will drive the application’s behavior. Segregating your application into a property file is easy and most developers never do any more operationalization of their application configuration then placing their configuration file under source control (if that) and deploying it as part of their application.
This approach might work with a small number of applications, but it quickly falls apart when dealing with cloud-based applications that may contain hundreds of microservices, where each microservice in turn might have multiple service instances running.
Suddenly configuration management becomes a big deal as application and operations team in a cloud-based environment have to wrestle with a rat’s nest of which configuration files go where. Cloud-based microservices development emphasizes
This chapter will introduce you to the core principles and patterns needed to manage application configuration data in a cloud-based microservice application.
Managing application configuration is critical for microservices running in the cloud because microservice instances need to be launched quickly with minimal human intervention. Every time a human being needs to manually configure or touch a service to get it deployed is an opportunity for configuration drift, an unexpected outage and a lag-time in responding to scalability challenges with the application.
Let’s begin our discussion about application configuration management by establishing four principles we want to follow:
One of the key things to remember is that when you separate your configuration information outside of your actual code, you’re creating an external dependency that will need to be managed and version controlled. I can’t emphasize enough that the application configuration data needs to be tracked and version-controlled because mismanaged application configuration is a fertile breeding ground for difficult-to-detect bugs and unplanned outages.
I’ve experienced firsthand the dangers of not having a strategy for managing your application configuration data. While working at a Fortune 500 financial services company, I was asked to help bring a large WebSphere upgrade project back on track. The company in question had more than 120 applications on WebSphere and needed to upgrade their infrastructure from WebSphere 6 to WebSphere 7 before the entire application environment went end-of-life in terms of maintenance by the vendor.
The project had already been going on for a year and had only one out of 120 applications deployed. The project had cost a million dollars of effort in people and hardware costs, and with its current trajectory was on track to take another two years to finish the upgrade.
When I started working with the application team, one (and just one) of the major problems I uncovered was that the application team managed all their configuration for their databases and the endpoints for their services inside of property files. These property files were managed by hand and weren’t under source control. With 120 applications spread across four environments and multiple WebSphere nodes for each application, this rat’s nest of configuration files led to the team trying to migrate 12,000 configuration files that were spread across hundreds of servers and applications running on the server. (You’re reading that number right: 12,000.) These files were only for application configuration, not even application server configuration.
I convinced the project sponsor to take two months to consolidate all the application information down to a centralized, version-controlled configuration repository with 20 configuration files. When I asked the framework team how things got to the point where they had 12,000 configuration files, the lead engineer on the team said that originally they designed their configuration strategy around a small group of applications. However, the number of web applications built and deployed exploded over five years, and even though they begged for money and time to rework their configuration management approach, their business partners and IT leaders never considered it a priority.
Not spending the time up front to figure out how you’re going to do configuration management can have real (and costly) downstream impacts.
As you’ll remember from chapter 2, the loading of configuration management for a microservice occurs during the bootstrapping phase of the microservice. As a reminder, figure 3.1 shows the microservice lifecycle.
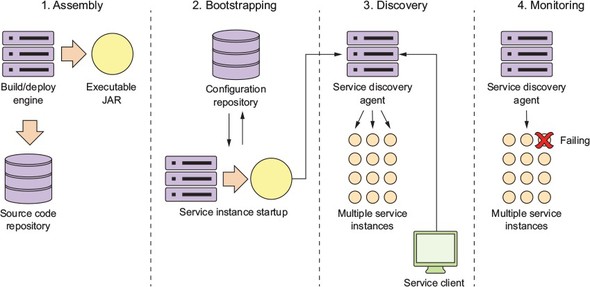
Let’s take the four principles we laid out earlier in section 3.1 (segregate, abstract, centralize, and harden) and see how these four principles apply when the service is bootstrapping. Figure 3.2 explores the bootstrapping process in more detail and shows how a configuration service plays a critical role in this step.
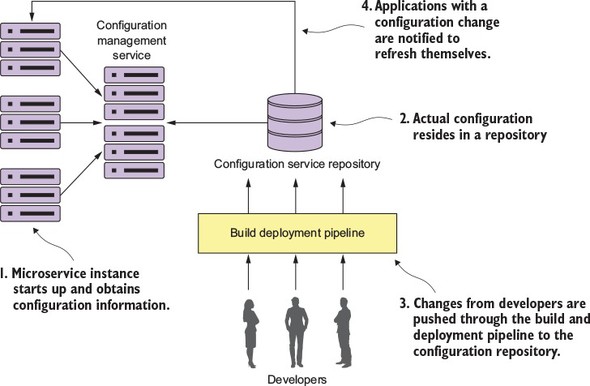
In figure 3.2, you see several activities taking place:
At this point we’ve worked through the conceptual architecture that illustrates the different pieces of a configuration management pattern and how these pieces fit together. We’re now going to move on to look at the different solutions for the pattern and then see a concrete implementation.
Fortunately, you can choose among a large number of battle-tested open source projects to implement a configuration management solution. Let’s look at several of the different choices available and compare them. Table 3.1 lays out these choices.
|
Project Name |
Description |
Characteristics |
|---|---|---|
| Etcd | Open source project written in Go. Used for service discovery and key-value management. Uses the raft (https://raft.github.io/) protocol for its distributed computing model. | Very fast and scalable Distributable Command-line driven Easy to use and setup |
| Eureka | Written by Netflix. Extremely battle-tested. Used for both service discovery and key-value management. | Distribute key-value store. Flexible; takes effort to set up Offers dynamic client refresh out of the box |
| Consul | Written by Hashicorp. Similar to Etcd and Eureka in features, but uses a different algorithm for its distributed computing model (SWIM protocol; https://www.cs.cornell.edu/~asdas/research/dsn02-swim.pdf). | Fast Offers native service discovery with the option to integrate directly with DNS Doesn’t offer client dynamic refresh right out of the box |
| ZooKeeper | An Apache project that offers distributed locking capabilities. Often used as a configuration management solution for accessing key-value data. | Oldest, most battle-tested of the solutions The most complex to use Can be used for configuration management, but should be considered only if you’re already using ZooKeeper in other pieces of your architecture |
| Spring Cloud configuration server | An open source project that offers a general configuration management solution with different back ends. It can integrate with Git, Eureka, and Consul as a back end. | Non-distributed key/value store Offers tight integration for Spring and non-Spring services Can use multiple back ends for storying configuration data including a shared filesystem, Eureka, Consul, and Git |
All the solutions in table 3.1 can easily be used to build a configuration management solution. For the examples in this chapter and throughout the rest of the book, you’ll use Spring Cloud configuration server. I chose this solution for several reasons, including the following:
For the rest of this chapter, you’re going to
The Spring Cloud configuration server is a REST-based application that’s built on top of Spring Boot. It doesn’t come as a standalone server. Instead, you can choose to either embed it in an existing Spring Boot application or start a new Spring Boot project with the server embedded it.
The first thing you need to do is set up a new project directory called confsvr. Inside the consvr directory you’ll create a new Maven file that will be used to pull down the JARs necessary to start up on your Spring Cloud configuration server. Rather than walk through the entire Maven file, I’ll list the key parts in the following listing.
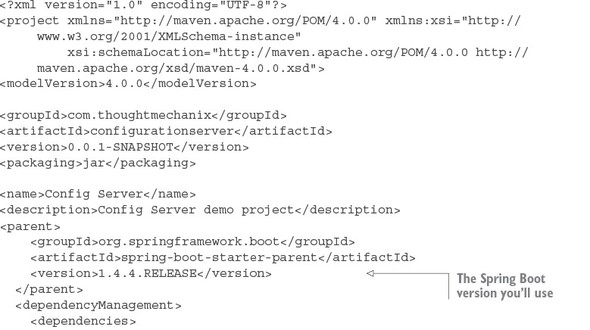
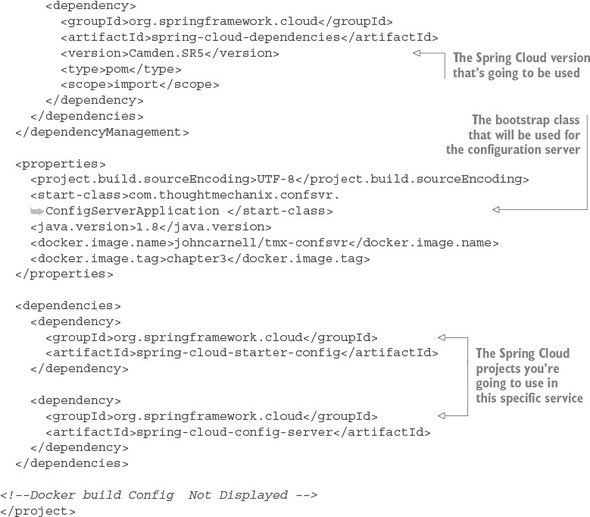
In the Maven file in this previous listing, you start out by declaring the version of Spring Boot you’re going to use for your microservice (version 1.4.4). The next important part of the Maven definition is the Spring Cloud Configuration parent BOM (Bill of Materials) that you’re going to use. Spring Cloud is a massive collection of independent projects all moving with their own releases. This parent BOM contains all the third-party libraries and dependencies that are used in the cloud project and the version numbers of the individual projects that make up that version. In this example, you’re using version Camden.SR5 of Spring Cloud. By using the BOM definition, you can guarantee that you’re using compatible versions of the subprojects in Spring Cloud. It also means that you don’t have to declare version numbers for your sub-dependencies. The rest of the example in listing 3.1 deals with declaring the specific Spring Cloud dependencies that you’ll use in the service. The first dependency is the spring-cloud-starter-config dependency that’s used by all Spring Cloud projects. The second dependency is the spring-cloud-config-server starter project. This contains the core libraries for the spring-cloud-config-server.
Spring Cloud uses a non-traditional mechanism for labeling Maven projects. Spring Cloud is a collection of independent subprojects. The Spring Cloud team does their releases through what they call the “release train.” All the subprojects that make up Spring Cloud are packaged under one Maven bill of materials (BOM) and released as a whole. The Spring Cloud team has been using the name of London subway stops as the name of their releases, with each incrementing major release giving a London subway stop that has the next highest letter. There have been three releases: Angel, Brixton, and Camden. Camden is by far the newest release, but still has multiple release candidate branches for the subprojects within it.
One thing to note is that Spring Boot is released independently of the Spring Cloud release train. Therefore, different versions of Spring Boot are incompatible with different releases of Spring Cloud. You can see the version dependences between Spring Boot and Spring Cloud, along with the different subproject versions contained within the release train, by referring to the Spring Cloud website (http://projects.spring.io/spring-cloud/).
You still need to set up one more file to get the core configuration server up and running. This file is your application.yml file and is in the confsvr/src/main/resources directory. The application.yml file will tell your Spring Cloud configuration service what port to listen to and where to locate the back end that will serve up the configuration data.
You’re almost ready to bring up your Spring Cloud configuration service. You need to point the server to a back-end repository that will hold your configuration data. For this chapter, you’ll use the licensing service that you began to build in chapter 2 as an example of how to use Spring Cloud Config. To keep things simple, you’ll set up application configuration data for three environments: a default environment for when you run the service locally, a dev environment, and a production environment.
In Spring Cloud configuration, everything works off a hierarchy. Your application configuration is represented by the name of the application and then a property file for each environment you want to have configuration information for. In each of these environments, you’ll set up two configuration properties:
Figure 3.3 illustrates how you’ll set up and use the Spring Cloud configuration service. One thing to note is that as you build out your config service, it will be another microservice running in your environment. Once it’s set up, the contents of the service can be access via a http-based REST endpoint.
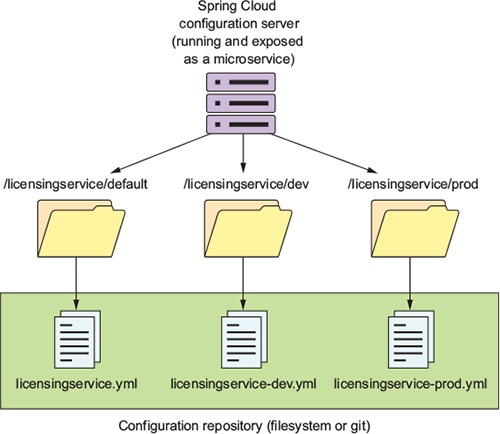
The naming convention for the application configuration files are appname-env.yml. As you can see from the diagram in figure 3.3, the environment names translate directly into the URLs that will be accessed to browse configuration information. Later, when you start the licensing microservice example, the environment you want to run the service against is specified by the Spring Boot profile that you pass in on the command-line service startup. If a profile isn’t passed in on the command line, Spring Boot will always default to the configuration data contained in the application.yml file packaged with the application.
Here’s an example of some of the application configuration data you’ll serve up for the licensing service. This is the data that will be contained within the confsvr/src/main/resources/config/licensingservice/licensingservice.yml file that was referred to in figure 3.3. Here’s part of the contents of this file:
tracer.property: "I AM THE DEFAULT"
spring.jpa.database: "POSTGRESQL"
spring.datasource.platform:  "postgres"
spring.jpa.show-sql: "true"
spring.database.driverClassName: "org.postgresql.Driver"
spring.datasource.url: "jdbc:postgresql://database:5432/eagle_eye_local"
spring.datasource.username: "postgres"

spring.datasource.password: "p0stgr@s"
spring.datasource.testWhileIdle: "true"
spring.datasource.validationQuery: "SELECT 1"
spring.jpa.properties.hibernate.dialect: "org.hibernate.dialect.PostgreSQLDialect"
I advise against using a filesystem-based solution for medium-to-large cloud applications. Using the filesystem approach means that you need to implement a shared file mount point for all cloud configuration servers that want to access the application configuration data. Setting up shared filesystem servers in the cloud is doable, but it puts the onus of maintaining this environment on you.
I’m showing the filesystem approach as the easiest example to use when getting your feet wet with Spring Cloud configuration server. In a later section, I’ll show how to configure Spring Cloud configuration server to use a cloud-based Git provider like Bitbucket or GitHub to store your application configuration.
Every Spring Cloud service covered in this book always needs a bootstrap class that will be used to launch the service. This bootstrap class will contain two things: a Java main() method that acts as the entry point for the Service to start in, and a set of Spring Cloud annotations that tell the starting service what kind of Spring Cloud behaviors it’s going to launch for the service.
The following listing shows the confsvr/src/main/java/com/thought mechanix/confsvr/Application.java class that’s used as the bootstrap class for your configuration service.
Next you’ll set up your Spring Cloud configuration server with our simplest example: the filesystem.
The Spring Cloud configuration server uses an entry in the confsvr/src/main/resources/application.yml file to point to the repository that will hold the application configuration data. Setting up a filesystem-based repository is the easiest way to accomplish this.
To do this, add the following information to the configuration server’s application.yml file. The following listing shows the contents of your Spring Cloud configuration server’s application.yml file.
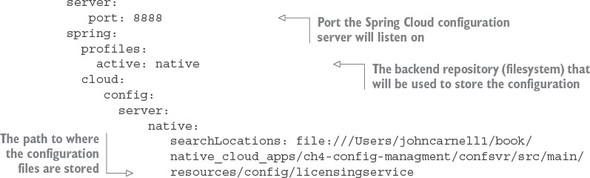
In the configuration file in this listing, you started by telling the configuration server what port number it should listen to for all requests for configuration:
server:
   port: 8888
Because you’re using the filesystem for storing application configuration information, you need to tell Spring Cloud configuration server to run with the “native” profile:
profiles:
   active: native
The last piece in the application.yml file provides Spring Cloud configuration with the directory where the application data resides:
server:
   native:
      searchLocations: file:///Users/johncarnell1/book/spmia_code/chapter3-code/confsvr/src/main/resources/config
The important parameter in the configuration entry is the searchLocations attribute. This attribute provides a comma separated list of the directories for each application that’s going to have properties managed by the configuration server. In the previous example, you only have the licensing service configured.
Be aware that if you use the local filesystem version of Spring Cloud Config, you’ll need to modify the spring.cloud.config.server.native.searchLocations attribute to reflect your local file path when running your code locally.
You now have enough work done to start the configuration server. Go ahead and start the configuration server using the mvn spring-boot:run command. The server should now come up with the Spring Boot splash screen on the command line. If you point your browser over to http://localhost:8888/licensingservice/default, you’ll see JSON payload being returned with all of properties contained within the licensingservice.yml file. Figure 3.4 shows the results of calling this endpoint.
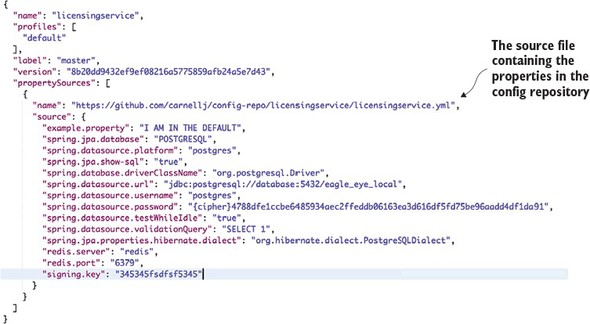
If you want to see the configuration information for the dev-based licensing service environment, hit the GET http://localhost:8888/licensingservice/dev endpoint. Figure 3.5 shows the result of calling this endpoint.
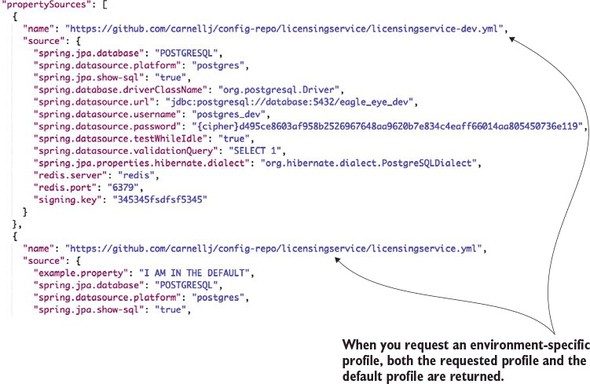
If you look closely, you’ll see that when you hit the dev endpoint, you’re returning back both the default configuration properties for the licensing service and the dev licensing service configuration. The reason why Spring Cloud configuration is returning both sets of configuration information is that the Spring framework implements a hierarchical mechanism for resolving properties. When the Spring Framework does property resolution, it will always look for the property in the default properties first and then override the default with an environment-specific value if one is present.
In concrete terms, if you define a property in the licensingservice.yml file and don’t define it in any of the other environment configuration files (for example, the licensingservice-dev.yml), the Spring framework will use the default value.
This isn’t the behavior you’ll see by directly calling the Spring Cloud configuration REST endpoint. The REST endpoint will return all configuration values for both the default and environment specific value that was called.
Let’s see how you can hook up the Spring Cloud configuration server to your licensing microservice.
In the previous chapter, you built a simple skeleton of your licensing service that did nothing more than return a hardcoded Java object representing a single licensing record from your database. In the next example, you’ll build out the licensing service and talk to a Postgres database holding your licensing data.
You’re going to communicate with the database using Spring Data and map your data from the licensing table to a POJO holding the data. Your database connection and a simple property are going to be read out of Spring Cloud configuration server. Figure 3.6 shows what’s going to happen between the licensing service and the Spring Cloud configuration service.
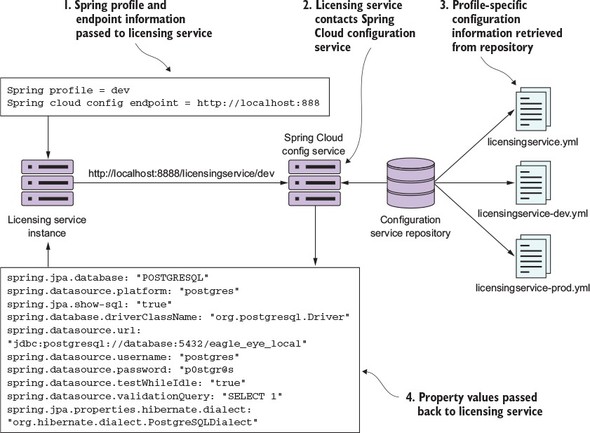
When the licensing service is first started, you’ll pass it via the command line two pieces of information: the Spring profile and the endpoint the licensing service should use to communicate with the Spring Cloud configuration service. The Spring profile value maps to the environment of the properties being retrieved for the Spring service. When the licensing service first boots up, it will contact the Spring Cloud Config service via an endpoint built from the Spring profile passed into it. The Spring Cloud Config service will then use the configured back end config repository (filesystem, Git, Consul, Eureka) to retrieve the configuration information specific to the Spring profile value passed in on the URI. The appropriate property values are then passed back to the licensing service. The Spring Boot framework will then inject these values into the appropriate parts of the application.
Let’s change our focus from the configuration server to the licensing service. The first thing you need to do is add a couple of more entries to the Maven file in your licensing service. The entries that need to be added are shown in the following listing.
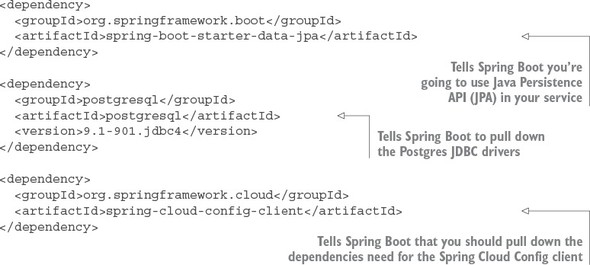
The first and second dependencies, spring-boot-starter-data-jpa and PostgreSQL, import the Spring Data Java Persistence API (JPA) and the Postgres JDBC drivers. The last dependency, the spring-cloud-config-client, contains all the classes needed to interact with the Spring Cloud configuration server.
After the Maven dependencies have been defined, you need to tell the licensing service where to contact the Spring Cloud configuration server. In a Spring Boot service that uses Spring Cloud Config, configuration information can be set in one of two configuration files: bootstrap.yml and application.yml.
The bootstrap.yml file reads the application properties before any other configuration information used. In general, the bootstrap.yml file contains the application name for the service, the application profile, and the URI to connect to a Spring Cloud Config server. Any other configuration information that you want to keep local to the service (and not stored in Spring Cloud Config) can be set locally in the services in the application.yml file. Usually, the information you store in the application.yml file is configuration data that you might want to have available to a service even if the Spring Cloud Config service is unavailable. Both the bootstrap.yml and application.yml files are stored in a projects src/main/resources directory.
To have the licensing service communicate with your Spring Cloud Config service, you need to add a licensing-service/src/main/resources/bootstrap.yml file and set three properties: spring.application.name, spring.profiles.active, and spring.cloud.config.uri.
The licensing services bootstrap.yml file is shown in the following listing.
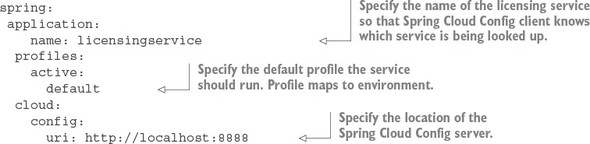
The Spring Boot applications support two mechanisms to define a property: YAML (Yet another Markup Language) and a “.” separated property name. We chose YAML (Yet Another Markup Language) as the means for configuring our application. The hierarchical format of YAML property values map directly to the spring.application.name, spring.profiles.active, and spring.cloud.config.uri names.
The spring.application.name is the name of your application (for example, licensingservice) and must map directly to the name of the directory within your Spring Cloud configuration server. For the licensing service, you want a directory on the Spring Cloud configuration server called licensingservice.
The second property, the spring.profiles.active, is used to tell Spring Boot what profile the application should run as. A profile is a mechanism to differentiate the configuration data consumed by the Spring Boot application. For the licensing service’s profile, you’ll support the environment the service is going to map directly to in your cloud configuration environment. For instance, by passing in dev as our profile, the Spring Cloud config server will use the dev properties. If you set a profile, the licensing service will use the default profile.
The third and last property, the spring.cloud.config.uri, is the location where the licensing service should look for the Spring Cloud configuration server endpoint. By default, the licensing service will look for the configuration server at http://localhost:8888. Later in the chapter you’ll see how to override the different properties defined in the boostrap.yml and application.yml files on application startup. This will allow you to tell the licensing microservice which environment it should be running in.
Now, if you bring up the Spring Cloud configuration service, with the corresponding Postgres database running on your local machine, you can launch the licensing service using its default profile. This is done by changing to the licensing-services directory and issuing the following commands:
mvn spring-boot: run
By running this command without any properties set, the licensing server will automatically attempt to connect to the Spring Cloud configuration server using the endpoint (http://localhost:8888) and the active profile (default) defined in the bootstrap.yml file of the licensing service.
If you want to override these default values and point to another environment, you can do this by compiling the licensingservice project down to a JAR and then run the JAR with a -D system property override. The following command line call demonstrates how to launch the licensing service with a non-default profile:
java  -Dspring.cloud.config.uri=http://localhost:8888 \
      -Dspring.profiles.active=dev \
      -jar target/licensing-service-0.0.1-SNAPSHOT.jar
With the previous command line, you’re overriding the two parameters: spring.cloud.config.uri and spring.profiles.active. With the -Dspring.cloud.config.uri=http://localhost:8888 system property, you’re pointing to a configuration server running away from your local box.
If you try to run the licensing service downloaded from the GitHub repository (https://github.com/carnellj/spmia-chapter3) from your desktop using the previous Java command, it will fail because you don’t have a desktop Postgres server running and the source code in the GitHub repository is using encryption on the config server. We’ll cover using encryption later in the chapter. The previous example demonstrates how to override Spring properties via the command line.
With the –Dspring.profiles.active=dev system property, you’re telling the licensing service to use the dev profile (read from the configuration server) to connect to a dev instance of a database.
In the examples you’re hard-coding the values to pass in to the –D parameter values. In the cloud, most of the application config data you need will be in your configuration server. However, for the information you need to start your service (such as the data for the configuration server), you’d start the VM instance or Docker container and pass in an environment variable.
All the code examples for each chapter can be completely run from within Docker containers. With Docker, you simulate different environments through environment-specific Docker-compose files that orchestrate the startup of all of your services. Environment-specific values needed by the containers are passed in as environment variables to the container. For example, to start your licensing service in a dev environment, the docker/dev/docker-compose.yml file contains the following entry for the licensing-service:
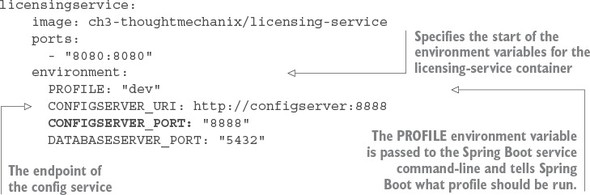
The environment entry in the file contains the values of two variables PROFILE, which is the Spring Boot profile the licensing service is going to run under. The CONFIGSERVER_URI is passed to your licensing service and defines the Spring Cloud configuration server instance the service is going to read its configuration data from.
In your startup scripts that are run by the container, you then pass these environment variables as –D parameters to our JVMS starting the application. In each project, you bake a Docker container, and that Docker container uses a startup script that starts the software in the container. For the licensing service, the startup script that gets baked into the container can be found at licensing-service/src/main/docker/run.sh. In the run.sh script, the following entry starts your licensing-service JVM:
echo "********************************************************"
echo "Starting License Server with Configuration Service :  $CONFIGSERVER_URI";
echo "********************************************************"
java -Dspring.cloud.config.uri=$CONFIGSERVER_URI
-Dspring.profiles.active=$PROFILE -jar /usr/local/licensingservice/licensing-service-0.0.1-SNAPSHOT.jar
Because you enhance all your services with introspection capabilities via Spring Boot Actuator, you can confirm the environment you are running against by hitting http://localhost:8080/env. The /env endpoint will provide a complete list of the configuration information about the service, including the properties and endpoints the service has booted with, as shown in figure 3.7.
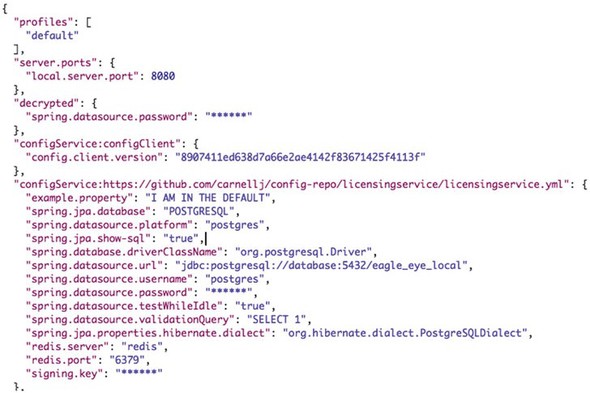
The key thing to note from figure 3.7 is that the active profile for the licensing service is dev. By inspecting the returned JSON, you can also see that the Postgres database being returned is a development URI of jdbc:postgresql://database:5432/eagle_eye_dev.
Every organization is going to have different rules about how to implement security around their services. Many organizations believe services shouldn’t broadcast any information about themselves and won’t allow things like a /env endpoint to be active on a service as they believe (rightfully so) that this will provide too much information for a potential hacker. Spring Boot provides a wealth of capabilities on how to configure what information is returned by the Spring Actuators endpoints that are the outside the scope of this book. Craig Walls’ excellent book, Spring Boot in Action, covers this subject in detail, and I highly recommend that you review your corporate security policies and Walls’ book to provide the right level of detail you want exposed through Spring Actuator.
At this point, you have the database configuration information being directly injected into your microservice. With the database configuration set, configuring your licensing microservice becomes an exercise in using standard Spring components to build and retrieve the data from the Postgres database. The licensing service has been refactored into different classes with each class having separate responsibilities. These classes are shown in table 3.2.
|
Class Name |
Location |
|---|---|
| License | licensing-service/src/main/java/com/thoughtmechanix/licenses/model |
| LicenseRepository | licensing-service/src/main/java/com/thoughtmechanix/licenses/repository |
| LicenseService | licensing-service/src/main/java/com/thoughtmechanix/licenses/services |
The License class is the model class that will hold the data retrieved from your licensing database. The following listing shows the code for the License class.
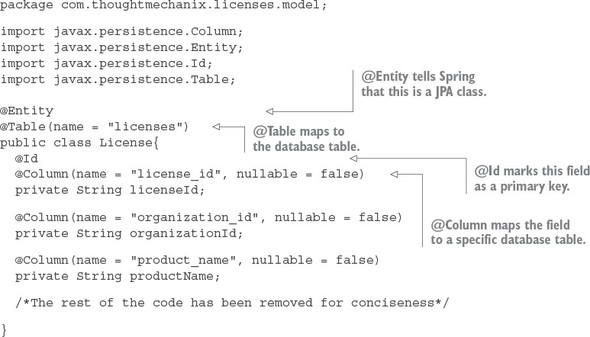
The class uses several Java Persistence Annotations (JPA) that help the Spring Data framework map the data from the licenses table in the Postgres database to the Java object. The @Entity annotation lets Spring know that this Java POJO is going to be mapping objects that will hold data. The @Table annotation tells Spring/JPA what database table should be mapped. The @Id annotation identifies the primary key for the database. Finally, each one of the columns from the database that is going to be mapped to individual properties is marked with a @Column attribute.
The Spring Data and JPA framework provides your basic CRUD methods for accessing a database. If you want to build methods beyond that, you can use a Spring Data Repository interface and basic naming conventions to build those methods. Spring will at startup parse the name of the methods from the Repository interface, convert them over to a SQL statement based on the names, and then generate a dynamic proxy class under the covers to do the work. The repository for the licensing service is shown in the following listing.
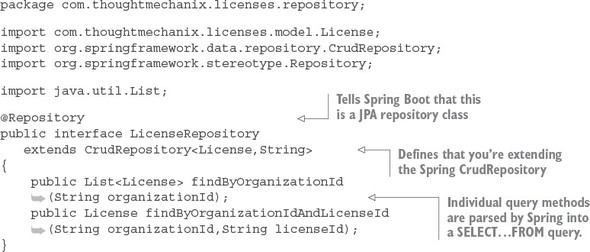
The repository interface, LicenseRepository, is marked with the @Repository annotation which tells Spring that it should treat this interface as a repository and generate a dynamic proxy for it. Spring offers different types of repositories for data access. You’ve chosen to use the Spring CrudRepository base class to extend your LicenseRepository class. The CrudRepository base class contains basic CRUD methods. In addition to the CRUD method extended from CrudRepository, you’ve added two custom query methods for retrieving data from the licensing table. The Spring Data framework will pull apart the name of the methods to build a query to access the underlying data.
The Spring Data framework provides an abstraction layer over various database platforms and isn’t limited to relational databases. NoSQL databases such as MongoDB and Cassandra are also supported.
Unlike the previous incarnation of the licensing service in chapter 2, you’ve now separated the business and data access logic for the licensing service out of the LicenseController and into a standalone Service class called LicenseService.
package com.thoughtmechanix.licenses.services;

import com.thoughtmechanix.licenses.config.ServiceConfig;
import com.thoughtmechanix.licenses.model.License;
import com.thoughtmechanix.licenses.repository.LicenseRepository;
import org.springframework.beans.factory.annotation.Autowired;
import org.springframework.stereotype.Service;

import java.util.List;
import java.util.UUID;

@Service
public class LicenseService {

    @Autowired
    private LicenseRepository licenseRepository;

    @Autowired
    ServiceConfig config;

    public License getLicense(String organizationId,String licenseId) {
        License license = licenseRepository.findByOrganizationIdAndLicenseId(
organizationId, licenseId);
        return license.withComment(config.getExampleProperty());
    }

    public List<License> getLicensesByOrg(String organizationId){
        return licenseRepository.findByOrganizationId( organizationId );
    }

    public void saveLicense(License license){
        license.withId( UUID.randomUUID().toString());
        licenseRepository.save(license);
    }
      /*Rest of the code removed for conciseness*/
}
The controller, service, and repository classes are wired together using the standard Spring @Autowired annotation.
In the LicenseService class in the previous section, you might have noticed that you’re setting the license.withComment() value in the getLicense() code with a value from the config.getExampleProperty() class. The code being referred to is shown here:
public License getLicense(String organizationId,String licenseId) {
       License license = licenseRepository.findByOrganizationIdAndLicenseId(
organizationId, licenseId);
return license.withComment(config.getExampleProperty());
    }
If you look at the licensing-service/src/main/java/com/thoughtmechanix/licenses/config/ServiceConfig.java class, you’ll see a property annotated with the @Value annotation. The following listing shows the @Value annotation being used.
package com.thoughtmechanix.licenses.config;

import org.springframework.beans.factory.annotation.Value;
import org.springframework.stereotype.Component;

@Component
public class ServiceConfig{

  @Value("${example.property}")
  private String exampleProperty;

  public String getExampleProperty(){
    return exampleProperty;
  }
}
While Spring Data “auto-magically” injects the configuration data for the database into a database connection object, all other properties must be injected using the @Value annotation. With the previous example, the @Value annotation pulls the example.property from the Spring Cloud configuration server and injects it into the example.property attribute on the ServiceConfig class.
While it’s possible to directly inject configuration values into properties in individual classes, I’ve found it useful to centralize all of the configuration information into a single configuration class and then inject the configuration class into where it’s needed.
As mentioned earlier, using a filesystem as the backend repository for Spring Cloud configuration server can be impractical for a cloud-based application because the development team has to set up and manage a shared filesystem that’s mounted on all instances of the Cloud configuration server.
Spring Cloud configuration server integrates with different backend repositories that can be used to host application configuration properties. One I’ve used successfully is to use Spring Cloud configuration server with a Git source control repository.
By using Git you can get all the benefits of putting your configuration management properties under source control and provide an easy mechanism to integrate the deployment of your property configuration files in your build and deployment pipeline.
To use Git, you’d swap out the filesystem back configuration in the configuration service’s bootstrap.yml file with the following listing’s configuration.
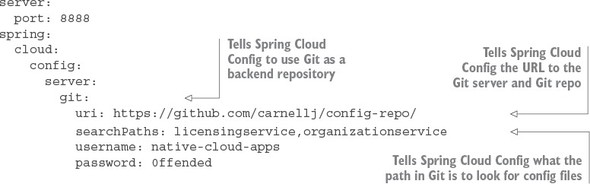
The three key pieces of configuration in the previous example are the spring.cloud.config.server, spring.cloud.config.server.git.uri, and the spring.cloud.config.server.git.searchPaths properties. The spring.cloud.config.server property tells the Spring Cloud configuration server to use a non-filesystem-based backend repository. In the previous example you’re going to connect to the cloud-based Git repository, GitHub.
The spring.cloud.config.server.git.uri properties provide the URL of the repository you’re connecting to. Finally, the spring.cloud.config.server.git.searchPaths property tells the Spring Cloud Config server the relative paths on the Git repository that should be searched when the Cloud configuration server comes up. Like the filesystem version of the configuration, the value in the spring.cloud.config.server.git.seachPaths attribute will be a comma-s-eparated list for each service hosted by the configuration service.
One of the first questions that comes up from development teams when they want to use the Spring Cloud configuration server is how can they dynamically refresh their applications when a property changes. The Spring Cloud configuration server will always serve the latest version of a property. Changes made to a property via its underlying repository will be up-to-date.
However, Spring Boot applications will only read their properties at startup time, so property changes made in the Spring Cloud configuration server won’t be automatically picked up by the Spring Boot application. Spring Boot Actuator does offer a @RefreshScope annotation that will allow a development team to access a /refresh endpoint that will force the Spring Boot application to reread its application configuration. The following listing shows the @RefreshScope annotation in action.
package com.thoughtmechanix.licenses;

import org.springframework.boot.SpringApplication;
import org.springframework.boot.autoconfigure.SpringBootApplication;
import org.springframework.cloud.context.config.annotation.RefreshScope;


@SpringBootApplication
@RefreshScope
public class Application {
    public static void main(String[] args) {
        SpringApplication.run(Application.class, args);
    }
}
Note a couple of things about the @RefreshScope annotation. First, the annotation will only reload the custom Spring properties you have in your application configuration. Items such as your database configuration that are used by Spring Data won’t be reloaded by the @RefreshScope annotation. To perform the refresh, you can hit the http://<yourserver>:8080/refresh endpoint.
When using Spring Cloud configuration service with microservices, one thing you need to consider before you dynamically change properties is that you might have multiple instances of the same service running, and you’ll need to refresh all of those services with their new application configurations. There are several ways you can approach this problem:
Spring Cloud configuration service does offer a “push”-based mechanism called Spring Cloud Bus that will allow the Spring Cloud configuration server to publish to all the clients using the service that a change has occurred. Spring Cloud configuration requires an extra piece of middleware running (RabbitMQ). This is an extremely useful means of detecting changes, but not all Spring Cloud configuration backends support the “push” mechanism (that is, the Consul server).
In the next chapter you’ll use Spring Service Discovery and Eureka to register all instances of a service. One technique I’ve used to handle application configuration refresh events is to refresh the application properties in Spring Cloud configuration and then write a simple script to query the service discovery engine to find all instances of a service and call the /refresh endpoint directly.
Finally, you can restart all the servers or containers to pick up the new property. This is a trivial exercise, especially if you’re running your services in a container service such as Docker. Restarting Docker containers literally takes seconds and will force a reread of the application configuration.
Remember, cloud-based servers are ephemeral. Don’t be afraid to start new instances of a service with their new configuration, direct traffic to the new services, and then tear down the old ones.
By default, Spring Cloud configuration server stores all properties in plain text within the application’s configuration files. This includes sensitive information such as database credentials.
It’s an extremely poor practice to keep sensitive credentials stored as plain text in your source code repository. Unfortunately, it happens far more often than you think. Spring Cloud Config does give you the ability to encrypt your sensitive properties easily. Spring Cloud Config supports using both symmetric (shared secret) and asymmetric encryption (public/private key).
We’re going to see how to set up your Spring Cloud configuration server to use encryption using with a symmetric key. To do this you’ll need to
To begin, you need to download and install Oracle’s Unlimited Strength Java Cryptography Extension (JCE). This isn’t available through Maven and must be downloaded from Oracle Corporation.[1] Once you’ve downloaded the zip files containing the JCE jars, you must do the following:
http://www.oracle.com/technetwork/java/javase/downloads/jce8-download-2133166.html. This URL might be subject to change. A quick search on Google for Java Cryptography Extensions should always return you the right values.
I’ve walked through the manual steps you need to install JCE on your laptop. Because we use Docker to build all our services as Docker containers, I’ve scripted the download and installation of these JAR files in the Spring Cloud Config Docker container. The following OS X shell script snippet shows how I automated this using the curl (https://curl.haxx.se/) command-line tool:
cd /tmp/
curl –k-LO "http://download.oracle.com/otn-pub/java/jce/8/jce_policy-8.zip"
     -H 'Cookie: oraclelicense=accept-securebackup-cookie' &&  unzip jce_policy-8.zip
rm jce_policy-8.zip
yes |cp -v /tmp/UnlimitedJCEPolicyJDK8/*.jar /usr/lib/jvm/java-1.8-openjdk/jre/lib/security/
I’m not going to walk through all of the details, but basically I use CURL to download the JCE zip files (note the Cookie header parameter passed via the -H attribute on the curl command) and then unzip the files and copy them to the /usr/lib/jvm/java-1.8-openjdk/jre/lib/security directory in my Docker container.
If you look at the src/main/docker/Dockerfile file in the source code for this chapter, you can see an example of this scripting in action.
Once the JAR files are in place, you need to set a symmetric encryption key. The symmetric encryption key is nothing more than a shared secret that’s used by the encrypter to encrypt a value and the decrypter to decrypt a value. With the Spring Cloud configuration server, the symmetric encryption key is a string of characters you select that’s passed to the service via an operating system environment variable called ENCRYPT_KEY. For the purposes of this book you’ll always set the ENCRYPT_KEY environment variable to be
export ENCRYPT_KEY=IMSYMMETRIC
Note two things regarding symmetric keys:
For the purposes of this book, I did two things that I wouldn’t normally recommend in a production deployment:
You’re now ready to begin encrypting properties for use in Spring Cloud Config. You’ll encrypt the licensing services Postgres database password you’ve been using to access EagleEye data. This property, called spring.datasource.password, is currently set as plain text to be the value p0stgr@s.
When you fire up your Spring Cloud Config instance, Spring Cloud Config detects that the ENCRYPT_KEY environment variable is set and automatically adds two new endpoints (/encrypt and /decrypt) to the Spring Cloud Config service. You’ll use the /encrypt endpoint to encrypt the p0stgr@s value.
Figure 3.8 shows how to encrypt the p0stgr@s value using the /encrypt endpoint and POSTMAN. Please note that whenever you call the /encrypt or /decrypt endpoints, you need to make sure you do a POST to these endpoints.
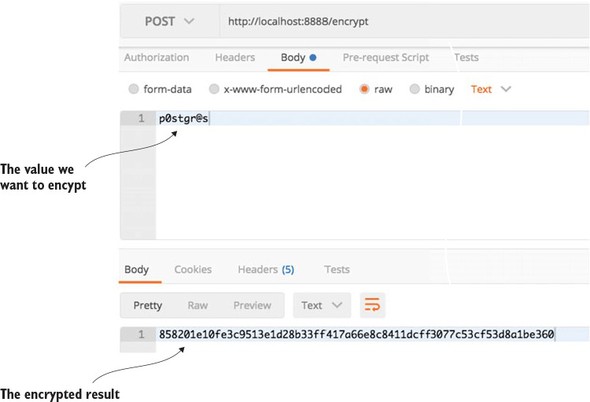
If you wanted to decrypt the value, you’d use the /decrypt endpoint passing in the encrypted string in the call.
You can now add the encrypted property to your GitHub or filesystem-based configuration file for the licensing service using the following syntax:
spring.datasource.password:"{cipher} 858201e10fe3c9513e1d28b33ff417a66e8c8411dcff3077c53cf53d8a1be360"
Spring Cloud configuration server requires all encrypted properties to be prepended with a value of {cipher}. The {cipher} value tells Spring Cloud configuration server it’s dealing with an encrypted value. Fire up your Spring Cloud configuration server and hit the GET http://localhost:8888/licensingservice/default endpoint.
Figure 3.9 shows the results of this call.
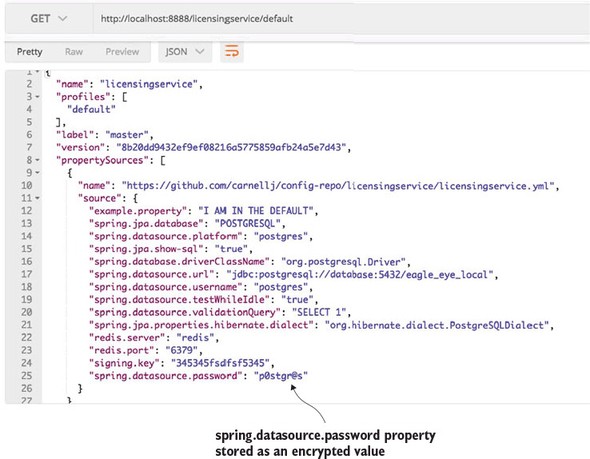
You’ve made the spring.datasource.password more secure by encrypting the property, but you still have a problem. The database password is exposed as plain text when you hit the http://localhost:8888/licensingservice/default endpoint.
By default, Spring Cloud Config will do all the property decryption on the server and pass the results back to the applications consuming the properties as plain, unencrypted text. However, you can tell Spring Cloud Config to not decrypt on the server and make it the responsibility of the application retrieving the configuration data to decrypt the encrypted properties.
To enable client side decryption of properties, you need to do three things:
The first thing you need to do is disable the server-side decryption of properties in Spring Cloud Config. This is done by setting the Spring Cloud Config’s src/main/resources/application.yml file to set the property spring.cloud.config.server.encrypt.enabled: false. That’s all you have to do on the Spring Cloud Config server.
Because the licensing service is now responsible for decrypting the encrypted properties, you need to first set the symmetric key on the licensing service by making sure that the ENCRYPT_KEY environment variable is set with the same symmetric key (for example, IMSYMMETRIC) that you used with your Spring Cloud Config server.
Next you need to include the spring-security-rsa JAR dependencies in with licensing service:
<dependency>
   <groupId>org.springframework.security</groupId>
   <artifactId>spring-security-rsa</artifactId>
</dependency>
These JAR files contain the Spring code needed to decrypt the encrypted properties being retrieved from Spring Cloud Config. With these changes in place, you can start the Spring Cloud Config and licensing services. If you hit the http://localhost:8888/licensingservice/default endpoint you’ll see the spring.datasource.password returned in it is encrypted form. Figure 3.10 shows the output from the call.
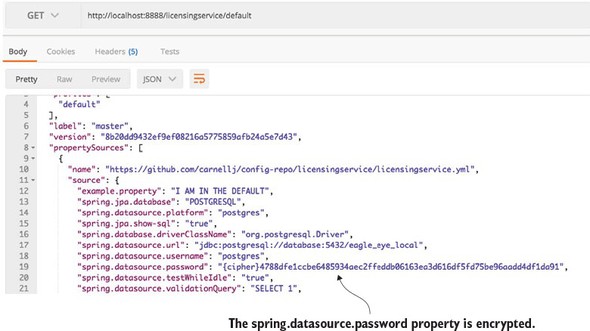
Application configuration management might seem like a mundane topic, but it’s of critical importance in a cloud-based environment. As we’ll discuss in more detail in later chapters, it’s critical that your applications and the servers they run on be immutable and that the entire server being promoted is never manually configured between environments. This flies in the face of traditional deployment models where you deploy an application artifact (for example, a JAR or WAR file) along with its property files to a “fixed” environment.
With a cloud-based model, the application configuration data should be segregated completely from the application, with the appropriate configuration data needs injected at runtime so that the same server/application artifact are consistently promoted through all environments.
In any distributed architecture, we need to find the physical address of where a machine is located. This concept has been around since the beginning of distributed computing and is known formally as service discovery. Service discovery can be something as simple as maintaining a property file with the addresses of all the remote services used by an application, or something as formalized (and complicated) as a UDDI (Universal Description, Discovery, and Integration) repository.[1]
Service discovery is critical to microservice, cloud-based applications for two key reasons. First, it offers the application team the ability to quickly horizontally scale up and down the number of service instances running in an environment. The service consumers are abstracted away from the physical location of the service via service discovery. Because the service consumers don’t know the physical location of the actual service instances, new service instances can be added or removed from the pool of available services.
This ability to quickly scale services without disrupting the service consumers is an extremely powerful concept, because it moves a development team used to building monolithic, single-tenant (for example, one customer) applications away from thinking about scaling only in terms of adding bigger, better hardware (vertical scaling) to the more powerful approach to scaling by adding more servers (horizontal scaling).
A monolithic approach usually drives development teams down the path of over-buying their capacity needs. Capacity increases come in clumps and spikes and are rarely a smooth steady path. Microservices allow us to scale up/down new service instances. Service discovery helps abstract that these deployments are occurring away from the service consumer.
The second benefit of service discovery is that it helps increase application resiliency. When a microservice instance becomes unhealthy or unavailable, most service discovery engines will remove that instance from its internal list of available services. The damage caused by a down service will be minimized because the service discovery engine will route services around the unavailable service.
We’ve gone through the benefits of service discovery, but what’s the big deal about it? After all, can’t we use tried-and-true methods such as DNS (Domain Name Service) or a load balancer to help facilitate service discovery? Let’s walk through why that won’t work with a microservices-based application, particularly one that’s running in the cloud.
Whenever you have an application calling resources spread across multiple servers, it needs to locate the physical location of those resource. In the non-cloud world, this service location resolution was often solved through a combination of DNS and a network load balancer. Figure 4.1 illustrates this model.
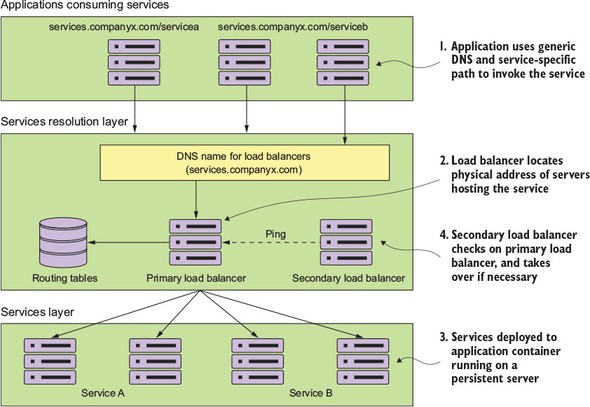
An application needs to invoke a service located in another part of the organization. It attempts to invoke the service by using a generic DNS name along with a path that uniquely represents the service that the application was trying to invoke. The DNS name would resolve to a commercial load balancer, such as the popular F5 load balancer (http://f5.com) or an open source load balancer such as HAProxy (http://haproxy.org).
The load balancer, upon receiving the request from the service consumer, locates the physical address entry in a routing table based on the path the user was trying to access. This routing table entry contains a list of one or more servers hosting the service. The load balancer then picks one of the servers in the list and forwards the request onto that server.
Each instance of a service is deployed to one or more application servers. The number of these application servers was often static (for example, the number of application servers hosting a service didn’t go up and down) and persistent (for example, if a server running an application server crashed, it would be restored to the same state it was at the time of the crash, and would have the same IP and configuration that it had previously.)
To achieve a form of high availability, a secondary load balancer is sitting idle and pinging the primary load balancer to see if it’s alive. If it isn’t alive, the secondary load balancer becomes active, taking over the IP address of the primary load balancer and beginning serving requests.
While this type of model works well with applications running inside of the four walls of a corporate data center and with a relatively small number of services running on a group of static servers, it doesn’t work well for cloud-based microservice applications. Reasons for this include
These four reasons aren’t a general indictment of load balancers. They work well in a corporate environment where the size and scale of most applications can be handled through a centralized network infrastructure. In addition, load balancers still have a role to play in terms of centralizing SSL termination and managing service port security. A load balancer can lock down inbound (ingress) and outbound (egress) port access to all the servers sitting behind it. This concept of least network access is often a critical component when trying to meet industry-standard certification requirements such as PCI (Payment Card Industry) compliance.
However, in the cloud where you have to deal with massive amounts of transactions and redundancy, a centralized piece of network infrastructure doesn’t ultimately work as well because it doesn’t scale effectively and isn’t cost-efficient. Let’s now look at how you can implement a robust-service discovery mechanism for cloud-based applications.
The solution for a cloud-based microservice environment is to use a service-discovery mechanism that’s
In the following section(s) we’re going to
To begin our discussion around service discovery architecture, we need to understand four concepts. These general concepts are shared across all service discovery implementations:
Figure 4.2 shows the flow of these four bullets and what typically occurs in a service discovery pattern implementation.
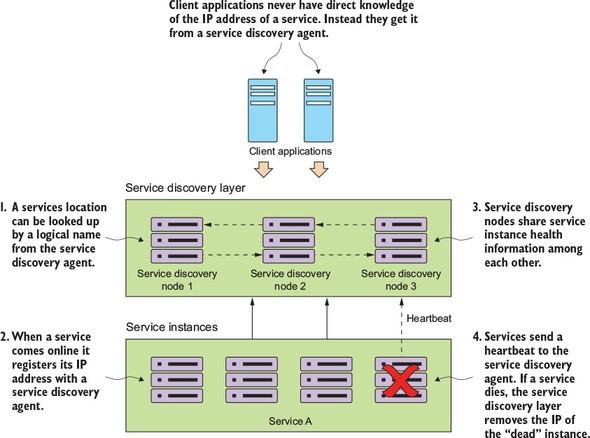
In figure 4.2, one or more service discovery nodes have been started. These service discovery instances are usually unique and don’t have a load balancer that sits in front of them.
As service instances start up, they’ll register their physical location, path, and port that they can be accessed by with one or more service discovery instances. While each instance of a service will have a unique IP address and port, each service instance that comes up will register under the same service ID. A service ID is nothing more than a key that uniquely identifies a group of the same service instances.
A service will usually only register with one service discovery service instance. Most service discovery implementations use a peer-to-peer model of data propagation where the data around each service instance is communicated to all the other nodes in the cluster.
Depending on the service discovery implementation, the propagation mechanism might use a hard-coded list of services to propagate to or use a multi-casting protocol like the “gossip”[2] or “infection-style”[3] protocol to allow other nodes to “discover” changes in the cluster.
Finally, each service instance will push to or have pulled from its status by the service discovery service. Any services failing to return a good health check will be removed from the pool of available service instances.
Once a service has registered with a service discovery service, it’s ready to be used by an application or service that needs to use its capabilities. Different models exist for a client to “discover” a service. A client can rely solely on the service discovery engine to resolve service locations each time a service is called. With this approach, the service discovery engine will be invoked every time a call to a registered microservice instance is made. Unfortunately, this approach is brittle because the service client is completely dependent on the service discovery engine to be running to find and invoke a service.
A more robust approach is to use what’s called client-side load balancing.[4] Figure 4.3 illustrates this approach.
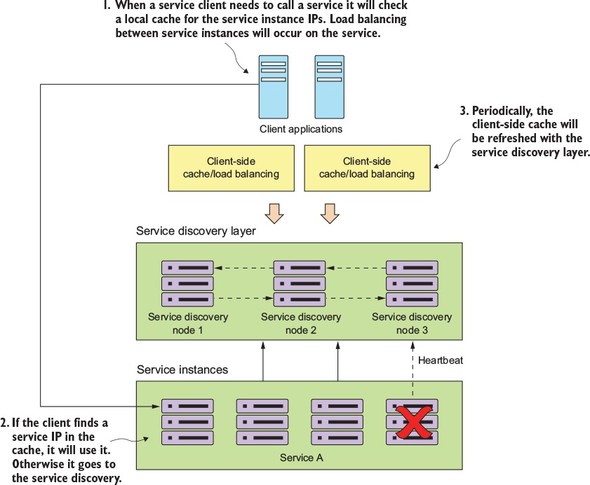
In this model, when a consuming actor needs to invoke a service
Let’s now take the generic service discovery pattern and apply it to your EagleEye problem domain.
Now you’re going to implement service discovery by setting up a service discovery agent and then registering two services with the agent. You’ll then have one service call another service by using the information retrieved by service discovery. Spring Cloud offers multiple methods for looking up information from a service discovery agent. We’ll also walk through the strengths and weakness of each approach.
Once again, the Spring Cloud project makes this type of setup trivial to undertake. You’ll use Spring Cloud and Netflix’s Eureka service discovery engine to implement your service discovery pattern. For the client-side load balancing you’ll use Spring Cloud and Netflix’s Ribbon libraries.
In the previous two chapters, you kept your licensing service simple and included the organization name for the licenses with the license data. In this chapter, you’ll break the organization information into its own service.
When the licensing service is invoked, it will call the organization service to retrieve the organization information associated with the designated organization ID. The actual resolution of the organization service’s location will be held in a service discovery registry. For this example, you’ll register two instances of the organization service with a service discovery registry and then use client-side load balancing to look up and cache the registry in each service instance. Figure 4.4 shows this arrangement:
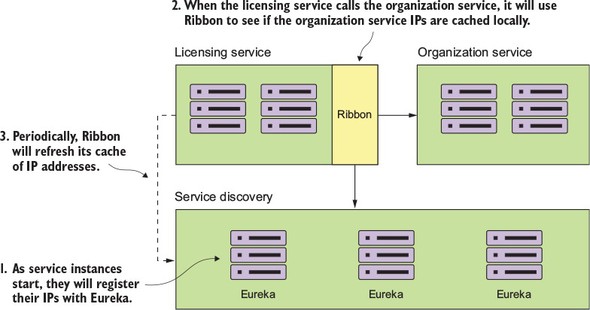
Any new organization services instance will now be visible to the licensing service locally, while any non-healthy instances will be removed from the local cache.
Next, you’ll implement this design by setting up your Spring Cloud Eureka service.
In this section, you’ll set up our Eureka service using Spring Boot. Like the Spring Cloud configuration service, setting up a Spring Cloud Eureka Service starts with building a new Spring Boot project and applying annotations and configurations. Let’s begin with your maven pom.xml.[5] The following listing shows the Eureka service dependencies you’ll need for the Spring Boot project you’re setting up.
All source code in this chapter can be downloaded from GitHub (https://github.com/carnellj/spmia-chapter4). The Eureka service is in the chapter 4/eurekasvr example. All services in this chapter were built using Docker and Docker Compose so they can be brought up in a single instance.
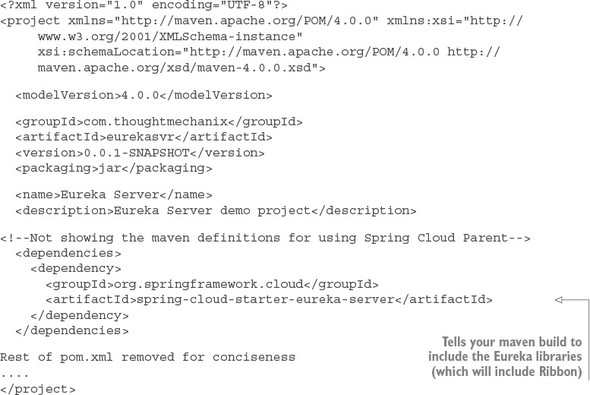
You’ll then need to set up the src/main/resources/application.yml file with the configuration needed to set up the Eureka service running in standalone mode (for example, no other nodes in the cluster), as shown in the next listing.
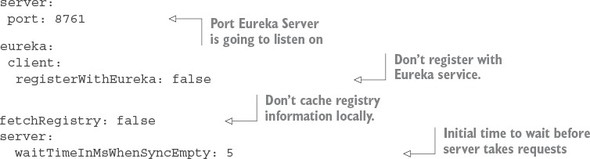
The key properties being set are the server.port attribute that sets the default port used for the Eureka service. The eureka.client.registerWithEureka attribute tells the service not to register with a Eureka service when the Spring Boot Eureka application starts because this is the Eureka service. The eureka.client.fetchRegistry attribute is set to false so that when the Eureka service starts, it doesn’t try to cache its registry information locally. When running a Eureka client, you’ll want to change this value for the Spring Boot services that are going to register with Eureka.
You’ll notice that the last attribute, eureka.server.waitTimeInMsWhenSync Empty, is commented out. When you’re testing your service locally you should uncomment this line because Eureka won’t immediately advertise any services that register with it. It will wait five minutes by default to give all of the services a chance to register with it before advertising them. Uncommenting this line for local testing will help speed up the amount of time it will take for the Eureka service to start and show services registered with it.
Individual services registering will take up to 30 seconds to show up in the Eureka service because Eureka requires three consecutive heartbeat pings from the service spaced 10 seconds apart before it will say the service is ready for use. Keep this in mind as you’re deploying and testing your own services.
The last piece of setup work you’re going to do in setting up your Eureka service is adding an annotation to the application bootstrap class you’re using to start your Eureka service. For the Eureka service, the application bootstrap class can be found in the src/main/java/com/thoughtmechanix/eurekasvr/EurekaServer-Application.java class. The following listing shows where to add your annotations.
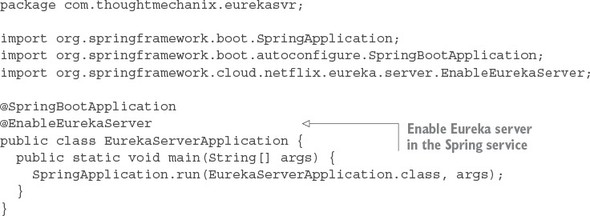
You use only one new annotation to tell your service to be a Eureka service; that’s @EnableEurekaServer. At this point you can start up the Eureka service by running the mvn spring-boot:run or run docker-compose (see appendix A) to start the service. Once this command is run, you should have a running Eureka service with no services registered in it. Next you’ll build out the organization service and register it with your Eureka service.
At this point you have a Spring-based Eureka server up and running. In this section, you’ll configure your organization and licensing services to register themselves with your Eureka server. This work is done in preparation for having a service client look up a service from your Eureka registry. By the time you’re done with this section, you should have a firm understanding of how to register a Spring Boot microservice with Eureka.
Registering a Spring Boot-based microservice with Eureka is an extremely simple exercise. For the purposes of this chapter, we’re not going to walk through all of the Java code involved with writing the service (we purposely kept that amount of code small), but instead focus on registering the service with the Eureka service registry you created in the previous section.
The first thing you need to do is add the Spring Eureka dependency to your organization service’s pom.xml file:
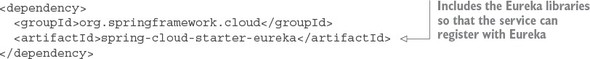
The only new library that’s being used is the spring-cloud-starter-eureka library. The spring-cloud-starter-eureka artifact holds the jar files that Spring Cloud will use to interact with your Eureka service.
After you’ve set up your pom.xml file, you need to tell Spring Boot to register the organization service with Eureka. This registration is done via additional configuration in the organization service’s src/main/java/resources/application.yml file, as shown in the following listing.
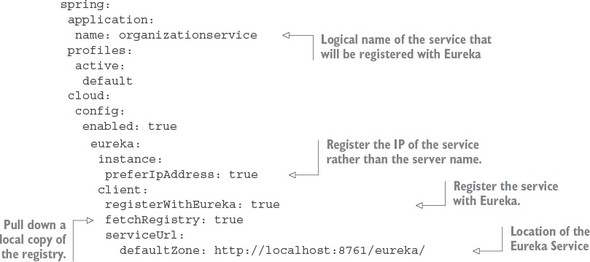
Every service registered with Eureka will have two components associated with it: the application ID and the instance ID. The application ID is used to represent a group service instance. In a Spring-Boot-based microservice, the application ID will always be the value set by the spring.application.name property. For your organization service, your spring.application.name is creatively named organizationservice. The instance ID will be a random number meant to represent a single service instance.
Remember that normally the spring.application.name property goes in the bootstrap.yml file. I’ve included it in the application.yml for illustrative purposes. The code will work with the spring.application.name but the proper place long-term for this attribute is the bootstrap.yml file.
The second part of your configuration provides how and where the service should register with the Eureka service. The eureka.instance.preferIpAddress property tells Eureka that you want to register the service’s IP address to Eureka rather than its hostname.
By default, Eureka will try to register the services that contact it by hostname. This works well in a server-based environment where a service is assigned a DNS-backed host name. However, in a container-based deployment (for example, Docker), containers will be started with randomly generated hostnames and no DNS entries for the containers.
If you don’t set the eureka.instance.preferIpAddress to true, your client applications won’t properly resolve the location of the hostnames because there will be no DNS entry for that container. Setting the preferIpAddress attribute will inform the Eureka service that client wants to be advertised by IP address.
Personally, we always set this attribute to true. Cloud-based microservices are supposed to be ephemeral and stateless. They can be started up and shut down at will. IP addresses are more appropriate for these types of services.
The eureka.client.registerWithEureka attribute is the trigger to tell the organization service to register itself with Eureka. The eureka.client.fetchRegistry attribute is used to tell the Spring Eureka Client to fetch a local copy of the registry. Setting this attribute to true will cache the registry locally instead of calling the Eureka service with every lookup. Every 30 seconds, the client software will re-contact the Eureka service for any changes to the registry.
The last attribute, the eureka.serviceUrl.defaultZone attribute, holds a comma-separated list of Eureka services the client will use to resolve to service locations. For our purposes, you’re only going to have one Eureka service.
Setting up multiple URL services isn’t enough for high availability. The eureka.serviceUrl.defaultZone attribute only provides a list of Eureka services for the client to communicate with. You also need to set up the Eureka services to replicate the contents of their registry with each other.
A group of Eureka registries communicate with each other using a peer-to-peer communication model where each Eureka service has to be configured to know about the other nodes in the cluster. Setting up a Eureka cluster is outside of the scope of this book. If you’re interested in setting up a Eureka cluster, please visit the Spring Cloud project’s website for further information.[6]
At this point you’ll have a single service registered with your Eureka service.
You can use Eureka’s REST API to see the contents of the registry. To see all the instances of a service, hit the following GET endpoint:
http://<eureka service>:8761/eureka/apps/<APPID>
For instance, to see the organization service in the registry you can call http://-localhost:8761/eureka/apps/organizationservice.
The default format returned by the Eureka service is XML. Eureka can also return the data in figure 4.5 as a JSON payload, but you have to set the Accept HTTP header to be application/json. An example of the JSON payload is shown in figure 4.6.
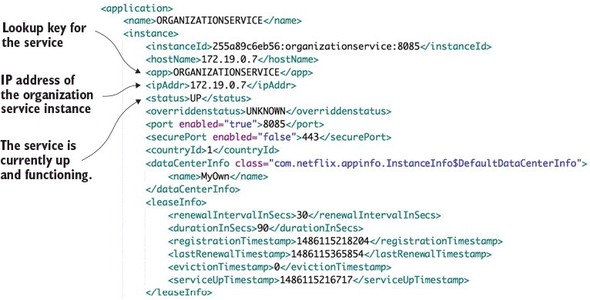
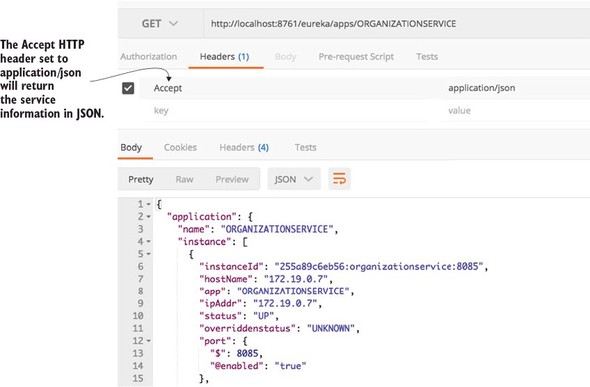
When a service registers with Eureka, Eureka will wait for three successive health checks over the course of 30 seconds before the service becomes available via a Eureka. This warm-up period throws developers off because they think that Eureka hasn’t registered their services if they try to call their service immediately after the service has been launched. This is evident in our code examples running in the Docker environment, because the Eureka service and the application services (licensing and organization services) all start up at the same time. Be aware that after starting the application, you may receive 404 errors about services not being found, even though the service itself has started. Wait 30 seconds before trying to call your services.
In a production environment, your Eureka services will already be running and if you’re deploying an existing service, the old services will still be in place to take requests.
You now have the organization service registered with Eureka. You can also have the licensing service call the organization service without having direct knowledge of the location of any of the organization services. The licensing service will look up the physical location of the organization by using Eureka.
For our purposes, we’re going to look at three different Spring/Netflix client libraries in which a service consumer can interact with Ribbon. These libraries will move from the lowest level of abstraction for interacting with Ribbon to the highest. The libraries we’ll explore include
Let’s walk through each of these clients and see their use in the context of the licensing service. Before we start into the specifics of the client, I wrote a few convenience classes and methods in the code so you can play with the different client types using the same service endpoint.
First, I’ve modified the src/main/java/com/thoughtmechanix/licenses/controllers/LicenseServiceController.java to include a new route for the license services. This new route will allow you to specify the type of client you want to invoke the service with. This is a helper route so that as we explore each of the different methods for invoking the organization service via Ribbon, you can try each mechanism through a single route. The following listing shows the code for the new route in the LicenseServiceController class.
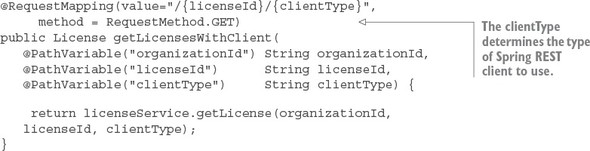
In this code, the clientType parameter passed on the route will drive the type of client we’re going to use in the code examples. The specific types you can pass in on this route include
Because I’m using the same code for all three types of client, you might see situations where you’ll see annotations for certain clients even when they don’t seem to be needed. For example, you’ll see both the @EnableDiscoveryClient and @EnableFeignClients annotations in the code, even when the text is only explaining one of the client types. This is so I can use one code base for my examples. I’ll call out these redundancies and code whenever they are encountered.
In the src/main/java/com/thoughtmechanix/licenses/services/License Service.java class, I’ve added a simple method called retrieveOrgInfo() that will resolve based on the clientType passed into the route the type of client that will be used to look up an organization service instance. The getLicense() method on the LicenseService class will use retrieveOrgInfo() to retrieve the organization data from the Postgres database.
public License getLicense(String organizationId, String licenseId, String clientType) {
    License license = licenseRepository.findByOrganizationIdAndLicenseId(
              organizationId, licenseId);

    Organization org = retrieveOrgInfo(organizationId, clientType);

    return license
        .withOrganizationName( org.getName())
        .withContactName( org.getContactName())
        .withContactEmail( org.getContactEmail() )
        .withContactPhone( org.getContactPhone() )
        .withComment(config.getExampleProperty());
  }
You can find each of the clients we built using the Spring DiscoveryClient, the Spring RestTemplate, or the Feign libraries in the src/main/java/com/thoughtmechanix/licenses/clients package of the licensing-service source code.
The Spring DiscoveryClient offers the lowest level of access to Ribbon and the services registered within it. Using the DiscoveryClient, you can query for all the services registered with the ribbon client and their corresponding URLs.
Next, you’ll build a simple example of using the DiscoveryClient to retrieve one of the organization service URLs from Ribbon and then call the service using a standard RestTemplate class. To begin using the DiscoveryClient, you first need to annotate the src/main/java/com/thoughtmechanix/licenses/Application.java class with the @EnableDiscoveryClient annotation, as shown in the next listing.
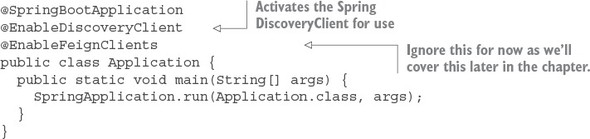
The @EnableDiscoveryClient annotation is the trigger for Spring Cloud to enable the application to use the DiscoveryClient and Ribbon libraries. The @EnableFeignClients annotation can be ignored for now as we’ll be covering it shortly.
Now, let’s look at your implementation of the code that calls the organization service via the Spring DiscoveryClient, as shown in the following listing. You can find this in src/main/java/com/thoughtmechanix/licenses/OrganizationDiscovery Client.java.
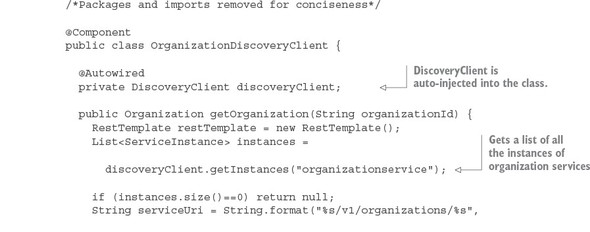
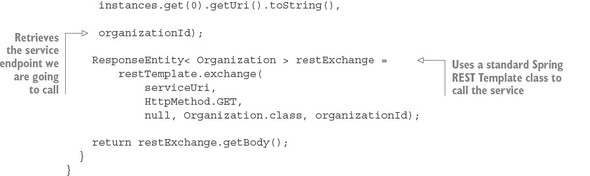
The first item of interest in the code is the DiscoveryClient. This is the class you’ll use to interact with Ribbon. To retrieve all instances of the organization services registered with Eureka, you can use the getInstances() method, passing in the key of service you’re looking for, to retrieve a list of ServiceInstance objects.
The ServiceInstance class is used to hold information about a specific instance of a service including its hostname, port and URI.
In listing 4.8, you take the first ServiceInstance class in your list to build a target URL that can then be used to call your service. Once you have a target URL, you can use a standard Spring RestTemplate to call your organization service and retrieve data.
I’m walking through the DiscoveryClient to be completed in our discussion of building service consumers with Ribbon. The reality is that you should only use the DiscoveryClient directly when your service needs to query Ribbon to understand what services and service instances are registered with it. There are several problems with this code including the following:
You aren’t taking advantage of Ribbon’s client side load-balancing—By calling the DiscoveryClient directly, you get back a list of services, but it becomes your responsibility to choose which service instances returned you’re going to invoke.
You’re doing too much work—Right now, you have to build the URL that’s going to be used to call your service. It’s a small thing, but every piece of code that you can avoid writing is one less piece of code that you have to debug.
Observant Spring developers might have noticed that you’re directly instantiating the RestTemplate class in the code. This is antithetical to normal Spring REST invocations, as normally you’d have the Spring Framework inject the RestTemplate the class using it via the @Autowired annotation.
You instantiated the RestTemplate class in listing 4.8 because once you’ve enabled the Spring DiscoveryClient in the application class via the @EnableDiscoveryClient annotation, all RestTemplates managed by the Spring framework will have a Ribbon-enabled interceptor injected into them that will change how URLs are created with the RestTemplate class. Directly instantiating the RestTemplate class allows you to avoid this behavior.
In summary, there are better mechanisms for calling a Ribbon-backed service.
Next, we’re going to see an example of how to use a RestTemplate that’s Ribbon-aware. This is one of the more common mechanisms for interacting with Ribbon via Spring. To use a Ribbon-aware RestTemplate class, you need to define a Rest-Template bean construction method with a Spring Cloud annotation called @LoadBalanced. For the licensing service, the method that will be used to create the RestTemplate bean can be found in src/main/java/com/thoughtmechanix/licenses/Application.java.
The following listing shows the getRestTemplate() method that will create the Ribbon-backed Spring RestTemplate bean.
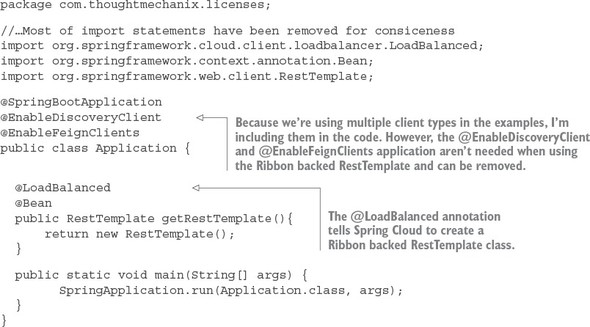
In early releases of Spring Cloud, the RestTemplate class was automatically backed by Ribbon. It was the default behavior. However, since Spring Cloud Release Angel, the RestTemplate in Spring Cloud is no longer backed by Ribbon. If you want to use Ribbon with the RestTemplate, you must explicitly annotate it using the @LoadBalanced annotation.
Now that the bean definition for the Ribbon-backed RestTemplate class is defined, any time you want to use the RestTemplate bean to call a service, you only need to auto-wire it into the class using it.
Using the Ribbon-backed RestTemplate class pretty much behaves like a standard Spring RestTemplate class, except for one small difference in how the URL for target service is defined. Rather than using the physical location of the service in the RestTemplate call, you’re going to build the target URL using the Eureka service ID of the service you want to call.
Let’s see this difference by looking at the following listing. The code for this listing can be found in the src/main/java/com/thoughtmechanix/licenses/-clients/OrganizationRestTemplate.java class.
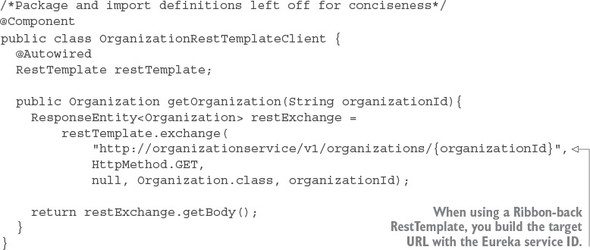
This code should look somewhat similar to the previous example, except for two key differences. First, the Spring Cloud DiscoveryClient is nowhere in sight. Second, the URL being used in the restTemplate.exchange() call should look odd to you:
restTemplate.exchange(

  "http://organizationservice/v1/organizations/{organizationId}",
   HttpMethod.GET,
 null, Organization.class, organizationId);
The server name in the URL matches the application ID of the organizationservice key that you registered the organization service with in Eureka:
http://{applicationid}/v1/organizations/{organizationId}
The Ribbon-enabled RestTemplate will parse the URL passed into it and use whatever is passed in as the server name as the key to query Ribbon for an instance of a service. The actual service location and port are completely abstracted from the developer.
In addition, by using the RestTemplate class, Ribbon will round-robin load balance all requests among all the service instances.
An alternative to the Spring Ribbon-enabled RestTemplate class is Netflix’s Feign client library. The Feign library takes a different approach to calling a REST service by having the developer first define a Java interface and then annotating that interface with Spring Cloud annotations to map what Eureka-based service Ribbon will invoke. The Spring Cloud framework will dynamically generate a proxy class that will be used to invoke the targeted REST service. There’s no code being written for calling the service other than an interface definition.
To enable the Feign client for use in your licensing service, you need to add a new annotation, @EnableFeignClients, to the licensing service’s src/main/java/com/thoughtmechanix/licenses/Application.java class. The following listing shows this code.
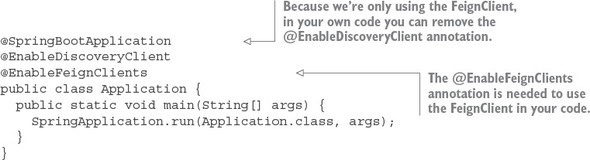
Now that you’ve enabled the Feign client for use in your licensing service, let’s look at a Feign client interface definition that can be used to call an endpoint on the organization service. The following listing shows an example. The code in this listing can be found in the src/main/java/com/thoughtmechanix/licenses/clients/OrganizationFeignClient.java class.
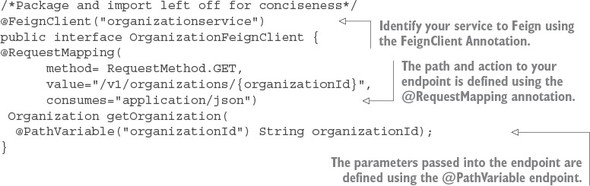
You start the Feign example by using the @FeignClient annotation and passing it the name of the application id of the service you want the interface to represent. Next you’ll define a method, getOrganization(), in your interface that can be called by the client to invoke the organization service.
How you define the getOrganization() method looks exactly like how you would expose an endpoint in a Spring Controller class. First, you’re going to define a @RequestMapping annotation for the getOrganization() method that will map the HTTP verb and endpoint that will be exposed on the organization service invocation. Second, you’ll map the organization ID passed in on the URL to an organizationId parameter on the method call, using the @PathVariable annotation. The return value from the call to the organization service will be automatically mapped to the Organization class that’s defined as the return value for the getOrganization() method.
To use the OrganizationFeignClient class, all you need to do is autowire and use it. The Feign Client code will take care of all the coding work for you.
When you use the standard Spring RestTemplate class, all service calls’ HTTP status codes will be returned via the ResponseEntity class’s getStatusCode() method. With the Feign Client, any HTTP 4xx – 5xx status codes returned by the service being called will be mapped to a FeignException. The FeignException will contain a JSON body that can be parsed for the specific error message.
Feign does provide you the ability to write an error decoder class that will map the error back to a custom Exception class. Writing this decoder is outside the scope of this book, but you can find examples of this in the Feign GitHub repository at (https://github.com/Netflix/feign/wiki/Custom-error-handling).
All systems, especially distributed systems, will experience failure. How we build our applications to respond to that failure is a critical part of every software developer’s job. However, when it comes to building resilient systems, most software engineers only take into account the complete failure of a piece of infrastructure or a key service. They focus on building redundancy into each layer of their application using techniques such as clustering key servers, load balancing between services, and segregation of infrastructure into multiple locations.
While these approaches take into account the complete (and often spectacular) loss of a system component, they address only one small part of building resilient systems. When a service crashes, it’s easy to detect that it’s no longer there, and the application can route around it. However, when a service is running slow, detecting that poor performance and routing around it is extremely difficult because
What’s insidious about problems caused by poorly performing remote services is that they’re not only difficult to detect, but can trigger a cascading effect that can ripple throughout an entire application ecosystem. Without safeguards in place, a single poorly performing service can quickly take down multiple applications. Cloud-based, microservice-based applications are particularly vulnerable to these types of outages because these applications are composed of a large number of fine-grained, distributed services with different pieces of infrastructure involved in completing a user’s transaction.
Client resiliency software patterns are focused on protecting a remote resource’s (another microservice call or database lookup) client from crashing when the remote resource is failing because that remote service is throwing errors or performing poorly. The goal of these patterns is to allow the client to “fail fast,” not consume valuable resources such as database connections and thread pools, and prevent the problem of the remote service from spreading “upstream” to consumers of the client.
There are four client resiliency patterns:
Figure 5.1 demonstrates how these patterns sit between the microservice service consumer and the microservice.
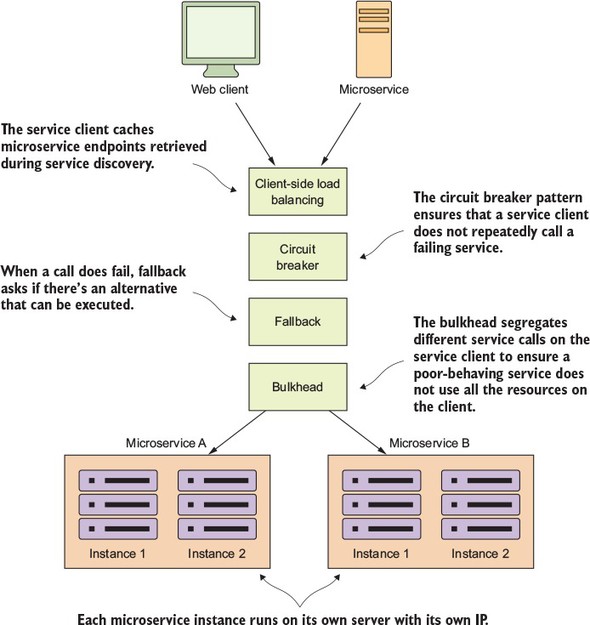
These patterns are implemented in the client calling the remote resource. The implementation of these patterns logically sit between the client consuming the remote resources and the resource itself.
We introduced the client-side load balancing pattern in the last chapter (chapter 4) when talking about service discovery. Client-side load balancing involves having the client look up all of a service’s individual instances from a service discovery agent (like Netflix Eureka) and then caching the physical location of said service instances. Whenever a service consumer needs to call that service instance, the client-side load balancer will return a location from the pool of service locations it’s maintaining.
Because the client-side load balancer sits between the service client and the service consumer, the load balancer can detect if a service instance is throwing errors or behaving poorly. If the client-side load balancer detects a problem, it can remove that service instance from the pool of available service locations and prevent any future service calls from hitting that service instance.
This is exactly the behavior that Netflix’s Ribbon libraries provide out of the box with no extra configuration. Because we covered client-side load balancing with Net-flix Ribbon in chapter 4, we won’t go into any more detail on that in this chapter.
The circuit breaker pattern is a client resiliency pattern that’s modeled after an electrical circuit breaker. In an electrical system, a circuit breaker will detect if too much current is flowing through the wire. If the circuit breaker detects a problem, it will break the connection with the rest of the electrical system and keep the downstream components from the being fried.
With a software circuit breaker, when a remote service is called, the circuit breaker will monitor the call. If the calls take too long, the circuit breaker will intercede and kill the call. In addition, the circuit breaker will monitor all calls to a remote resource and if enough calls fail, the circuit break implementation will pop, failing fast and preventing future calls to the failing remote resource.
With the fallback pattern, when a remote service call fails, rather than generating an exception, the service consumer will execute an alternative code path and try to carry out an action through another means. This usually involves looking for data from another data source or queueing the user’s request for future processing. The user’s call will not be shown an exception indicating a problem, but they may be notified that their request will have to be fulfilled at a later date.
For instance, suppose you have an e-commerce site that monitors your user’s behavior and tries to give them recommendations of other items they could buy. Typically, you might call a microservice to run an analysis of the user’s past behavior and return a list of recommendations tailored to that specific user. However, if the preference service fails, your fallback might be to retrieve a more general list of preferences that’s based off all user purchases and is much more generalized. This data might come from a completely different service and data source.
The bulkhead pattern is based on a concept from building ships. With a bulkhead design, a ship is divided into completely segregated and watertight compartments called bulkheads. Even if the ship’s hull is punctured, because the ship is divided into watertight compartments (bulkheads), the bulkhead will keep the water confined to the area of the ship where the puncture occurred and prevent the entire ship from filling with water and sinking.
The same concept can be applied to a service that must interact with multiple remote resources. By using the bulkhead pattern, you can break the calls to remote resources into their own thread pools and reduce the risk that a problem with one slow remote resource call will take down the entire application. The thread pools act as the bulkheads for your service. Each remote resource is segregated and assigned to the thread pool. If one service is responding slowly, the thread pool for that one type of service call will become saturated and stop processing requests. Service calls to other services won’t become saturated because they’re assigned to other thread pools.
We’ve talked about these different patterns in the abstract; however, let’s drill down to a more specific example of where these patterns can be applied. Let’s walk through a common scenario I’ve run into and see why client resiliency patterns such as the circuit breaker pattern are critical for implementing a service-based architecture, particularly a microservice architecture running in the cloud.
In figure 5.2, I show a typical scenario involving the use of remote resource like a database and remote service.
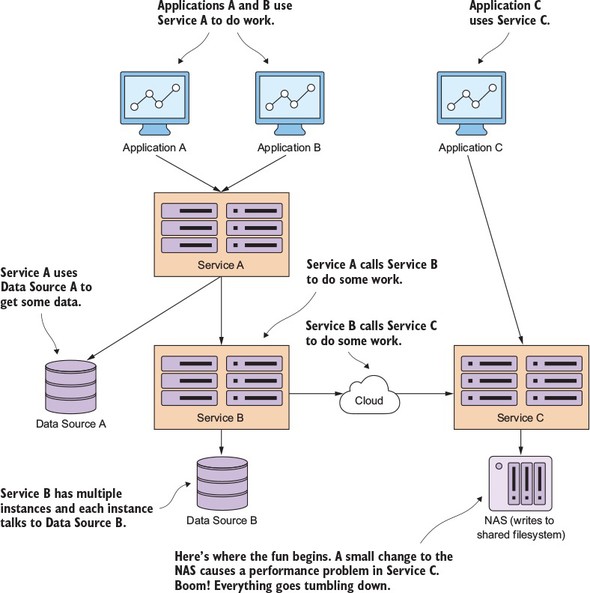
In the scenario in figure 5.2, three applications are communicating in one fashion or another with three different services. Applications A and B communicate directly with Service A. Service A retrieves data from a database and calls Service B to do work for it. Service B retrieves data from a completely different database platform and calls out to another service, Service C, from a third-party cloud provider whose service relies heavily on an internal Network Area Storage (NAS) device to write data to a shared file system. In addition, Application C directly calls Service C.
Over the weekend, a network administrator made what they thought was a small tweak to the configuration on the NAS, as shown in bold in figure 5.2. This change appears to work fine, but on Monday morning, any reads to a particular disk subsystem start performing extremely slowly.
The developer who wrote Service B never anticipated slowdowns occurring with calls to Service C. They wrote their code so that the writes to their database and the reads from the service occur within the same transaction. When Service C starts running slowly, not only does the thread pool for requests to Service C start backing up, the number of database connections in the service container’s connection pools become exhausted because these connections are being held open because the calls out to Service C never complete.
Finally, Service A starts running out of resources because it’s calling Service B, which is running slow because of Service C. Eventually, all three applications stop responding because they run out of resources while waiting for requests to complete.
This whole scenario could be avoided if a circuit-breaker pattern had been implemented at each point where a distributed resource had been called (either a call to the database or a call to the service). In figure 5.2, if the call to Service C had been implemented with a circuit breaker, then when service C started performing poorly, the circuit breaker for that specific call to Service C would have been tripped and failed fast without eating up a thread. If Service B had multiple endpoints, only the endpoints that interacted with that specific call to Service C would be impacted. The rest of Service B’s functionality would still be intact and could fulfill user requests.
A circuit breaker acts as a middle man between the application and the remote service. In the previous scenario, a circuit breaker implementation could have protected Applications A, B, and C from completely crashing.
In figure 5.3, the Service B (the client) is never going to directly invoke Service C. Instead, when the call is made, Service B is going to delegate the actual invocation of the service to the circuit breaker, which will take the call and wrap it in a thread (usually managed by a thread pool) that’s independent of the originating caller. By wrapping the call in a thread, the client is no longer directly waiting for the call to complete. Instead, the circuit breaker is monitoring the thread and can kill the call if the thread runs too long.
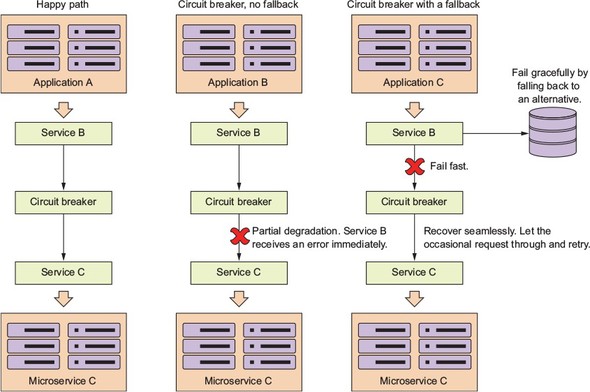
Three scenarios are shown in figure 5.3. In the first scenario, the happy path, the circuit breaker will maintain a timer and if the call to the remote service completes before the timer runs out, everything is good and Service B can continue its work. In the partial degradation scenario, Service B will call Service C through the circuit breaker. This time, though, Service C is running slow and the circuit breaker will kill the connection out to the remote service if it doesn’t complete before the timer on the thread maintained by the circuit breaker times out.
Service B will then get an error from making the call, but Service B won’t have resources (that is, its own thread or connection pools) tied up waiting for Service C to complete. If the call to Service C is timed-out by the circuit breaker, the circuit breaker will start tracking the number of failures that have occurred.
If enough errors on the service have occurred within a certain time period, the circuit breaker will now “trip” the circuit and all calls to Service C will fail without calling Service C.
This tripping of the circuit allows three things to occur:
Finally, the circuit breaker will occasionally let calls through to a degraded service, and if those calls succeed enough times in a row, the circuit breaker will reset itself.
The key thing a circuit break patterns offers is the ability for remote calls to
In a large cloud-based application with hundreds of services, this graceful recovery is critical because it can significantly cut down on the amount of time needed to restore service and significantly lessen the risk of a tired operator or application engineer causing greater problems by having them intervene directly (restarting a failed service) in the restoration of the service.
Building implementations of the circuit breaker, fallback, and bulkhead patterns requires intimate knowledge of threads and thread management. Let’s face it, writing robust threading code is an art (which I’ve never mastered) and doing it correctly is difficult. To implement a high-quality set of implementations for the circuit-breaker, fallback, and bulkhead patterns would require a tremendous amount of work. Fortunately, you can use Spring Cloud and Netflix’s Hystrix library to provide you a battle-tested library that’s used daily in Netflix’s microservice architecture.
In the next several sections of this chapter we’re going to cover how to
To begin our exploration of Hystrix, you need to set up your project pom.xml to import the Spring Hystrix dependencies. You’ll take your licensing service that we’ve been building and modify its pom.xml by adding the maven dependencies for Hystrix:
<dependency>
 <groupId>org.springframework.cloud</groupId>
 <artifactId>spring-cloud-starter-hystrix</artifactId>
</dependency>
<dependency>
  <groupId>com.netflix.hystrix</groupId>
  <artifactId>hystrix-javanica</artifactId>
  <version>1.5.9</version>
</dependency>
The first <dependency> tag (spring-cloud-starter-hystrix) tells Maven to pull down the Spring Cloud Hystrix dependencies. This second <dependency> tag (hystrix-javanica) will pull down the core Netflix Hystrix libraries. With the Maven dependencies set up, you can go ahead and begin your Hystrix implementation using the licensing and organization services you built in previous chapters.
You don’t have to include the hystrix-javanica dependencies directly in the pom.xml. By default, the spring-cloud-starter-hystrix includes a version of the hystrix-javanica dependencies. The Camden.SR5 release of the book used hystrix-javanica-1.5.6. The version of hystrix-javanica had an inconsistency introduced into it that caused the Hystrix code without a fallback to throw a java.lang.reflect. UndeclaredThrowableException instead of a com.netflix. hystrix.exception.HystrixRuntimeException. This was a breaking change for many developers who used older versions of Hystrix. The hystrix-javanica libraries fixed this in later releases, so I’ve purposely used a later version of hystrix-javanica instead of using the default version pulled in by Spring Cloud.
The last thing that needs to be done before you can begin using Hystrix circuit breakers within your application code is to annotate your service’s bootstrap class with the @EnableCircuitBreaker annotation. For example, for the licensing service, you’d add the @EnableCircuitBreaker annotation to the licensing-service/src/main/java/com/thoughtmechanix/licenses/Application.java class. The following listing shows this code.
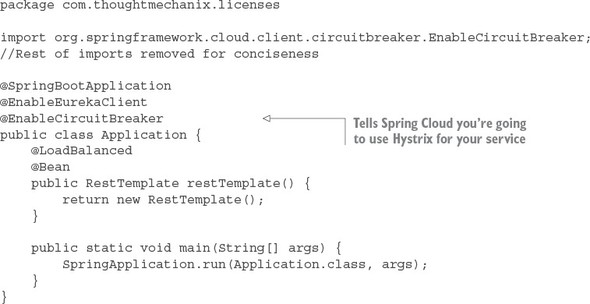
If you forget to add the @EnableCircuitBreaker annotation to your bootstrap class, none of your Hystrix circuit breakers will be active. You won’t get any warning or error messages when the service starts up.
We’re going to look at implementing Hystrix in two broad categories. In the first category, you’re going to wrap all calls to your database in the licensing and organization service with a Hystrix circuit breaker. You’re then going to wrap the inter-service calls between the licensing service and the organization service using Hystrix. While these are two different categories calls, you’ll see that the use of Hystrix will be exactly the same. Figure 5.4 shows what remote resources you’re going to wrap with a Hystrix circuit breaker.
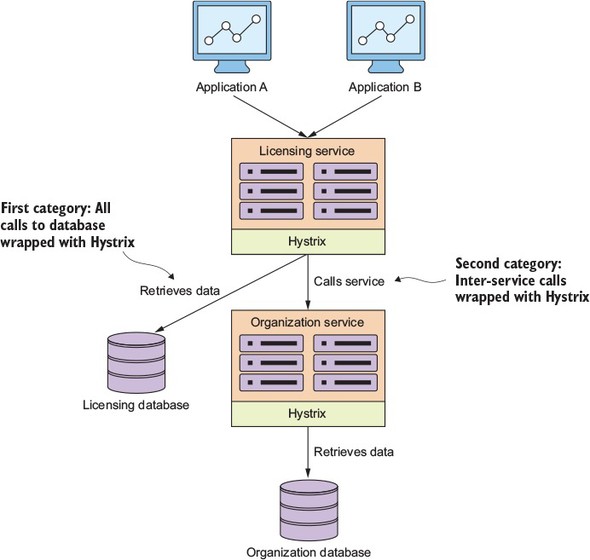
Let’s start our Hystrix discussion by showing how to wrap the retrieval of licensing service data from the licensing database using a synchronous Hystrix circuit breaker. With a synchronous call, the licensing service will retrieve its data but will wait for the SQL statement to complete or for a circuit-breaker time-out before continuing processing.
Hystrix and Spring Cloud use the @HystrixCommand annotation to mark Java class methods as being managed by a Hystrix circuit breaker. When the Spring framework sees the @HystrixCommand, it will dynamically generate a proxy that will wrapper the method and manage all calls to that method through a thread pool of threads specifically set aside to handle remote calls.
You’re going to wrap the getLicensesByOrg() method in your licensing-service/src/main/java/com/thoughtmechanix/licenses/services/LicenseService.java class, as shown in the following listing.
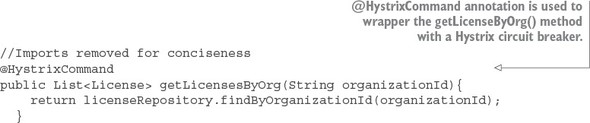
If you look at the code in listing 5.2 in the source code repository, you’ll see several more parameters on the @HystrixCommand annotation than what’s shown in the previous listing. We’ll get into those parameters later in the chapter. The code in listing 5.2 is using the @HystrixCommand annotation with all its default values.
This doesn't look like a lot of code, and it's not, but there is a lot of functionality inside this one annotation. With the use of the @HystrixCommand annotation, any time the getLicensesByOrg() method is called, the call will be wrapped with a Hystrix circuit breaker. The circuit breaker will interrupt any call to the getLicensesByOrg() method any time the call takes longer than 1,000 milliseconds.
This code example would be boring if the database is working properly. Let's simulate the getLicensesByOrg() method running into a slow database query by having the call take a little over a second on approximately every one in three calls. The following listing demonstrates this.
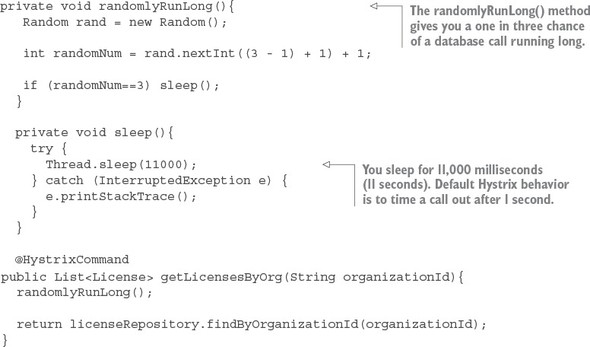
If you hit the http://localhost/v1/organizations/e254f8c-c442-4ebe-a82a-e2fc1d1ff78a/licenses/ endpoint enough times, you should see a timeout error message returned from the licensing service. Figure 5.5 shows this error.
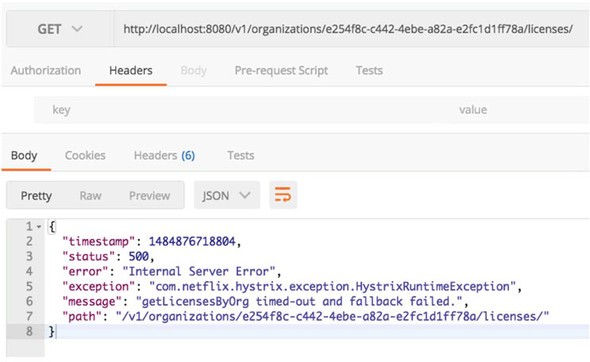
Now, with @HystrixCommand annotation in place, the licensing service will interrupt a call out to its database if the query takes too long. If the database calls take longer than 1,000 milliseconds to execute the Hystrix code wrapping, your service call will throw a com.nextflix.hystrix.exception.HystrixRuntimeException exception.
The beauty of using method-level annotations for tagging calls with circuit-breaker behavior is that it’s the same annotation whether you’re accessing a database or calling a microservice.
For instance, in your licensing service you need to look up the name of the organization associated with the license. If you want to wrap your call to the organization service with a circuit breaker, it’s as simple as breaking the RestTemplate call into its own method and annotating it with the @HystrixCommand annotation:
@HystrixCommand
private Organization getOrganization(String organizationId) {
 return organizationRestClient.getOrganization(organizationId);
}
While using the @HystrixCommand is easy to implement, you do need to be careful about using the default @HystrixCommand annotation with no configuration on the annotation. By default, when you specify a @HystrixCommand annotation without properties, the annotation will place all remote service calls under the same thread pool. This can introduce problems in your application. Later in the chapter when we talk about implementing the bulkhead pattern, we’ll show you how to segregate these remote service calls into their own thread pools and configure the behavior of the thread pools to be independent of one another.
One of the first questions I often run into when working with new developers and Hystrix is how they can customize the amount of time before a call is interrupted by Hystrix. This is easily accomplished by passing additional parameters into the @HystrixCommand annotation. The following listing demonstrates how to customize the amount of time Hystrix waits before timing out a call.
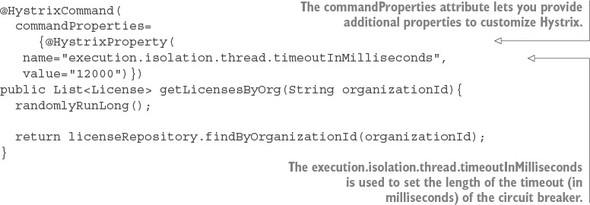
Hystrix allows you to customize the behavior of the circuit breaker through the commandProperties attribute. The commandProperties attribute accepts an array of HystrixProperty objects that can pass in custom properties to configure the Hystrix circuit breaker. In listing 5.4, you use the execution.isolation.thread.timeoutInMilliseconds property to set the maximum timeout a Hystrix call will wait before failing to be 12 seconds.
Now if you rebuild and rerun the code example, you’ll never get a timeout error because your artificial timeout on the call is 11 seconds while your @HystrixCommand annotation is now configured to only time out after 12 seconds.
It should be obvious that I’m using a circuit breaker timeout of 12 seconds as a teaching example. In a distributed environment, I often get nervous if I start hearing comments from development teams that a 1 second timeout on remote service calls is too low because their service X takes on average 5-6 seconds.
This usually tells me that unresolved performance problems exist with the service being called. Avoid the temptation to increase the default timeout on Hystrix calls unless you absolutely cannot resolve a slow running service call.
If you do have a situation where part of your service calls are going to take longer than other service calls, definitely look at segregating these service calls into separate thread pools.
Part of the beauty of the circuit breaker pattern is that because a “middle man” is between the consumer of a remote resource and the resource itself, you have an opportunity for the developer to intercept a service failure and choose an alternative course of action to take.
In Hystrix, this is known as a fallback strategy and is easily implemented. Let’s see how to build a simple fallback strategy for your licensing database that simply returns a licensing object that says no licensing information is currently available. The following listing demonstrates this.
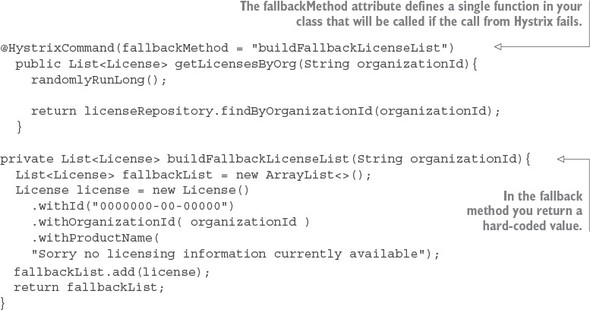
In the source code from the GitHub repository, I comment out the fallbackMethod line so that you can see the service call randomly fail. To see the fallback code in listing 5.5 in action you’ll need to uncomment out the fallbackMethod attribute. Otherwise, you will never see the fallback actually being invoked.
To implement a fallback strategy with Hystrix you have to do two things. First, you need to add an attribute called fallbackMethod to the @HystrixCommand annotation. This attribute will contain the name of a method that will be called when Hystrix has to interrupt a call because it’s taking too long.
The second thing you need to do is define a fallback method to be executed. This fallback method must reside in the same class as the original method that was protected by the @HystrixCommand. The fallback method must have the exact same method signature as the originating function as all of the parameters passed into the original method protected by the @HystrixCommand will be passed to the fallback.
In the example in listing 5.5, the fallback method buildFallbackLicense-List() is simply constructing a single License object containing dummy information. You could have your fallback method read this data from an alternative data source, but for demonstration purposes you’re going to construct a list that would have been returned by your original function call.
The fallback strategy works extremely well in situations where your microservice is retrieving data and the call fails. In one organization I worked at, we had customer information stored in an operational data store (ODS) and also summarized in a data warehouse.
Our happy path was to always retrieve the most recent data and calculate summary information for it on the fly. However, after a particularly nasty outage where a slow database connection took down multiple services, we decided to protect the service call that retrieved and summarized the customer’s information with a Hystrix fallback implementation. If the call to the ODS failed due to a performance problem or an error, we used a fallback to retrieve the summarized data from our data warehouse tables.
Our business team decided that giving the customer’s older data was preferable to having the customer see an error or have the entire application crash. The key when choosing whether to use a fallback strategy is the level of tolerance your customers have to the age of their data and how important it is to never let them see the application having problems.
Here are a few things to keep in mind as you determine whether you want to implement a fallback strategy:
Now that you have your fallback in place, go ahead and call your endpoint again. This time when you hit it and encounter a timeout error (remember you have a one in 3 chance) you shouldn’t get an exception back from the service call, but instead have the dummy license values returned.
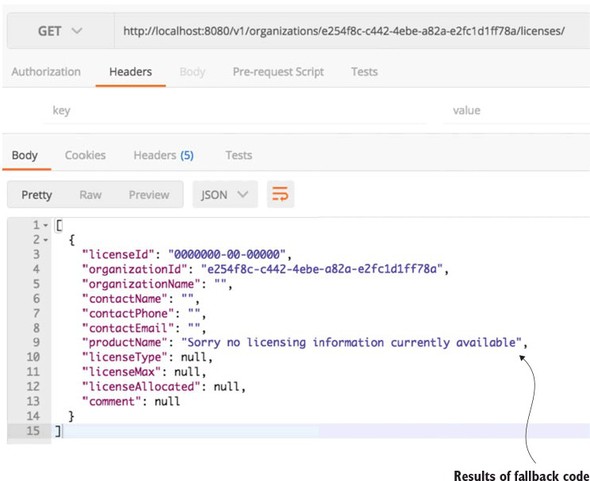
In a microservice-based application you’ll often need to call multiple microservices to complete a particular task. Without using a bulkhead pattern, the default behavior for these calls is that the calls are executed using the same threads that are reserved for handling requests for the entire Java container. In high volumes, performance problems with one service out of many can result in all of the threads for the Java container being maxed out and waiting to process work, while new requests for work back up. The Java container will eventually crash. The bulkhead pattern segregates remote resource calls in their own thread pools so that a single misbehaving service can be contained and not crash the container.
Hystrix uses a thread pool to delegate all requests for remote services. By default, all Hystrix commands will share the same thread pool to process requests. This thread pool will have 10 threads in it to process remote service calls and those remote services calls could be anything, including REST-service invocations, database calls, and so on. Figure 5.7 illustrates this.
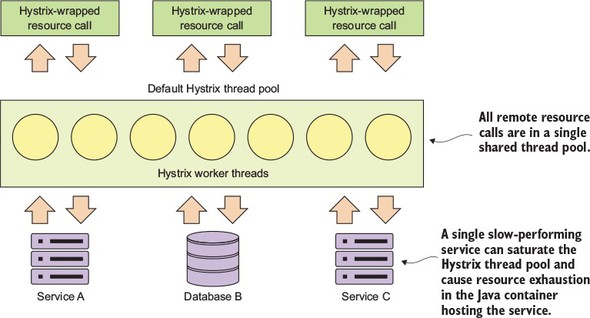
This model works fine when you have a small number of remote resources being accessed within an application and the call volumes for the individual services are relatively evenly distributed. The problem is if you have services that have far higher volumes or longer completion times then other services, you can end up introducing thread exhaustion into your Hystrix thread pools because one service ends up dominating all of the threads in the default thread pool.
Fortunately, Hystrix provides an easy-to-use mechanism for creating bulkheads between different remote resource calls. Figure 5.8 shows what Hystrix managed resources look like when they’re segregated into their own “bulkheads.”
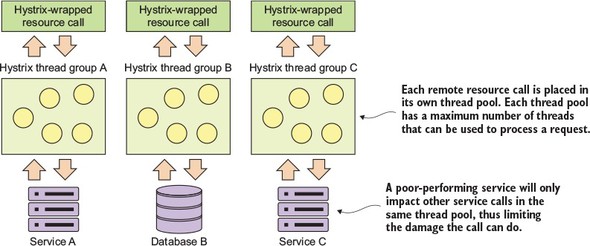
To implement segregated thread pools, you need to use additional attributes exposed through the @HystrixCommand annotation. Let’s look at some code that will
The following listing demonstrates how to set up a bulkhead around all calls surrounding the look-up of licensing data from our licensing service.
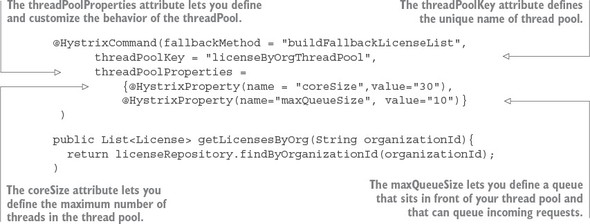
The first thing you should notice is that we’ve introduced a new attribute, threadPoolkey, to your @HystrixCommand annotation. This signals to Hystrix that you want to set up a new thread pool. If you set no further values on the thread pool, Hystrix sets up a thread pool keyed off the name in the threadPoolKey attribute, but will use all default values for how the thread pool is configured.
To customize your thread pool, you use the threadPoolProperties attribute on the @HystrixCommand. This attribute takes an array of HystrixProperty objects. These HystrixProperty objects can be used to control the behavior of the thread pool. You can set the size of the thread pool by using the coreSize attribute.
You can also set up a queue in front of the thread pool that will control how many requests will be allowed to back up when the threads in the thread pool are busy. This queue size is set by the maxQueueSize attribute. Once the number of requests exceeds the queue size, any additional requests to the thread pool will fail until there is room in the queue.
Note two things about the maxQueueSize attribute. First, if you set the value to -1, a Java SynchronousQueue will be used to hold all incoming requests. A synchronous queue will essentially enforce that you can never have more requests in process then the number of threads available in the thread pool. Setting the maxQueueSize to a value greater than one will cause Hystrix to use a Java LinkedBlockingQueue. The use of a LinkedBlockingQueue allows the developer to queue up requests even if all threads are busy processing requests.
The second thing to note is that the maxQueueSize attribute can only be set when the thread pool is first initialized (for example, at startup of the application). Hystrix does allow you to dynamically change the size of the queue by using the queueSizeRejectionThreshold attribute, but this attribute can only be set when the maxQueueSize attribute is a value greater than 0.
What’s the proper sizing for a custom thread pool? Netflix recommends the following formula:
(requests per second at peak when the service is healthy * 99th percentile latency in seconds) + small amount of extra threads for overhead
You often don’t know the performance characteristics of a service until it has been under load. A key indicator that the thread pool properties need to be adjusted is when a service call is timing out even if the targeted remote resource is healthy.
At this point we’ve looked at the basic concepts of setting up a circuit breaker and bulkhead pattern using Hystrix. We’re now going to go through and see how to really customize the behavior of the Hystrix’s circuit breaker. Remember, Hystrix does more than time out long-running calls. Hystrix will also monitor the number of times a call fails and if enough calls fail, Hystrix will automatically prevent future calls from reaching the service by failing the call before the requests ever hit the remote resource.
There are two reasons for this. First, if a remote resource is having performance problems, failing fast will prevent the calling application from having to wait for a call to time out. This significantly reduces the risk that the calling application or service will experience its own resource exhaustion problems and crashes. Second, failing fast and preventing calls from service clients will help a struggling service keep up with its load and not crash completely under the load. Failing fast gives the system experiencing performance degradation time to recover.
To understand how to configure the circuit breaker in Hystrix, you need to first understand the flow of how Hystrix determines when to trip the circuit breaker. Figure 5.9 shows the decision process used by Hystrix when a remote resource call fails.
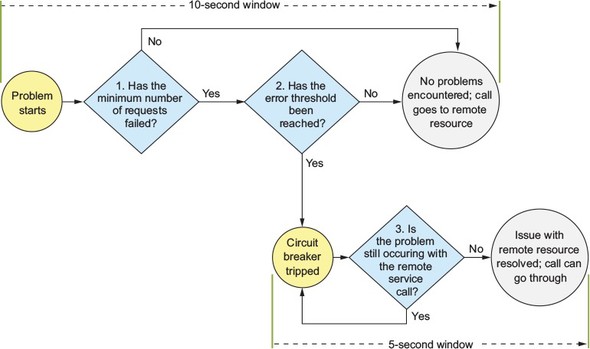
Whenever a Hystrix command encounters an error with a service, it will begin a 10-second timer that will be used to examine how often the service call is failing. This 10-second window is configurable. The first thing Hystrix does is look at the number of calls that have happened within the 10-second window. If the number of calls is less than a minimum number of calls that need to occur within the window, then Hystrix will not take action even if several of the calls failed. For example, the default number of calls that need to occur before Hystrix will even consider action within the 10-second window is 20. If 15 of those calls fail within a 10-second period, not enough of the calls have occurred for them to “trip” the circuit breaker even if all 15 calls failed. Hystrix will continue letting calls go through to the remote service.
When the minimum number of remote resource calls has occurred within the 10-second window, Hystrix will begin looking at the percentage of overall failures that have occurred. If the overall percentage of failures is over the threshold, Hystrix will trigger the circuit breaker and fail almost all future calls. As we’ll discuss shortly, Hystrix will let part of the calls through to “test” and see if the service is backing up. The default value for the error threshold is 50%.
If that percentage has been exceeded, Hystrix will “trip” the circuit breaker and prevent further calls from hitting the remote resource. If that percentage of remote calls hasn’t been triggered and the 10-second window has been passed, Hystrix will reset the circuit breaker statistics.
When Hystrix has “tripped” the circuit breaker on a remote call, it will try to start a new window of activity. Every five seconds (this value is configurable), Hystrix will let a call through to the struggling service. If the call succeeds, Hystrix will reset the circuit breaker and start letting calls through again. If the call fails, Hystrix will keep the circuit breaker closed and try again in another five seconds.
Based on this, you can see that there are five attributes you can use to customize the circuit breaker behavior. The @HystrixCommand annotation exposes these five attributes via the commandPoolProperties attribute. While the threadPoolProperties attribute allows you to set the behavior of the underlying thread pool used in the Hystrix command, the commandPoolProperties attribute allows you to customize the behavior of the circuit breaker associated with Hystrix command. The following listing shows the names of the attributes along with how to set values in each of them.
@HystrixCommand(
   fallbackMethod = "buildFallbackLicenseList",
   threadPoolKey = "licenseByOrgThreadPool",
   threadPoolProperties ={
         @HystrixProperty(name = "coreSize",value="30"),
        @HystrixProperty(name="maxQueueSize"value="10"),
   },
   commandPoolProperties ={
     @HystrixProperty(
      name="circuitBreaker.requestVolumeThreshold",
       value="10"),
       @HystrixProperty(
      name="circuitBreaker.errorThresholdPercentage",
       value="75"),

         @HystrixProperty(
           name="circuitBreaker.sleepWindowInMilliseconds",
           value="7000"),
            @HystrixProperty(
           name="metrics.rollingStats.timeInMilliseconds",
            value="15000")
         @HystrixProperty(
           name="metrics.rollingStats.numBuckets",
            value="5")}
     )
  public List<License> getLicensesByOrg(String organizationId){
   logger.debug("getLicensesByOrg Correlation id: {}",
   UserContextHolder
               .getContext()
               .getCorrelationId());
    randomlyRunLong();

    return licenseRepository.findByOrganizationId(organizationId);
  }
The first property, circuitBreaker.requestVolumeTheshold, controls the amount of consecutive calls that must occur within a 10-second window before Hystrix will consider tripping the circuit breaker for the call. The second property, circuitBreaker.errorThresholdPercentage, is the percentage of calls that must fail (due to timeouts, an exception being thrown, or a HTTP 500 being returned) after the circuitBreaker.requestVolumeThreshold value has been passed before the circuit breaker it tripped. The last property in the previous code example, circuitBreaker.sleepWindowInMilliseconds, is the amount of time Hystrix will sleep once the circuit breaker is tripped before Hystrix will allow another call through to see if the service is healthy again.
The last two Hystrix properties (metrics.rollingStats.timeInMilliseconds and metrics.rollingStats.numBuckets) are named a bit differently than the previous properties, but they still control the behavior of the circuit breaker. The first property, metrics.rollingStats.timeInMilliseconds, is used to control the size of the window that will be used by Hystrix to monitor for problems with a service call. The default value for this is 10,000 milliseconds (that is, 10 seconds).
The second property, metrics.rollingStats.numBuckets, controls the number of times statistics are collected in the window you’ve defined. Hystrix collects metrics in buckets during this window and checks the stats in those buckets to determine if the remote resource call is failing. The number of buckets defined must evenly divide into the overall number of milliseconds set for rollingStatus.inMilliseconds stats. For example, in your custom settings in the previous listing, Hystrix will use a 15-second window and collect statistics data into five buckets of three seconds in length.
The smaller the statistics window you check in and the greater the number of buckets you keep within the window will drive up CPU and memory utilization on a high-volume service. Be aware of this and fight the temptation to set the metrics collection windows and buckets to be fine-grained until you need that level of visibility.
The Hystrix library is extremely configurable and lets you tightly control the behavior of the circuit breaker and bulkhead patterns you define with it. By modifying the configuration of a Hystrix circuit breaker, you can control the amount of time Hystrix will wait before timing out a remote call. You can also control the behavior of when a Hystrix circuit breaker will trip and when Hystrix tries to reset the circuit breaker.
With Hystrix you can also fine-tune your bulkhead implementations by defining individual thread groups for each remote service call and then configure the number of threads associated with each thread group. This allows you to fine-tune your remote service calls because certain calls will have higher volumes then others, while other remote resource calls will have higher volumes.
The key thing to remember as you look at configuring your Hystrix environment is that you have three levels of configuration with Hystrix:
Every Hystrix property has values set by default that will be used by every @HystrixCommand annotation in the application unless they’re set at the Java class level or overridden for individual Hystrix thread pools within a class.
Hystrix does let you set default parameters at the class level so that all Hystrix commands within a specific class share the same configurations. The class-level properties are set via a class-level annotation called @DefaultProperties. For example, if you wanted all the resources within a specific class to have a timeout of 10 seconds, you could set the @DefaultProperties in the following manner:
@DefaultProperties(
  commandProperties = {
   @HystrixProperty(
    name = "execution.isolation.thread.timeoutInMilliseconds",
   value = "10000")}
class MyService { ... }
Unless explicitly overridden at a thread-pool level, all thread pools will inherit either the default properties at the application level or the default properties defined in the class. The Hystrix threadPoolProperties and commandProperties are also tied to the defined command key.
For the coding examples, I’ve hard-coded all the Hystrix values in the application code. In a production system, the Hystrix data that’s most likely to need to be tweaked (timeout parameters, thread pool counts) would be externalized to Spring Cloud Config. This way if you need to change the parameter values, you could change the values and then restart the service instances without having to recompile and redeploy the application.
For individual Hystrix pools, I will keep the configuration as close to the code as possible and place the thread-pool configuration right in the @HystrixCommand annotation. Table 5.1 summarizes all of the configuration values used to set up and configure our @HystrixCommand annotations.
|
Property Name |
Default Value |
Description |
|---|---|---|
| fallbackMethod | None | Identifies the method within the class that will be called if the remote call times out. The callback method must be in the same class as the @HystrixCommand annotation and must have the same method signature as the calling class. If no value, an exception will be thrown by Hystrix. |
| threadPoolKey | None | Gives the @HystrixCommand a unique name and creates a thread pool that is independent of the default thread pool. If no value is defined, the default Hystrix thread pool will be used. |
| threadPoolProperties | None | Core Hystrix annotation attribute that’s used to configure the behavior of a thread pool. |
| coreSize | 10 | Sets the size of the thread pool. |
| maxQueueSize | -1 | Maximum queue size that will set in front of the thread pool. If set to -1, no queue is used and instead Hystrix will block until a thread becomes available for processing. |
| circuitBreaker.request-VolumeThreshold | 20 | Sets the minimum number of requests that must be processed within the rolling window before Hystrix will even begin examining whether the circuit breaker will be tripped. Note: This value can only be set with the commandPoolProperties attribute. |
| circuitBreaker.error-ThresholdPercentage | 50 | The percentage of failures that must occur within the rolling window before the circuit breaker is tripped. Note: This value can only be set with the commandPoolProperties attribute. |
| circuitBreaker.sleep-WindowInMilliseconds | 5,000 | The number of milliseconds Hystrix will wait before trying a service call after the circuit breaker has been tripped. Note: This value can only be set with the commandPoolProperties attribute. |
| metricsRollingStats.timeInMilliseconds | 10,000 | The number of milliseconds Hystrix will collect and monitor statistics about service calls within a window. |
| metricsRollingStats.numBuckets | 10 | The number of metrics buckets Hystrix will maintain within its monitoring window. The more buckets within the monitoring window, the lower the level of time Hystrix will monitor for faults within the window. |
When an @HystrixCommand is executed, it can be run with two different isolation strategies: THREAD and SEMAPHORE. By default, Hystrix runs with a THREAD isolation. Each Hystrix command used to protect a call runs in an isolated thread pool that doesn’t share its context with the parent thread making the call. This means Hystrix can interrupt the execution of a thread under its control without worrying about interrupting any other activity associated with the parent thread doing the original invocation.
With SEMAPHORE-based isolation, Hystrix manages the distributed call protected by the @HystrixCommand annotation without starting a new thread and will interrupt the parent thread if the call times out. In a synchronous container server environment (Tomcat), interrupting the parent thread will cause an exception to be thrown that cannot be caught by the developer. This can lead to unexpected consequences for the developer writing the code because they can’t catch the thrown exception or do any resource cleanup or error handling.
To control the isolation setting for a command pool, you can set a command-Properties attribute on your @HystrixCommand annotation. For instance, if you wanted to set the isolation level on a Hystrix command to use a SEMAPHORE isolation, you’d use
@HystrixCommand(
commandProperties = {
 @HystrixProperty(
    name="execution.isolation.strategy", value="SEMAPHORE")})
By default, the Hystrix team recommends you use the default isolation strategy of THREAD for most commands. This keeps a higher level of isolation between you and the parent thread. THREAD isolation is heavier than using the SEMAPHORE isolation. The SEMAPHORE isolation model is lighter-weight and should be used when you have a high-volume on your services and are running in an asynchronous I/O programming model (you are using an asynchronous I/O container such as Netty).
Hystrix, by default, will not propagate the parent thread’s context to threads managed by a Hystrix command. For example, any values set as ThreadLocal values in the parent thread will not be available by default to a method called by the parent thread and protected by the @HystrixCommand object. (Again, this is assuming you are using a THREAD isolation level.)
This can be a little obtuse, so let’s see a concrete example. Often in a REST-based environment you are going to want to pass contextual information to a service call that will help you operationally manage the service. For example, you might pass a correlation ID or authentication token in the HTTP header of the REST call that can then be propagated to any downstream service calls. The correlation ID allows you to have a unique identifier that can be traced across multiple service calls in a single transaction.
To make this value available anywhere in your service call, you might use a Spring Filter class to intercept every call into your REST service and retrieve this information from the incoming HTTP request and store this contextual information in a custom UserContext object. Then, anytime your code needs to access this value in your REST service call, your code can retrieve the UserContext from the ThreadLocal storage variable and read the value. The following listing shows an example Spring Filter that you can use in your licensing service. You can find the code at licensingservice/src/main/java/com/thoughtmechanix/licenses/utils/UserContextFilter.java.
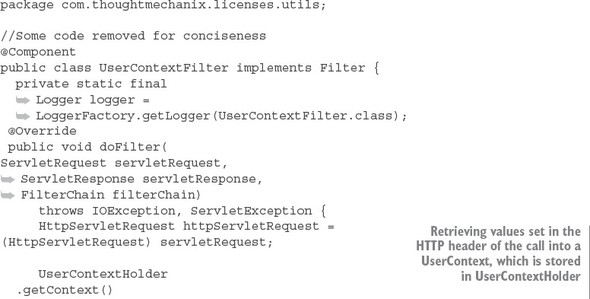
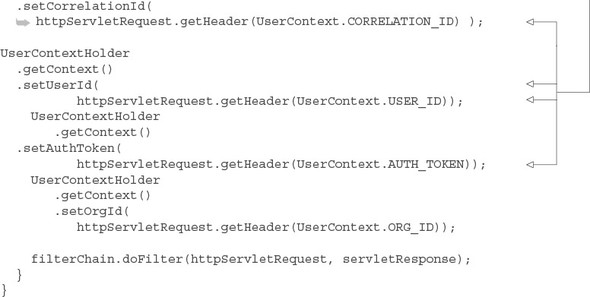
The UserContextHolder class is used to store the UserContext in a ThreadLocal class. Once it’s stored in the ThreadLocal storage, any code that’s executed for a request will use the UserContext object stored in the UserContextHolder. The UserContextHolder class is shown in the following listing. This class is found at licensing-service/src/main/java/com/thoughtmechanix/licenses/utils/UserContextHolder.java.
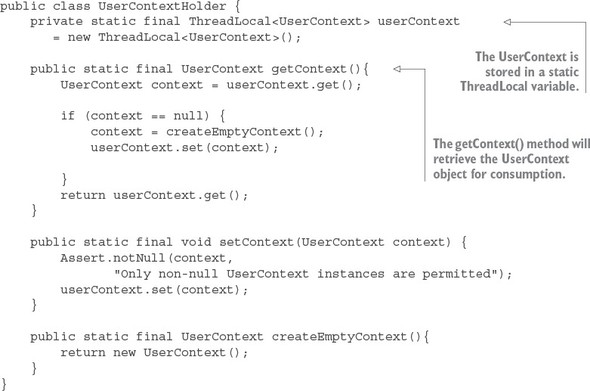
At this point you can add a couple of log statements to your licensing service. You’ll add logging to the following licensing service classes and methods:
Next you’ll call your service passing in a correlation ID using an HTTP header called tmx-correlation-id and a value of TEST-CORRELATION-ID. Figure 5.10 shows a HTTP GET call to http://localhost:8080/v1/organizations/e254f8c-c442-4ebe-a82a-e2fc1d1ff78a/licenses/ in Postman.
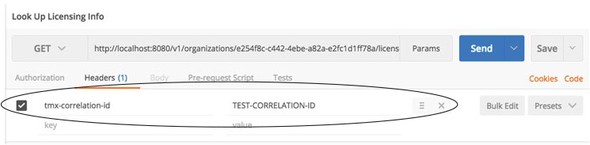
Once this call is submitted, you should see three log messages writing out the passed-in correlation ID as it flows through the UserContext, LicenseServiceController, and LicenseServer classes:
UserContext Correlation id: TEST-CORRELATION-ID
LicenseServiceController Correlation id: TEST-CORRELATION-ID
LicenseService.getLicenseByOrg Correlation:
As expected, once the call hits the Hystrix protected method on License-Service.getLicensesByOrder(), you’ll get no value written out for the correlation ID. Fortunately, Hystrix and Spring Cloud offer a mechanism to propagate the parent thread’s context to threads managed by the Hystrix Thread pool. This mechanism is called a HystrixConcurrencyStrategy.
Hystrix allows you to define a custom concurrency strategy that will wrap your Hystrix calls and allows you to inject any additional parent thread context into the threads managed by the Hystrix command. To implement a custom HystrixConcurrency-Strategy you need to carry out three actions:
All the examples for the HystrixConcurrencyStrategy can be found in the licensing-service/src/main/java/com/thoughtmechanix/licenses/hystrix package.
The first thing you need to do is define your HystrixConcurrencyStrategy. By default, Hystrix only allows you to define one HystrixConcurrencyStrategy for an application. Spring Cloud already defines a concurrency strategy used to handle propagating Spring security information. Fortunately, Spring Cloud allows you to chain together Hystrix concurrency strategies so you can define and use your own concurrency strategy by “plugging” it into the Hystrix concurrency strategy.
Our implementation of a Hystrix concurrency strategy can be found in the licensing services hystrix package and is called ThreadLocalAwareStrategy.java. The following listing shows the code for this class.
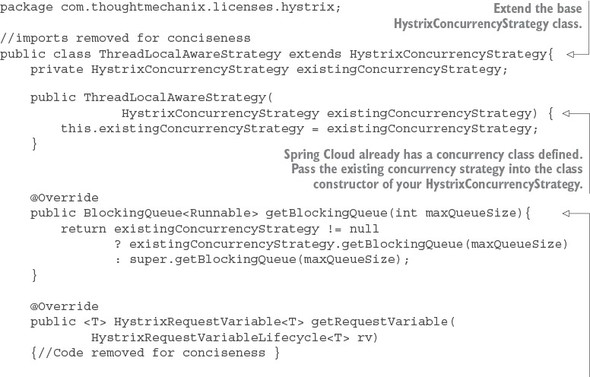
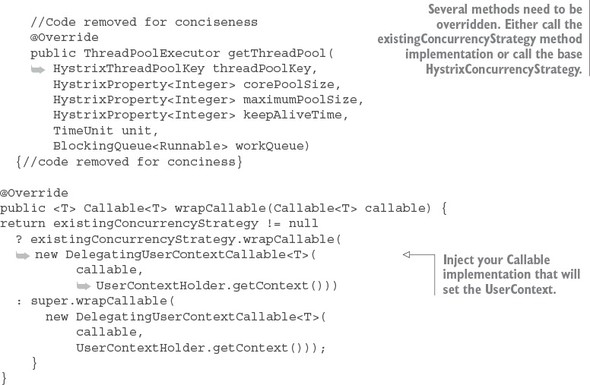
Note a couple of things in the class implementation in listing 5.10. First, because Spring Cloud already defines a HystrixConcurrencyStrategy, every method that could be overridden needs to check whether an existing concurrency strategy is present and then either call the existing concurrency strategy’s method or the base Hystrix concurrency strategy method. You have to do this as a convention to ensure that you properly invoke the already-existing Spring Cloud’s HystrixConcurrency-Strategy that deals with security. Otherwise, you can have nasty behavior when trying to use Spring security context in your Hystrix protected code.
The second thing to note is the wrapCallable() method in listing 5.11. In this method, you pass in Callable implementation, DelegatingUserContext-Callable, that will be used to set the UserContext from the parent thread executing the user’s REST service call to the Hystrix command thread protecting the method that’s doing the work within.
The next step in propagating the thread context of the parent thread to your Hystrix command is to implement the Callable class that will do the propagation. For this example, this call is in the hystrix package and is called DelegatingUser-ContextCallable.java. The following listing shows the code from this class.
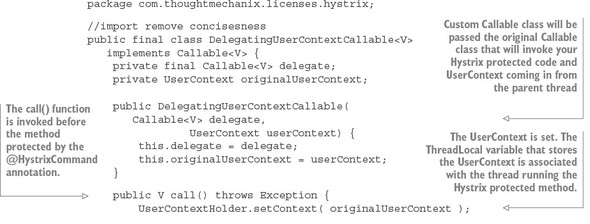
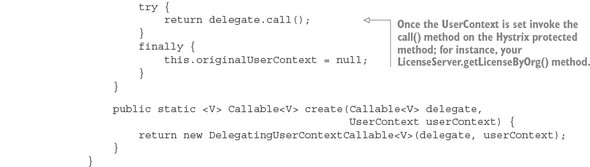
When a call is made to a Hystrix protected method, Hystrix and Spring Cloud will instantiate an instance of the DelegatingUserContextCallable class, passing in the Callable class that would normally be invoked by a thread managed by a Hystrix command pool. In the previous listing, this Callable class is stored in a Java property called delegate. Conceptually, you can think of the delegate property as being the handle to the method protected by a @HystrixCommand annotation.
In addition to the delegated Callable class, Spring Cloud is also passing along the UserContext object off the parent thread that initiated the call. With these two values set at the time the DelegatingUserContextCallable instance is created, the real action will occur in the call() method of your class.
The first thing to do in the call() method is set the UserContext via the UserContextHolder.setContext() method. Remember, the setContext() method stores a UserContext object in a ThreadLocal variable specific to the thread being run. Once the UserContext is set, you then invoke the call() method of the delegated Callable class. This call to delegate.call() invokes the method protected by the @HystrixCommand annotation.
Now that you have your HystrixConcurrencyStrategy via the ThreadLocal-AwareStrategy class and your Callable class defined via the DelegatingUserContextCallable class, you need to hook them in Spring Cloud and Hystrix. To do this, you’re going to define a new configuration class. This configuration, called ThreadLocalConfiguration, is shown in the following listing.
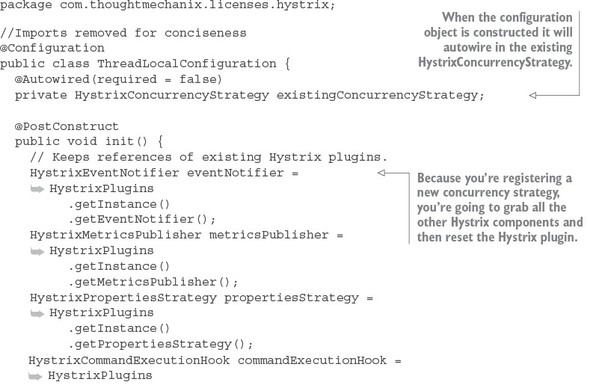
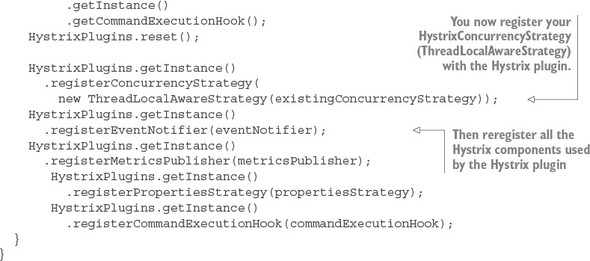
This Spring configuration class basically rebuilds the Hystrix plugin that manages all the different components running within your service. In the init() method, you’re grabbing references to all the Hystrix components used by the plugin. You then register your custom HystrixConcurrencyStrategy (ThreadLocalAwareStrategy).
HystrixPlugins.getInstance().registerConcurrencyStrategy(
  new ThreadLocalAwareStrategy(existingConcurrencyStrategy));
Remember, Hystrix allows only one HystrixConcurrencyStrategy. Spring will attempt to autowire in any existing HystrixConcurrencyStrategy (if it exists). Finally, when you’re all done, you re-register the original Hystrix components that you grabbed at the beginning of the init() method back with the Hystrix plugin.
With these pieces in place, you can now rebuild and restart your licensing service and call it via the GET (http://localhost:8080/v1/organizations/e254f8c-c442-4ebe-a82a-e2fc1d1ff78a/licenses/) shown earlier in figure 5.10. Now, when this call is completed, you should see the following output in your console window:
UserContext Correlation id: TEST-CORRELATION-ID
LicenseServiceController Correlation id: TEST-CORRELATION-ID
LicenseService.getLicenseByOrg Correlation: TEST-CORRELATION-ID
It’s a lot of work to produce one little result, but it’s unfortunately necessary when you use Hystrix with THREAD-level isolation.
In a distributed architecture like a microservices one, there will come a point where you’ll need to ensure that key behaviors such as security, logging, and tracking of users across multiple service calls occur. To implement this functionality, you’ll want these attributes to be consistently enforced across all of your services without the need for each individual development team to build their own solutions. While it’s possible to use a common library or framework to assist with building these capabilities directly in an individual service, doing so has three implications.
First, it’s difficult to consistently implement these capabilities in each service being built. Developers are focused on delivering functionality, and in the whirlwind of day-to-day activity they can easily forget to implement service logging or tracking. (I personally am guilty of this.) Unfortunately, for those of us working in a heavily regulated industry, such as financial services or healthcare, showing consistent and documented behavior in your systems is often a key requirement for complying with government regulations.
Second, properly implementing these capabilities is a challenge. Things like microservice security can be a pain to set up and configure with each service being implemented. Pushing the responsibilities to implement a cross-cutting concern like security down to the individual development teams greatly increases the odds that someone will not implement it properly or will forget to do it.
Third, you’ve now created a hard dependency across all your services. The more capabilities you build into a common framework shared across all your services, the more difficult it is to change or add behavior in your common code without having to recompile and redeploy all your services. This might not seem like a big deal when you have six microservices in your application, but it’s a big deal when you have a larger number of services, perhaps 30 or more. Suddenly an upgrade of core capabilities built into a shared library becomes a months-long migration process.
To solve this problem, you need to abstract these cross-cutting concerns into a service that can sit independently and act as a filter and router for all the microservice calls in your application. This cross-cutting concern is called a services gateway. Your service clients no longer directly call a service. Instead, all calls are routed through the service gateway, which acts as a single Policy Enforcement Point (PEP), and are then routed to a final destination.
In this chapter, we’re going to see how to use Spring Cloud and Netflix’s Zuul to implement a services gateway. Zuul is Netflix’s open source services gateway implementation. Specifically, we’re going to look at how to use Spring Cloud and Zuul to
Let’s dive into more detail on how a services gateway fits into the overall microservices being built in this book.
Until now, with the microservices you’ve built in earlier chapters, you’ve either directly called the individual services through a web client or called them programmatically via a service discovery engine such as Eureka.
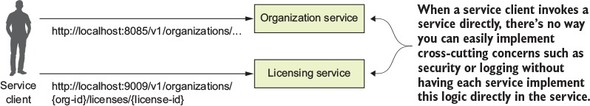
A service gateway acts as an intermediary between the service client and a service being invoked. The service client talks only to a single URL managed by the service gateway. The service gateway pulls apart the path coming in from the service client call and determines what service the service client is trying to invoke. Figure 6.2 illustrates how like a “traffic” cop directing traffic, the service gateway directs the user to a target microservice and corresponding instance. The service gateway sits as the gatekeeper for all inbound traffic to microservice calls within your application. With a service gateway in place, your service clients never directly call the URL of an individual service, but instead place all calls to the service gateway.
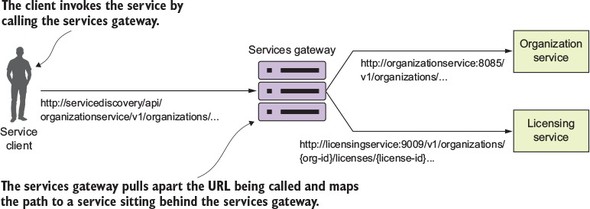
Because a service gateway sits between all calls from the client to the individual services, it also acts as a central Policy Enforcement Point (PEP) for service calls. The use of a centralized PEP means that cross-cutting service concerns can be implemented in a single place without the individual development teams having to implement these concerns. Examples of cross-cutting concerns that can be implemented in a service gateway include
Earlier in chapter 4 when I introduced Eureka, I talked about how centralized load balancers can be single point of failure and a bottleneck for your services. A service gateway, if not implemented correctly, can carry the same risk. Keep the following in mind as you build your service gateway implementation.
Load balancers are still useful when out in front of individual groups of services. In this case, a load balancer sitting in front of multiple service gateway instances is an appropriate design and ensures your service gateway implementation can scale. Having a load balancer sit in front of all your service instances isn’t a good idea because it becomes a bottleneck.
Keep any code you write for your service gateway stateless. Don’t store any information in memory for the service gateway. If you aren’t careful, you can limit the scalability of the gateway and have to ensure that the data gets replicated across all service gateway instances.
Keep the code you write for your service gateway light. The service gateway is the “chokepoint” for your service invocation. Complex code with multiple database calls can be the source of difficult-to-track-down performance problems in the service gateway.
Let’s now look at how to implement a service gateway using Spring Cloud and Netflix Zuul.
Spring Cloud integrates with the Netflix open source project Zuul. Zuul is a services gateway that’s extremely easy to set up and use via Spring Cloud annotations. Zuul offers a number of capabilities, including
To get started with Zuul, you’re going to do three things:
If you’ve been following the chapters sequentially in this book, the work you’re about to do should be familiar. To build a Zuul server, you need to set up a new Spring Boot service and define the corresponding Maven dependencies. You can find the project source code for this chapter in the GitHub repository for this book (https://github.com/carnellj/spmia-chapter6). Fortunately, little is needed to set up Zuul in Maven. You only need to define one dependency in your zuulsvr/pom.xml file:
<dependency>
  <groupId>org.springframework.cloud</groupId>
  <artifactId>spring-cloud-starter-zuul</artifactId>
</dependency>
This dependency tells the Spring Cloud framework that this service will be running Zuul and initialize Zuul appropriately.
After you’ve defined the maven dependencies, you need to annotate the bootstrap class for the Zuul services. The bootstrap class for the Zuul service implementation can be found in the zuulsvr/src/main/java/com/thoughtmechanix/zuulsvr/Application.java class.
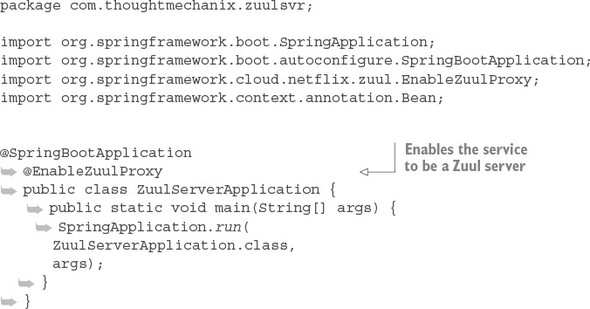
That’s it. There’s only one annotation that needs to be in place: @EnableZuulProxy.
If you look through the documentation or have auto-complete turned on, you might notice an annotation called @EnableZuulServer. Using this annotation will create a Zuul Server that doesn’t load any of the Zuul reverse proxy filters or use Netflix Eureka for service discovery. (We’ll get into the topic of Zuul and Eureka integration shortly.) @EnableZuulServer is used when you want to build your own routing service and not use any Zuul pre-built capabilities. An example of this would be if you wanted to use Zuul to integrate with a service discovery engine other than Eureka (for example, Consul). We’ll only use the @EnableZuulProxy annotation in this book.
The Zuul proxy server is designed by default to work on the Spring products. As such, Zuul will automatically use Eureka to look up services by their service IDs and then use Netflix Ribbon to do client-side load balancing of requests from within Zuul.
I often read chapters out of order in a book, jumping to the specific topics I’m most interested in. If you do the same and don’t know what Netflix Eureka and Ribbon are, I suggest you read chapter 4 before proceeding much further. Zuul uses those technologies heavily to carry out work, so understanding the service discovery capabilities that Eureka and Ribbon bring to the table will make understanding Zuul that much easier.
The last step in the configuration process is to modify your Zuul server’s zuulsvr/src/main/resources/application.yml file to point to your Eureka server. The following listing shows the Zuul configuration needed for Zuul to communicate with Eureka. The configuration in the listing should look familiar because it’s the same configuration we walked through in chapter 4.
eureka:
 instance:
  preferIpAddress: true
 client:
  registerWithEureka: true
  fetchRegistry: true
  serviceUrl:
    defaultZone: http://localhost:8761/eureka/
Zuul at its heart is a reverse proxy. A reverse proxy is an intermediate server that sits between the client trying to reach a resource and the resource itself. The client has no idea it’s even communicating to a server other than a proxy. The reverse proxy takes care of capturing the client’s request and then calls the remote resource on the client’s behalf.
In the case of a microservices architecture, Zuul (your reverse proxy) takes a microservice call from a client and forwards it onto the downstream service. The service client thinks it’s only communicating with Zuul. For Zuul to communicate with the downstream clients, Zuul has to know how to map the incoming call to a downstream route. Zuul has several mechanisms to do this, including
All route mappings for Zuul are done by defining the routes in the zuulsvr/src/main/resources/application.yml file. However, Zuul can automatically route requests based on their service IDs with zero configuration. If you don’t specify any routes, Zuul will automatically use the Eureka service ID of the service being called and map it to a downstream service instance. For instance, if you wanted to call your organizationservice and used automated routing via Zuul, you would have your client call the Zuul service instance, using the following URL as the endpoint:
http://localhost:5555/organizationservice/v1/organizations/e254f8c-c442-4ebe-a82a-e2fc1d1ff78a
Your Zuul server is accessed via http://localhost:5555. The service you’re trying (organizationservice) to invoke is represented by the first part of the endpoint path in the service.
Figure 6.3 illustrates this mapping in action.
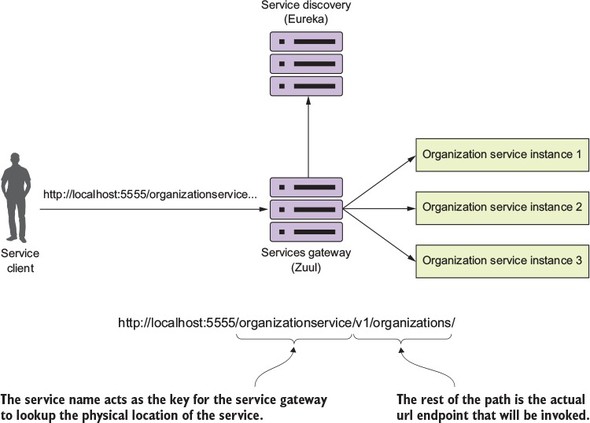
The beauty of using Zuul with Eureka is that not only do you now have a single endpoint that you can make calls through, but with Eureka, you can also add and remove instances of a service without ever having to modify Zuul. For instance, you can add a new service to Eureka, and Zuul will automatically route to it because it’s communicating with Eureka about where the actual physical services endpoints are located.
If you want to see the routes being managed by the Zuul server, you can access the routes via the /routes endpoint on the Zuul server. This will return a listing of all the mappings on your service. Figure 6.4 shows the output from hitting http://localhost:5555/routes.
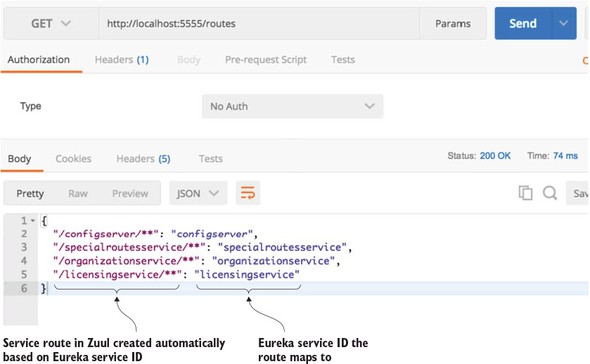
In figure 6.4 the mappings for the services registered with Zuul are shown on the left-hand side of the JSON body returned from the /route calls. The actual Eureka service IDs the routes map to are shown on the right.
Zuul allows you to be more fine-grained by allowing you to explicitly define route mappings rather than relying solely on the automated routes created with the service’s Eureka service ID. Suppose you wanted to simplify the route by shortening the organization name rather than having your organization service accessed in Zuul via the default route of /organizationservice/v1/organizations/{organization-id}. You can do this by manually defining the route mapping in zuulsvr/src/main/resources/application.yml:
zuul:
  routes:
   organizationservice: /organization/**
By adding this configuration, you can now access the organization service by hitting the /organization/v1/organizations/{organization-id} route. If you check the Zuul server’s endpoint again, you should see the results shown in figure 6.5.
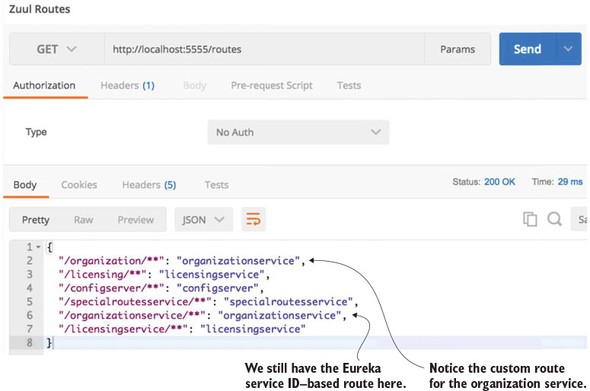
If you look carefully at figure 6.5 you’ll notice that two entries are present for the organization service. The first service entry is the mapping you defined in the application.yml file: "organization/**": "organizationservice". The second service entry is the automatic mapping created by Zuul based on the organization service’s Eureka ID: "/organizationservice/**": "organizationservice".
When you use automated route mapping where Zuul exposes the service based solely on the Eureka service ID, if no instances of the service are running, Zuul will not expose the route for the service. However, if you manually map a route to a service discovery ID and there are no instances registered with Eureka, Zuul will still show the route. If you try to call the route for the non-existent service, Zuul will return a 500 error.
If you want to exclude the automated mapping of the Eureka service ID route and only have available the organization service route that you’ve defined, you can add an additional Zuul parameter to your application.yml file, called ignored-services. The following code snippet shows how the ignored-services attribute can be used to exclude the Eureka service ID organizationservice from the automated mappings done by Zuul:
zuul:
 ignored-services: 'organizationservice'
 routes:
  organizationservice: /organization/**
The ignored-services attribute allows you to define a comma-separated list of Eureka service-IDs that you want to exclude from registration. Now, when your call the /routes endpoint on Zuul, you should only see the organization service mapping you’ve defined. Figure 6.6 shows the outcome of this mapping.
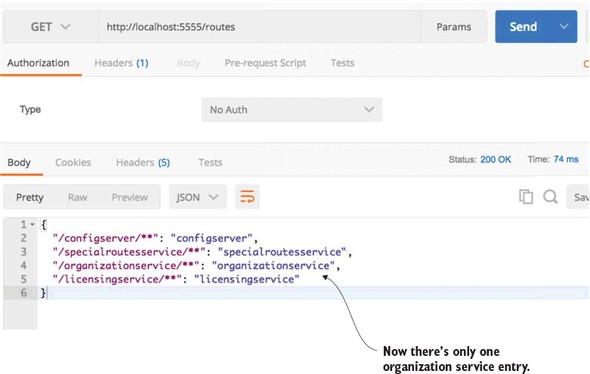
If you want to exclude all Eureka-based routes, you can set the ignored--services attribute to “*”.
A common pattern with a service gateway is to differentiate API routes vs. content routes by prefixing all your service calls with a type of label such as /api. Zuul supports this by using the prefix attribute in the Zuul configuration. Figure 6.7 lays out conceptually what this mapping prefix will look like.
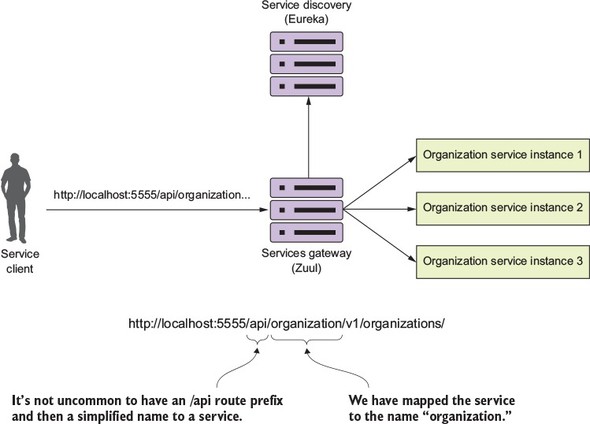
In the following listing, we’ll see how to set up specific routes to your individual organization and Licensing services, exclude all of the eureka-generated services, and prefix your services with a /api prefix.
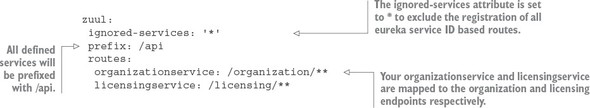
Once this configuration is done and the Zuul service has been reloaded, you should see the following two entries when hitting the /route endpoint: /api/organization and /api/licensing. Figure 6.8 shows these entries.
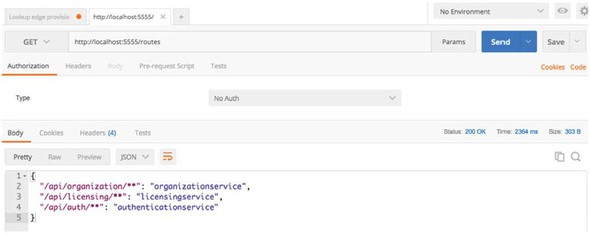
Let’s now look at how you can use Zuul to map to static URLs. Static URLs are URLs that point to services that aren’t registered with a Eureka service discovery engine.
Zuul can be used to route services that aren’t managed by Eureka. In these cases, Zuul can be set up to directly route to a statically defined URL. For example, let’s imagine that your license service is written in Python and you want to still proxy it through Zuul. You’d use the Zuul configuration in the following listing to achieve this.
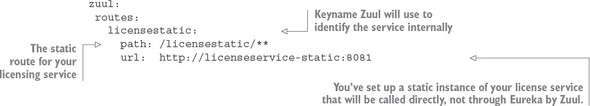
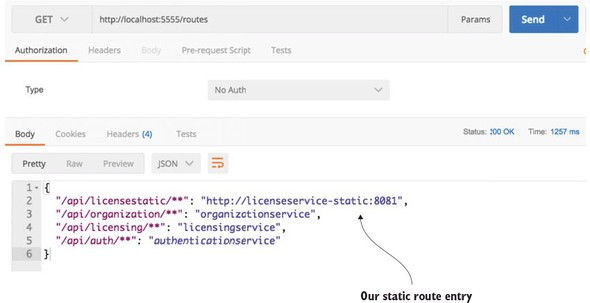
Once this configuration change has been made, you can hit the /routes endpoint and see the static route added to Zuul. Figure 6.10 shows the results from the /routes listing.
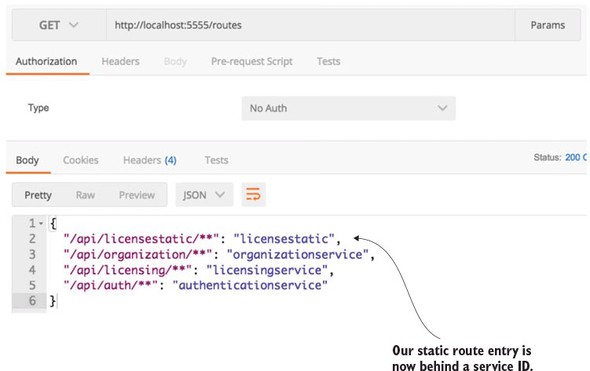
At this point, the licensestatic endpoint won’t use Eureka and will instead directly route the request to the http://licenseservice-static:8081 endpoint. The problem is that by bypassing Eureka, you only have a single route to point requests at. Fortunately, you can manually configure Zuul to disable Ribbon integration with Eureka and then list the individual service instances that ribbon will load balance against. The following listing shows this.
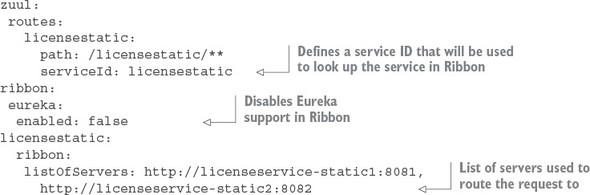
Once this configuration is in place, a call to the /routes endpoint now shows that the /api/licensestatic route has been mapped to a service ID called licensestatic. Figure 6.10 shows this.
The problem with statically mapping routes and disabling Eureka support in Ribbon is that you’ve disabled Ribbon support for all your services running through your Zuul service gateway. This means that more load will be placed on your Eureka servers because Zuul can’t use Ribbon to cache the look-up of services. Remember, Ribbon doesn’t call Eureka every time it makes a call. Instead, it caches the location of the service instances locally and then checks with Eureka periodically for changes. With Ribbon out of the picture, Zuul will call Eureka every time it needs to resolve the location of a service.
Earlier in the chapter, I talked about how you might end up with multiple service gateways where different routing rules and policies would be enforced based on the type of services being called. For non-JVM applications, you could set up a separate Zuul server to handle these routes. However, I’ve found that with non-JVM-based languages, you’re better off setting up a Spring Cloud “Sidecar” instance. The Spring Cloud sidecar allows you to register non-JVM services with a Eureka instance and then proxy them through Zuul. I don’t cover Spring Sidecar in this book because you’re not writing any non-JVM services, but it’s extremely easy to set up a sidecar instance. Directions on how to do so can be found at the Spring Cloud website (http://cloud.spring.io/spring-cloud-netflix/spring-cloud-netflix.html#spring-cloud-ribbon-without-eureka).
The next thing we’re going to look at in terms of configuring routes in Zuul is how to dynamically reload routes. The ability to dynamically reload routes is useful because it allows you to change the mapping of routes without having to recycle the Zuul server(s). Existing routes can be modified quickly and new routes added within have to go through the act of recycling each Zuul server in your environment. In chapter 3, we covered how to use Spring Cloud Configuration service to externalize a microservices configuration data. You can use Spring Cloud configuration to externalize Zuul routes. In the EagleEye examples you can set up a new application folder in your config-repo (http://github.com/carnellj/config-repo) called zuulservice. Like your organization and licensing services, you’ll create three files—zuulservice.yml, zuulservice-dev.yml, and zuulservice-prod.yml—that will hold your route configuration.
To be consistent with the examples in the chapter 3 configuration, I’ve changed the route formats to move from a hierarchical format to the “.” format. The initial route configuration will have a single entry in it:
zuul.prefix=/api
If you hit the /routes endpoint, you should see all your Eureka-based services currently shown in Zuul with the prefix of /api. Now, if you wanted to add new route mappings on the fly, all you have to do is make the changes to the config file and then commit them back to the Git repository where Spring Cloud Config is pulling its configuration data from. For instance, if you wanted to disable all Eureka-based service registration and only expose two routes (one for the organization and one for the licensing service), you could modify the zuulservice-*.yml files to look like this:
zuul.ignored-services: '*'
zuul.prefix: /api
zuul.routes.organizationservice: /organization/**
zuul.routes.organizationservice: /licensing/**
Then you can commit the changes to GitHub. Zuul exposes a POST-based endpoint route /refresh that will cause it to reload its route configuration. Once this /refresh is hit, if you then hit the /routes endpoint, you’ll see that the two new routes are exposed and all the Eureka-based routes are gone.
Zuul uses Netflix’s Hystrix and Ribbon libraries to help prevent long-running service calls from impacting the performance of the services gateway. By default, Zuul will terminate and return an HTTP 500 error for any call that takes longer than one second to process a request. (This is the Hystrix default.) Fortunately, you can configure this behavior by setting the Hystrix timeout properties in your Zuul server’s configuration.
To set the Hystrix timeout for all of the services running through Zuul, you can use the hystrix.command.default.execution.isolation.thread.timeoutInMilliseconds property. For instance, if you wanted to set the default Hystrix time out to be 2.5 seconds, you could use the following configuration in your Zuul’s Spring Cloud config file:
zuul.prefix:  /api
zuul.routes.organizationservice: /organization/**
zuul.routes.licensingservice: /licensing/**
zuul.debug.request: true
hystrix.command.default.execution.isolation.thread.timeoutInMilliseconds: 2500
If you need to set the Hystrix timeout for specific service, you can replace the default part of the property with the Eureka service ID name of the service whose timeout you want to override. For instance, if you wanted to change only the licensingservice’s timeout to three seconds and leave the rest of the services to use the default Hystrix timeout, you could use something like this in your configuration:
hystrix.command.licensingservice.execution.isolation.thread.timeoutInMilliseconds: 3000
Finally, you need to be aware of one other timeout property. While you’ve overridden the Hystrix timeout, the Netflix Ribbon also times out any calls that take longer than five seconds. While I highly recommend you revisit the design of any call that takes longer than five seconds, you can override the Ribbon timeout by setting the following property: servicename.ribbon.ReadTimeout. For example, if you wanted to override the licensingservice to have a seven-second timeout, you’d use the following configuration:
hystrix.command.licensingservice.execution.
For configurations longer than five seconds you have to set both the Hystrix and the Ribbon timeouts.
While being able to proxy all requests through the Zuul gateway does allow you to simplify your service invocations, the real power of Zuul comes into play when you want to write custom logic that will be applied against all the service calls flowing through the gateway. Most often this custom logic is used to enforce a consistent set of application policies like security, logging, and tracking against all the services.
These application policies are considered cross-cutting concerns because you want them to be applied to all the services in your application without having to modify each service to implement them. In this fashion, Zuul filters can be used in a similar way as a J2EE servlet filter or a Spring Aspect that can intercept a wide body of behaviors and decorate or change the behavior of the call without the original coder being aware of the change. While a servlet filter or Spring Aspect is localized to a specific service, using Zuul and Zuul filters allows you implement cross-cutting concerns across all the services being routed through Zuul.
Zuul allows you to build custom logic using a filter within the Zuul gateway. A filter allows you to implement a chain of business logic that each service request passes through as it’s being implemented.
Zuul supports three types of filters:
Figure 6.11 shows how the pre-, post, and route filters fit together in terms of processing a service client’s request.
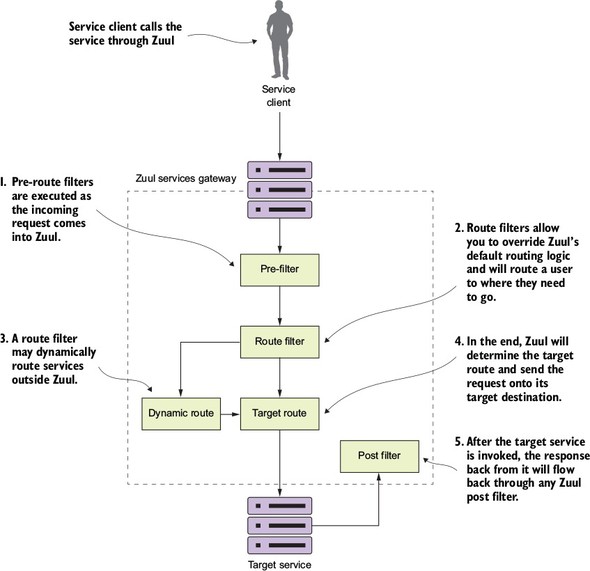
If you follow the flow laid out in figure 6.11, you’ll see everything start with a service client making a call to a service exposed through the service gateway. From there the following activities take place:
The best way to understand how to implement Zuul filters is to see them in use. To this end, in the next several sections you’ll build a pre-, route, and post filter and then run service client requests through them.
Figure 6.12 shows how these filters will fit together in processing requests to your EagleEye services.
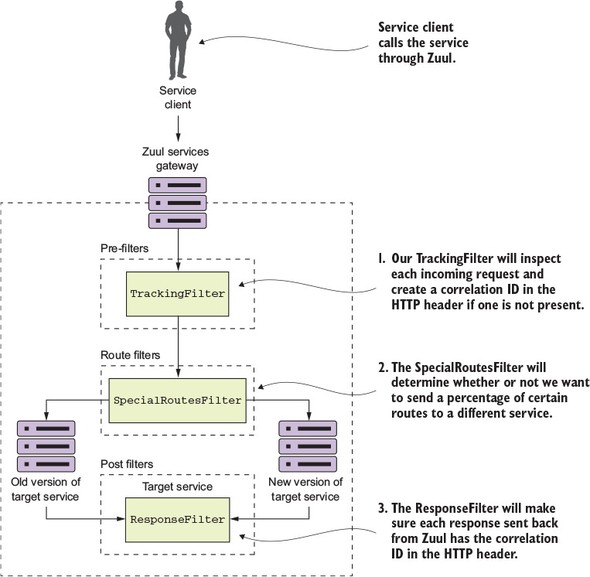
Following the flow of figure 6.12, you’ll see the following filters being used:
Building filters in Zuul is an extremely simple activity. To begin, you’ll build a Zuul pre-filter, called the TrackingFilter, that will inspect all incoming requests to the gateway and determine whether there’s an HTTP header called tmx-correlation-id present in the request. The tmx-correlation-id header will contain a unique GUID (Globally Universal Id) that can be used to track a user’s request across multiple microservices.
We discussed the concept of a correlation ID in chapter 5. Here we’re going to walk through in more detail how to use Zuul to generate a correlation ID. If you skipped around in the book, I highly recommend you look at chapter 5 and read the section on Hystrix and Thread context. Your implementation of correlation IDs will be implemented using ThreadLocal variables and there’s extra work to do to have ThreadLocal variables work with Hystrix.
If the tmx-correlation-id isn’t present on the HTTP header, your Zuul TrackingFilter will generate and set the correlation ID. If there’s already a correlation ID present, Zuul won’t do anything with the correlation ID. The presence of a correlation ID means that this particular service call is part of a chain of service calls carrying out the user’s request. In this case, your TrackingFilter class will do nothing.
Let’s go ahead and look at the implementation of the TrackingFilter in the following listing. This code can also be found in the book samples in zuulsvr/src/main/java/com/thoughtmechanix/zuulsvr/filters/TrackingFilter.java.
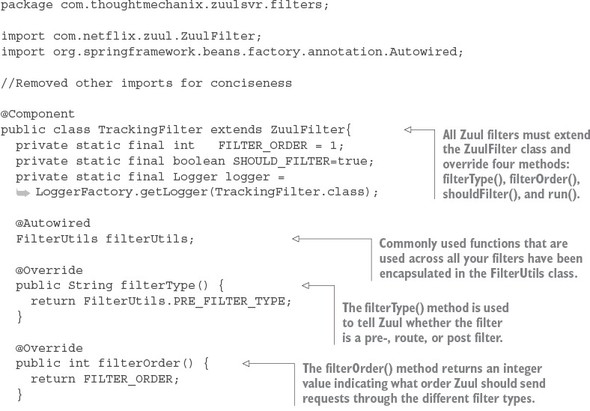
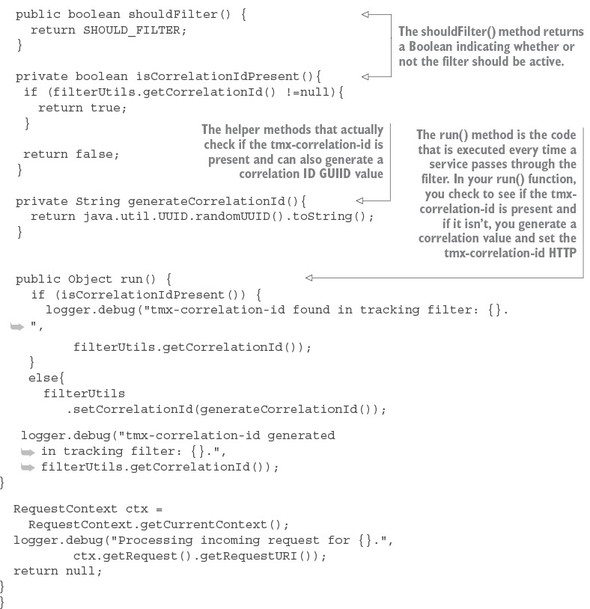
To implement a filter in Zuul, you have to extend the ZuulFilter class and then override four methods: filterType(), filterOrder(), shouldFilter(), and run(). The first three methods in this list describe to Zuul what type of filter you’re building, what order it should be run in compared to the other filters of its type, and whether it should be active. The last method, run(), contains the business logic the filter is going to implement.
You’ve implemented a class called FilterUtils. This class is used to encapsulate common functionality used by all your filters. The FilterUtils class is located in the zuulsvr/src/main/java/com/thoughtmechanix/zuulsvr/FilterUtils.java. We’re not going to walk through the entire FilterUtils class, but the key methods we’ll discuss here are the getCorrelationId() and setCorrelationId() functions. The following listing shows the code for the FilterUtils getCorrelationId() method.
public String getCorrelationId(){
  RequestContext ctx = RequestContext.getCurrentContext();

  if (ctx.getRequest()
        .getHeader(CORRELATION_ID) !=null) {
 return ctx.getRequest()
           .getHeader(CORRELATION_ID);
  }
  else{
 return ctx.getZuulRequestHeaders()
           .get(CORRELATION_ID);
  }
}
The key thing to notice in listing 6.7 is that you first check to see if the tmx-correlation-ID is already set on the HTTP Headers for the incoming request. You do this using the ctx.getRequest().getHeader(CORRELATION_ID) call.
In a normal Spring MVC or Spring Boot service, the RequestContext would be of type org.springframework.web.servletsupport.Request- Context. However, Zuul gives a specialized RequestContext that has several additional methods for accessing Zuul-specific values. This request context is part of the com.netflix.zuul.context package.
If it isn’t there, you then check the ZuulRequestHeaders. Zuul doesn’t allow you to directly add or modify the HTTP request headers on an incoming request. If we add the tmx-correlation-id and then try to access it again later in the filter, it won’t be available as part of the ctx.getRequestHeader() call. To work around this, you use the FilterUtils getCorrelationId() method. You may remember that earlier in the run() method on your TrackingFilter class, you did exactly this with the following code snippet:
else{
  filterUtils.setCorrelationId(generateCorrelationId());
  logger.debug("tmx-correlation-id generated
   in tracking filter: {}.",
  filterUtils.getCorrelationId());
}
The setting of the tmx-correlation-id occurs with the FilterUtils set-CorrelationId() method:
public void setCorrelationId(String correlationId){
  RequestContext ctx =
    RequestContext.getCurrentContext();
  ctx.addZuulRequestHeader(CORRELATION_ID, correlationId);
}
In the FilterUtils setCorrelationId() method, when you want to add a value to the HTTP request headers, you use the RequestContext’s addZuulRequestHeader() method. This method will maintain a separate map of HTTP headers that were added while a request was flowing through the filters with your Zuul server. The data contained within the ZuulRequestHeader map will be merged when the target service is invoked by your Zuul server.
Now that you’ve guaranteed that a correlation ID has been added to every microservice call flowing through Zuul, how do you ensure that
To implement this, you’re going to build a set of three classes into each of your microservices. These classes will work together to read the correlation ID (along with other information you’ll add later) off the incoming HTTP request, map it to a class that’s easily accessible and useable by the business logic in the application, and then ensure that the correlation ID is propagated to any downstream service calls.
Figure 6.13 demonstrates how these different pieces are going to be built out using your licensing service.
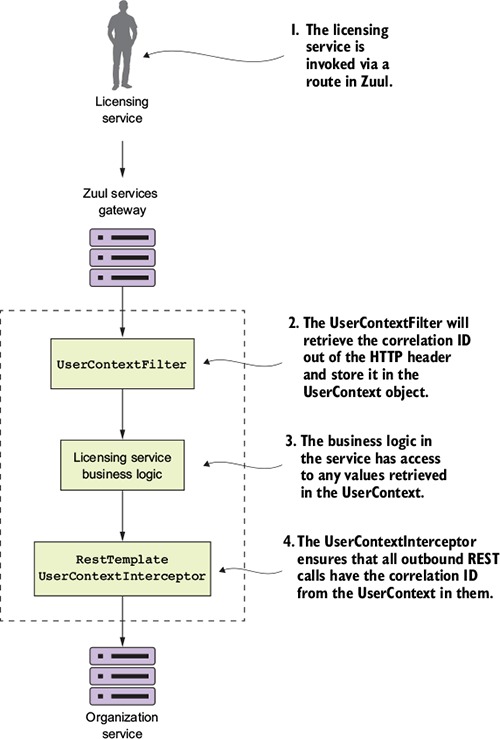
Let’s walk through what’s happening in figure 6.13:
The subject of whether you should use common libraries across your microservices is a gray area in microservice design. Microservice purists will tell you that you shouldn’t use a custom framework across your services because it introduces artificial dependencies in your services. Changes in business logic or a bug can introduce wide scale refactoring of all your services. On the other side, other microservice practitioners will say that a purist approach is impractical because certain situations exist (like the previous UserContextFilter example) where it makes sense to build a common library and share it across services.
I think there’s a middle ground here. Common libraries are fine when dealing with infrastructure-style tasks. If you start sharing business-oriented classes, you’re asking for trouble because you’re breaking down the boundaries between the services.
I seem to be breaking my own advice with the code examples in this chapter, because if you look at all the services in the chapter, they all have their own copies of the UserContextFilter, UserContext, and UserContextInterceptor classes. The reason I took a share-nothing approach here is that I don’t want to complicate the code examples in this book by having to create a shared library that would have to be published to a third-party Maven repository. Hence, all the classes in the utils package of the service are shared across all the services.
The first class you’re going to build is the UserContextFilter class. This class is an HTTP servlet filter that will intercept all incoming HTTP requests coming into the service and map the correlation ID (and a few other values) from the HTTP request to the UserContext class. The following listing shows the code for the UserContext class. The source for this class can be found in licensing-service/src/main/java/com/thoughtmechanix/licenses/utils/UserContextFilter.java.
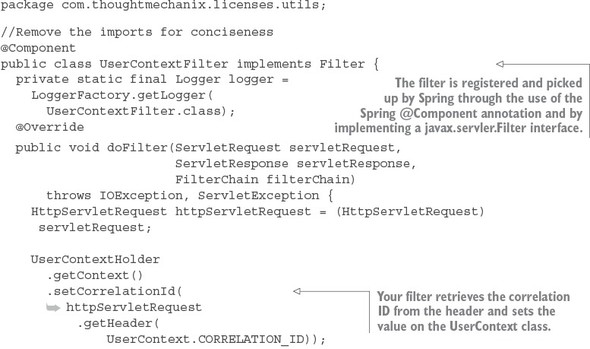
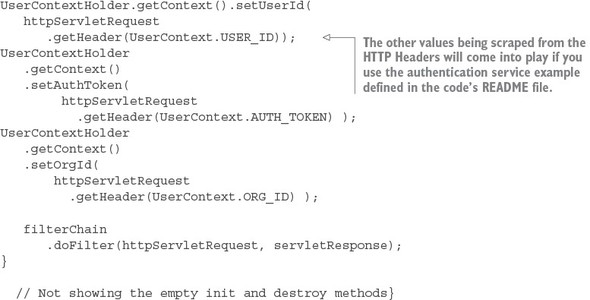
Ultimately, the UserContextFilter is used to map the HTTP header values you’re interested in into a Java class, UserContext.
The UserContext class is used to hold the HTTP header values for an individual service client request being processed by your microservice. It consists of a getter/setter method that retrieves and stores values from java.lang.ThreadLocal. The following listing shows the code from the UserContext class. The source for this class can be found in licensing-service/src/main/java/com/thoughtmechanix/-licenses/utils/UserContext.java.
@Component
public class UserContext {
    public static final String CORRELATION_ID = "tmx-correlation-id";
    public static final String AUTH_TOKEN     = "tmx-auth-token";
    public static final String USER_ID        = "tmx-user-id";
    public static final String ORG_ID         = "tmx-org-id";
    private String correlationId= new String();
    private String authToken= new String();
    private String userId = new String();
    private String orgId = new String();

    public String getCorrelationId() { return correlationId;}
    public void setCorrelationId(String correlationId) {
      this.correlationId = correlationId;}

    public String getAuthToken() { return authToken;}
    public void setAuthToken(String authToken) {
      this.authToken = authToken;}

    public String getUserId() { return userId;}
    public void setUserId(String userId) { this.userId = userId;}

    public String getOrgId() { return orgId;}
    public void setOrgId(String orgId) {this.orgId = orgId;
  }
}
Now the UserContext class is nothing more than a POJO holding the values scraped from the incoming HTTP request. You use a class called zuulsvr/src/main/java/com/thoughtmechanix/zuulsvr/filters/UserContextHolder.java to store the UserContext in a ThreadLocal variable that is accessible in any method being invoked by the thread processing the user’s request. The code for UserContextHolder is shown in the following listing.
public class UserContextHolder {
  private static final ThreadLocal<UserContext> userContext
      = new ThreadLocal<UserContext>();

  public static final UserContext getContext(){
        UserContext context = userContext.get();

        if (context == null) {
            context = createEmptyContext();
            userContext.set(context);
        }

        return userContext.get();
  }

  public static final void setContext(UserContext context) {
    Assert.notNull(context,
     "Only non-null UserContext instances are permitted");
        userContext.set(context);
    }

    public static final UserContext createEmptyContext(){
        return new UserContext();
    }
}
The last piece of code that we’re going to look at is the UserContextInterceptor class. This class is used to inject the correlation ID into any outgoing HTTP-based service requests being executed from a RestTemplate instance. This is done to ensure that you can establish a linkage between service calls.
To do this you’re going to use a Spring Interceptor that’s being injected into the RestTemplate class. Let’s look at the UserContextInterceptor in the following listing.
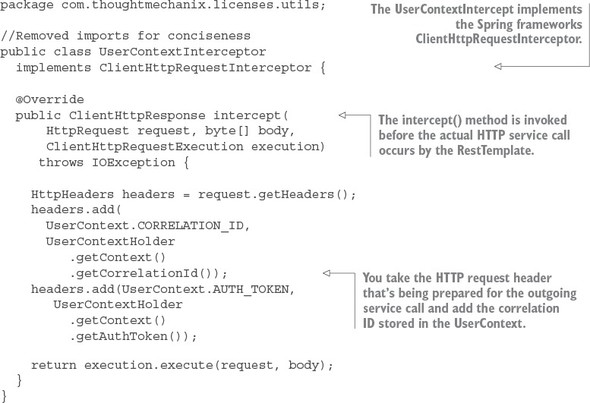
To use the UserContextInterceptor you need to define a RestTemplate bean and then add the UserContextInterceptor to it. To do this, you’re going to add your own RestTemplate bean definition to the licensing-service/src/main/java/com/thoughtmechanix/licenses/Application.java class. The following listing shows the method that’s added to this class.
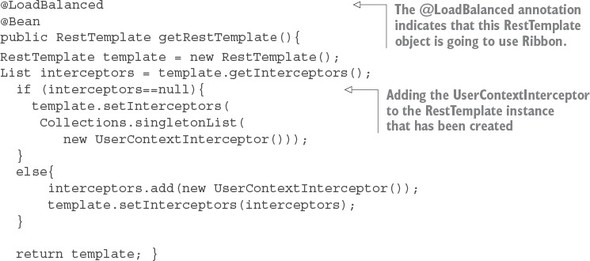
With this bean definition in place, any time you use the @Autowired annotation and inject a RestTemplate into a class, you’ll use the RestTemplate created in listing 6.11 with the UserContextInterceptor attached to it.
Now that you have correlation ID’s being passed to each service, it’s possible to trace a transaction as it flows through all the services involved in the call. To do this you need to ensure that each service logs to a central log aggregation point that captures log entries from all of your services into a single point. Each log entry captured in the log aggregation service will have a correlation ID associated to each entry. Implementing a log aggregation solution is outside the scope of this chapter, but in chapter 9, we’ll see how to use Spring Cloud Sleuth. Spring Cloud Sleuth won’t use the TrackingFilter that you built here, but it will use the same concepts of tracking the correlation ID and ensuring that it’s injected in every call.
Remember, Zuul executes the actual HTTP call on behalf of the service client. Zuul has the opportunity to inspect the response back from the target service call and then alter the response or decorate it with additional information. When coupled with capturing data with the pre-filter, a Zuul post filter is an ideal location to collect metrics and complete any logging associated with the user’s transaction. You’ll want to take advantage of this by injecting the correlation ID that you’ve been passing around to your microservices back to the user.
You’re going to do this by using a Zuul post filter to inject the correlation ID back into the HTTP response headers being passed back to the caller of the service. This way, you can pass the correlation ID back to the caller without ever having to touch the message body. The following listing shows the code for building a post filter. This code can be found in zuulsvr/src/main/java/com/thoughtmechanix/zuulsvr/filters/ResponseFilter.java.
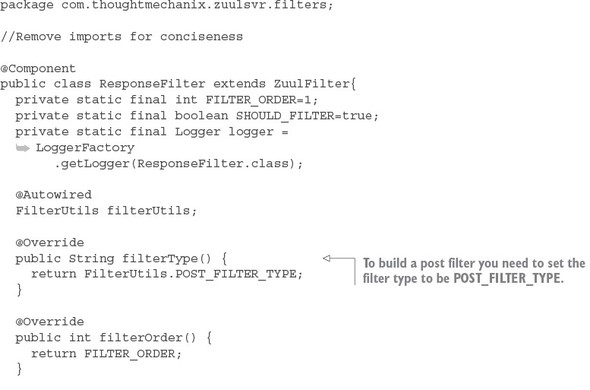
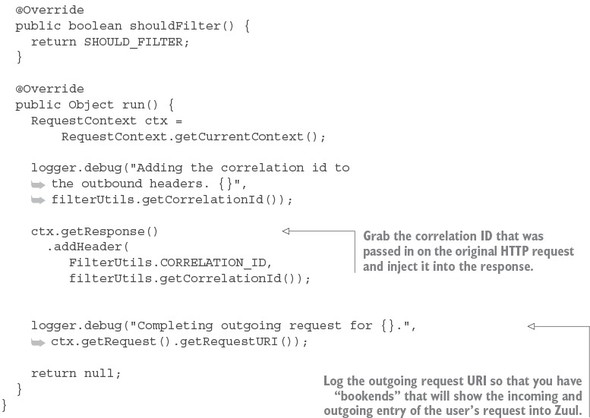
Once the ResponseFilter has been implemented, you can fire up your Zuul service and call the EagleEye licensing service through it. Once the service has completed, you’ll see a tmx-correlation-id on the HTTP response header from the call. Figure 6.14 shows the tmx-correlation-id being sent back from the call.
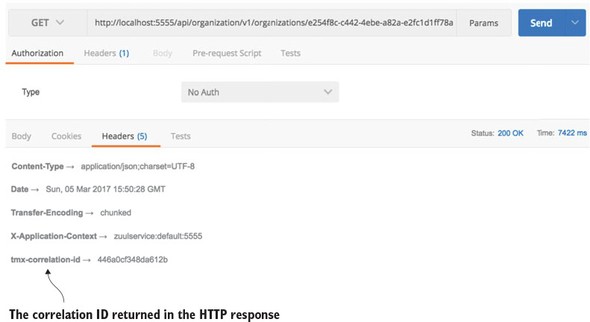
Up until this point, all our filter examples have dealt with manipulating the service client calls before and after it has been routed to its target destination. For our last filter example, let’s look at how you can dynamically change the target route you want to send the user to.
The last Zuul filter we’ll look at is the Zuul route filter. Without a custom route filter in place, Zuul will do all its routing based on the mapping definitions you saw earlier in the chapter. However, by building a Zuul route filter, you can add intelligence to how a service client’s invocation will be routed.
In this section, you’ll learn about Zuul’s route filter by building a route filter that will allow you to do A/B testing of a new version of a service. A/B testing is where you roll out a new feature and then have a percentage of the total user population use that feature. The rest of the user population still uses the old service. In this example, you’re going to simulate rolling out a new version of the organization service where you want 50% of the users go to the old service and 50% of the users to go to the new service.
To do this you’re going to build a Zuul route filter, called SpecialRoutes-Filter, that will take the Eureka service ID of the service being called by Zuul and call out to another microservice called SpecialRoutes. The SpecialRoutes service will check an internal database to see if the service name exists. If the targeted service name exists, it will return a weight and target destination of an alternative location for the service. The SpecialRoutesFilter will then take the weight returned and, based on the weight, randomly generate a number that will be used to determine whether the user’s call will be routed to the alternative organization service or to the organization service defined in the Zuul route mappings. Figure 6.15 shows the flow of what happens when the SpecialRoutesFilter is used.
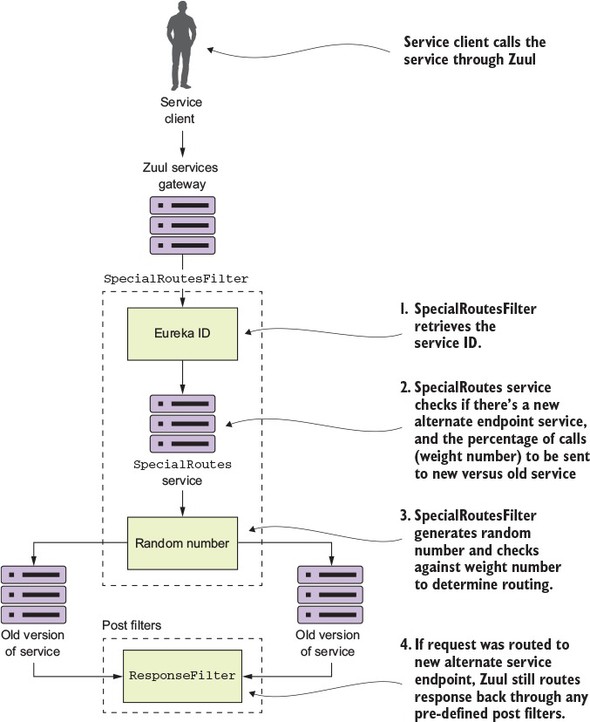
In figure 6.15, after the service client has called a service “fronted” by Zuul, the SpecialRoutesFilter takes the following actions:
We’re going to start walking through the code you used to build the SpecialRoutesFilter. Of all the filters we’ve looked at so far, implementing a Zuul route filter requires the most coding effort, because with a route filter you’re taking over a core piece of Zuul functionality, routing, and replacing it with your own functionality. We’re not going to go through the entire class in detail here, but rather work through the pertinent details.
The SpecialRoutesFilter follows the same basic pattern as the other Zuul filters. It extends the ZuulFilter class and sets the filterType() method to return the value of “route”. I’m not going to go into any more explanation of the filter-Order() and shouldFilter() methods as they’re no different from the previous filters discussed earlier in the chapter. The following listing shows the route filter skeleton.
package com.thoughtmechanix.zuulsvr.filters;

@Component
public class SpecialRoutesFilter extends ZuulFilter {
  @Override
  public String filterType() {
    return filterUtils.ROUTE_FILTER_TYPE;
  }

  @Override
  public int filterOrder() {}
  @Override
  public boolean shouldFilter() {}
  @Override
  public Object run() {}
}
The real work for the SpecialRoutesFilter begins in the run() method of the code. The following listing shows the code for this method.
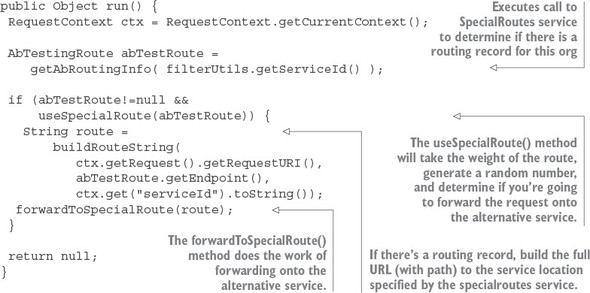
The general flow of code in listing 6.15 is that when a route request hits the run() method in the SpecialRoutesFilter, it will execute a REST call to the SpecialRoutes service. This service will execute a lookup and determine if a routing record exists for the Eureka service ID of the target service being called. The call out to SpecialRoutes service is done in the getAbRoutingInfo() method. The get-AbRoutingInfo() method is shown in the following listing.
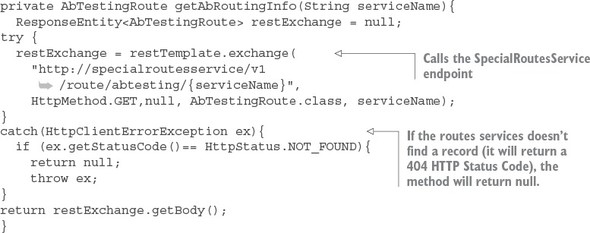
Once you’ve determined that there’s a routing record present for the target service, you need to determine whether you should route the target service request to the alternative service location or to the default service location statically managed by the Zuul route maps. To make this determination, you call the useSpecialRoute() method. The following listing shows this method.
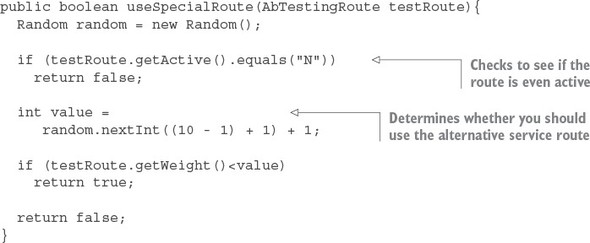
This method does two things. First, the method checks the active field on the AbTestingRoute record returned from the SpecialRoutes service. If the record is set to "N," useSpecialRoute() method shouldn’t do anything because you don’t want to do any routing at this moment. Second, the method generates a random number between 1 and 10. The method will then check to see if the weight of the return route is less than the randomly generated number. If the condition is true, the useSpecialRoute method returns true indicating you do want to use the route.
Once you’ve determined that you do want to route the service request coming into the SpecialRoutesFilter, you’re going to forward the request onto the target service.
The actual forwarding of the route to the downstream service is where the majority of the work occurs in the SpecialRoutesFilter. While Zuul does provide helper functions to make this task easier, the majority of the work still lies with the developer. The forwardToSpecialRoute() method does the forwarding work for you. The code in this method borrows heavily from the source code for the Spring Cloud SimpleHost-RoutingFilter class. While we’re not going to go through all of the helper functions called in the forwardToSpecialRoute() method, we’ll walk through the code in this method, as shown in the following listing.
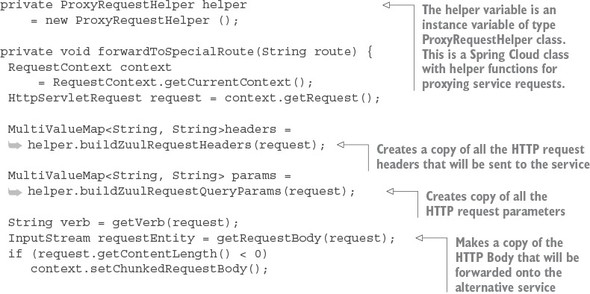
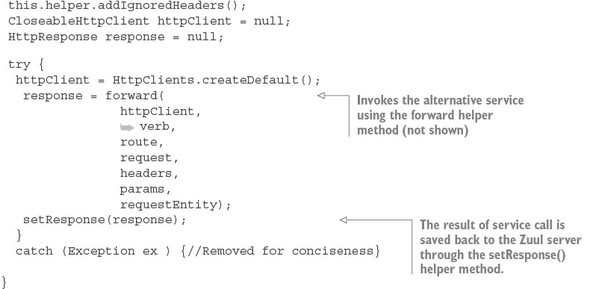
The key takeaway from the code in listing 6.18 is that you’re copying all of the values from the incoming HTTP request (the header parameters, HTTP verb, and the body) into a new request that will be invoked on the target service. The forwardToSpecial-Route() method then takes the response back from the target service and sets it on the HTTP request context used by Zuul. This is done via the setResponse() helper method (not shown). Zuul uses the HTTP request context to return the response back from the calling service client.
Now that you’ve implemented the SpecialRoutesFilter you can see it an action by calling the licensing service. As you may remember from earlier chapters, the licensing service calls the organization service to retrieve the contact data for the organization.
In the code example, the specialroutesservice has a database record for the organization service that will route the requests for calls to the organization service 50% of the time to the existing organization service (the one mapped in Zuul) and 50% of the time to an alternative organization service. The alternative organization service route returned from the SpecialRoutes service will be http://orgservice-new and will not be accessible directly from Zuul. To differentiate between the two services, I’ve modified the organization service(s) to pre-pend the text “OLD::” and “NEW::” to contact names returned by the organization service.
If you now hit the licensing service endpoint through Zuul
http://localhost:5555/api/licensing/v1/organizations/e254f8c-c442-4ebe-a82a-e2fc1d1ff78a/licenses/f3831f8c-c338-4ebe-a82a-e2fc1d1ff78a
you should see the contactName returned from the licensing service call flip between the OLD:: and NEW:: values. Figure 6.16 shows this.
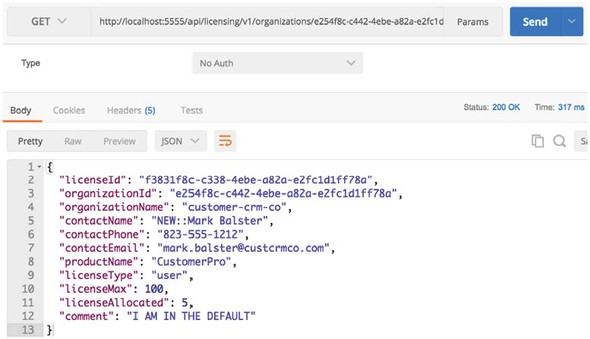
A Zuul routes filter does take more effort to implement then a pre- or post filter, but it’s also one of the most powerful parts of Zuul because you’re able to easily add intelligence to the way your services are routed.
Security. The mention of the word will often cause an involuntary groan from the developer who hears it. You’ll hear them mutter and curse under their breath, “It’s obtuse, hard to understand, and even harder to debug.” Yet you won’t find any developer (except maybe for inexperienced developers) say that that they don’t worry about security.
A secure application involves multiple layers of protection, including
This chapter is only going to deal with the first bullet point in this list: how to authenticate that the user calling your microservice is who they say they are and determine whether they’re authorized to carry out the action they’re requesting from your microservice. The other two topics are extremely broad security topics that are outside the scope of this book.
To implement authorization and authentication controls, you’re going to use Spring Cloud security and the OAuth2 (Open Authentication) standard to secure your Spring-based services. OAuth2 is a token-based security framework that allows a user to authenticate themselves with a third-party authentication service. If the user successfully authenticates, they will be presented a token that must be sent with every request. The token can then be validated back to the authentication service. The main goal behind OAuth2 is that when multiple services are called to fulfill a user’s request, the user can be authenticated by each service without having to present their credentials to each service processing their request. Spring Boot and Spring Cloud each provide an out-of-the-box implementation of an OAuth2 service and make it extremely easy to integrate OAuth2 security into your service.
In this chapter, we’ll show you how to protect your microservices using OAuth2; however, a full-blown OAuth2 implementation also requires a front-web application to enter your user credentials. We won’t be going through how to set up the front-end application because that’s out of scope for a book on microservices. Instead, we’ll use a REST client, like POSTMAN, to simulate the presentation of credentials. For a good tutorial on how to configure your front-end application, I recommend you look at the following Spring tutorial: https://spring.io/blog/2015/02/03/sso-with-oauth2-angular-js-and-spring-security-part-v.
The real power behind OAuth2 is that it allows application developers to easily integrate with third-party cloud providers and do user authentication and authorization with those services without having to constantly pass the user’s credentials to the third-party service. Cloud providers such as Facebook, GitHub, and Salesforce all support OAuth2 as a standard.
Before we get into the technical details of protecting our services with OAuth2, let’s walk through the OAuth2 architecture.
OAuth2 is a token-based security authentication and authorization framework that breaks security down into four components. These four components are
The four components interact together to authenticate the user. The user only has to present their credentials. If they successfully authenticate, they’re issued an authentication token that can be passed from service to service. This is shown in figure 7.1.
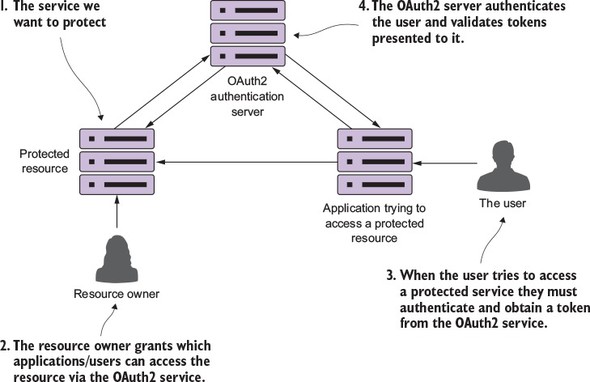
OAuth2 is a token-based security framework. A user authenticates against the OAuth2 server by providing their credentials along with the application that they’re using to access the resource. If the user’s credentials are valid, the OAuth2 server provides a token that can be presented every time a service being used by the user’s application tries to access a protected resource (the microservice).
The protected resource can then contact the OAuth2 server to determine the validity of the token and retrieve what roles a user has assigned to them. Roles are used to group related users together and to define what resources that group of users can access. For the purposes of this chapter, you’re going to use OAuth2 and roles to define what service endpoints and what HTTP verbs a user can call on an endpoint.
Web service security is an extremely complicated subject. You have to understand who’s going to call your services (internal users to your corporate network, external users), how they’re going to call your service (internal web-based client, mobile device, web application outside your corporate network), and what actions they’re going to take with your code. OAuth2 allows you to protect your REST-based services across these different scenarios through different authentication schemes called grants. The OAuth2 specification has four types of grants:
We aren’t going to walk through each of these grant types or provide code examples for each grant type. That’s simply too much material to cover in one chapter. Instead, I’ll do the following:
I do provide overview material on the other OAuth2 grant types in appendix B, “OAuth2 grant types.” If you’re interested in diving into more detail on the OAuth2 spec and how to implement all the grant types, I highly recommend Justin Richer and Antonio Sanso’s book, OAuth2 in Action (Manning, 2017), which is a comprehensive explanation of OAuth2.
To understand how to set up the authentication and authorization pieces of OAuth2, you’re going to implement the OAuth2 password grant type. To implement this grant, you’ll do the following:
Like all the examples in this book’s chapters, your OAuth2 authentication service is going to be another Spring Boot service. The authentication service will authenticate the user credentials and issue a token. Every time the user tries to access a service protected by the authentication service, the authentication service will validate that the OAuth2 token was issued by it and that it hasn’t expired. The authentication service will be the equivalent of the authentication service in figure 7.1.
To get started, you’re going to set up two things:
You can find all code examples for the authentication service in the authentication-service directory. To set up an OAuth2 authentication server, you need the following Spring Cloud dependencies in the authentication-service/pom.xml file:
<dependency>
  <groupId>org.springframework.cloud</groupId>
  <artifactId>spring-cloud-security</artifactId>
</dependency>

<dependency>
  <groupId>org.springframework.security.oauth</groupId>
  <artifactId>spring-security-oauth2</artifactId>
</dependency>
The first dependency, spring-cloud-security, brings in the general Spring and Spring Cloud security libraries. The second dependency, spring-security-oauth2, pulls in the Spring OAuth2 libraries.
Now that the Maven dependencies are defined, you can work on the bootstrap class. This class can be found in the authentication-service/src/main/java/com/thoughtmechanix/authentication/Application.java class. The following listing shows the code for the Application.java class.
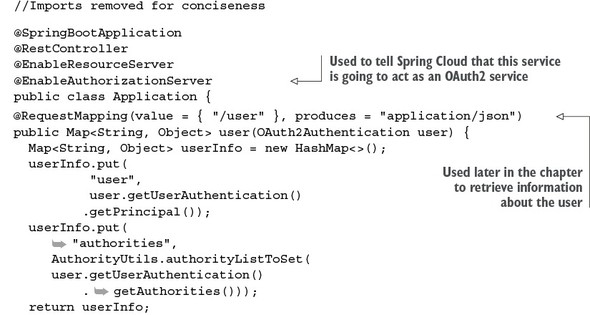
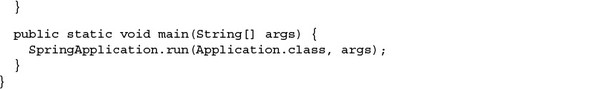
The first thing to note in this listing is the @EnableAuthorizationServer annotation. This annotation tells Spring Cloud that this service will be used as an OAuth2 service and to add several REST-based endpoints that will be used in the OAuth2 authentication and authorization processes.
The second thing you’ll see in listing 7.1 is the addition of an endpoint called /user (which maps to /auth/user). You’ll use this endpoint later in the chapter when you’re trying to access a service protected by OAuth2. This endpoint is called by the protected service to validate the OAuth2 access token and retrieve the assigned roles of the user accessing the protected service. I’ll discuss this endpoint in greater detail later in the chapter.
At this point you have an authentication service, but haven’t defined any applications, users, or roles within the authentication server. You can begin by registering the EagleEye application with your authentication service. To do this you’re going to set up an additional class in your authentication service called authentication-service/src/main/java/com/thoughtmechanix/authentication/security/OAuth2 Config.java.
This class will define what applications are registered with your OAuth2 authentication service. It’s important to note that just because an application is registered with your OAuth2 service, it doesn’t mean that the service will have access to any protected resources.
I’ve often found that developers “mix and match” the meaning of the terms authentication and authorization. Authentication is the act of a user proving who they are by providing credentials. Authorization determines whether a user is allowed to do what they’re trying to do. For instance, the user Jim could prove his identity by providing a user ID and password, but he may not be authorized to look at sensitive data such as payroll data. For the purposes of our discussion, a user must be authenticated before authorization takes place.
The OAuth2Config class defines what applications and the user credentials the OAuth2 service knows about. In the following listing you can see the OAuth2Config.java code.
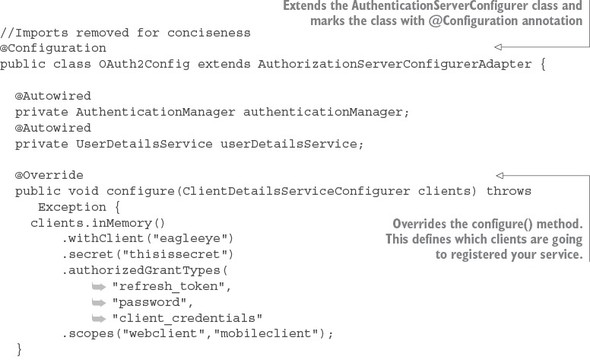
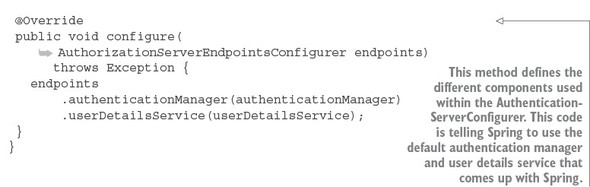
The first thing to notice in the code is that you’re extending Spring’s AuthenticationServerConfigurer class and then marking the class with a @Configuration annotation. The AuthenticationServerConfigurer class is a core piece of Spring Security. It provides the basic mechanisms for carrying out key authentication and authorization functions. For the OAuth2Config class you’re going to override two methods. The first method, configure(), is used to define what client applications are registered with your authentication service. The configure() method takes a single parameter called clients of type ClientDetails-ServiceConfigurer. Let’s start walking through the code in the configure() method in a little more detail. The first thing you do in this method is register which client applications are allowed to access services protected by the OAuth2 service. I’m using “access” here in the broadest terms, because you control what the users of the client applications can do later by checking whether the user that the service is being invoked for is authorized to take the actions they’re trying to take:
clients.inMemory()
    .withClient("eagleeye")
    .secret("thisissecret")
    .authorizedGrantTypes("password",
                            "client_credentials")
    .scopes("webclient","mobileclient");
The ClientDetailsServiceConfigurer class supports two different types of stores for application information: an in-memory store and a JDBC store. For the purposes of this example, you’re going to use the clients.inMemory() store.
The two method calls withClient() and secret() provide the name of the application (eagleeye) that you’re registering along with a secret (a password, thisissecret) that will be presented when the EagleEye application calls your OAuth2 server to receive an OAuth2 access token.
The next method, authorizedGrantTypes(), is passed a comma-separated list of the authorization grant types that will be supported by your OAuth2 service. In your service, you’ll support the password and client credential grants.
The scopes() method is used to define the boundaries that the calling application can operate in when they’re asking your OAuth2 server for an access token. For instance, Thoughtmechanix might offer two different versions of the same application, a web-based application and a mobile phone based application. Each of these apps can use the same client name and secret key to ask for access to resources protected by the OAuth2 server. However, when the apps ask for a key, they need to define the specific scope they are operating in. By defining the scope, you can write authorization rules specific to the scope the client application is working in.
For instance, you might have a user who can access the EagleEye application with both the web-based client and the mobile-phone of the application. Each version of the application does the following:
Thus you’re going to register the EagleEye application with the same application name and secret key, but the web application will only use the “webclient” scope while the mobile phone version of the application will use the “mobileclient” scope. By using scope, you can then define authorization rules in your protected services that can limit what actions a client application can take based on the application they are logging in with. This will be regardless of what permissions the user has. For example, you might want to restrict what data a user can see based on whether they’re using a browser inside the corporate network versus browsing using an application on a mobile device. The practice of restricting data based on the access mechanism of the data is common when dealing with sensitive customer information (such as health records or tax information).
At this point you’ve registered a single application, EagleEye, with your OAuth2 server. However, because you’re using a password grant, you need to set up user accounts and passwords for those users before you start.
You’ve defined and stored application-level key names and secrets. You’re now going to set up individual user credentials and the roles that they belong to. User roles will be used to define the actions a group of users can do with a service.
Spring can store and retrieve user information (the individual user’s credentials and the roles assigned to the user) from an in-memory data store, a JDBC-backed relational database, or an LDAP server.
I want to be careful here in terms of definition. The OAuth2 application information for Spring can store its data in an in-memory or relational database. The Spring user credentials and security roles can be stored in an in-memory database, relational database, or LDAP (Active Directory) server. To keep things simple because our primary purpose is to walk through OAuth2, you’re going to use an in-memory data store.
For the code examples in this chapter, you’re going to define user roles using an in-memory data store. You’re going to define two user accounts: john.carnell and william.woodward. The john.carnell account will have the role of USER and the william.woodward account will have the role of ADMIN.
To configure your OAuth2 server to authenticate user IDs, you have to set up a new class: authentication-service/src/main/com/thoughtmechanix/authentication/security/WebSecurityConfigurer.java. The following listing shows the code for this class.
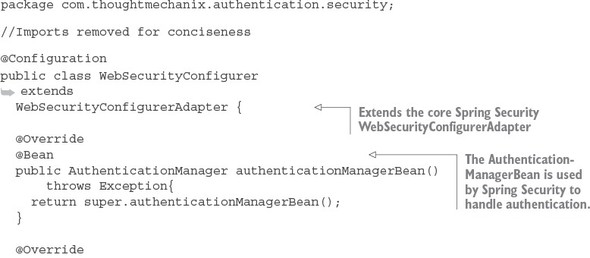
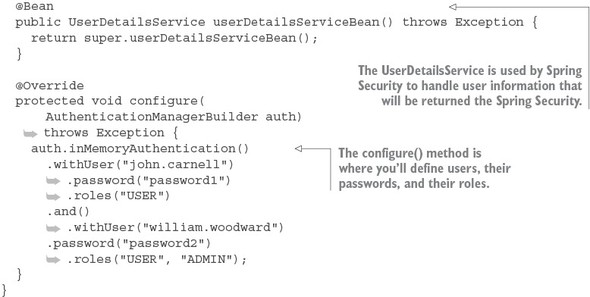
Like other pieces of the Spring Security framework, to set up users (and their roles), start by extending the WebSecurityConfigurerAdapter class and mark it with the @Configuration annotation. Spring Security is implemented in a fashion similar to how you snap Lego blocks together to build a toy car or model. As such, you need to provide the OAuth2 server a mechanism to authenticate users and return the user information about the authenticating user. This is done by defining two beans in your Spring WebSecurityConfigurerAdapter implementation: authentication-ManagerBean() and userDetailsServiceBean(). These two beans are exposed by using the default authentication authenticationManagerBean() and user-DetailsServiceBean() methods from the parent WebSecurityConfigurerAdapter class.
As you’ll remember from listing 7.2, these beans are injected into the configure--(AuthorizationServerEndpointsConfigurer endpoints) method shown in the OAuth2Config class:
public void configure( AuthorizationServerEndpointsConfigurer endpoints)
These two beans are used to configure the /auth/oauth/token and /auth/user endpoints that we’ll see in action shortly.
At this point you have enough of your base OAuth2 server functionality in place to perform application and user authentication for the password grant flow. Now you’ll simulate a user acquiring an OAuth2 token by using POSTMAN to POST to the http://localhost:8901/auth/oauth/token endpoint and provide the application, secret key, user ID, and password.
First, you need to set up POSTMAN with the application name and secret key. You’re going to pass these elements to your OAuth2 server endpoint using basic authentication. Figure 7.2 shows how POSTMAN is set up to execute a basic authentication call.
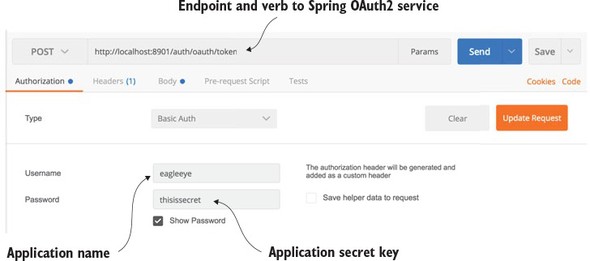
However, you’re not ready to make the call to get the token yet. Once the application name and secret key are configured, you need to pass in the following information in the service as HTTP form parameters:
Unlike other REST calls in this book, the parameters in this list will not be passed in as a JavaScript body. The OAuth2 standard expects all parameters passed to the token generation endpoint to be HTTP form parameters. Figure 7.3 shows how HTTP form parameters are configured for your OAuth2 call.
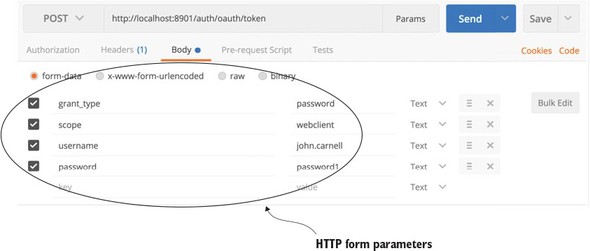
Figure 7.4 shows the JavaScript payload that’s returned from the /auth/oauth/token call.
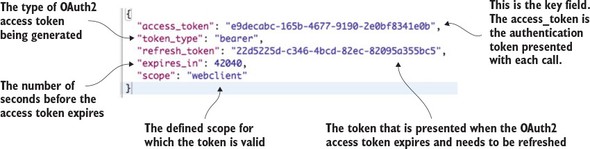
The payload returned contains five attributes:
Now that you have a valid OAuth2 access token, we can use the /auth/user endpoint that you created in your authentication service to retrieve information about the user associated with the token. Later in the chapter, any services that are going to be protected resources will call the authentication service’s /auth/user endpoint to validate the token and retrieve the user information.
Figure 7.5 shows what the results would be if you called the /auth/user endpoint. As you look at figure 7.5, notice how the OAuth2 access token is passed in as an HTTP header.
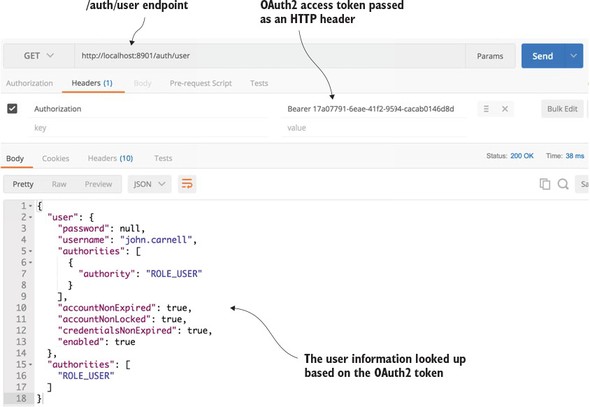
In figure 7.5 you’re issuing a HTTP GET against the /auth/user endpoint. However, any time you call an OAuth2 protected endpoint (including the OAuth2 /auth/user endpoint) you need to pass along the OAuth2 access token. To do this, always create an HTTP header called Authorization and with a value of Bearer XXXXX. In the case of your call in figure 7.5, the HTTP header will be of the value Bearer e9decabc-165b-4677-9190-2e0bf8341e0b. The access token passed in is the access token returned when you called the /auth/oauth/token endpoint in figure 7.4.
If the OAuth2 access token is valid, the /auth/user endpoint will return information about the user, including what roles are assigned to them. For instance, from figure 7.10, you can see that the user john.carnell has the role of USER.
Spring assigns the prefix of ROLE_to user’s roles, so ROLE_USER means that john.carnell has the USER role.
Once you’ve registered an application with your OAuth2 authentication service and set up individual user accounts with roles, you can begin exploring how to protect a resource using OAuth2. While the creation and management of OAuth2 access tokens is the responsibility of the OAuth2 server, in Spring, the definition of what user roles have permissions to do what actions occurs at the individual service level.
To set up a protected resource, you need to take the following actions:
Let’s start with one of the simplest examples of setting up a protected resource by taking your organization service and ensuring that it can only be called by an authenticated user.
As usual with Spring microservices, you have to add a couple of dependencies to the organization service’s Maven organization-service/pom.xml file. Two dependencies are being added: Spring Cloud Security and Spring Security OAuth2. The Spring Cloud Security jars are the core security jars. They contain framework code, annotation definitions, and interfaces for implementing security within Spring Cloud. The Spring Security OAuth2 dependency contains all the classes needed to implement an OAuth2 authentication service. The maven entries for these two dependencies are
<dependency>
  <groupId>org.springframework.cloud</groupId>
  <artifactId>spring-cloud-security</artifactId>
</dependency>
<dependency>
  <groupId>org.springframework.security.oauth</groupId>
  <artifactId>spring-security-oauth2</artifactId>
</dependency>
Remember that once you set up the organization service as a protected resource, every time a call is made to the service, the caller has to include the Authentication HTTP header containing an OAuth2 access token to the service. Your protected resource then has to call back to the OAuth2 service to see if the token is valid.
You define the callback URL in your organization service’s application.yml file as the property security.oauth2.resource.userInfoUri. Here’s the callback configuration used in the organization service’s application.yml file.
security:
 oauth2:
  resource:
    userInfoUri: http://localhost:8901/auth/user
As you can see from the security.oauth2.resource.userInfoUri property, the callback URL is to the /auth/user endpoint. This endpoint was discussed earlier in the chapter in section 7.2.4, “Authenticating the user.”
Finally, you also need to tell the organization service that it’s a protected resource. Again, you do this by adding a Spring Cloud annotation to the organization service’s bootstrap class. The organization service’s bootstrap code is shown in the next listing and can be found in the organization-service/src/main/java/com/thoughtmechanix/organization/Application.java class.
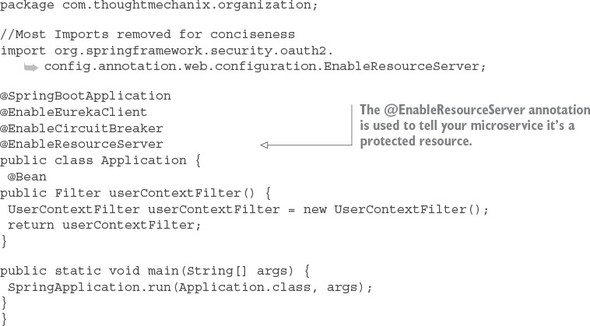
The @EnableResourceServer annotation tells Spring Cloud and Spring Security that the service is a protected resource. The @EnableResourceServer enforces a filter that intercepts all incoming calls to the service, checks to see if there’s an OAuth2 access token present in the incoming call’s HTTP header, and then calls back to the callback URL defined in the security.oauth2.resource.userInfoUri to see if the token is valid. Once it knows the token is valid, the @EnableResourceServer annotation also applies any access control rules over who and what can access a service.
You’re now ready to begin defining the access control rules around the service. To define access control rules, you need to extend a Spring ResourceServerConfigurerAdapter class and override the classes configure() method. In the organization service, your ResourceServerConfiguration class is located in organization service/src/main/java/com/thoughtmechanix/organization/security/ResourceServerConfiguration.java. Access rules can range from extremely coarse-grained (any authenticated user can access the entire service) to fine-grained (only the application with this role, accessing this URL through a DELETE is allowed).
We discuss every permutation of Spring Security’s access control rules, but we can look at several of the more common examples. These examples include protecting a resource so that
The first thing you’re going to do is protect the organization service so that it can only be accessed by an authenticated user. The following listing shows how you can build this rule into the ResourceServerConfiguration.java class.
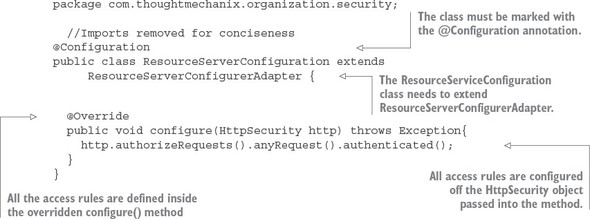
All access rules are going to be defined inside the configure() method. You’ll use the HttpSecurity class passed in by Spring to define your rules. In this example, you’re going to restrict all access to any URL in the organization service to authenticated users only.
If you were to access the organization service without an OAuth2 access token present in the HTTP header, you’d get a 401 HTTP response code along with a message indicating that a full authentication to the service is required.
Figure 7.6 shows the output of a call to the organization service without the OAuth2 HTTP header.
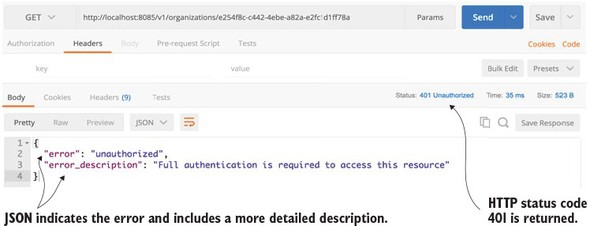
Next, you’ll call the organization service with an OAuth2 access token. To get an access token, see section 7.2.4, “Authenticating the user,” on how to generate the OAuth2 token. You want to cut and paste the value of the access_token field from the returned JavaScript call out to the /auth/oauth/token endpoint and use it in your call to the organization service. Remember, when you call the organization service, you need to add an HTTP header called Authorization with the value Bearer access_token value.
Figure 7.7 shows the callout to the organization service, but this time with an OAuth2 access token passed to it.
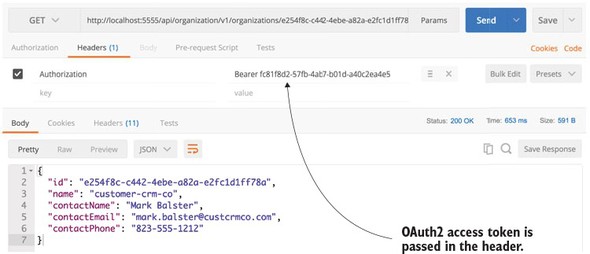
This is probably one of the simplest use cases for protecting an endpoint using OAuth2. Next, you’ll build on this and restrict access to a specific endpoint to a specific role.
In the next example, you’re going to lock down the DELETE call on your organization service to only those users with ADMIN access. As you’ll remember from section 7.2.3, “Configuring some EagleEye Users,” you created two user accounts that could access EagleEye services: john.carnell and william.woodward. The john.carnell account had the role of USER assigned to it. The william.woodward account had the USER role and the ADMIN role.
The following listing shows how to set up the configure() method to restrict access to the DELETE endpoint to only those authenticated users who have the ADMIN role.
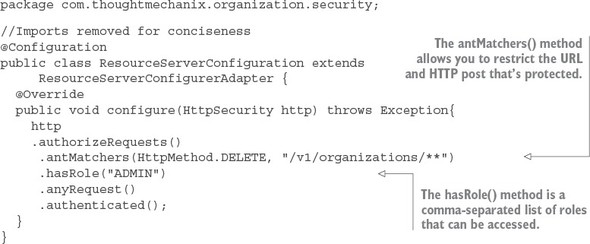
In listing 7.6 you’re restricting the DELETE call on any endpoint starting with /v1/organizations in your service to the ADMIN role.:
.authorizeRequests()
  .antMatchers(HttpMethod.DELETE, "/v1/organizations/**")
  .hasRole("ADMIN")
The antMatcher() method can take a comma-separated list of endpoints. These endpoints can use a wildcard style notation for defining the endpoints you want to access. For instance, if you want to restrict any of the DELETE calls regardless of the version in the URL name, you could use a * in place of the version number in your URL definitions:
.authorizeRequests()
  .antMatchers(HttpMethod.DELETE, "/*/organizations/**")
.hasRole("ADMIN")
The last part of the authorization rule definition still defines that any other endpoint in your service needs to be access by an authenticated user:
.anyRequest()
.authenticated();
Now, if you were to get an OAuth2 token for the user john.carnell (password: password1) and try to call the DELETE endpoint for the organization service (http://-localhost:8085/v1/organizations/e254f8c-c442-4ebe-a82a-e2fc1d1ff78a), you’d get a 401 HTTP status code on the call and an error message indicating that the access was denied. The JavaScript text returned by your call would be
{
 "error": "access_denied",
 "error_description": "Access is denied"
}
If you tried the exact same call using the william.woodward user account (password: password2) and its OAuth2 token, you’d see a successful call would returned (a HTTP Status Code 204 – Not Content), and that organization would be deleted by the organization service.
At this point we’ve looked at two simple examples of calling and protecting a single service (the organization service) with OAuth2. However, often in a microservices environment, you’re going to have multiple service calls used to carry out a single transaction. In these types of situations, you need to ensure that that the OAuth2 access token is propagated from service call to service call.
To demonstrate propagating an OAuth2 token between services, we’re now going to see how to protect your licensing service with OAuth2. Remember, the licensing service calls the organization service to lookup information. The question becomes, how do you propagate the OAuth2 token from one service to another?
You’re going to set up a simple example where you’re going to have the licensing service call the organization service. Building on the examples from chapter 6, both services are running behind a Zuul gateway.
Figure 7.8 shows the basic flow of how an authenticated user’s OAuth2 token is going to flow through the Zuul gateway, to the licensing service, and then down to the organization service.
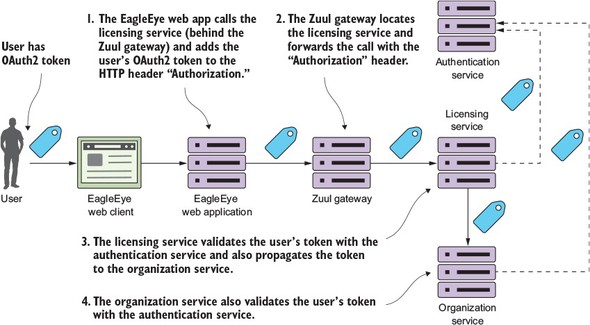
The following activity occurs in figure 7.8:
To implement these flows, you need to do two things. First, you need to modify your Zuul services gateway to propagate the OAuth2 token to the licensing service. By default, Zuul won’t forward sensitive HTTP headers such as Cookie, Set-Cookie, and Authorization to downstream services. To allow Zuul to propagate the “Authorization” HTTP header, you need to set the following configuration in your Zuul services gateway’s application.yml or Spring Cloud Config data store:
zuul.sensitiveHeaders: Cookie,Set-Cookie
This configuration is a blacklist of the sensitive headers that Zuul will keep from being propagated to a downstream service. The absence of the Authorization value in the previous list means Zuul will allow it through. If you don’t set the zuul.sensitiveHeaders property at all, Zuul will automatically block all three values from being propagated (Cookie, Set-Cookie, and Authorization).
Zuul can automatically propagate downstream OAuth2 access tokens and authorize incoming requests against the OAuth2 service by using the @EnableOAuth2Sso annotation. I purposely haven’t used this approach because my goal in this chapter is to show the basics of how OAuth2 works without adding another level of complexity (or debugging). While the configuration of the Zuul service’s gateway isn’t overly complicated, it would have added significantly more content to an already large chapter. If you’re interested in having a Zuul services gateway participate in Single Sign On (SSO), the Spring Cloud Security documentation has a short but comprehensive tutorial that covers the setup of the Spring server (http://cloud.spring.io/spring-cloud-security/spring-cloud-security.html).
The next thing you need to do is configure your licensing service to be an OAuth2 resource service and set up any authorization rules you want for the service. We’re not going to discuss in detail the licensing service configuration because we already discussed authorization rules in section 7.3.3, “Defining who and what can access the service.”
Finally, all you need to do is modify how the code in the licensing service calls the organization service. You need to ensure that the “Authorization” HTTP header is injected into the application call out to the Organization service. Without Spring Security, you’d have to write a servlet filter to grab the HTTP header off the incoming licensing service call and then manually add it to every outbound service call in the licensing service. Spring OAuth2 provides a new Rest Template class that supports OAuth2 calls. The class is called OAuth2RestTemplate. To use the OAuth2Rest-Template class you first need to expose it as a bean that can be auto-wired into a service calling another OAuth2 protected services. You do this in the licensing-service/src/main/java/com/thoughtmechanix/licenses/-Application.java class:
@Bean
 public OAuth2RestTemplate oauth2RestTemplate(
        OAuth2ClientContext oauth2ClientContext,
        OAuth2ProtectedResourceDetails details) {
        return new OAuth2RestTemplate(details, oauth2ClientContext);
    }
To see the OAuth2RestTemplate class in action you can look in the licensing--service/src/main/java/com/thoughtmechanix/licenses/clients/OrganizationRestTemplate.java class. The following listing shows how OAuth2 RestTemplate is auto-wired into this class.
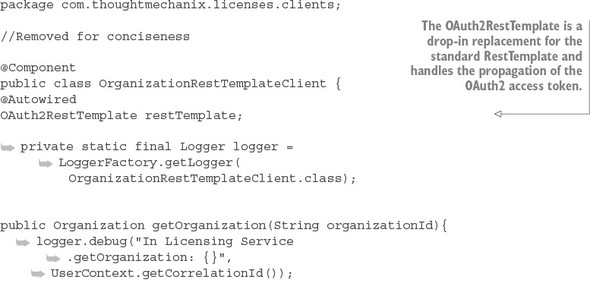
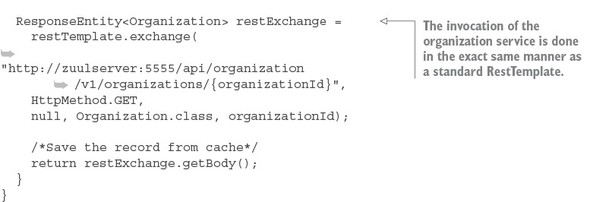
OAuth2 is a token-based authentication framework, but ironically it doesn’t provide any standards for how the tokens in its specification are to be defined. To rectify the lack of standards around OAuth2 tokens, a new standard is emerging called JavaScript Web Tokens (JWT). JWT is an open standard (RFC-7519) proposed by the Internet Engineering Task Force (IETF) that attempts to provide a standard structure for OAuth2 tokens. JWT tokens are
Spring Cloud Security supports JWT out of the box. However, to use and consume JWT tokens, your OAuth2 authentication service and the services being protected by the authentication service must be configured in a different fashion. The configuration isn’t difficult, so let’s walk through the change.
I’ve chosen to keep the JWT configuration on a separate branch (called JWT_Example) in the GitHub repository for this chapter (https://github.com/carnellj/spmia-chapter7) because the standard Spring Cloud Security OAuth2 configuration and JWT-based OAuth2 configuration require different configuration classes.
For both the authentication service and the two microservices (licensing and organization service) that are going to be protected by OAuth2, you’ll need to add a new Spring Security dependency to their Maven pom.xml files to include the JWT OAuth2 libraries. This new dependency is
<dependency>
    <groupId>org.springframework.security</groupId>
    <artifactId>spring-security-jwt</artifactId>
</dependency>
After the Maven dependency is added, you need to first tell your authentication service how it’s going to generate and translate JWT tokens. To do this, you’re going to set up in the authentication service a new configuration class called authentication--service/src/java/com/thoughtmechanix/authentication/security/JWT TokenStoreConfig.java. The following listing shows the code for the class.
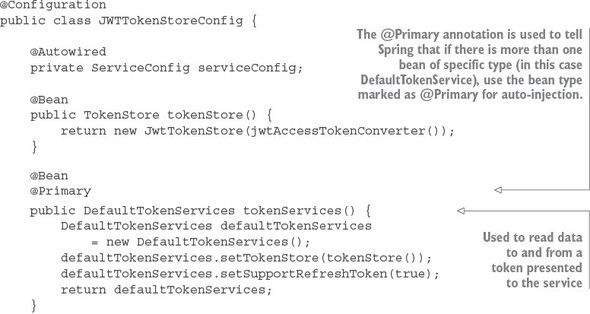
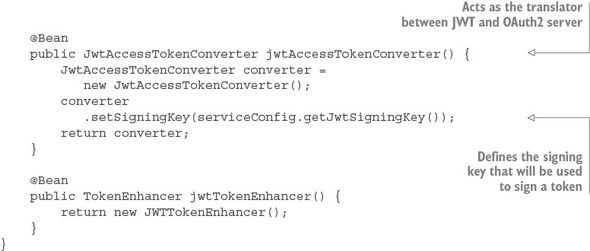
The JWTTokenStoreConfig class is used to define how Spring will manage the creation, signing, and translation of a JWT token. The tokenServices() method is going to use Spring security’s default token services implementation, so the work here is rote. The jwtAccessTokenConverter() method is the one we want to focus on. It defines how the token is going to be translated. The most important thing to note about this method is that you’re setting the signing key that will be used to sign your token.
For this example, you’re going to use a symmetrical key, which means both the authentication service and the services protected by the authentication service must share the same key between all of the services. The key is nothing more than a random string of values that’s store in the authentication services Spring Cloud Config entry (https://github.com/carnellj/config-repo/blob/master/authenticationservice/authenticationservice.yml). The actual value for the signing key is
signing.key: "345345fsdgsf5345"
Spring Cloud Security supports symmetrical key encryption and asymmetrical encryption using public/private keys. We’re not going to walk through setting up JWT using public/private keys. Unfortunately, little official documentation exists on the JWT, Spring Security, and public/private keys. If you’re interested in how to do this, I highly recommend you look at Baeldung.com (http://www.baeldung.com/spring-security-oauth-jwt). They do an excellent job of explaining JWT and public/private key setup.
In the JWTTokenStoreConfig from listing 7.8, you defined how JWT tokens were going to be signed and created. You now need to hook this into your overall OAuth2 service. In listing 7.2 you used the OAuth2Config class to define the configuration of your OAuth2 service. You set up the authentication manager that was going to be used by your service along with the application name and secrets. You’re going to replace the OAuth2Config class with a new class called authentication--service/src/main/java/com/thoughtmechanix/authentication/security/JWTOAuth2Config.java.
The following listing shows code for the JWTOAuth2Config class.
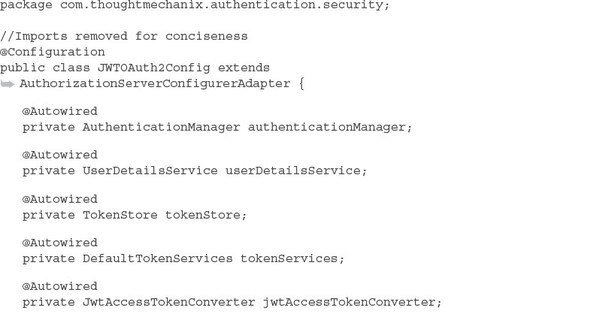
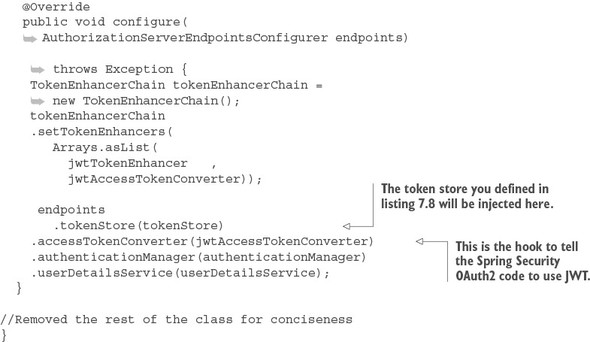
Now, if you rebuild your authentication service and restart it, you should see a JWT-based token returned. Figure 7.9 shows the results of your call to the authentication service now that it uses JWT.
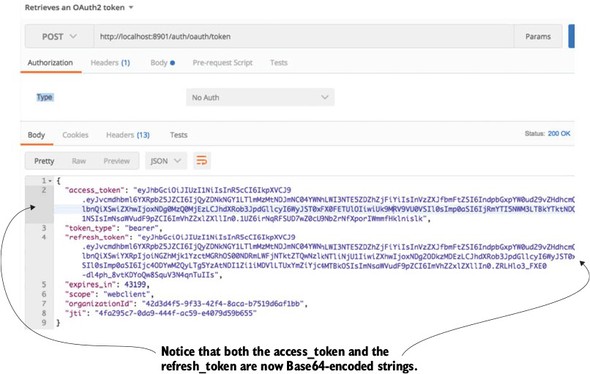
The actual token itself isn’t directly returned as JavaScript. Instead, the JavaScript body is encoded using a Base64 encoding. If you’re interested in seeing the contents of a JWT token, you can use online tools to decode the token. I like to use an online tool from a company called Stormpath. Their tool, http://jsonwebtoken.io, is an online JWT decoder. Figure 7.10 shows the output from the decoded token.
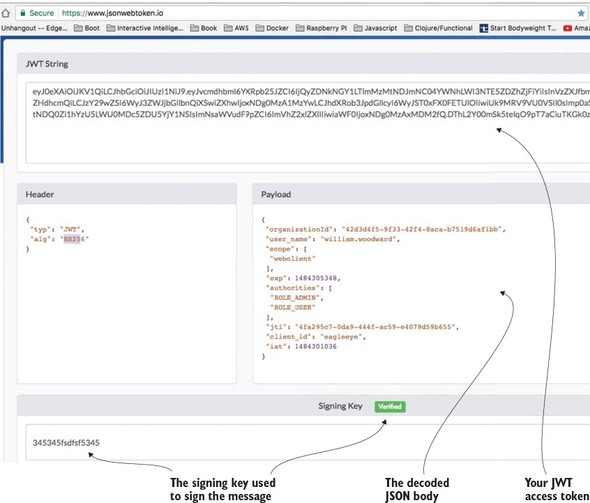
It’s extremely important to understand that your JWT tokens are signed, but not encrypted. Any online JWT tool can decode the JWT token and expose its contents. I bring this up because the JWT specification does allow you extend the token and add additional information to the token. Don’t expose sensitive or Personally Identifiable Information (PII) in your JWT tokens.
You now have your OAuth2 authentication service creating JWT tokens. The next step is to configure your licensing and organization services to use JWT. This is a trivial exercise that requires you to do two things:
You need to do one final piece of work. Because the licensing service calls the organization service, you need to ensure that the OAuth2 token is propagated. This is normally done via the OAuth2RestTemplate class; however, the OAuth2RestTemplate class doesn’t propagate JWT-based tokens. To make sure that your licensing service does this, you need to add a custom RestTemplate bean that will perform this injection for you. This custom RestTemplate can found in the licensing-service/src/main/java/com/thoughtmechanix/licenses/Application.java class. The following listing shows this custom bean definition.
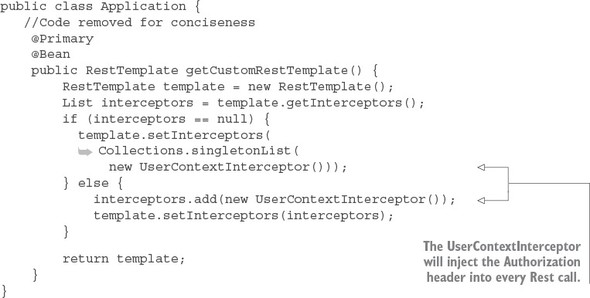
In the previous code you’re defining a custom RestTemplate bean that will use a ClientHttpRequestInterceptor. Recall from chapter 6 that the Client-Http-RequestInterceptor is a Spring class that allows you to hook in functionality to be executed before a REST-based call is made. This interceptor class is a variation of the UserContextInterceptor class you defined in chapter 6. This class is in the licensing-service/src/main/java/com/thoughtmechanix/licenses/utils/UserContextInterceptor.java. The following listing shows this class.
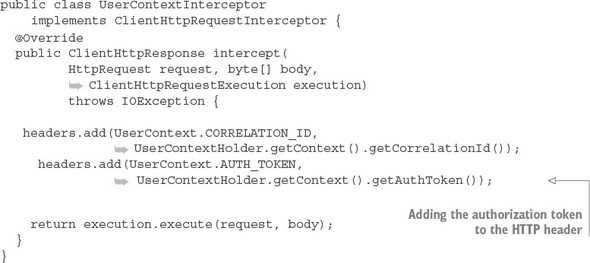
The UserContextInterceptor is using several of the utility classes from chapter 6. Remember, every one of your service uses a custom servlet filter (called User-ContextFilter) to parse out the authentication token and correlation ID from the HTTP header. In listing 7.11, you’re using the UserContext.AUTH_TOKEN value already parsed to populate the outgoing HTTP call.
That’s it. With these pieces in place, you can now call the licensing service (or organization service) and place the Base64-encoded JWT encoded in your HTTP Authorization header the value Bearer <<JWT-Token>>, and your service will properly read and validate the JWT token.
If you look closely at the JWT token in figure 7.10, you’ll notice the EagleEye organizationId field. (Figure 7.11 shows a more zoomed-in shot of the JWT Token shown earlier in figure 7.10.) This isn’t a standard JWT token field. It’s one I added by injecting a new field into the JWT token as it was being created.
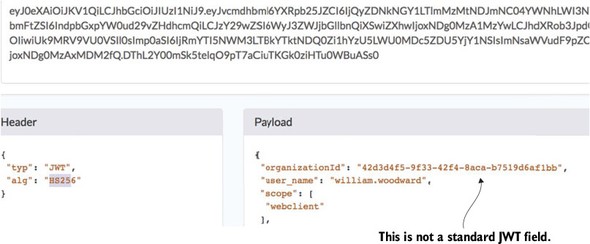
Extending a JWT token is easily done by adding a Spring OAuth2 token enhancer class to your authentication service. The source for this class can found in the authentication-service/src/main/java/com/thoughtmechanix/authentication/security/JWTTokenEnhancer.java class. The following listing shows this code.
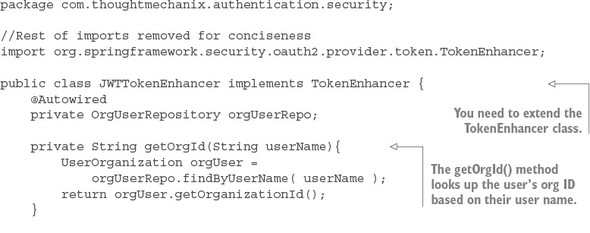
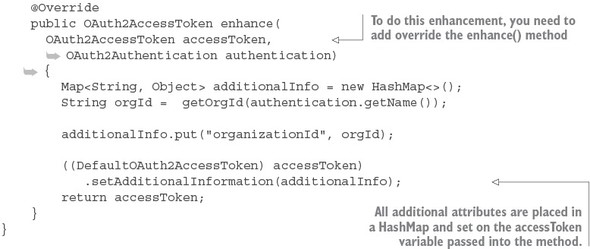
The last thing you need to do is tell your OAuth2 service to use your JWTToken-Enhancer class. You first need to expose a Spring bean for your JWTTokenEnhancer class. Do this by adding a bean definition to the JWTTokenStoreConfig class that was defined in listing 7.8:
package com.thoughtmechanix.authentication.security;

@Configuration
public class JWTTokenStoreConfig {
    //Rest of class removed for conciseness
    @Bean
    public TokenEnhancer jwtTokenEnhancer() {
        return new JWTTokenEnhancer();
    }
}
Once you’ve exposed the JWTTokenEnhancer as a bean, you can hook it into the JWTOAuth2Config class from listing 7.9. This is done in the configure() method of the class. The following listing shows the modification to the configure() method of the JWTOAuth2Config class.
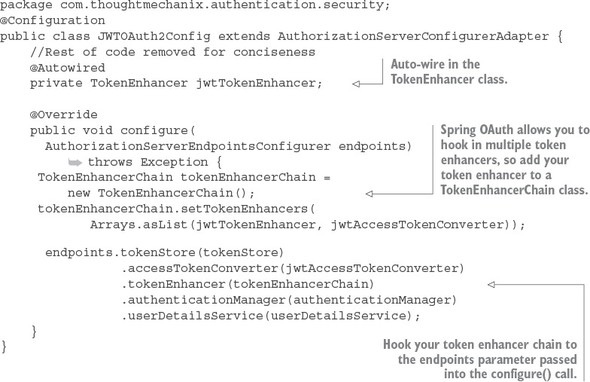
At this point you’ve added a custom field to your JWT token. The next question you should have is, “How do I parse a custom field out of a JWT token?”
We’re going to turn to your Zuul gateway for an example of how to parse out a custom field in the JWT token. Specifically, you’re going to modify the TrackingFilter class we introduced in chapter 6 to decode the organizationId field out of the JWT token flowing through gateway.
To do this you’re going to pull in a JWT parser library and add to the Zuul server’s pom.xml file. Multiple token parsers are available and I chose the JJWT library (https://-github.com/jwtk/jjwt) to do the parsing. The Maven dependency for the library is
<dependency>
  <groupId>io.jsonwebtoken</groupId>
  <artifactId>jjwt</artifactId>
  <version>0.7.0</version>
</dependency>
Once the JJWT library is added, you can add a new method to your zuulsvr/src/main/java/com/thoughtmechanix/zuulsvr/filters/TrackingFilter.java class called get-OrganizationId(). The following listing shows this new method.
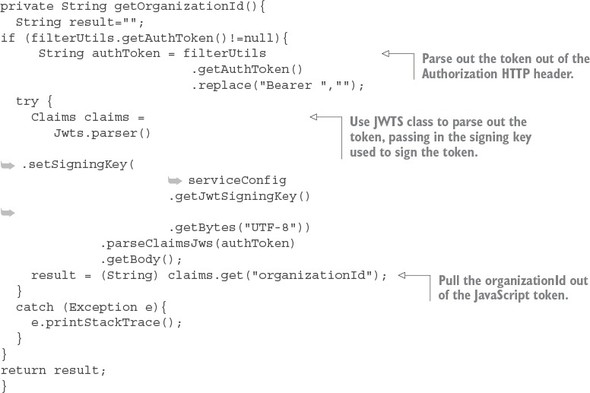
Once the getOrganizationId() function is implemented, you added a System.out.println to the run() method on the TrackingFilter to print out the organizationId parsed from your JWT token that’s flowing through the Zuul gateway, so you call any gateway-enabled REST endpoint. I used GET http://localhost:5555/api/licensing/v1/organizations/e254f8c-c442-4ebe-a82a-e2fc1d1ff78a/licenses/f3831f8c-c338-4ebe-a82a-e2fc1d1ff78a. Remember, when you make this call, you still need to set up all the HTTP form parameters and the HTTP authorization header to include the Authorization header and the JWT token.
Figure 7.12 shows the output to the command-line console displaying your parsed organizationId.
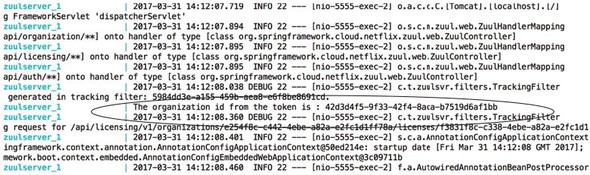
While this chapter has introduced you to the OAuth2 specification and how you can use Spring Cloud security to implement an OAuth2 authentication service, OAuth2 is only one piece of the microservice security puzzle. As you build your microservices for production use, you should be building your microservices security around the following practices:
Figure 7.13 shows how these different pieces fit together. Each of the bulleted items in the list maps to the numbers in figure 7.13.
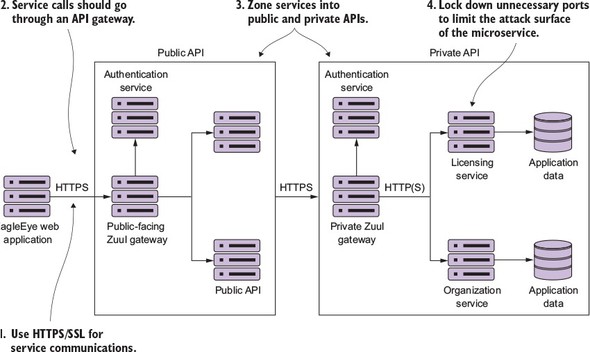
Let’s examine each of the topic areas enumerated in the previous list and diagrams in more detail.
In all the code examples in this book, you’ve been using HTTP because HTTP is a simple protocol and doesn’t require setup on every service before you can start using the service.
In a production environment, your microservices should communicate only through the encrypted channels provided through HTTPS and SSL. The configuration and setup of the HTTPS can be automated through your DevOps scripts.
If your application needs to meet Payment Card Industry (PCI) compliance for credit card payments, you’ll be required to implement HTTPS for all service communication. Building all your services to use HTTPS early on is much easier than doing a migration project after your application and microservices are in production.
The individual servers, service endpoints, and ports your services are running on should never be directly accessible to the client. Instead, use a services gateway to act as an entry point and gatekeeper for your service calls. Configure the network layer on the operating system or container your microservices are running in to only accept traffic from the services gateway.
Remember, the services gateway can act as a policy enforcement point (PEP) that can be enforced against all services. Putting service calls through a services gateway such as Zuul allows you to be consistent in how you’re securing and auditing your services. A service gateway also allows you to lock down what port and endpoints you’re going to expose to the outside world.
Security in general is all about building layers of accessing and enforcing the concept of least privilege. Least privilege is the concept that a user should have the bare minimum network access and privileges to do their day-to-day job. To this end, you should implement least-privilege by separating your services into two distinct zones: public and private.
The public zone contains the public APIs that will be consumed by clients (EagleEye application). Public API microservices should carry out narrow tasks that are workflow-oriented. Public API microservices tend to be service aggregators, pulling data and carrying out tasks across multiple services.
Public microservices should be behind their own services gateway and have their own authentication service for performing OAuth2 authentication. Access to public services by client applications should go through a single route protected by the services gateway. In addition, the public zone should have its own authentication service.
The private zone acts as a wall to protect your core application functionality and data. The private zone should only be accessible through a single well-known port and should be locked down to only accept network traffic from the network subnet that the private services are running. The private zone should have its own services gateway and authentication service. Public API services should authenticate against the private zones authentication service. All application data should at least be in the private zone’s network subnet and only accessible by microservices residing in the private zone.
Many organizations take the approach that their security model should have a hard outer center, with a softer inner surface. What this means is that once traffic is inside the private API zone, communication between services in the private zone can be unencrypted (no HTTPS) and not require an authentication mechanism. Most of the time, this is done for convenience and developer velocity. The more security you have in place, the harder it is to debug problems, increasing the overall complexity of managing your application.
I tend to take a paranoid view of the world. (I worked in financial services for eight years, so paranoia comes with the territory.) I’d rather trade off the additional complexity (which can be mitigated through DevOps scripts) and enforce that all services running in my private API zone use SSL and are authenticated against the authentication service running in the private zone. The question that you have to ask yourself is, How willing are you to see your organization on the front page of your local newspaper because of a network breach?
Many developers don’t take a hard look at the absolute minimum number of ports they need to open for their services to function. Configure the operating system your service is running on to only allow the inbound and outbound access to ports needed by your service or a piece of infrastructure needed by your service (monitoring, log aggregation).
Don’t focus only on inbound access ports. Many developers forget to lock down their outbound ports. Locking down your outbound ports can prevent data from being leaked off your service in the event that the service itself has been compromised by an attacker. Also, make sure you look at network port access in both your public and private API zones.
When was the last time you sat down with another person and had a conversation? Think back about how you interacted with that other person. Was it a totally focused exchange of information where you said something and then did nothing else while you waited for the person to respond in full? Were you completely focused on the conversation and let nothing from the outside world distract you while you were speaking? If there were more than two people in the conversation, did you repeat something you said perfectly over and over to each conversation participant and wait in turn for their response? If you said yes to these questions, you have reached enlightenment, are a better human being than me, and should stop what you’re doing because you can now answer the age-old question, “What is the sound of one object clapping?” Also, I suspect you don’t have children.
The reality is that human beings are constantly in a state of motion, interacting with their environment around them, while sending out and receiving information from the things around them. In my house a typical conversation might be something like this. I’m busy washing the dishes while talking to my wife. I’m telling her about my day. She’s looking at her phone and she’s listening, processing what I’m saying, and occasionally responding back. As I’m washing the dishes, I hear a commotion in the next room. I stop what I’m doing, rush into the next room to find out what’s wrong and see that our rather large nine-month-old puppy, Vader, has taken my three-year-old son’s shoe, and is trotting around the living room carrying the shoe like a trophy. My three-year-old isn’t happy about this. I run through the house, chasing the dog until I get the shoe back. I then go back to the dishes and my conversation with my wife.
My point in telling you this isn’t to tell you about a typical day in my life, but rather to point out that our interaction with the world isn’t synchronous, linear, and narrowly defined to a request-response model. It’s message-driven, where we’re constantly sending and receiving messages. As we receive messages, we react to those messages, while often interrupting the primary task that we’re working on.
This chapter is about how to design and implement your Spring-based microservices to communicate with other microservices using asynchronous messages. Using asynchronous messages to communicate between applications isn’t new. What’s new is the concept of using messages to communicate events representing changes in state. This concept is called Event Driven Architecture (EDA). It’s also known as Message Driven Architecture (MDA). What an EDA-based approach allows you to do is to build highly decoupled systems that can react to changes without being tightly coupled to specific libraries or services. When combined with microservices, EDA allows you to quickly add new functionality into your application by merely having the service listen to the stream of events (messages) being emitted by your application.
The Spring Cloud project has made it trivial to build messaging-based solutions through the Spring Cloud Stream sub-project. Spring Cloud Stream allows you to easily implement message publication and consumption, while shielding your services from the implementation details associated with the underlying messaging platform.
Why is messaging important in building microservice-based applications? To answer that question, let’s start with an example. We’re going to use the two services we’ve been using throughout the book: your licensing and organization services. Let’s imagine that after these services are deployed to production, you find that the licensing service calls are taking an exceedingly long time when doing a lookup of organization information from the organization service. When you look at the usage patterns of the organization data, you find that the organization data rarely changes and that most of the data reads from the organization service are done by the primary key of the organization record. If you could cache the reads for the organization data without having to incur the cost of accessing a database, you could greatly improve the response time of the licensing service calls.
As you look at implementing a caching solution, you realize you have three core requirements:
Let’s look at two approaches for implementing these requirements. The first approach will implement the above requirements using a synchronous request-response model. When the organization state changes, the licensing and organization services communicate back and forth via their REST endpoints. The second approach will have the organization service emit an asynchronous event (message) that will communicate that the organization service data has changed. With the second approach, the organization service will publish a message to a queue that an organization record has been updated or deleted. The licensing service will listen with the intermediary, see that an organization event has occurred, and clear the organization data from its cache.
For your organization data cache, you’re going to use Redis (http://redis.io/), a distributed key-value store database. Figure 8.1 provides a high-level overview of how to build a caching solution using a traditional synchronous, request-response programming model.
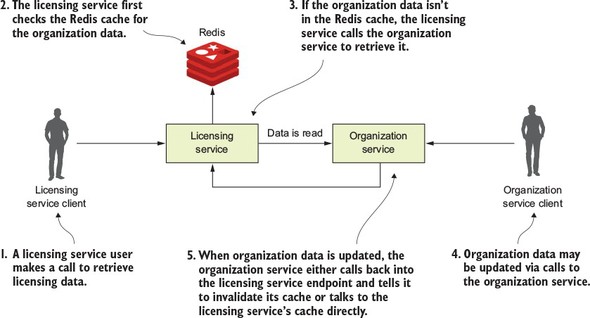
In figure 8.1, when a user calls the licensing service, the licensing service will need to also look up organization data. The licensing service will first check to retrieve the desired organization by its ID from the Redis cluster. If the licensing service can’t find the organization data, it will call the organization service using a REST-based endpoint and then store the data returned in Redis, before returning the organization data back to the user. Now, if someone updates or deletes the organization record using the organization service’s REST endpoint, the organization service will need to call an endpoint exposed on the licensing service, telling it to invalidate the organization data in its cache. In figure 8.1, if you look at where the organization service calls back into the licensing service to tell it to invalidate the Redis cache, you can see at least three problems:
In figure 8.1 you can see tight coupling between the licensing and the organization service. The licensing service always had a dependency on the organization service to retrieve data. However, by having the organization service directly communicate back to the licensing service whenever an organization record has been updated or deleted, you’ve introduced coupling back from the organization service to the licensing service. For the data in the Redis cache to be invalidated, the organization service either needs an endpoint on the licensing service exposed that can be called to invalidate its Redis cache, or the organization service has to talk directly to the Redis server owned by the licensing service to clear the data in it.
Having the organization service talk to Redis has its own problems because you’re talking to a data store owned directly by another service. In a microservice environment, this a big no-no. While one can argue that the organization data rightly belongs to the organization service, the licensing service is using it in a specific context and could be potentially transforming the data or have built business rules around it. Having the organization service talking directly to the Redis service can accidently break rules the team owning the licensing service has implemented.
The tight coupling between the licensing service and the organization service has also introduced brittleness between the two services. If the licensing service is down or running slowly, the organization service can be impacted because the organization service is now communicating directly with the licensing service. Again, if you had the organization service talk directly to licensing service’s Redis data store, you’ve now created a dependency between the organization service and Redis. In this scenario, any problems with the shared Redis server now have the potential to take down both services.
The last problem with this architecture is that it’s inflexible. With the model in figure 8.1, if you had another service that was interested in when the organization data changes, you’d need to add another call from the organization service to that other service. This means a code change and redeployment of the organization service. If you use the synchronous, request-response model for communicating state change, you start to see almost a web-like pattern of dependency between your core services in your application and other services. The centers of these webs become your major points of failure within your application.
While messaging adds a layer of indirection between your services, you can still introduce tight coupling between two services using messaging. Later in the chapter you’re going to send messages between the organization and licensing service. These messages are going to be serialized and de-serialized to a Java object using JSON as the transport protocol for the message. Changes to the structure of the JSON message can cause problems when converting back and forth to Java if the two services don’t gracefully handle different versions of the same message type. JSON doesn’t natively support versioning. However, you can use Apache Avro (https://avro.apache.org/) if you need versioning. Avro is a binary protocol that has versioning built into it. Spring Cloud Stream does support Apache Avro as a messaging protocol. However, using Avro is outside the scope of this book, but we did want to make you aware that it does help if you truly need to worry about message versioning.
With a messaging approach, you’re going to inject a queue in between the licensing and organization service. This queue won’t be used to read data from the organization service, but will instead be used by the organization service to publish when any state changes within the organization data managed by the organization service occurs. Figure 8.2 demonstrates this approach.
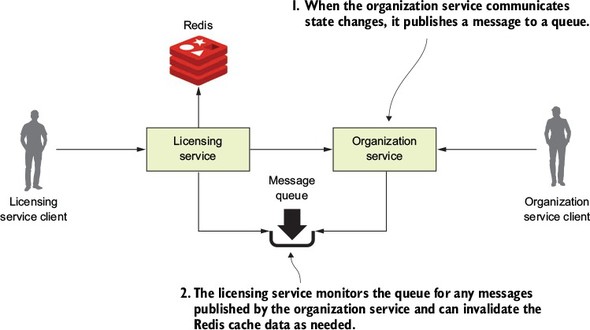
In the model in figure 8.2, every time organization data changes, the organization service publishes a message out to a queue. The licensing service is monitoring the queue for messages and when a message comes in, clears the appropriate organization record out of the Redis cache. When it comes to communicating state, the message queue acts as an intermediary between the licensing and organization service. This approach offers four benefits:
A microservices application can be composed of dozens of small and distributed services that have to interact with each other and are interested in the data managed by one another. As you saw with the synchronous design proposed earlier, a synchronous HTTP response creates a hard dependency between the licensing and organization service. We can’t eliminate these dependencies completely, but we can try to minimize dependencies by only exposing endpoints that directly manage the data owned by the service. A messaging approach allows you to decouple the two services because when it comes to communicating state changes, neither service knows about each other. When the organization service needs to publish a state change, it writes a message to a queue. The licensing service only knows that it gets a message; it has no idea who has published the message.
The presence of the queue allows you to guarantee that a message will be delivered even if the consumer of the service is down. The organization service can keep publishing messages even if the licensing service in unavailable. The messages will be stored in the queue and will stay there until the licensing service is available. Conversely, with the combination of a cache and the queuing approach, if the organization service is down, the licensing service can degrade gracefully because at least part of the organization data will be in its cache. Sometimes old data is better than no data.
Since messages are stored in a queue, the sender of the message doesn’t have to wait for a response back from the consumer of the message. They can go on their way and continue their work. Likewise, if a consumer reading a message off the queue isn’t processing messages fast enough, it’s a trivial task to spin up more consumers and have them process those messages off the queue. This scalability approach fits well within a microservices model because one of the things I’ve been emphasizing through this book is that it should be trivial to spin up new instances of a microservice and have that additional microservice become another service that can process work off the message queue holding the messages. This is an example of scaling horizontally. Traditional scaling mechanisms for reading messages off a queue involved increasing the number of threads that a message consumer could process at one time. Unfortunately, with this approach, you were ultimately limited by the number of CPUs available to the message consumer. A microservice model doesn’t have this limitation because you’re scaling by increasing the number of machines hosting the service consuming the messages.
The sender of a message has no idea who is going to consume it. This means you can easily add new message consumers (and new functionality) without impacting the original sending service. This is an extremely powerful concept because new functionality can be added to an application without having to touch existing services. Instead, the new code can listen for events being published and react to them accordingly.
Like any architectural model, a messaging-based architecture has tradeoffs. A messaging-based architecture can be complex and requires the development team to pay close attention to several key things, including
Using messages in a microservice-based application requires more than understanding how to publish and consume messages. It requires you to understand how your application will behave based on the order messages are consumed and what happens if a message is processed out of order. For example, if you have strict requirements that all orders from a single customer must be processed in the order they are received, you’re going to have to set up and structure your message handling differently than if every message can be consumed independently of one another.
It also means that if you’re using messaging to enforce strict state transitions of your data, you need to think as you’re designing your application about scenarios where a message throws an exception, or an error is processed out of order. If a message fails, do you retry processing the error or do you let it fail? How do you handle future messages related to that customer if one of the customer messages fails? Again, these are all topics to think through.
Using messages in your microservices often means a mix of synchronous service calls and processing in services asynchronously. The asynchronous nature of messages means they might not be received or processed in close proximity to when the message is published or consumed. Also, having things like a correlation ID for tracking a user’s transactions across web service invocations and messages is critical to understanding and debugging what’s going on in your application. As you may remember from chapter 6, a correlation ID is a unique number that’s generated at the start of a user’s transaction and passed along with every service call. It should also be passed with every message that’s published and consumed.
As alluded to in the section on message visibility, messaging-based applications make it more difficult to reason through the business logic of their applications because their code is no longer being processed in a linear fashion with a simple block request-response model. Instead, debugging message-based applications can involve wading through the logs of several different services where the user transactions can be executed out of order and at different times.
The previous sections weren’t meant to scare you away from using messaging in your applications. Rather, my goal is to highlight that using messaging in your services requires forethought. I recently completed a major project where we needed to bring up and down a stateful set of AWS server instances for each one of our customers. We had to integrate a combination of microservice calls and messages using both AWS Simple Queueing Service (SQS) and Kafka. While the project was complex, I saw first-hand the power of messaging when at the end of the project we realized that we’d need to deal with having to make sure that we retrieved certain files off the server before the server could be terminated. This step had to be carried out about 75% of the way through the user workflow and the overall process couldn’t continue until the process was completed. Fortunately, we had a microservice (called our file recovery service) that could do much of the work to check and see if the files were off the server being decommissioned. Because the servers communicate all of their state changes (including that they’re being decommissioned) via events, we only had to plug the file recovery server into an event stream coming from the server being decommissioned and have them listen for a “decommissioning” event.
If this entire process had been synchronous, adding this file-draining step would have been extremely painful. But in the end, we needed an existing service we already had in production to listen to events coming off an existing messaging queue and react. The work was done in a couple of days and we never missed a beat in our project delivery. Messages allow you to hook together services without the services being hard-coded together in a code-based workflow.
Spring Cloud makes it easy to integrate messaging into your Spring-based microservices. It does this through the Spring Cloud Stream project (https://cloud.spring.io/spring-cloud-stream/). The Spring Cloud Stream project is an annotation-driven framework that allows you to easily build message publishers and consumers in your Spring application.
Spring Cloud Stream also allows you to abstract away the implementation details of the messaging platform you’re using. Multiple message platforms can be used with Spring Cloud Stream (including the Apache Kafka project and RabbitMQ) and the implementation-specific details of the platform are kept out of the application code. The implementation of message publication and consumption in your application is done through platform-neutral Spring interfaces.
For this chapter, you’re going to use a lightweight message bus called Kafka (https://kafka.apache.org/). Kafka is a lightweight, highly performant message bus that allows you asynchronously send streams of messages from one application to one or more other applications. Written in Java, Kafka has become the de facto message bus for many cloud-based applications because it’s highly reliable and scalable. Spring Cloud Stream also supports the use of RabbitMQ as a message bus. Both Kafka and RabbitMQ are strong messaging platforms, and I chose Kafka because that’s what I’m most familiar with.
To understand Spring Cloud Stream, let’s begin with a discussion of the Spring Cloud Stream architecture and familiarize ourselves with the terminology of Spring Cloud Stream. If you’ve never worked with a messaging based platform before, the new terminology involved can be somewhat overwhelming.
Let’s begin our discussion by looking at the Spring Cloud Stream architecture through the lens of two services communicating via messaging. One service will be the message publisher and one service will be the message consumer. Figure 8.3 shows how Spring Cloud Stream is used to facilitate this message passing.
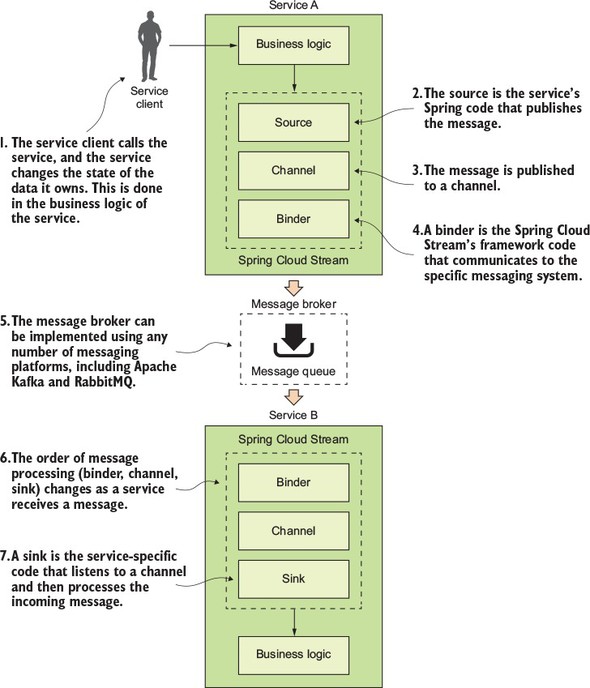
With the publication and consumption of a message in Spring Cloud, four components are involved in publishing and consuming the message:
When a service gets ready to publish a message, it will publish the message using a source. A source is a Spring annotated interface that takes a Plain Old Java Object (POJO) that represents the message to be published. A source takes the message, serializes it (the default serialization is JSON), and publishes the message to a channel.
A channel is an abstraction over the queue that’s going to hold the message after it has been published by the message producer or consumed by a message consumer. A channel name is always associated with a target queue name. However, that queue name is never directly exposed to the code. Instead the channel name is used in the code, which means that you can switch the queues the channel reads or writes from by changing the application’s configuration, not the application’s code.
The binder is part of the Spring Cloud Stream framework. It’s the Spring code that talks to a specific message platform. The binder part of the Spring Cloud Stream framework allows you to work with messages without having to be exposed to platform--specific libraries and APIs for publishing and consuming messages.
In Spring Cloud Stream, when a service receives a message from a queue, it does it through a sink. A sink listens to a channel for incoming messages and de-serializes the message back into a plain old Java object. From there, the message can be processed by the business logic of the Spring service.
Now that we’ve walked through the basic components in Spring Cloud Stream, let’s look at a simple Spring Cloud Stream example. For the first example, you’re going to pass a message from your organization service to your licensing service. The only thing you’ll do with the message in the licensing service is to print a log message to the console.
In addition, because you’re only going to have one Spring Cloud Stream source (the message producer) and sink (message consumer) in this example, you’re going to start the example with a few simple Spring Cloud shortcuts that will make setting up the source in the organization service and a sink in the licensing service trivial.
You’re going to begin by modifying the organization service so that every time organization data is added, updated, or deleted, the organization service will publish a message to a Kafka topic indicating that the organization change event has occurred. Figure 8.4 highlights the message producer and build on the general Spring Cloud Stream architecture from figure 8.3.
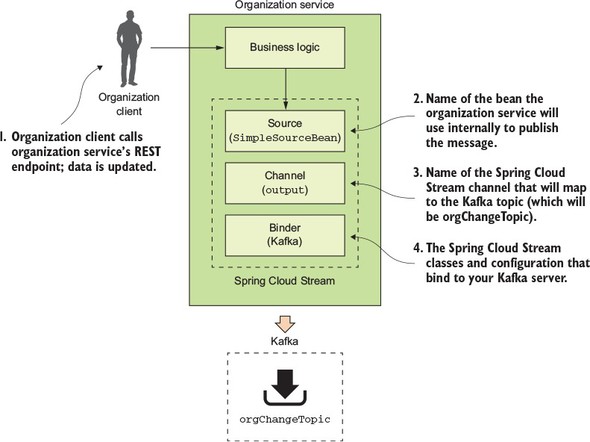
The published message will include the organization ID associated with the change event and will also include what action occurred (Add, Update or Delete).
The first thing you need to do is set up your Maven dependencies in the organization service’s Maven pom.xml file. The pom.xml file can be found in the organization-service directory. In the pom.xml, you need to add two dependencies: one for the core Spring Cloud Stream libraries and the other to include the Spring Cloud Stream Kafka libraries:
<dependency>
    <groupId>org.springframework.cloud</groupId>
    <artifactId>spring-cloud-stream</artifactId>
  </dependency>
<dependency>
    <groupId>org.springframework.cloud</groupId>
    <artifactId>spring-cloud-starter-stream-kafka</artifactId>
</dependency>
Once the Maven dependencies have been defined, you need to tell your application that it’s going to bind to a Spring Cloud Stream message broker. You do this by annotating the organization service’s bootstrap class organization-service/src/main/java/com/thoughtmechanix/organization/Application.java with an @EnableBinding annotation. The following listing shows the organization service’s Application.java source code.
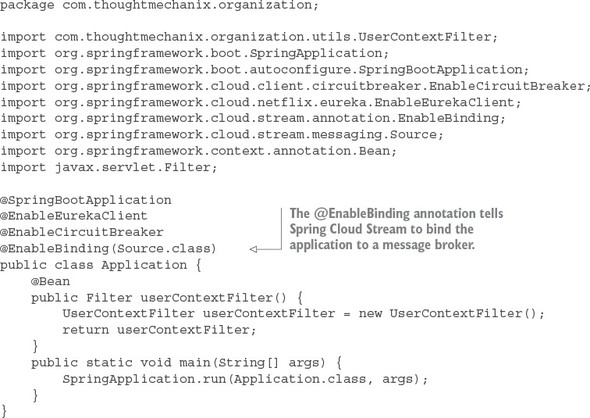
In listing 8.1, the @EnableBinding annotation tells Spring Cloud Stream that you want to bind the service to a message broker. The use of Source.class in the @EnableBinding annotation tells Spring Cloud Stream that this service will communicate with the message broker via a set of channels defined on the Source class. Remember, channels sit above a message queue. Spring Cloud Stream has a default set of channels that can be configured to speak to a message broker.
At this point you haven’t told Spring Cloud Stream what message broker you want the organization service to bind to. We’ll get to that shortly. Now, you can go ahead and implement the code that will publish a message.
The message publication code can be found in the organization-service/src/com/thoughtmechanix/organization/events/source/SimpleSourceBean.java class. The following listing shows the code for this class.
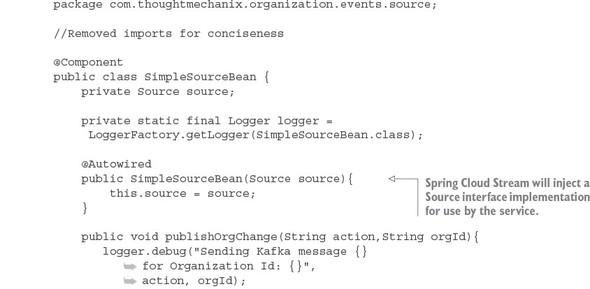
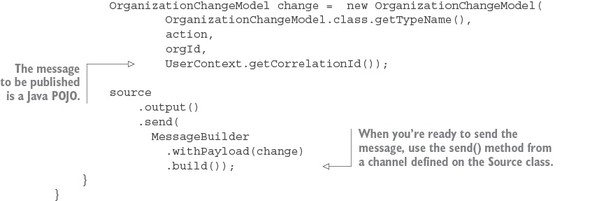
In listing 8.2 you inject the Spring Cloud Source class into your code. Remember, all communication to a specific message topic occurs through a Spring Cloud Stream construct called a channel. A channel is represented by a Java interface class. In this listing you’re using the Source interface. The Source interface is a Spring Cloud defined interface that exposes a single method called output(). The Source interface is a convenient interface to use when your service only needs to publish to a single channel. The output() method returns a class of type MessageChannel. The MessageChannel is how you’ll send messages to the message broker. Later in this chapter, I’ll show you how to expose multiple messaging channels using a custom interface.
The actual publication of the message occurs in the publishOrgChange() method. This method builds a Java POJO called OrganizationChangeModel. I’m not going to put the code for the OrganizationChangeModel in the chapter because this class is nothing more than a POJO around three data elements:
When you’re ready to publish the message, use the send() method on the MessageChannel class returned from the source.output() method.
source.output().send(MessageBuilder.withPayload(change).build());
The send() method takes a Spring Message class. You use a Spring helper class called MessageBuilder to take the contents of the OrganizationChangeModel class and convert it to a Spring Message class.
This all the code you need to send a message. However, at this point, everything should feel a little bit like magic because you haven’t seen how to bind your organization service to a specific message queue, let alone the actual message broker. This is all done through configuration. Listing 8.3 shows the configuration that does the mapping of your service’s Spring Cloud Stream Source to a Kafka message broker and a message topic in Kafka. This configuration information can be localized in your service’s application.yml file or inside a Spring Cloud Config entry for the service.
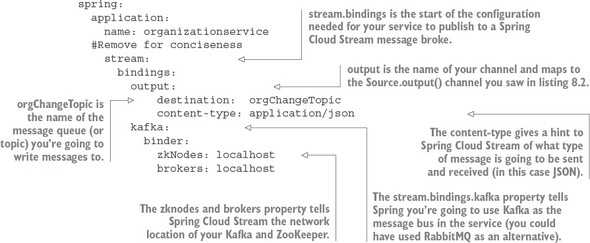
The configuration in listing 8.3 looks dense, but it’s straightforward. The configuration property spring.stream.bindings.output in the listing maps the source.output() channel in listing 8.2 to the orgChangeTopic on the message broker you’re going to communicate with. It also tells Spring Cloud Stream that messages being sent to this topic should be serialized as JSON. Spring Cloud Stream can serialize messages in multiple formats, including JSON, XML, and the Apache Foundation’s Avro format (https://avro.apache.org/).
The configuration property, spring.stream.bindings.kafka in listing 8.3, also tells Spring Cloud Stream to bind the service to Kafka. The sub-properties tell Spring Cloud Stream the network addresses of the Kafka message brokers and the Apache ZooKeeper servers that run with Kafka.
Now that you have the code written that will publish a message via Spring Cloud Stream and the configuration to tell Spring Cloud Stream that it’s going to use Kafka as a message broker, let’s look at where the publication of the message in your organization service actually occurs. This work will be done in the organization-service/src/main/java/com/thoughtmechanix/organization/services/OrganizationService.java class. The following listing shows the code for this class.
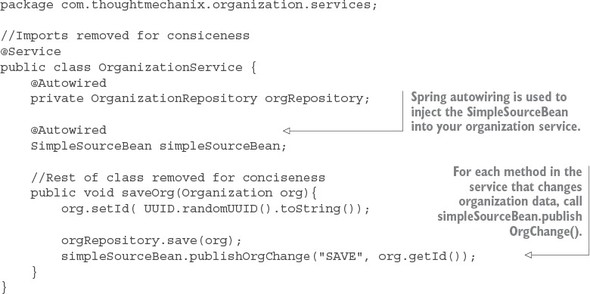
One of the most common questions I get from teams when they’re first embarking on their message journey is exactly how much data should go in their messages. My answer is, it depends on your application. As you may notice, in all my examples I only return the organization ID of the organization record that has changed. I never put a copy of the changes to the data in the message. In my examples (and in many of the problems I deal with in the telephony space), the business logic being executed is sensitive to changes in data. I used messages based on system events to tell other services that data state has changed, but I always force the other services to go back to the master (the service that owns the data) to retrieve a new copy of the data. This approach is costlier in terms of execution time, but it also guarantees I always have the latest copy of the data to work with. A chance still exists that the data you’re working with could change right after you’ve read it from the source system, but that’s much less likely than blindly consuming the information right off the queue.
Think carefully about how much data you’re passing around. Sooner or later, you’ll run into a situation where the data you passed is stale. It could be stale because a problem caused it to sit in a message queue too long, or a previous message containing data failed, and the data you’re passing in the message now represents data that’s in an inconsistent state (because your application relied on the message’s state rather than the actual state in the underlying data store). If you’re going to pass state in your message, also make sure to include a date-time stamp or version number in your message so that the services consuming the data can inspect the data being passed and ensure that it’s not older than the copy of the data they already have. (Remember, data can be retrieved out of order.)
At this point you’ve modified the organization service to publish a message to Kafka every time the organization service changes organization data. Anyone who’s interested can react without having to be explicitly called by the organization service. It also means you can easily add new functionality that can react to the changes in the organization service by having them listen to messages coming in on the message queue. Let’s now switch directions and look at how a service can consume a message using Spring Cloud Stream.
For this example, you’re going to have the licensing service consume the message published by the organization service. Figure 8.5 shows where the licensing service will fit into the Spring Cloud architecture first shown in figure 8.3.
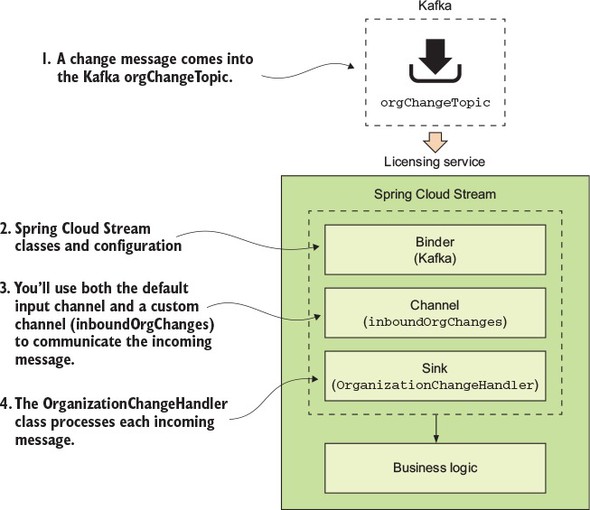
To begin, you again need to add your Spring Cloud Stream dependencies to the licensing services pom.xml file. This pom.xml file can found in licensing-service directory of the source code for the book. Similar to the organization-service pom.xml file you saw earlier, you add the following two dependency entries:
<dependency>
    <groupId>org.springframework.cloud</groupId>
    <artifactId>spring-cloud-stream</artifactId>
  </dependency>

<dependency>
    <groupId>org.springframework.cloud</groupId>
    <artifactId>spring-cloud-starter-stream-kafka</artifactId>
</dependency>
Then you need to tell the licensing service that it needs to use Spring Cloud Stream to bind to a message broker. Like the organization service, we’re going to annotate the licensing services bootstrap class (licensing-service/src/main/java/com/thoughtmechanix/licenses/Application.java) with the @EnableBinding annotation. The difference between the licensing service and the organization service is the value you’re going to pass to the @EnableBinding annotation, as shown in the following listing.
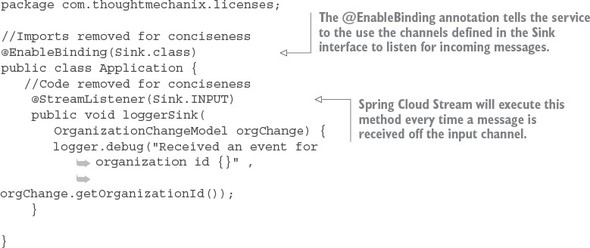
Because the licensing service is a consumer of a message, you’re going to pass the @EnableBinding annotation the value Sink.class. This tells Spring Cloud Stream to bind to a message broker using the default Spring Sink interface. Similar to the Spring Cloud Steam Source interface described in section 8.3.1, Spring Cloud Stream exposes a default channel on the Sink interface. The channel on the Sink interface is called input and is used to listen for incoming messages on a channel.
Once you’ve defined that you want to listen for messages via the @EnableBinding annotation, you can write the code to process a message coming off the Sink input channel. To do this, use the Spring Cloud Stream @StreamListener annotation.
The @StreamListener annotation tells Spring Cloud Stream to execute the loggerSink() method every time a message is received off the input channel. Spring Cloud Stream will automatically de-serialize the message coming off the channel to a Java POJO called OrganizationChangeModel.
Once again, the actual mapping of the message broker’s topic to the input channel is done in the licensing service’s configuration. For the licensing service, its configuration is shown in the following listing and can be found in the licensing service’s licensing-service/src/main/resources/application.yml file.
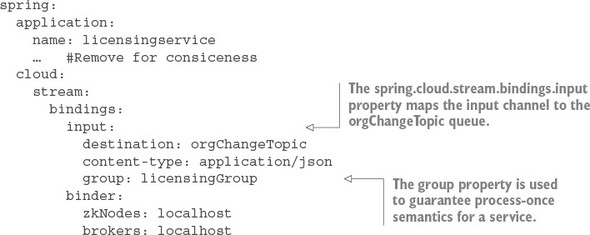
The configuration in this listing looks like the configuration for the organization service. It has, however, two key differences. First, you now have a channel called input defined under the spring.cloud.stream.bindings property. This value maps to the Sink.INPUT channel defined in the code from listing 8.5. This property maps the input channel to the orgChangeTopic. Second, you see the introduction of a new property called spring.cloud.stream.bindings.input.group. The group property defines the name of the consumer group that will be consuming the message.
The concept of a consumer group is this: You might have multiple services with each service having multiple instances listening to the same message queue. You want each unique service to process a copy of a message, but you only want one service instance within a group of service instances to consume and process a message. The group property identifies the consumer group that the service belongs to. As long as all the service instances have the same group name, Spring Cloud Stream and the underlying message broker will guarantee that only one copy of the message will be consumed by a service instance belonging to that group. In the case of your licensing service, the group property value will be called licensingGroup.
Figure 8.6 illustrates how the consumer group is used to help enforce consume-once semantics for a message being consumed across multiple services.
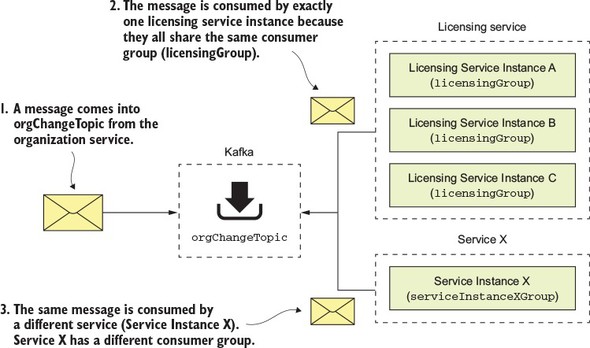
At this point you have the organization service publishing a message to the org-Change-Topic every time a record is added, updated, or deleted and the licensing service receiving the message of the same topic. Now you’ll see this code in action by updating an organization service record and watching the console to see the corresponding log message appear from the licensing service.
To update the organization service record, you’re going to issue a PUT on the organization service to update the organization’s contact phone number. The endpoint you’re going to update with is http://localhost:5555/api/organization/v1/organizations/e254f8c-c442-4ebe-a82a-e2fc1d1ff78a. The body you’re going to send on the PUT call to the endpoint is
{
    "contactEmail": "mark.balster@custcrmco.com",
    "contactName": "Mark Balster",
    "contactPhone": "823-555-2222",
    "id": "e254f8c-c442-4ebe-a82a-e2fc1d1ff78a",
    "name": "customer-crm-co"
}
Figure 8.7 shows the returned output from this PUT call.
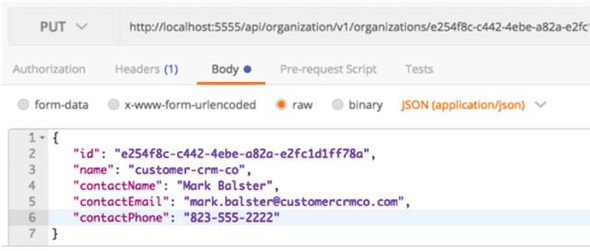
Once the organization service call has been made, you should see the following output in the console window running the services. Figure 8.8 show this output.
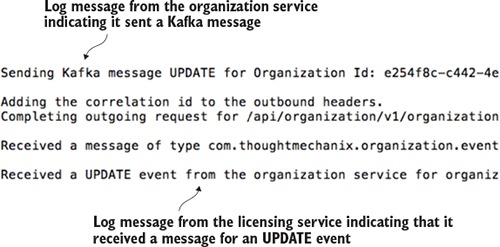
Now you have two services communicating with each other using messaging. Spring Cloud Stream is acting as the middleman for these services. From a messaging perspective, the services know nothing about each other. They’re using a messaging broker to communicate as an intermediary and Spring Cloud Stream as an abstraction layer over the messaging broker.
At this point you have two services communicating with messaging, but you’re not really doing anything with the messages. Now you’ll build the distributed caching example we discussed earlier in the chapter. You’ll have the licensing service always check a distributed Redis cache for the organization data associated with a particular license. If the organization data exists in the cache, you’ll return the data from the cache. If it doesn’t, you’ll call the organization service and cache the results of the call in a Redis hash.
When data is updated in the organization service, the organization service will issue a message to Kafka. The licensing service will pick up the message and issue a delete against Redis to clear out the cache.
Using Redis as a distributed cache is very relevant to microservices development in the cloud. With my current employer, we build our solution using Amazon’s Web Services (AWS) and are a heavy user of Amazon’s DynamoDB. We also use Amazon’s ElastiCache (Redis) to
Redis is far more than a caching solution, but it can fill that role if you need a distributed cache.
Now you’re going to begin by setting up the licensing service to use Redis. Fortunately, Spring Data already makes it simple to introduce Redis into your licensing service. To use Redis in the licensing service you need to do four things:
The first thing you need to do is include the spring-data-redis dependencies, along with the jedis and common-pools2 dependencies, into the licensing service’s pom.xml file. The dependencies to include are shown in the following listing.
<dependency>
   <groupId>org.springframework.data</groupId>
   <artifactId>spring-data-redis</artifactId>
   <version>1.7.4.RELEASE</version>
</dependency>

<dependency>
  <groupId>redis.clients</groupId>
  <artifactId>jedis</artifactId>
  <version>2.9.0</version>
</dependency>

<dependency>
  <groupId>org.apache.commons</groupId>
  <artifactId>commons-pool2</artifactId>
  <version>2.0</version>
</dependency>
Now that you have the dependencies in Maven, you need to establish a connection out to your Redis server. Spring uses the open source project Jedis (https://github.com/xetorthio/jedis) to communicate with a Redis server. To communicate with a specific Redis instance, you’re going to expose a JedisConnection-Factory in the licensing-service/src/main/java/com/thoughtmechanix/licenses/Application.java class as a Spring Bean. Once you have a connection out to Redis, you’re going to use that connection to create a Spring RedisTemplate object. The RedisTemplate object will be used by the Spring Data repository classes that you’ll implement shortly to execute the queries and saves of organization service data to your Redis service. The following listing shows this code.
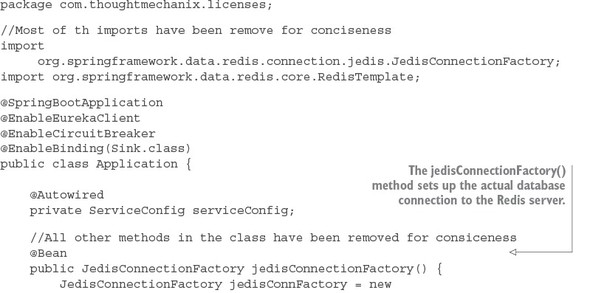
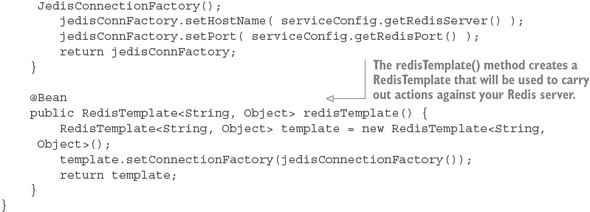
The foundational work for setting up the licensing service to communicate with Redis is complete. Let’s now move over to writing the logic that will get, add, update, and delete data from Redis.
Redis is a key-value store data store that acts like a big, distributed, in-memory HashMap. In the simplest case, it stores data and looks up data by a key. It doesn’t have any kind of sophisticated query language to retrieve data. Its simplicity is its strength and one of the reasons why so many projects have adopted it for use in their projects.
Because you’re using Spring Data to access your Redis store, you need to define a repository class. As may you remember from early on in chapter 2, Spring Data uses user-defined repository classes to provide a simple mechanism for a Java class to access your Postgres database without having to write low-level SQL queries.
For the licensing service, you’re going to define two files for your Redis repository. The first file you’ll write will be a Java interface that’s going to be injected into any of the licensing service classes that are going to need to access Redis. This inter- face (licensing-service/src/main/java/com/thoughtmechanix/licenses/repository/OrganizationRedisRepository.java) is shown in the following listing.
package com.thoughtmechanix.licenses.repository;

import com.thoughtmechanix.licenses.model.Organization;

public interface OrganizationRedisRepository {
    void saveOrganization(Organization org);
    void updateOrganization(Organization org);
    void deleteOrganization(String organizationId);
    Organization findOrganization(String organizationId);
}
The second file is the implementation of the OrganizationRedisRepository interface. The implementation of the interface, the licensing-service/src/main/java/com/thoughtmechanix/licenses/repository/OrganizationRedisRepositoryImpl.java class, uses the RedisTemplate Spring bean you declared earlier in listing 8.8 to interact with the Redis server and carry out actions against the Redis server. The next listing shows this code in use.
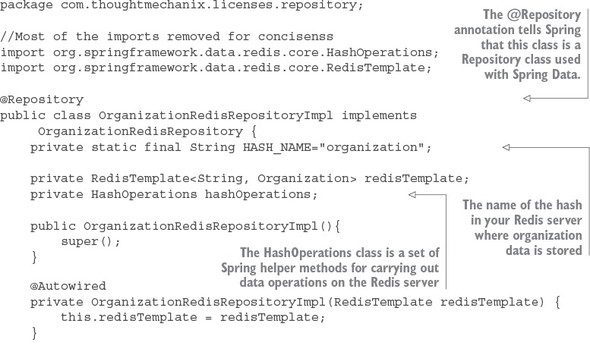
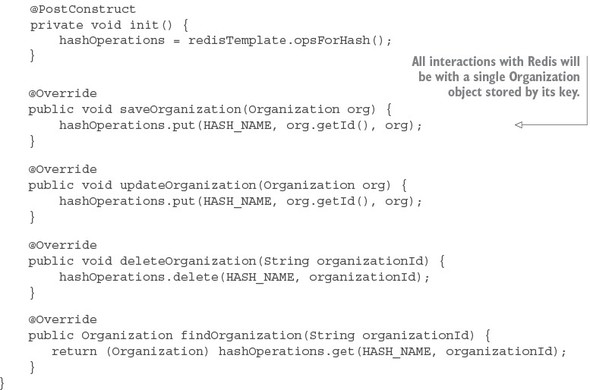
The OrganizationRedisRepositoryImpl contains all the CRUD (Create, Read, Update, Delete) logic used for storing and retrieving data from Redis. There are two key things to note from the code in listing 8.10:
Now that you have the code in place to perform operations against Redis, you can modify your licensing service so that every time the licensing service needs the organization data, it will check the Redis cache before calling out to the organization service. The logic for checking Redis will occur in the licensing-service/src/main/java/com/thoughtmechanix/licenses/clients/OrganizationRestTemplate Client.java class. The code for this class is shown in the following listing.
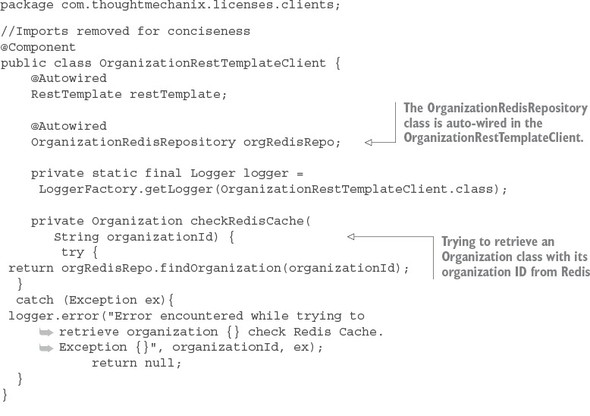
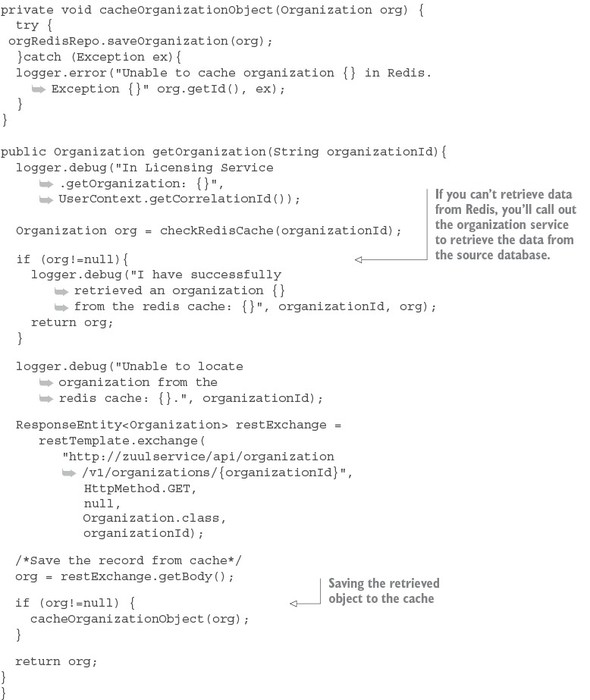
The getOrganization() method is where the call to the organization service takes place. Before you make the actual REST call, you attempt to retrieve the Organization object associated with the call from Redis using the checkRedisCache() method. If the organization object in question is not in Redis, the code will return a null value. If a null value is returned from the checkRedisCache() method, the code will invoke the organization service’s REST endpoint to retrieve the desired organization record. If the organization service returns an organization, the returned organization object will be cached using the cacheOrganizationObject() method.
Pay close attention to exception handling when interacting with the cache. To increase resiliency, we never let the entire call fail if we cannot communicate with the Redis server. Instead, we log the exception and let the call go out to the organization service. In this particular use case, caching is meant to help improve performance and the absence of the caching server shouldn’t impact the success of the call.
With the Redis caching code in place, you should hit the licensing service (yes, you only have two services, but you have a lot of infrastructure) and see the logging messages in listing 8.10. If you were to do two back-to-back GET requests on the following licensing service endpoint, http://localhost:5555/api/licensing/v1/organizations/e254f8c-c442-4ebe-a82a-e2fc1d1ff78a/licenses/f3831f8c-c338-4ebe-a82a-e2fc1d1ff78a, you should see the following two output statements in your logs:
licensingservice_1     | 2016-10-26 09:10:18.455 DEBUG 28 --- [nio-8080-exec-
     1] c.t.l.c.OrganizationRestTemplateClient   : Unable to locate
     organization from the redis cache: e254f8c-c442-4ebe-a82a-e2fc1d1ff78a.

licensingservice_1     | 2016-10-26 09:10:31.602 DEBUG 28 --- [nio-8080-exec-
     2] c.t.l.c.OrganizationRestTemplateClient   : I have successfully
     retrieved an organization e254f8c-c442-4ebe-a82a-e2fc1d1ff78a from the
     redis cache: com.thoughtmechanix.licenses.model.Organization@6d20d301
The first line from the console shows the first time you tried to hit the licensing service endpoint for organization e254f8c-c442-4ebe-a82a-e2fc1d1ff78a. The licensing service first checked the Redis cache and couldn’t find the organization record it was looking for. The code then calls the organization service to retrieve the data. The second line that was printed from the console shows that when you hit the licensing service endpoint a second time, the organization record is now cached.
Previously you built your messaging integration between the licensing and organization services to use the default output and input channels that come packaged with the Source and Sink interfaces in the Spring Cloud Stream project. However, if you want to define more than one channel for your application or you want to customize the names of your channels, you can define your own interface and expose as many input and output channels as your application needs.
To create a custom channel, call inboundOrgChanges in the licensing service. You can define the channel in the licensing-service/src/main/java/com/thoughtmechanix/licenses/events/CustomChannels.java interface, as shown in the following listing.
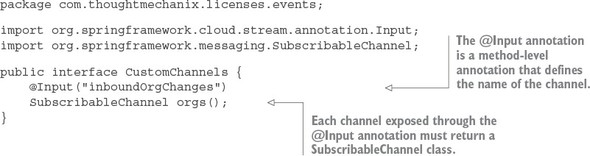
The key takeaway from listing 8.12 is that for each custom input channel you want to expose, you mark a method that returns a SubscribableChannel class with the @Input annotation. If you want to define output channels for publishing messages, you’d use the @OutputChannel above the method that will be called. In the case of an output channel, the defined method will return a MessageChannel class instead of the SubscribableChannel class used with the input channel:
@OutputChannel("outboundOrg")
MessageChannel outboundOrg();
Now that you have a custom input channel defined, you need to modify two more things to use it in the licensing service. First, you need to modify the licensing service to map your custom input channel name to your Kafka topic. The following listing shows this.
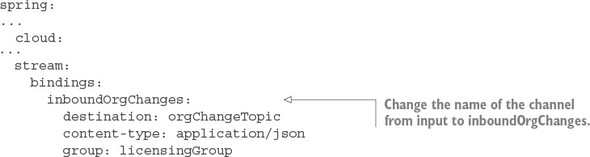
To use your custom input channel, you need to inject the CustomChannels interface you defined into a class that’s going to use it to process messages. For the distributed caching example, I’ve moved the code for handling an incoming message to the following licensing-service class: licensing-service/src/main/java/com/-thoughtmechanix/licenses/events/handlers/OrganizationChange Handler.java. The following listing shows the message handling code that you’ll use with the inboundOrgChanges channel you defined.
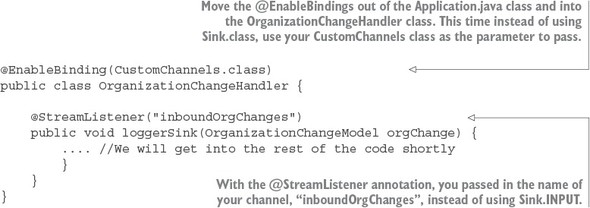
At this point you don’t need to do anything with the organization service. The service is all set up to publish a message whenever an organization is added, updated, or deleted. All you have to do is build out the OrganizationChangeHandler class from listing 8.14. The following listing shows the full implementation of this class.
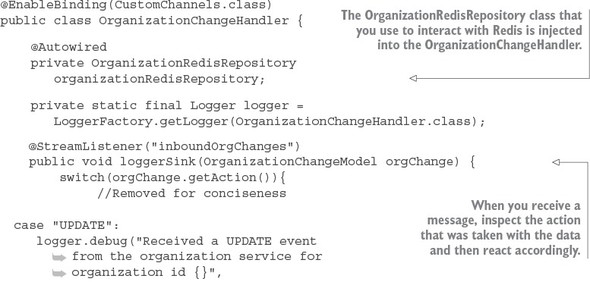
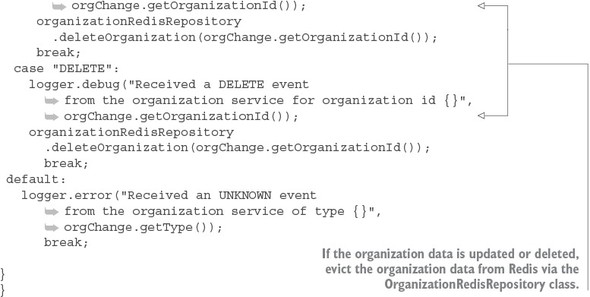
The microservices architecture is a powerful design paradigm for breaking down complex monolithic software systems into smaller, more manageable pieces. These manageable pieces can be built and deployed independently of each other; however, this flexibility comes at a price: complexity. Because microservices are distributed by nature, trying to debug where a problem is occurring can be maddening. The distributed nature of the services means that you have to trace one or more transactions across multiple services, physical machines, and different data stores, and try to piece together what exactly is going on.
This chapter lays out several techniques and technologies for making distributed debugging possible. In this chapter, we look at the following:
To accomplish the three things you’re going to use three different technologies:
To begin this chapter, we start with the simplest of tracing tools, the correlation ID.
Parts of this chapter rely on material covered in chapter 6 (specifically the material on Zuul pre-, response, and post filters). If you haven’t read chapter 6 yet, I recommend that you do so before you read this chapter.
We first introduced the concept of correlation IDs in chapter 5 and 6. A correlation ID is a randomly generated, unique number or string that’s assigned to a transaction when a transaction is initiated. As the transaction flows across multiple services, the correlation ID is propagated from one service call to another. In the context of chapter 6, you used a Zuul filter to inspect all incoming HTTP requests and inject a correlation ID if one wasn’t present.
Once the correlation ID was present, you used a custom Spring HTTP filter on every one of your services to map the incoming variable to a custom UserContext object. With the UserContext object in place, you could now manually add the correlation ID to any of your log statements by making sure you appended the correlation ID to the log statement, or, with a little work, add the correlation ID directly to Spring’s Mapped Diagnostic Context (MDC). You also wrote a Spring Interceptor that would ensure that all HTTP calls from a service would propagate the correlation ID by adding the correlation ID to the HTTP headers on any outbound calls.
Oh, and you had to perform Spring and Hystrix magic to make sure the thread context of the parent thread holding the correlation ID was properly propagated to Hystrix. Wow—in the end this was a lot of infrastructure that was put in place for something that you hope will only be looked at when a problem occurs (using a correlation ID to trace what’s going on with a transaction).
Fortunately, Spring Cloud Sleuth manages all this code infrastructure and complexity for you. By adding Spring Cloud Sleuth to your Spring Microservices, you can
With Spring Cloud Sleuth if you use Spring Boot’s logging implementation, you’ll automatically get correlation IDs added to the log statements you put in your microservices.
Let’s go ahead and add Spring Cloud Sleuth to your licensing and organization services.
To start using Spring Cloud Sleuth in your two services (licensing and organization), you need to add a single Maven dependency to the pom.xml files in both services:
<dependency>
  <groupId>org.springframework.cloud</groupId>
   <artifactId>spring-cloud-starter-sleuth</artifactId>
</dependency>
This dependency will pull in all the core libraries needed for Spring Cloud Sleuth. That’s it. Once this dependency is pulled in, your service will now
If everything is set up correctly, any log statements written within your service application code will now include Spring Cloud Sleuth trace information. For example, figure 9.1 shows what the service’s output would look like if you were to do an HTTP GET http://localhost:5555/api/organization/v1/organizations/e254f8c c442-4ebe-a82a-e2fc1d1ff78a on the organization service.
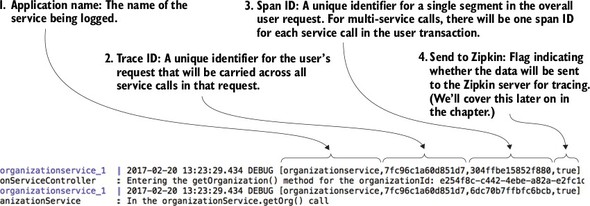
Spring Cloud Sleuth will add four pieces of information to each log entry. These four pieces (numbered to correspond with the numbers in figure 9.1) are
Up to now, we’ve only looked at the logging data produced by a single service call. Let’s look at what happens when you make a call to the licensing service at -GET http://localhost:5555/api/licensing/v1/organizations/e254f8c-c442-4ebe-a82a-e2fc1d1ff78a/licenses/f3831f8c-c338-4ebe-a82a-e2fc 1d1ff78a. Remember, the licensing service also has to call out to the organization service. Figure 9.2 shows the logging output from the two service calls.
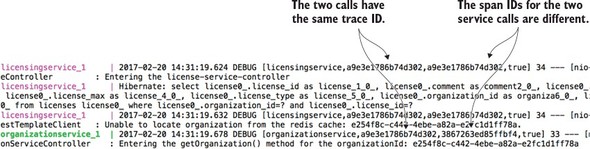
By looking at figure 9.2, you can see that both the licensing and organization services have the same trace ID a9e3e1786b74d302. However, the licensing service has a span ID of a9e3e1786b74d302 (the same value as the transaction ID). The organization service has a span ID of 3867263ed85ffbf4.
By adding nothing more than a few POM dependencies, you’ve replaced all the correlation ID infrastructure that you built out in chapters 5 and 6. Personally, nothing makes me happier in this world then replacing complex, infrastructure-style code with someone else’s code.
In a large-scale microservice environment (especially in the cloud), logging data is a critical tool for debugging problems. However, because the functionality for a microservice-based application is decomposed into small, granular services and you can have multiple service instances for a single service type, trying to tie to log data from multiple services to resolve a user’s problem can be extremely difficult. Developers trying to debug a problem across multiple servers often have to try the following:
Each of the problems listed are real problems that I’ve run into. Debugging a problem across distributed servers is ugly work and often significantly increases the amount of time it takes to identify and resolve an issue.
A much better approach is to stream, real-time, all the logs from all of your service instances to a centralized aggregation point where the log data can be indexed and made searchable. Figure 9.3 shows at a conceptual level how this “unified” logging architecture would work.
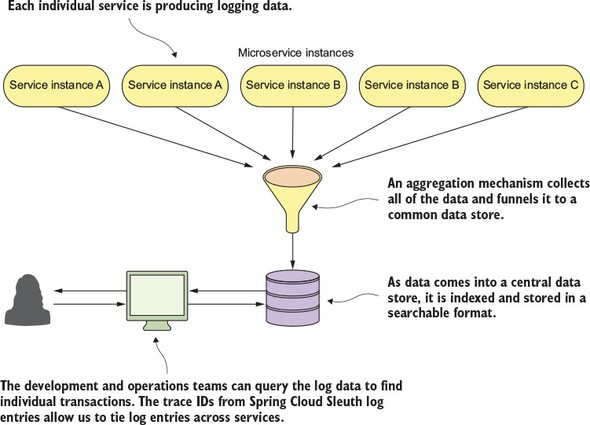
Fortunately, there are multiple open source and commercial products that can help you implement the previously described logging architecture. Also, multiple implementation models exist that will allow you to choose between an on-premise, locally managed solution or a cloud-based solution. Table 9.1 summarizes several of the choices available for logging infrastructure.
|
Implementation Models |
Notes |
|
|---|---|---|
| Elasticsearch, Logstash, Kibana (ELK) | Open source Commercial Typically implemented on premise | http://elastic.co General purpose search engine Can do log-aggregation through the (ELK-stack) Requires the most hands-on support |
| Graylog | Open source Commercial On-premise | http://graylog.org Open-source platform that’s designed to be installed on premise |
| Splunk | Commercial only On-premise and cloud-based | http://splunk.com Oldest and most comprehensive of the log management and aggregation tools Originally an on-premise solution, but have since offered a cloud offering |
| Sumo Logic | Freemium Commercial Cloud-based | http://sumologic.com Freemium/tiered pricing model Runs only as a cloud service Requires a corporate work account to signup (no Gmail or Yahoo accounts) |
| Papertrail | Freemium Commercial Cloud-based | http://papertrailapp.com Freemium/tiered pricing model Runs only as a cloud service |
With all these choices, it might be difficult to choose which one is the best. Every organization is going to be different and have different needs.
For the purposes of this chapter, we’re going to look at Papertrail as an example of how to integrate Spring Cloud Sleuth-backed logs into a unified logging platform. I chose Papertrail because
In figure 9.3 we saw a general unified logging architecture. Let’s now see how the same architecture can be implemented with Spring Cloud Sleuth and Papertrail.
To set up Papertrail to work with your environment, we have to take the following actions:
Figure 9.4 shows the end state for your implementation and how Spring Cloud Sleuth and Papertrail fit together for your solution.
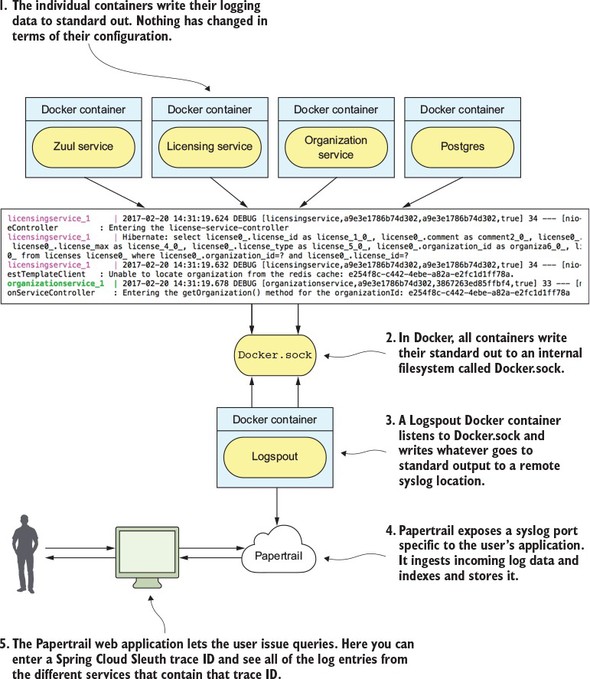
You’ll begin by setting up a Papertrail. To get started, go to https://papertrailapp.com and click on the green “Start Logging – Free Plan” button. Figure 9.5 shows this.
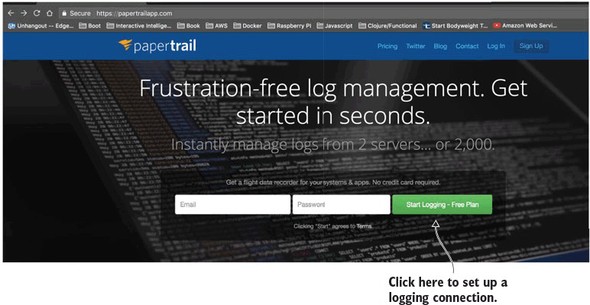
Papertrail doesn’t require a significant amount of information to get started; only a valid email address. Once you’ve filled out the account information, you’ll be presented with a screen to set up your first system to log data from. Figure 9.6 shows this screen.
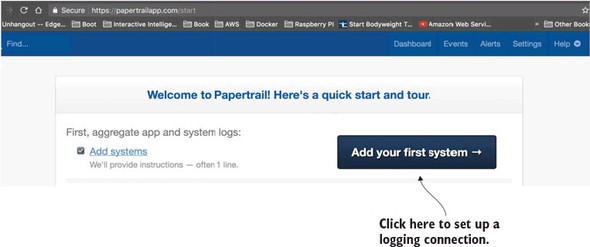
By default, Papertrail allows you to send log data to it via a Syslog call (https://en.wikipedia.org/wiki/Syslog). Syslog is a log messaging format that originated in UNIX. Syslog allows for the sending of log messages over both TCP and UDP. Papertrail will automatically define a Syslog port that you can use to write log messages to. For the purposes of this discussion, you’ll use this default port. Figure 9.7 shows you the Syslog connect string that’s automatically generated when you click on the “Add your first system” button shown in figure 9.6.
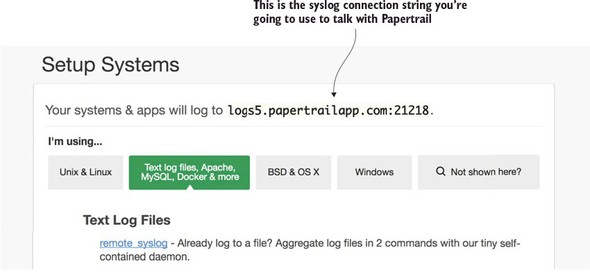
At this point you’re all set up with Papertrail. You now have to configure your Docker environment to capture output from each of the containers running your services to the remote syslog endpoint defined in figure 9.7.
The connection string from figure 9.7 is unique to my account. You’ll need to make sure you use the connection string generated for you by Papertrail or define one via the Papertrail Settings > Log destinations menu option.
Normally, if you’re running each of your services in their own virtual machine, you’ll have to configure each individual service’s logging configuration to send its logging information to a to a remote syslog endpoint (like the one exposed through Papertrail).
Fortunately, Docker makes it incredibly easy to capture all the output from any Docker container running on a physical or virtual machine. The Docker daemon communicates with all of the Docker containers it’s managing through a Unix socket called docker.sock. Any container running on the server where Docker is running can connect to the docker.sock and receive all the messages generated by all of the other containers running on that server. In the simplest terms, docker.sock is like a pipe that your containers can plug into and capture the overall activities going on within the Docker runtime environment on the virtual server the Docker daemon is running on.
You’re going to use a “Dockerized” piece of software called Logspout (https://github.com/gliderlabs/logspout) that will listen to the docker.sock socket and then capture any standard out messages generated in Docker runtime and redirect the output to a remote syslog (Papertrail). To set up your Logspout container, you have to add a single entry to the docker-compose.yml file you use to fire up all of the Docker containers used for the code examples in this chapter. The docker/common/docker-compose.yml file you need to modify should have the following entry added to it:
logspout:
    image: gliderlabs/logspout
    command: syslog://logs5.papertrailapp.com:21218
    volumes:
      - /var/run/docker.sock:/var/run/docker.sock
In the previous code snippet, you’ll need to replace the value in the “command” attribute with the value supplied to you from Papertrail. If you use the previous Logspout snippet, your Logspout container will happily write your log entries to my Papertrail account.
Now when you fire up your Docker environment in this chapter, all data sent to a container’s standard output will be sent to Papertrail. You can see this for yourself by logging into your Papertrail account after you’ve started chapter 9’s Docker examples and clicking on the Events button in the top right part of your screen.
Figure 9.8 shows an example of what the data sent to Papertrail looks like.
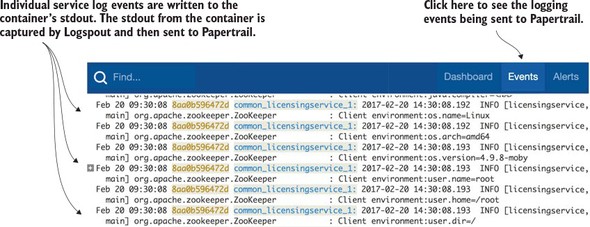
Docker 1.6 and above do allow you to define alternative logging drivers to write the stdout/stderr messages written from each container. One of the logging drivers is a syslog driver that can be used to write the messages to a remote syslog listener.
Why did I choose Logspout instead of using the standard Docker log driver? The main reason is flexibility. Logspout offers features for customizing what logging data gets sent to your log aggregation platform. The features Logspout offers include
Now that your logs are flowing to Papertrail, you can really start appreciating Spring Cloud Sleuth adding trace IDs to all your log entries. To query for all the log entries related to a single transaction, all you need to do is take a trace ID and query for it in the query box of Papertrail’s event screen. Figure 9.9 shows how to execute a query by the Spring Cloud sleuth trace ID we used earlier in section 9.1.2: a9e3e1786b74d302
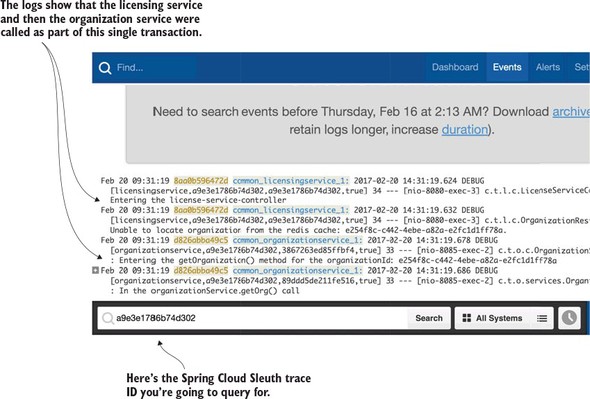
Don’t underestimate how important it is to have a consolidated logging architecture and a service correlation strategy thought out. It seems like a mundane task, but while I was writing this chapter, I used log aggregation tools similar to Papertrail to track down a race condition between three different services for a project I was working on. It turned out that the race condition has been there for over a year, but the service with the race condition had been functioning fine until we added a bit more load and one other actor in the mix to cause the problem.
We found the issue only after spending 1.5 weeks doing log queries and walking through the trace output of dozens of unique scenarios. We wouldn’t have found the problem without the aggregated logging platform that had been put in place. This experience reaffirmed several things:
If you inspect the HTTP response back from any service call made with Spring Cloud Sleuth, you’ll see that the trace ID used in the call is never returned in the HTTP response headers. If you inspect the documentation for Spring Cloud Sleuth, you’ll see that the Spring Cloud Sleuth team believes that returning any of the tracing data can be a potential security issue (though they don’t explicitly list their reasons why they believe this.)
However, I’ve found that the returning of a correlation or tracing ID in the HTTP response is invaluable when debugging a problem. Spring Cloud Sleuth does allow you to “decorate” the HTTP response information with its tracing and span IDs. However, the process to do this involves writing three classes and injecting two custom Spring beans. If you’d like to take this approach, you can see it in the Spring Cloud Sleuth documentation (http://cloud.spring.io/spring-cloud-static/spring-cloud-sleuth/1.0.12.RELEASE/). A much simpler solution is to write a Zuul “POST” filter that will inject the trace ID in the HTTP response.
In chapter 6 when we introduced the Zuul API gateway, we saw how to build a Zuul “POST” response filter to add the correlation ID you generated for use in your services to the HTTP response returned by the caller. You’re now going to modify that filter to add the Spring Cloud Sleuth header.
To set up your Zuul response filter, you need to add a single JAR dependencies to your Zuul server’s pom.xml file: spring-cloud-starter-sleuth. The spring-cloud-starter-sleuth dependency will be used to tell Spring Cloud Sleuth that you want Zuul to participate in a Spring Cloud trace. Later in the chapter, when we introduce Zipkin, you’ll see that the Zuul service will be the first call in any service invocation.
For chapter 9, this file can be found in zuulsvr/pom.xml. The following listing shows these dependencies.
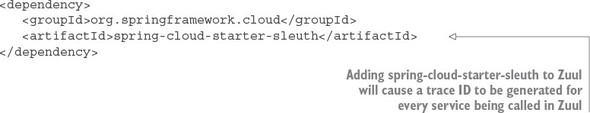
Once this new dependency is in place, the actual Zuul “post” filter is trivial to implement. The following listing shows the source code used to build the Zuul filter. The file is located in zuulsvr/src/main/java/com/thoughtmechanix/zuulsvr/filters/ResponseFilter.java.
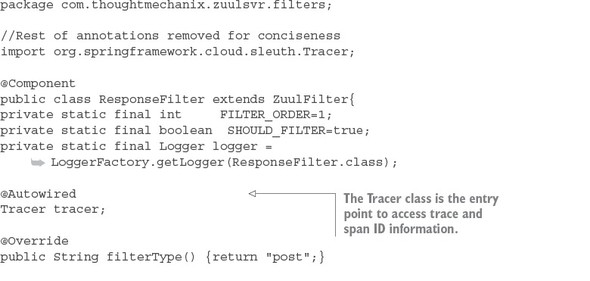
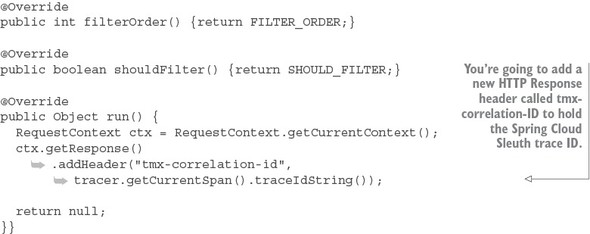
Because Zuul is now Spring Cloud Sleuth-enabled, you can access tracing information from within your ResponseFilter by autowiring in the Tracer class into the ResponseFilter. The Tracer class allows you to access information about the current Spring Cloud Sleuth trace being executed. The tracer.getCurrentSpan().traceIdString() method allows you to retrieve as a String the current trace ID for the transaction underway.
It’s trivial to add the trace ID to the outgoing HTTP response passing back through Zuul. This is done by calling
RequestContext ctx = RequestContext.getCurrentContext();
ctx.getResponse().addHeader("tmx-correlation-id",
       tracer.getCurrentSpan().traceIdString());
With this code now in place, if you invoke an EagleEye microservice through your Zuul gateway, you should get a HTTP response back called tmx-correlation-id. Figure 9.10 shows the results of a call to GET http://localhost:5555/api/licensing/v1/organizations/e254f8c-c442-4ebe-a82a-e2fc1d1ff78a/licenses/f3831f8c-c338-4ebe-a82a-e2fc1d1ff78a.
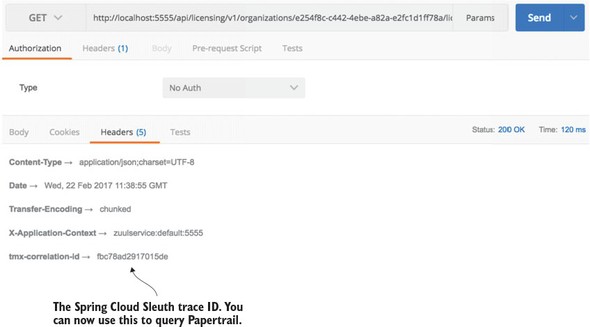
Figure 9.10 shows the results of a call to GET http://localhost:5555/api/licensing/v1/organizations/e254f8c-c442-4ebe-a82a-e2fc1d1ff78a/licenses/f3831f8c-c338-4ebe-a82a-e2fc1d1ff78a.
Having a unified logging platform with correlation IDs is a powerful debugging tool. However, for the rest of the chapter we’re going to move away from tracing log entries and instead look at how to visualize the flow of transactions as they move across different microservices. A clean, concise picture can be work more than a million log entries.
Distributed tracing involves providing a visual picture of how a transaction flows across your different microservices. Distributed tracing tools will also give a rough approximation of individual microservice response times. However, distributed tracing tools shouldn’t be confused with full-blown Application Performance Management (APM) packages. These packages can provide out-of-the-box, low-level performance data on the actual code within your service and can also provider performance data beyond response time, such as memory, CPU utilization, and I/O utilization.
This is where Spring Cloud Sleuth and the OpenZipkin (also referred to as Zipkin) project shine. Zipkin (http://zipkin.io/) is a distributed tracing platform that allows you to trace transactions across multiple service invocations. Zipkin allows you to graphically see the amount of time a transaction takes and breaks down the time spent in each microservice involved in the call. Zipkin is an invaluable tool for identifying performance issues in a microservices architecture.
Setting up Spring Cloud Sleuth and Zipkin involves four activities:
Up to now you’ve included two sets of Maven dependencies to your Zuul, licensing, and organization services. These JAR files were the spring-cloud-starter-sleuth and the spring-cloud-sleuth-core dependencies. The spring-cloud-starter-sleuth dependencies are used to include the basic Spring Cloud Sleuth libraries needed to enable Spring Cloud Sleuth within a service. The spring-cloud-sleuth-core dependencies are used whenever you have to programmatically interact with Spring Cloud Sleuth (which you’ll do again later in the chapter).
To integrate with Zipkin, you need to add a second Maven dependency called spring-cloud-sleuth-zipkin. The following listing shows the Maven entries that should be present in the Zuul, licensing, and organization services once the spring-cloud-sleuth-zipkin dependency is added.
<dependency>
   <groupId>org.springframework.cloud</groupId>
   <artifactId>spring-cloud-starter-sleuth</artifactId>
</dependency>
<dependency>
   <groupId>org.springframework.cloud</groupId>
   <artifactId>spring-cloud-sleuth-zipkin</artifactId>
</dependency>
With the JAR files in place, you need to configure each service that wants to communicate with Zipkin. You do this by setting a Spring property that defines the URL used to communicate with Zipkin. The property that needs to be set is the spring.zipkin.baseUrl property. This property is set in each service’s application.yml properties file.
The spring.zipkin.baseUrl can also be externalized as a property in Spring Cloud Config.
In the application.yml file for each service, the value is set to http://localhost:9411. However, at runtime I override this value using the ZIPKIN_URI (http://zipkin:9411) variable passed on each services Docker configuration (docker/common/docker-compose.yml) file.
Zipkin does have the ability to send its tracing data to a Zipkin server via RabbitMQ or Kafka. From a functionality perspective, there’s no difference in Zipkin behavior if you use HTTP, RabbitMQ, or Kafka. With the HTTP tracing, Zipkin uses an asynchronous thread to send performance data. The main advantage to using RabbitMQ or Kafka to collect your tracing data is that if your Zipkin server is down, any tracing messages sent to Zipkin will be “enqueued” until Zipkin can pick up the data.
The configuration of Spring Cloud Sleuth to send data to Zipkin via RabbitMQ and Kafka is covered in the Spring Cloud Sleuth documentation, so we won’t cover it here in any further detail.
To use Zipkin, you first need to set up a Spring Boot project the way you’ve done multiple times throughout the book. (In the code for the chapter, this is call zipkinsvr.) You then need to add two JAR dependencies to the zipkinsvr/pom.xml file. These two jar dependences are shown in the following listing.
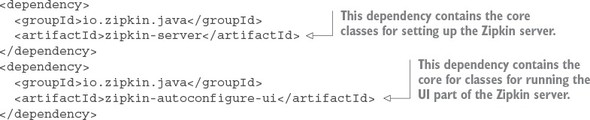
One thing to notice about the JAR dependencies above is that they’re not Spring-Cloud-based dependencies. While Zipkin is a Spring-Boot-based project, the @EnableZipkinServer is not a Spring Cloud annotation. It’s an annotation that’s part of the Zipkin project. This often confuses people who are new to the Spring Cloud Sleuth and Zipkin, because the Spring Cloud team did write the @EnableZipkinStreamServer annotation as part of Spring Cloud Sleuth. The @EnableZipkinStreamServer annotation simplifies the use of Zipkin with RabbitMQ and Kafka.
I chose to use the @EnableZipkinServer because of its simplicity in setup for this chapter. With the @EnableZipkinStream server you need to set up and configure the services being traced and the Zipkin server to publish/listen to RabbitMQ or Kafka for tracing data. The advantage of the @EnableZipkinStreamServer annotation is that you can continue to collect trace data even if the Zipkin server is unavailable. This is because the trace messages will accumulate the trace data on a message queue until the Zipkin server is available for processing the records. If you use the @EnableZipkinServer annotation and the Zipkin server is unavailable, the trace data that would have been sent by the service(s) to Zipkin will be lost.
After the Jar dependencies are defined, you now need to add the @EnableZipkin Server annotation to your Zipkin services bootstrap class. This class is located in -zipkinsvr/src/main/java/com/thoughtmechanix/zipkinsvr/ZipkinServer Application.java. The following listing shows the code for the bootstrap class.
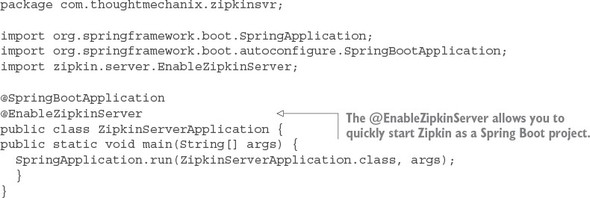
The key thing to note in this listing is the use of the @EnableZipkinServer annotation. This annotation enables you to start this Spring Boot service as a Zipkin server. At this point, you can build, compile, and start the Zipkin server as one of the Docker containers for the chapter.
Little configuration is needed to run a Zipkin server. One of the only things you’re going to have to configure when you run Zipkin is the back end data store that Zipkin will use to store the tracing data from your services. Zipkin supports four different back end data stores. These data stores are
By default, Zipkin uses an in-memory data store for storing tracing data. The Zipkin team recommends against using the in-memory database in a production system. The in-memory database can hold a limited amount of data and the data is lost when the Zipkin server is shut down or lost.
For the purposes of this book, you’ll use Zipkin with an in-memory data store. Configuring the individual data stores used in Zipkin is outside of the scope of this book, but if you’re interested in the topic, you can find more information at the Zipkin GitHub repository (https://github.com/openzipkin/zipkin/tree/master/zipkin-server).
At this point you have the clients configured to talk to a Zipkin server and you have the server configured and ready to be run. You need to do one more thing before you start using Zipkin. You need to define how often each service should write data to Zipkin.
By default, Zipkin will only write 10% of all transactions to the Zipkin server. The transaction sampling can be controlled by setting a Spring property on each of the services sending data to Zipkin. This property is called spring.sleuth.sampler.percentage. The property takes a value between 0 and 1:
For our purposes, you’re going to send trace information for all services. To do this, you can set the value of spring.sleuth.sampler.percentage or you can replace the default Sampler class used in Spring Cloud Sleuth with the AlwaysSampler. The AlwaysSampler can be injected as a Spring Bean into an application. For example, the licensing service has the AlwaysSampler defined as a Spring Bean in its licensing-service/src/main/java/com/thoughtmechanix/licenses/Application.java class as
@Bean
public Sampler defaultSampler() { return new AlwaysSampler();}
The Zuul, licensing, and organization services all have the AlwaysSampler defined in them so that in this chapter all transactions will be traced with Zipkin.
Let’s start this section with a scenario. Imagine you’re one of the developers on the EagleEye application and you’re on-call this week. You get a support ticket from a customer who’s complaining that one of the screens in the EagleEye application is running slow. You have a suspicion that the licensing service being used by the screen is running slow. But why and where? The licensing service relies on the organization service and both services make calls to different databases. Which service is the poor performer? Also, you know that these services are constantly being modified, so someone might have added a new service call into the mix. Understanding all the services that participate in the user’s transaction and their individual performance times is critical to supporting a distributed architecture such as a microservice architecture.
You’ll begin by using Zipkin to watch two transactions from your organization service as they’re traced by the Zipkin service. The organization service is a simple service that only makes a call to a single database. What you’re going to do is use POSTMAN to send two calls to the organization service (GET http://localhost:5555/api/organization/v1/organizations/e254f8c-c442-4ebe-a82a-e2fc1d1ff78a). The organization service calls will flow through a Zuul API gateway before the calls get directed downstream to an organization service instance.
After you’ve made two calls to the organization service, go to http://localhost:9411 and see what Zipkin has captured for trace results. Select the “organization service” from the dropdown box on the far upper left of the screen and then press the Find traces button. Figure 9.11 shows the Zipkin query screen after you’ve taken these actions.
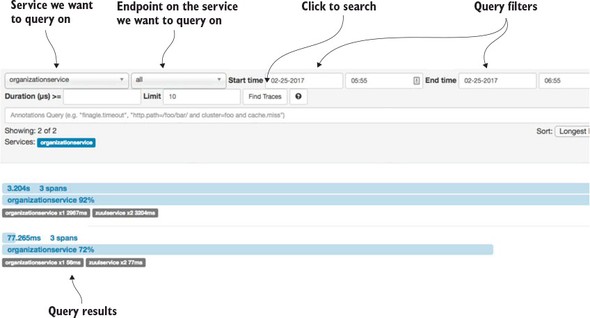
Now if you look at the screenshot in figure 9.11, you’ll see that Zipkin captured two transactions. Each of the transactions is broken down into one or more spans. In Zipkin, a span represents a specific service or call in which timing information is being captured. Each of the transactions in figure 9.11 has three spans captured in it: two spans in the Zuul gateway, and then a span for the organization service. Remember, the Zuul gateway doesn’t blindly forward an HTTP call. It receives the incoming HTTP call, terminates the incoming call, and then builds a new call out to the targeted service (in this case, the organization service). This termination of the original call is how Zuul can add pre-, response, and post filters to each call entering the gateway. It’s also why we see two spans in the Zuul service.
The two calls to the organization service through Zuul took 3.204 seconds and 77.2365 milliseconds respectively. Because you queried on the organization service calls (and not the Zuul gateway calls), you can see that the organization service took 92% and 72% of the total amount of time of the transaction time.
Let’s dig into the details of the longest running call (3.204 seconds). You can see more detail by clicking on the transaction and drilling into the details. Figure 9.12 shows the details after you’ve clicked to drill down into further details.
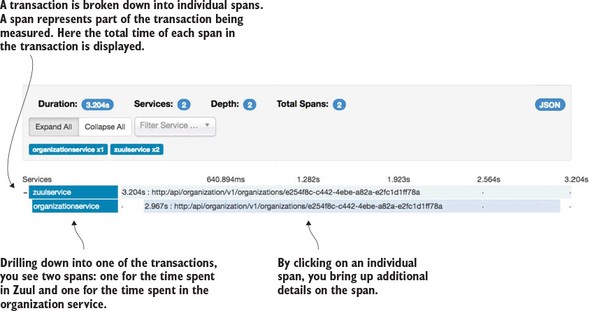
In figure 9.12 you can see that the entire transaction from a Zuul perspective took approximately 3.204 seconds. However, the organization service call made by Zuul took 2.967 seconds of the 3.204 seconds involved in the overall call. Each span presented can be drilled down into for even more detail. Click on the organizationservice span and see what additional details can be seen from the call. Figure 9.13 shows the detail of this call.
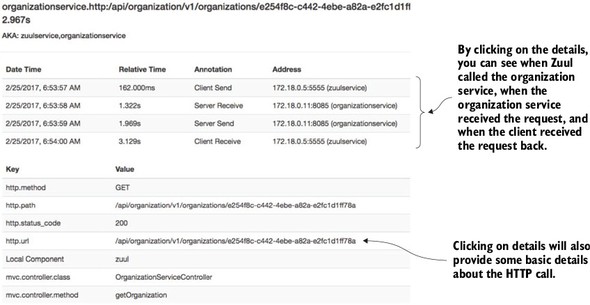
One of the most valuable pieces of information in figure 9.13 is the breakdown of when the client (Zuul) called the organization service, when the organization service received the call, and when the organization service responded back. This type of timing information is invaluable in detecting and identifying network latency issues.
What if you want to understand exactly what service dependencies exist between service calls? You can call the licensing service through Zuul and then query Zipkin for licensing service traces. You can do this with a GET call to the licensing services http://localhost:5555/api/licensing/v1/organizations/e254f8c-c442-4ebe-a82a-e2fc1d1ff78a/licenses/f3831f8c-c338-4ebe-a82a-e2fc1d1ff78a endpoint.
Figure 9.14 shows the detailed trace of the call to the licensing service.
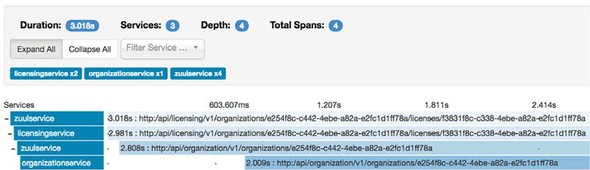
In figure 9.14, you can see that the call to the licensing service involves 4 discrete HTTP calls. You see the call to the Zuul gateway and then from the Zuul gateway to the licensing service. The licensing service then calls back through Zuul to call the organization service.
Spring Cloud Sleuth and Zipkin don’t trace HTTP calls. Spring Cloud Sleuth also sends Zipkin trace data on any inbound or outbound message channel registered in the service.
Messaging can introduce its own performance and latency issues inside of an application. A service might not be processing a message from a queue quickly enough. Or there could be a network latency problem. I’ve encountered all these scenarios while building microservice-based applications.
By using Spring Cloud Sleuth and Zipkin, you can identify when a message is published from a queue and when it’s received. You can also see what behavior takes place when the message is received on a queue and processed.
As you’ll remember from chapter 8, whenever an organization record is added, updated, or deleted, a Kafka message is produced and published via Spring Cloud Stream. The licensing service receives the message and updates a Redis key-value store it’s using to cache data.
Now you’ll go ahead and delete an organization record and watch the transaction be traced by Spring Cloud Sleuth and Zipkin. You can issue a DELETE http://local-host:5555/api/organization/v1/organizations/e254f8c-c442-4ebe-a82a-e2fc1d1ff78a via POSTMAN to the organization service.
Remember, earlier in the chapter we saw how to add the trace ID as an HTTP response header. You added a new HTTP response header called tmx-correlation-id. In my call, I had the tmx-correlation-id returned on my call with a value of 5e14cae0d90dc8d4. You can search Zipkin for this specific trace ID by entering the trace ID returned by your call via the search box in the upper-right hand corner of the Zipkin query screen. Figure 9.15 shows where you can enter the trace ID.
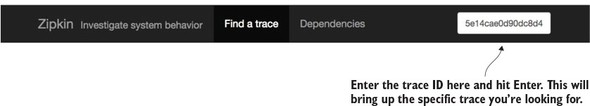
With the trace ID in hand you can query Zipkin for the specific transaction and can see the publication of a delete message to your output message change. This message channel, output, is used to publish to a Kafka topic call orgChangeTopic. Figure 9.16 shows the output message channel and how it appears in the Zipkin trace.
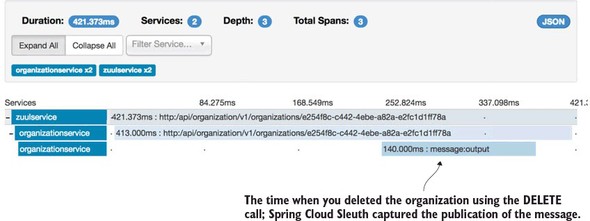
You can see the licensing service receive the message by querying Zipkin and looking for the received message. Unfortunately, Spring Cloud Sleuth doesn’t propagate the trace ID of a published message to the consumer(s) of that message. Instead, it generates a new trace ID. However, you can query Zipkin server for any license service transactions and order them by newest message. Figure 9.17 shows the results of this query.
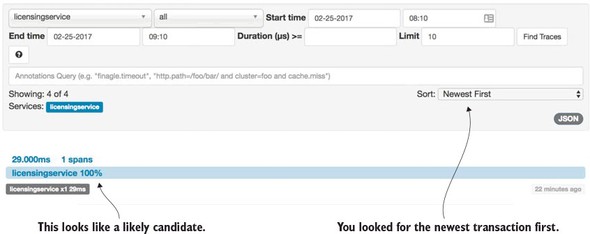
Now that you’ve found your target licensing service transaction, you can drill down into the transaction. Figure 9.18 shows the results of this drilldown.
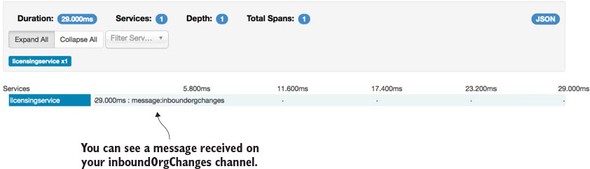
Until now you’ve used Zipkin to trace your HTTP and messaging calls from within your services. However, what if you want to perform traces out to third-party services that aren’t instrumented by Zipkin? For example, what if you want to get tracing and timing information for a specific Redis or Postgres SQL call? Fortunately, Spring Cloud Sleuth and Zipkin allow you to add custom spans to your transaction so that you can trace the execution time associated with these third-party calls.
Adding a custom span is incredibly easy to do in Zipkin. You can start by adding a custom span to your licensing service so that you can trace how long it takes to pull data out of Redis. Then you’re going to add a custom span to the organization service to see how long it takes to retrieve data from your organization database.
To add a custom span to the licensing service’s call to Redis, you’re going to instrument the licensing-service/src/main/java/com/thoughtmechanix/licenses/clients/OrganizationRestTemplateClient.java class. In this class you’re going to instrument the checkRedisCache() method. The following listing shows this code.
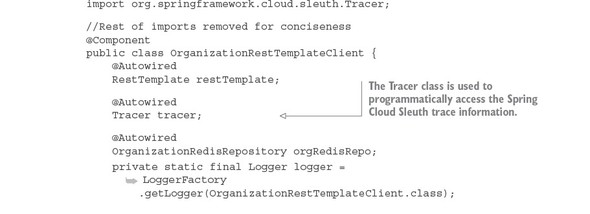
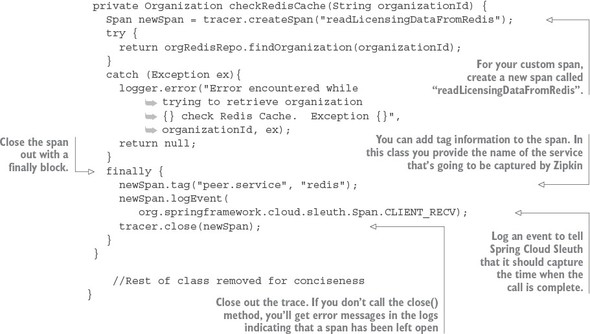
The code in listing 9.6 creates a custom span called readLicensingDataFrom-Redis. Now you’ll also add a custom span, called getOrgDbCall, to the organization service to monitor how long it takes to retrieve organization data from the Postgres database. The trace for organization service database calls can be seen in the organization-service/src/main/java/com/thoughtmechanix/organization/services/OrganizationService.java class. The method containing the custom trace is the getOrg() method call.
The following listing shows the source code from the organization service’s getOrg() method.
package com.thoughtmechanix.organization.services;

//Removed the imports for conciseness
@Service
public class OrganizationService {
  @Autowired
  private OrganizationRepository orgRepository;

  @Autowired
  private Tracer tracer;
  @Autowired
  SimpleSourceBean simpleSourceBean;

  private static final Logger logger =
      LoggerFactory.getLogger(OrganizationService.class);

  public Organization getOrg (String organizationId) {
 Span newSpan = tracer.createSpan("getOrgDBCall");

 logger.debug("In the organizationService.getOrg() call");
 try {
   return orgRepository.findById(organizationId);
 }finally{
   newSpan.tag("peer.service", "postgres");
   newSpan
      .logEvent(
         org.springframework.cloud.sleuth.Span.CLIENT_RECV);
   tracer.close(newSpan);
 }
}

    //Removed the code for conciseness
}
With these two custom spans in place, restart the services and then hit the GET http://localhost:5555/api/licensing/v1/organizations/e254f8c-c442 4ebe-a82a-e2fc1d1ff78a/licenses/f3831f8c-c338-4ebe-a82a-e2fc1d1ff78a endpoint. If we you look at the transaction in Zipkin, you should see the addition of the two additional spans. Figure 9.19 shows the additional custom spans added when you call the licensing service endpoint to retrieve licensing information.
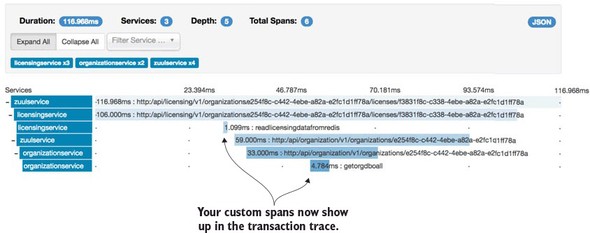
From figure 9.19 you can now see additional tracing and timing information related to your Redis and database lookups. You can break out that the read call to Redis took 1.099 milliseconds. Since the call didn’t find an item in the Redis cache, the SQL call to the Postgres database took 4.784 milliseconds.
We’re at the end of the book, but not the end of our microservices journey. While most of this book has focused on designing, building, and operationalizing Spring-based microservices using the Spring Cloud technology, we haven’t yet touched on how to build and deploy microservices. Creating a build and deployment pipeline might seem like a mundane task, but in reality it’s one of the most important pieces of your microservices architecture.
Why? Remember, one of the key advantages of a microservices architecture is that microservices are small units of code that can be quickly built, modified, and deployed to production independently of one another. The small size of the service means that new features (and critical bug fixes) can be delivered with a high degree of velocity. Velocity is the key word here because velocity implies that little to no friction exists between making a new feature or fixing a bug and getting your service deployed. Lead times for deployment should be minutes, not days.
To accomplish this, the mechanism that you use to build and deploy your code needs to be
Building a robust and generalized build deployment pipeline is a significant amount of work and is often specifically designed toward the runtime environment your services are going to run. It often involves a specialized team of DevOps (developer operations) engineers whose sole job is to generalize the build process so that each team can build their microservices without having to reinvent the entire build process for themselves. Unfortunately, Spring is a development framework and doesn’t offer a significant amount of capabilities for implementing a build and deployment pipeline.
For this chapter, we’re going to see how to implement a build and deployment pipeline using a number of non-Spring tools. You’re going to take the suite of microservices you’ve been building for this book and do the following:
I want to start our discussion with the end goal in mind: a deployed set of services to AWS Elastic Container Service (ECS). Before we get into all the details of how you’re going to implement a build/deployment pipeline, let’s walk through how the EagleEye services are going to look running in Amazon’s cloud. Then we’ll discuss how to manually deploy the EagleEye services to the AWS cloud. Once that’s done, we will automate the entire process.
Throughout all the code examples in this book, you’ve run all of your applications inside a single virtual machine image with each individual service running as a Docker container. You’re going to change that now by separating your database server (PostgreSQL) and caching server (Redis) away from Docker into Amazon’s cloud. All the other services will remain running as Docker containers running inside a single-node Amazon ECS cluster. Figure 10.1 shows the deployment of the EagleEye services to the Amazon cloud.
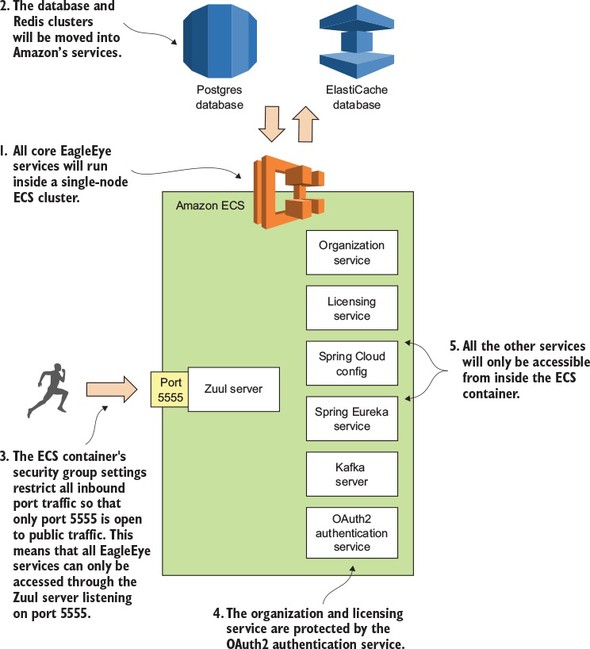
Let’s walk through figure 10.1 and dive into more detail:
To set up your Amazon infrastructure, you’re going to need the following:
If you don’t have any experience with using Amazon’s Web Services, I’d set up an AWS account and install the tools in the list. I’d also spend time familiarizing yourself with the platform.
If you’re completely new to AWS, I highly recommend you pick up a copy of Michael and Andreas Wittig’s book Amazon Web Services in Action (Manning, 2015). The first chapter of the book (https://www.manning.com/books/amazon-web-services-in-action#downloads) is available for download and includes a well-written tutorial at the end of the chapter on how to sign up and configure your AWS account. Amazon Web Services in Action is a well-written and comprehensive book on AWS. Even though I’ve been working with the AWS environment for years, I still find it a useful resource.
Finally, in this chapter I’ve tried as much as possible to use the free-tier services offered by Amazon. The only place where I couldn’t do this is when setting up the ECS cluster. I used a t2.large server that costs approximately .10 cents per hour to run. Make sure that you shut down your services after you’re done if you don’t want to incur significant costs.
There’s no guarantee that the Amazon resources (Postgres, Redis, and ECS) that I’m using in this chapter will be available if you want to run this code yourself. If you’re going to run the code from this chapter, you need to set up your own GitHub repository (for your application configuration), your own Travis CI account, Docker Hub (for your Docker images), and Amazon account, and then modify your application configuration to point to your account and credentials.
Before we begin this section, you need to set up and configure your Amazon AWS account. Once this is done, your first task is to create the PostgreSQL database that you’re going to use for your EagleEye services. To do this you’re going to log in into the Amazon AWS console (https://aws.amazon.com/console/) and do the following:
The first thing the Amazon database creation wizard will ask you is whether this is a production database or a dev/test database. You’re going to create a dev/test database using the free tier. Figure 10.2 shows this screen.
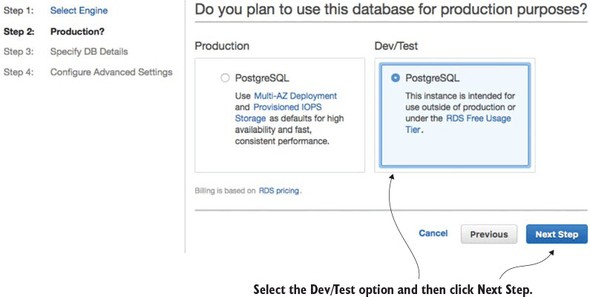
Next, you’re going to set up basic information about your PostgreSQL database and also set the master user ID and password you’re going to use to log into the database. Figure 10.3 shows this screen.
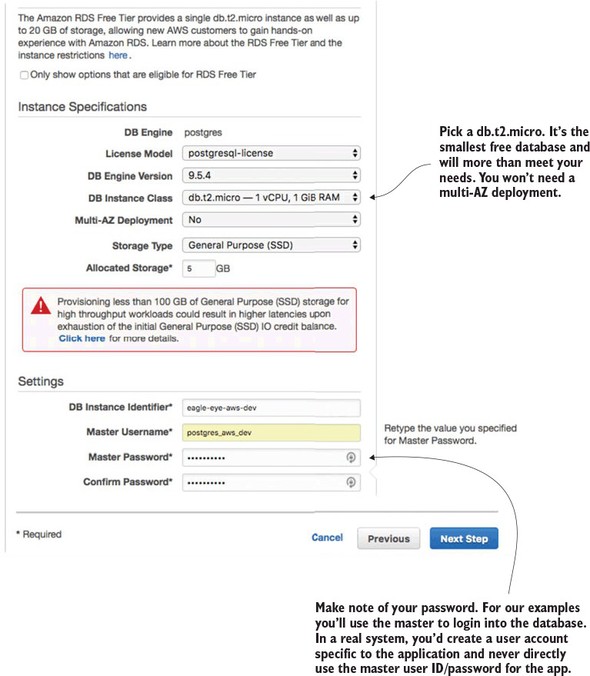
The last and final step of the wizard is to set up the database security groups, port information, and database backup information. Figure 10.4 shows the contents of this screen.
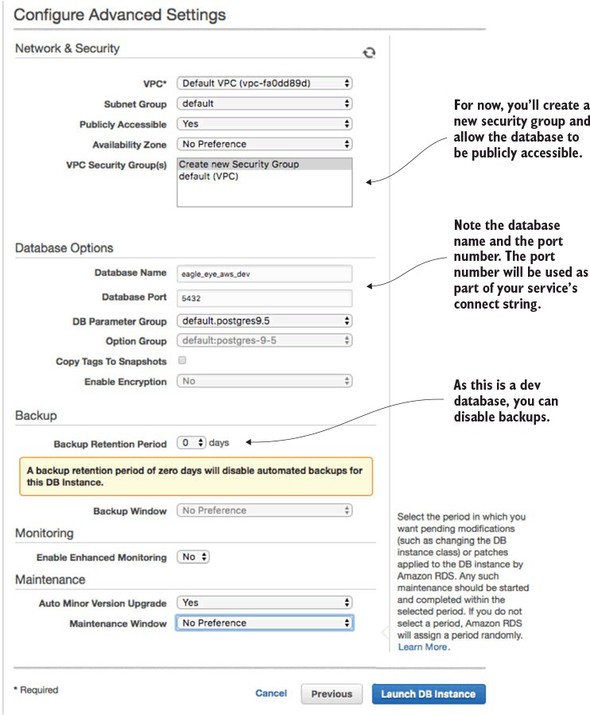
At this point, your database creation process will begin (it can take several minutes). Once it’s done, you’ll need to configure the Eagle Eye services to use the database. After the database is created (this will take several minutes), you’ll navigate back to the RDS dashboard and see your database created. Figure 10.5 shows this screen.
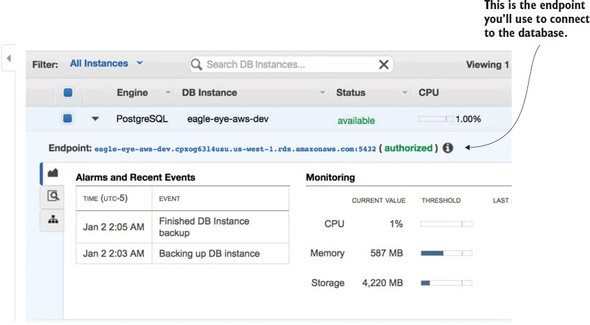
For this chapter, I created a new application profile called aws-dev for each microservice that needs to access the Amazon-base PostgreSQL database. I added a new Spring Cloud Config server application profile in the Spring Cloud Config GitHub repository (https://github.com/carnellj/config-repo) containing the Amazon database connection information. The property files follow the naming convention (service-name)-aws-dev.yml in each of the property files using the new database (licensing service, organization service, and authentication service).
At this point your database is ready to go (not bad for setting it up in approximately five clicks). Let’s move to the next piece of application infrastructure and see how to create the Redis cluster that your EagleEye licensing service is going to use.
To set up the Redis cluster, you’re going to use the Amazon ElastiCache service. Amazon ElastiCache allows you to build in-memory data caches using Redis or Memcached (https://memcached.org/). For the EagleEye services, you’re going to move the Redis server you were running in Docker to ElastiCache.
To begin, navigate back to the AWS Console’s main page (click the orange cube on the upper left-hand side of the page) and click the ElastiCache link.
From the ElastiCache console, select the Redis link (left-hand side of the screen), and then hit the blue Create button at the top of the screen. This will bring up the ElastiCache/Redis creation wizard.
Figure 10.6 shows the Redis creation screen.
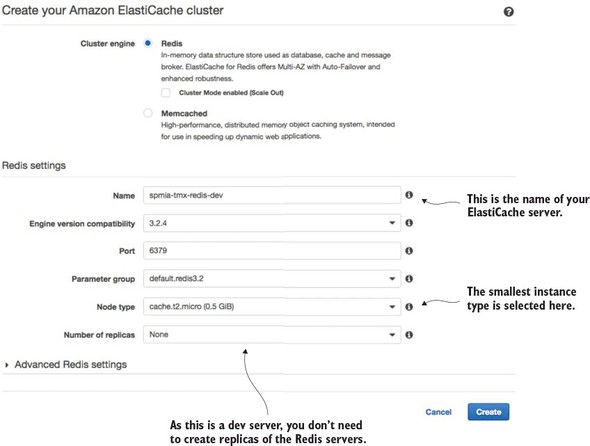
Go ahead and hit the create button once you’ve filled in all your data. Amazon will begin the Redis cluster creation process (this will take several minutes). Amazon will build a single-node Redis server running on the smallest Amazon server instance available. Once you hit the button you’ll see your Redis cluster being created. Once the cluster is created, you can click on the name of the cluster and it will bring you to a detailed screen showing the endpoint used in the cluster. Figure 10.7 shows the details of the Redis clustered after it has been created.
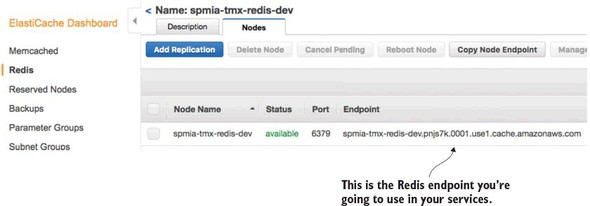
The licensing service is the only one of your services to use Redis, so make sure that if you deploy the code examples in this chapter to your own Amazon instance, you modify the licensing service’s Spring Cloud Config files appropriately.
The last and final step before you deploy the EagleEye services is to set up an Amazon ECS cluster. Setting up an Amazon ECS cluster provisions the Amazon machines that are going to host your Docker containers. To do this you’re going to again go to the Amazon AWS console. From there you’re going to click on the Amazon EC2 Container Service link.
This brings you to the main EC2 Container service page, where you should see a “Getting Started” button.
Click on the “Start” button. This will bring you to the “Select options to Configure” screen shown in figure 10.8.
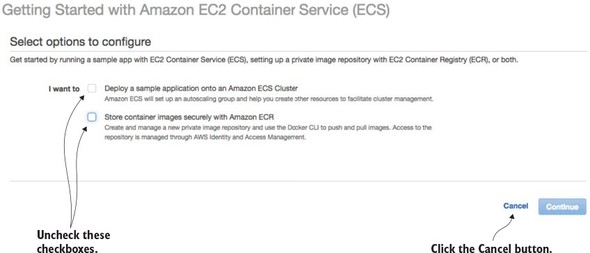
Uncheck the two checkboxes on the screen and click the cancel button. ECS offers a wizard for setting up an ECS container based on a set of predefined templates. You’re not going to use this wizard. Once you cancel out of the ECS set-up wizard, you should see the “Clusters” tab on the ECS home page. Figure 10.9 shows this screen. Hit the “Create Cluster” button to begin the process of creating an ECS cluster.
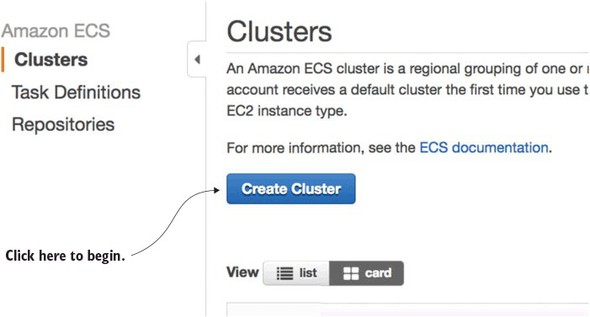
Now you’ll see a screen called “Create Cluster” that has three major sections. The first section is going to define the basic cluster information. Here you’re going to enter the
Figure 10.10 shows the screen as I populated it for the test examples in this book.
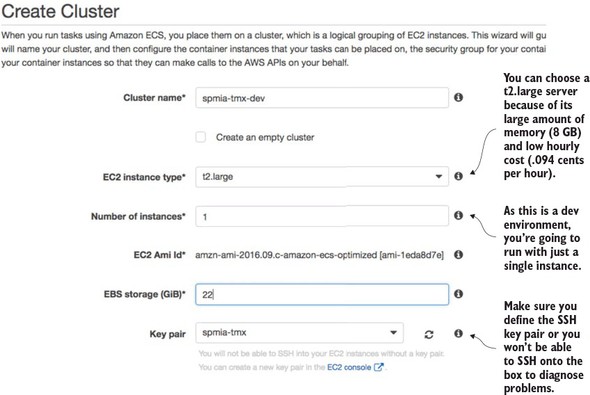
One of the first tasks you do when you set up an Amazon account is define a key pair for SSHing into any EC2 servers you start. We’re not going to cover setting up a key pair in this chapter, but if you’ve never done this before, I recommend you look at Amazon’s directions regarding this (http://docs.aws.amazon.com/AWSEC2/latest/UserGuide/ec2-key-pairs.html).
Next, you’re going to set up the network configuration for the ECS cluster. Figure 10.11 shows the networking screen and the values you’re configuring.
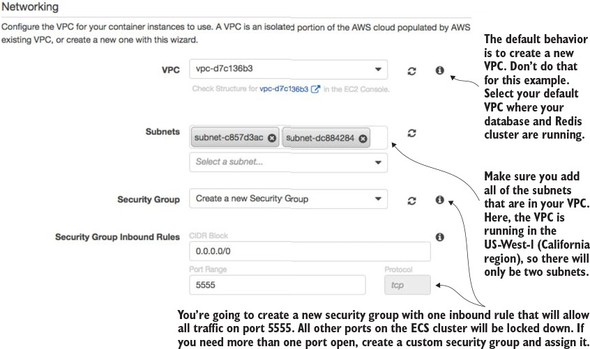
The first thing to note is selecting the Amazon Virtual Private Cloud (VPC) that the ECS cluster will run. By default, the ECS set-up wizard will offer to set up a new VPC. I’ve selected to run the ECS cluster in my default VPC. The default VPC houses the database server and Redis cluster. In Amazon’s cloud, an Amazon-managed Redis server can only be accessed by servers that are in the same VPC as the Redis server.
Next, you have to select the subnets in the VPC that you want to give access to the ECS cluster. Because each subnet corresponds to an Amazon availability zone, I usually select all subnets in the VPC to make the cluster available.
Finally, you have to select to create a new security group or select an existing Amazon security group that you’ve created to apply to the new ECS cluster. Because you’re running Zuul, you want all traffic to flow through a single port, port 5555. You’re going to configure the new security group being created by the ECS wizard to allow all in-bound traffic from the world (0.0.0.0/0 is the network mask for the entire internet).
The last step that has to be filled out in the form is the creation of an Amazon IAM Role for the ECS container agent that runs on the server. The ECS agent is responsible for communicating with Amazon about the status of the containers running on the server. You’re going to allow the ECS wizard to create a IAM role, called ecsInstanceRole, for you. Figure 10.12 shows this configuration step.
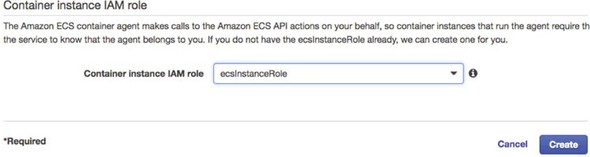
At this point you should see a screen tracking the status of the cluster creation. Once the cluster is created, you should see a blue button on the screen called “View Cluster.” Click on the “View Cluster” button. Figure 10.13 shows the screen that will appear after the “View Cluster” button has been pressed.
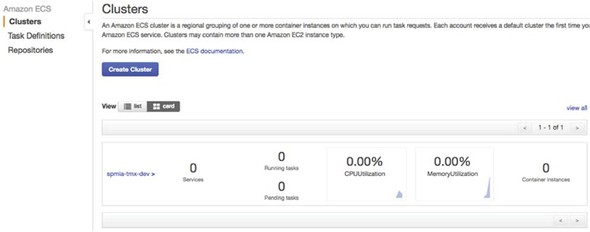
At this point, you have all the infrastructure you need to successfully deploy the EagleEye microservices.
Right now, you’re doing everything via the Amazon AWS console. In a real environment, you’d have scripted the creation of all this infrastructure using Amazon’s CloudFormation scripting DSL (domain specific language) or a cloud infrastructure scripting tool like HashiCorp’s Terraform (https://www.terraform.io/). However, that’s an entire topic to itself and far outside the scope of this book. If you’re using Amazon’s cloud, you’re probably already familiar with CloudFormation. If you’re new to Amazon’s cloud, I recommend you take the time to learn it before you get too far down the road of setting up core infrastructure via the Amazon AWS Console.
Again, I want to point the reader back to Amazon Web Services in Action (Manning, 2015) by Michael and Andreas Wittig. They walk through the majority of Amazon Web Services and demonstrate how to use CloudFormation (with examples) to automate the creation of your infrastructure.
At this point you have the infrastructure set up and can now move into the second half of the chapter. In this second part, you’re going to deploy the EagleEye services to your Amazon ECS container. You’re going to do this in two parts. The first part of your work is for the terminally impatient (like me) and will show how to deploy EagleEye manually to your Amazon instance. This will help you understand the mechanics of deploying the service and see the deployed services running in your container. While getting your hands dirty and manually deploying your services is fun, it isn’t sustainable or recommended.
This is where the second part of this section comes into play. You’re going to automate the entire build and deployment process and take the human being out of the picture. This is your targeted end state and really caps the work you’ve been doing in the book by demonstrating how to design, build, and deploy microservices to the cloud.
To manually deploy your EagleEye services, you’re going to switch gears and move away from the Amazon AWS console. To deploy the EagleEye services, you’re going to use the Amazon ECS command-line client (https://github.com/aws/amazon-ecs-cli). After you’ve installed the ECS command-line client, you need to configure the ecs-cli run-time environment to
ecs-cli configure --region us-west-1 \
                  --access-key $AWS_ACCESS_KEY \
                  --secret-key $AWS_SECRET_KEY \
                  --cluster spmia-tmx-dev
The ecs-cli configure command will set the region where your cluster is located, your Amazon access and secret key, and the name of the cluster (spmia-tmx-dev) you’ve deployed to. If you look at the previous command, I’m using environment variables ($AWS_ACCESS_KEY and $AWS_SECRET_KEY) to hold my Amazon access and secret key.
I selected the us-west-1 region for purely demonstrative purposes. Depending on the country you’re located in, you might choose an Amazon region more specific to your part of the world.
Next, let’s see how to do a build. Unlike in other chapters, you have to set the build name because the Maven scripts in this chapter are going to be used in the build-deploy pipeline being set up later on in the chapter. You’re going to set an environment variable called $BUILD_NAME. The $BUILD_NAME environment variable is used to tag the Docker image that’s created by the build script. Change to the root directory of the chapter 10 code you downloaded from GitHub and issue the following two commands:
export BUILD_NAME=TestManualBuild
mvn clean package docker:build
This will execute a Maven build using a parent POM located at the root of the project directory. The parent pom.xml is set up to build all the services you’ll deploy in this chapter. Once the Maven code is done executing, you can deploy the Docker images to the ECS instance you set up earlier in the section 10.1.3. To do the deployment, issue the following command:
ecs-cli compose --file docker/common/docker-compose.yml up
The ECS command line client allows you to deploy containers using a Docker-compose file. By allowing you to reuse your Docker-compose file from your desktop development environment, Amazon has significantly simplified the deployment of your services to Amazon ECS. After the ECS client has run, you can validate that the services are running and discover the IP address of the servers by issuing the following command:
ecs-cli ps
Figure 10.14 shows the output from the ecs-cli ps command.
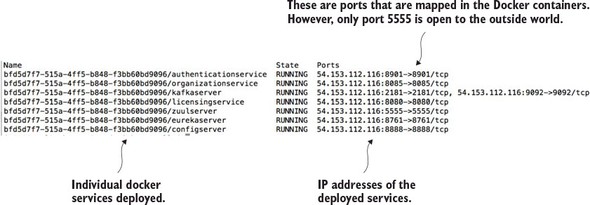
Note three things from the output in figure 10.14:
At this point you’ve successfully deployed your first set of services to an Amazon ECS client. Now, let’s build on this by looking at how to design a build and deployment pipeline that can automate the process of compiling, packaging, and deploying your services to Amazon.
ECS has limited tools to debug why a container doesn’t start. If you have problems with an ECS deployed service starting or staying up, you’ll need to SSH onto the ECS cluster to look at the Docker logs. To do this you need to add port 22 to the security group that the ECS cluster runs with, and then SSH onto the box using the Amazon key pair you defined at the time the cluster was set (see figure 10.9) as the ec2-user. Once you’re on the server, you can get a list of all the Docker containers running on the server by running the docker ps command. Once you’ve located the container image that you want to debug, you can run a docker logs –f <<container id>> command to tail the logs of the targeted Docker container.
This is a primitive mechanism for debugging an application, but sometimes you only need to log on to a server and see the actual console output to determine what’s going on.
The goal of this chapter is to provide you with the working pieces of a build/deployment pipeline so that you can take these pieces and tailor them to your specific environment.
Let’s start our discussion by looking at the general architecture of your build deployment pipeline and several of the general patterns and themes that it represents. To keep the examples flowing, I’ve done a few things that I wouldn’t normally do in my own environment and I’ll call those pieces out accordingly.
Our discussion on deploying microservices is going to begin with a picture you saw way back in chapter 1. Figure 10.15 is a duplicate of the diagram we saw in chapter 1 and shows the pieces and steps involved in building a microservices build and deployment pipeline.
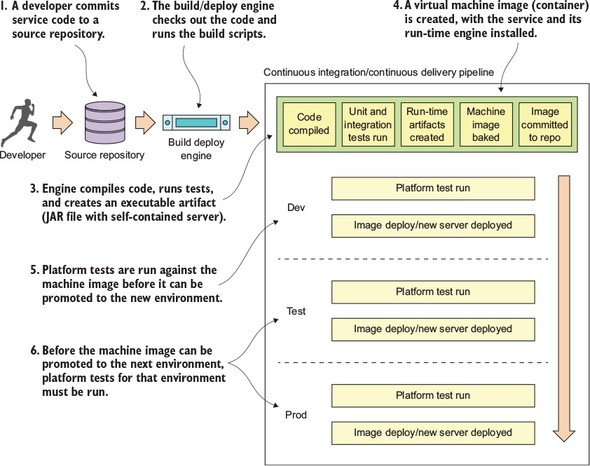
Figure 10.15 should look somewhat familiar, because it’s based on the general build-deploy pattern used for implementing Continuous Integration (CI):
With the build and deployment pipeline (shown in figure 10.15), a similar process is followed up until the code is ready to be deployed. In the build and deployment shown in figure 10.15, you’re going to tack Continuous Delivery (CD) onto the process:
You’ll see from figure 10.15 that I do several types of testing (unit, integration, and platform) during the build and deployment of a service. Three types of testing are typical in a build and deployment pipeline:
Unit tests—Unit tests are run immediately before the compiliation of the service code, but before it’s deployed to an environment. They’re designed to run in complete isolation, with each unit test being small and narrow in focus. A unit test should have no dependencies on third-party infrastructure databases, services, and so on. Usually a unit test scope will encompass the testing of a single method or function.
Integration tests—Integration tests are run immediately after packaging the service code. These tests are designed to test an entire workflow and stub or mock out major services or components that would need to be called off box. During an integration test, you might be running an in-memory database to hold data, mocking out third-party service calls, and so on. Integration tests test an entire workflow or code path. For integration tests, third-party dependencies are mocked or stubbed so that any calls that would invoke a remote service are mocked or stubbed so that calls never leave the build server.
Platform tests—Platform tests are run right before a service is deployed to an environment. These tests typically test an entire business flow and also call all the third-party dependencies that would normally be called in a production system. Platform tests are running live in a particular environment and don’t involve any mocked-out services. Platform tests are run to determine integration problems with third-party services that would normally not be detected when a third-party service is stubbed out during an integration test.
This build/deploy process is built on four core patterns. These patterns aren’t my creation but have emerged from the collective experience of development teams building microservice and cloud-based applications. These patterns include
With the concept of immutable servers, we should always be guaranteed that a server’s configuration matches exactly with what the machine image for the server says it does. A server should have the option to be killed and restarted from the machine image without any changes in the service or microservices behavior. This killing and resurrection of a new server was termed “Phoenix Server” by Martin Fowler (http://martinfowler.com/bliki/PhoenixServer.html) because when the old server is killed, the new server should rise from the ashes. The Phoenix server pattern has two key benefits.
First, it exposes and drives configuration drift out of your environment. If you’re constantly tearing down and setting up new servers, you’re more likely to expose configuration drift early. This is a tremendous help in ensuring consistency. I’ve has spent way too much of my time and life away from my family on “critical situation” calls because of configuration drift.
Second, the Phoenix server pattern helps to improve resiliency by helping find situations where a server or service isn’t cleanly recoverable after it has been killed and restarted. Remember, in a microservice architecture your services should be stateless and the death of a server should be a minor blip. Randomly killing and restarting servers quickly exposes situations where you have state in your services or infrastructure. It’s better to find these situations and dependencies early in your deployment pipeline, rather than when you’re on the phone with an angry company.
The organization where I work uses Netflix’s Chaos Monkey (https://github.com/-Netflix/SimianArmy/wiki/Chaos-Monkey) to randomly select and kill servers. Chaos Monkey is an invaluable tool for testing the immutability and recoverability of your microservice environment. Chaos Monkey randomly selects server instances in your environment and kills them. The idea with using Chaos Monkey is that you’re looking for services that can’t recover from the loss of a server, and when a new server is started, it will behave in the same fashion as the server that was killed.
From the general architecture laid out in section 10.3, you can see that there are many moving pieces behind a build/deployment pipeline. Because the purpose of this book is to show you things “in action,” we’re going to walk through the specifics of implementing a build/deployment pipeline for the EagleEye services. Figure 10.16 lays out the different technologies you’re going to use to implement your pipeline:
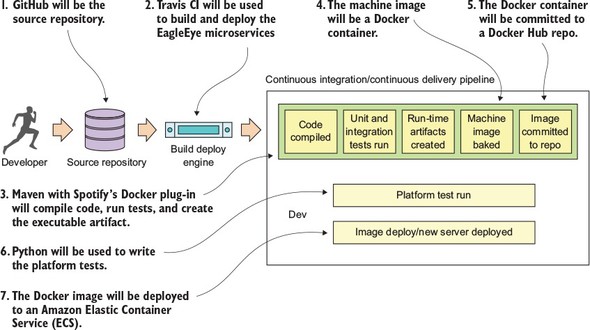
You might find it a little odd that I wrote the platform tests in Python rather than Java. I did this purposefully. Python (like Groovy) is a fantastic scripting language for writing REST-based test cases. I believe in using the right tool for the job. One of the biggest mind shifts I’ve seen for organizations adopting microservices is that the responsibility for picking the language should lie with the development teams. In too many organizations, I’ve seen a dogmatic embrace of standards (“our enterprise standard is Java . . . and all code must be written in Java”). As a result, I’ve seen development teams jump through hoops to write large amounts of Java code when a 10-line Groovy or Python script would do the job.
The second reason I chose Python is that unlike unit and integration tests, platform tests are truly “black box” tests where you’re acting like an actual API consumer running in a real environment. Unit tests exercise the lowest level of code and shouldn’t have any external dependencies when they run. Integration tests come up a level and test the API, but key external dependencies, like calls to other services, database calls, and so on, are mocked or stubbed out. Platform tests should be truly independent tests of the underlying infrastructure.
Dozens of source control engines and build deploy engines (both on-premise and cloud-based) can implement your build and deploy pipeline. For the examples in this book, I purposely chose GitHub as the source control repository and Travis CI as the build engine. The Git source control repository is an extremely popular repository and GitHub is one of the largest cloud-based source control repositories available today.
Travis CI is a build engine that integrates tightly with GitHub (it also supports Subversion and Mercurial). It’s extremely easy to use and is completely driven off a single configuration file (.travis.yml) in your project’s root directory. Its simplicity and opinionated nature make it easy to get a simple build pipeline off the ground
Up to now, all of the code examples in this book could be run solely from your desktop (with the exception of connectivity out to GitHub). For this chapter, if you want to completely follow the code examples, you’ll need to set up your own GitHub, Travis CI, and Docker hub accounts. We’re not going to walk through how to set up these accounts, but the setup of a personal Travis CI account and your GitHub account can all be done right from the Travis CI web page (http://travis-ci.org).
For the purposes of this book (and my sanity), I set up a separate GitHub repository for each chapter in the book. All the source code for the chapter can be built and deployed as a single unit. However, outside this book, I highly recommend that you set up each microservice in your environment with its own repository with its own independent build processes. This way each service can be deployed independently of one another. With the build process, I’m deploying all of the services as a single unit only because I wanted to push the entire environment to the Amazon cloud with a single build script and not manage build scripts for each individual service.
At the heart of every service built in this book has been a Maven pom.xml file that’s used to build the Spring Boot service, package it into an executable JAR, and then build a Docker image that can be used to launch the service. Up until this chapter, the compilation and startup of the services occurred by
The question is, how do you repeat this process in Travis CI? It all begins with a single file called .travis.yml. The .travis.yml is a YAML-based file that describes the actions you want taken when Travis CI executes your build. This file is stored in the root directory of your microservice’s GitHub repository. For chapter 10, this file can be found in spmia-chapter10-code/. travis.yml.
When a commit occurs on a GitHub repository Travis CI is monitoring, it will look for the .travis.yml file and then initiate the build process. Figure 10.17 shows the steps your .travis.yml file will undertake when a commit is made to the GitHub repository used to hold the code for this chapter (https://github.com/carnellj/spmia-chapter10).
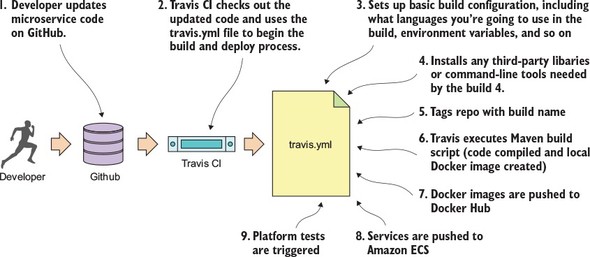
Now that we’ve walked through the general steps involved in the .travis.yml file, let’s look at the specifics of your .travis.yml file. Listing 10.1 shows the different pieces of the .travis.yml file.
The code annotations in listing 10.1 are lined up with the numbers in figure 10.17.
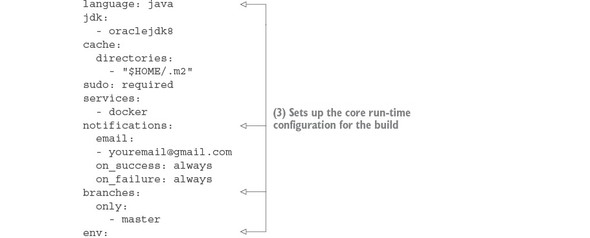
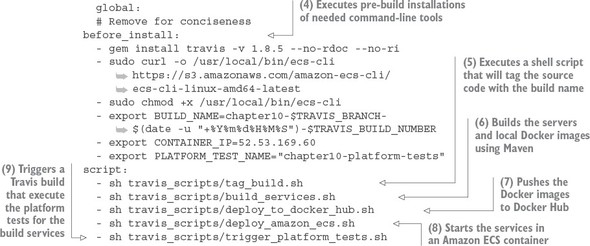
We’re now going to walk through each of the steps involved in the build process in more detail.
The first part of the travis.yml file deals with configuring the core runtime configuration of your Travis build. Typically this section of the .travis.yml file will contain Travis-specific functions that will do things like
The next listing shows this specific section of the build file.
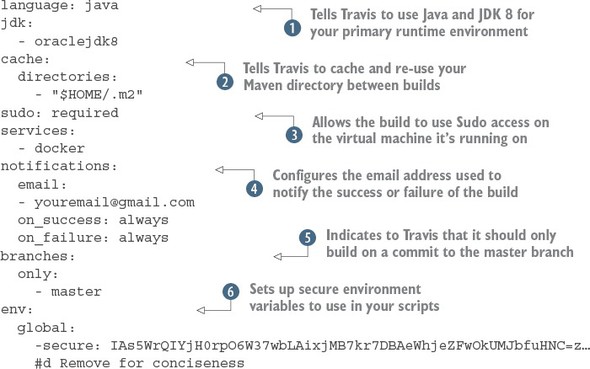
The first thing your Travis build script is doing is telling Travis what primary language is going to be used for performing
the build. By specifying the language as java and jdk attributes as java and oraclejdk8,  Travis will ensure that the JDK is installed and configured for your project.
The next part of your .travis.yml file, the cache.directories attribute  , tells Travis to cache the results of this directory when a build is executed and reuse it across multiple builds. This is
extremely useful when dealing with package managers such as Maven, where it can take a significant amount of time to download
fresh copies of jar dependencies every time a build is kicked off. Without the cache.directories attribute set, the build for this chapter can take up to 10 minutes to download all of the dependent jars.
, tells Travis to cache the results of this directory when a build is executed and reuse it across multiple builds. This is
extremely useful when dealing with package managers such as Maven, where it can take a significant amount of time to download
fresh copies of jar dependencies every time a build is kicked off. Without the cache.directories attribute set, the build for this chapter can take up to 10 minutes to download all of the dependent jars.
The next two attributes in listing 10.2 are the sudo attribute and the service attribute.  The sudo attribute is used to tell Travis that your build process will need to use sudo as part of the build. The UNIX sudo command is used to temporarily elevate a user to root privileges. Generally, you use sudo when you need to install third-party tools. You do exactly this later in the build when you need to install the Amazon ECS
tools.
The sudo attribute is used to tell Travis that your build process will need to use sudo as part of the build. The UNIX sudo command is used to temporarily elevate a user to root privileges. Generally, you use sudo when you need to install third-party tools. You do exactly this later in the build when you need to install the Amazon ECS
tools.
The services attribute is used to tell Travis whether you’re going to use certain key services while executing your build. For instance, if your integration tests need a local database available for them to run, Travis allows you start a MySQL or PostgreSQL database right on your build box. In this case, you need Docker running to build your Docker images for each of your EagleEye services and push your images to the Docker hub. You’ve set the services attribute to start Docker when the build is kicked off.
The next attribute, notifications  defines the communication channel to use whenever a build succeeds or fails. Right now, you always communicate the build
results by setting the notification channel for the build to email. Travis will notify you via email on both the success and
failure of the build. Travis CI can notify via multiple channels besides email, including Slack, IRC, HipChat, or a custom
web hook.
defines the communication channel to use whenever a build succeeds or fails. Right now, you always communicate the build
results by setting the notification channel for the build to email. Travis will notify you via email on both the success and
failure of the build. Travis CI can notify via multiple channels besides email, including Slack, IRC, HipChat, or a custom
web hook.
The branches.only  attribute tells Travis what branches Travis should build against. For the examples in this chapter, you’re only going to
perform a build off the master branch of Git. This prevents you from kicking off a build every time you tag a repo or commit to a branch within GitHub.
This is important because GitHub does a callback into Travis every time you tag a repo or create a release. The presence of
the branches.only attribute being set to master prevents Travis from going into an endless build.
attribute tells Travis what branches Travis should build against. For the examples in this chapter, you’re only going to
perform a build off the master branch of Git. This prevents you from kicking off a build every time you tag a repo or commit to a branch within GitHub.
This is important because GitHub does a callback into Travis every time you tag a repo or create a release. The presence of
the branches.only attribute being set to master prevents Travis from going into an endless build.
The last part of the build configuration is the setting of sensitive environment variables  . In your build process, you might communicate with third-party vendors such as Docker, GitHub, and Amazon. Sometimes you’re
communicating via their command line tools and other times you’re using the APIs. Regardless, you often have to present sensitive
credentials. Travis CI gives you the ability to add encrypted environment variables to protect these credentials.
. In your build process, you might communicate with third-party vendors such as Docker, GitHub, and Amazon. Sometimes you’re
communicating via their command line tools and other times you’re using the APIs. Regardless, you often have to present sensitive
credentials. Travis CI gives you the ability to add encrypted environment variables to protect these credentials.
To add an encrypted environment variable, you must encrypt the environment variable using the travis command line tool on your desk in the project directory where you have your source code. To install the Travis command-line tool locally, review the documentation for the tool at https://github.com/travis-ci/travis.rb. For the .travis.yml used in this chapter, I created and encrypted the following environment variables:
Once the travis tool is installed, the following command will add the encrypted environment variable DOCKER_USERNAME to the env.global section of you .travis.yml file:
travis encrypt DOCKER_USERNAME=somerandomname --add env.global
Once this command is run, you should now see in the env.global section of your .travis.yml file a secure attribute tag followed by a long string of text. Figure 10.18 shows what an encrypted environment variable looks like.
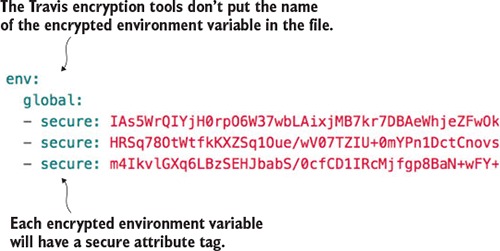
Unfortunately, Travis doesn’t label the names of your encrypted environment variables in your .travis.yml file.
Encrypted variables are only good for the single GitHub repository they’re encrypted in and Travis is building against. You can’t cut and paste an encrypted environment variable across multiple .travis.yml files. Your builds will fail to run because the encrypted environment variables won’t decrypt properly.
Even though all our examples use Travis CI as the build tool, all modern build engines allow you to encrypt your credentials and tokens. Please, please, please make sure you encrypt your credentials. Credentials embedded in a source repository are a common security vulnerability. Don’t rely on the belief that your source control repository is secure and therefore the credentials in it are secure.
Wow, the pre-build configuration was huge, but the next section is small. Build engines are often a source of a significant amount of “glue code” scripting to tie together different tools used in the build process. With your Travis script, you need to install two command-line tools:
Each item listed in the before_install section of the .travis.yml file is a UNIX command that will be executed before the build kicks off. The following listing shows the before_install attribute along with the commands that need to be run.
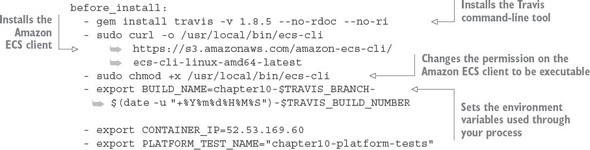
The first thing to do in the build process is install the travis command-line tool on the remote build server:
gem install travis -v 1.8.5 --no-rdoc --no-ri
Later on in the build you’re going to kick off another Travis job via the Travis REST API. You need the travis command line tool to get a token for invoking this REST call.
After you’ve installed the travis tool, you’re going to install the Amazon ecs-cli tool. This is a command-line tool used for deploying, starting, and stopping Docker containers running within Amazon. You install the ecs-cli by first downloading the binary and then changing the permission on the downloaded binary to be executable:
- sudo curl -o /usr/local/bin/ecs-cli https://s3.amazonaws.com/amazon-ecs-cli/ecs-cli-linux-amd64-latest
- sudo chmod +x /usr/local/bin/ecs-cli
The last thing you do in the before_install section of the .travis.yml is set three environment variables in your build. These three environment variables will help drive the behavior of your builds. These environment variables are
The actual values set in these environment variables are
- export BUILD_NAME=chapter10-$TRAVIS_BRANCH-
The first environment variable, BUILD_NAME, generates a unique build name that contains the name of the build, followed by the date and time (down to the seconds field) and then the build number in Travis. This BUILD_NAME will be used to tag your source code in GitHub and your Docker image when it’s pushed to the Docker hub repository.
The second environment variable, CONTAINER_IP, contains the IP address of the Amazon ECS virtual machine that your Docker containers will run on. This CONTAINER_IP will be passed later to another Travis CI job that will execute your platform tests.
I’m not assigning a static IP address to the Amazon ECS server that’s spun. If I tear down the container completely, I’ll be given a new IP. In a real production environment, the servers in your ECS cluster will probably have static (non-changing) IPs assigned to them, and the cluster will have an Amazon Enterprise Load Balancer (ELB) and an Amazon Route 53 DNS name so that the actual IP address of the ECS server would be transparent to the services. However, setting up this much infrastructure is outside the scope of the example I’m trying to demonstrate in this chapter.
The third environment variable, PLATFORM_TEST_NAME, contains the name of the build job being executed. We’ll explore its use later in the chapter.
A common requirement in many financial services and healthcare companies is that they have to prove traceability of the deployed software in production, all the way back through all the lower environments, back to the build job that built the software, and then back to when the code was checked into the source code repository. The immutable server pattern really shines in helping organizations meet this requirement. As you saw in our build example, you tagged the source control repository and the container image that’s going to be deployed with the same build name. That build name is unique and tied into a Travis build number. Because you only promote the container image through each environment and each container image is labeled with the build name, you’ve established traceability of that container image back to the source code associated with it. Because the containers are never changed once they’re tagged, you have a strong audit position to show that the deployed code matches the underlying source code repository. Now, if you wanted to play it extra safe, at the time you labeled the project source code, you could also label the application configuration residing in the Spring Cloud Config repository with the same label generated for the build.
At this point, all the pre-build configuration and dependency installation is complete. To execute your build, you’re going to use the Travis script attribute. Like the before_install attribute, the script attribute takes a list of commands that will be executed. Because these commands are lengthy, I chose to encapsulate each major step in the build into its own shell script and have Travis execute the shell script. The following listing shows the major steps that are going to be undertaken in the build.
script:
  - sh travis_scripts/tag_build.sh
  - sh travis_scripts/build_services.sh
  - sh travis_scripts/deploy_to_docker_hub.sh
  - sh travis_scripts/deploy_amazon_ecs.sh
  - sh travis_scripts/trigger_platform_tests.sh
Let’s walk through each of the major steps execute in the script step.
The travis_scripts/tag_build.sh script takes care of tagging code in the repository with a build name. For the example here, I’m creating a GitHub release via the GitHub REST API. A GitHub release will not only tag the source control repository, but will also allow you to post things like release notes to the GitHub web page along with whether the source code is a pre-release of the code.
Because the GitHub release API is a REST-based call, you’ll use curl in your shell script to do the actual invocation. The following listing shows the code from the travis_scripts/tag_build.sh script.
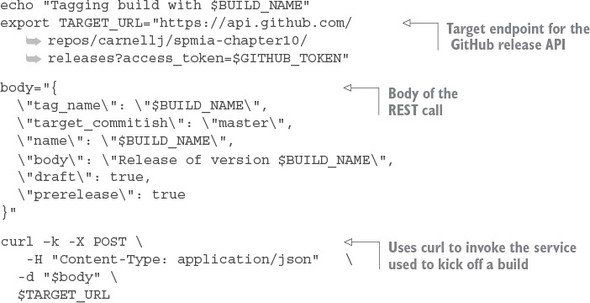
This script is simple. The first thing you do is build the target URL for the GitHub release API:
export TARGET_URL="https://api.github.com/repos/
In the TARGET_URL you’re passing an HTTP query parameter called access_token. This parameter contains a GitHub personal access token set up to specifically allow your script to take action via the REST API. Your GitHub personal access token is stored in an encrypted environment variable called GITHUB_TOKEN. To generate a personal access token, log in to your GitHub account and navigate to https://github.com/settings/tokens. When you generate a token, make sure you cut and paste it right away. When you leave the GitHub screen it will be gone and you’ll need to regenerate it.
The second step in your script is to set up the JSON body for the REST call:
body="{
  \"tag_name\": \"$BUILD_NAME\",
  \"target_commitish\": \"master\",
  \"name\": \"$BUILD_NAME\",
  \"body\": \"Release of version $BUILD_NAME\",
  \"draft\": true,
  \"prerelease\": true
}"
In the previous code snippet you’re supplying the $BUILD_NAME for a tag_name value and the setting basic release notes using the body field.
Once the JSON body for the call is built, executing the call via the curl command is trivial:
curl –k -X POST \
  -H "Content-Type: application/json"   \
  -d "$body" \
  $TARGET_URL
The next step in the Travis script attribute is to build the individual services and then create Docker container images for each service. You do this via a small script called travis_scripts/build_services.sh. This script will execute the following command:
mvn clean package docker:build
This Maven command executes the parent Maven spmia-chapter10-code/pom.xml file for all of the services in the chapter 10 code repository. The parent pom.xml executes the individual Maven pom.xml for each service. Each individual service builds the service source code, executes any unit and integration tests, and then packages the service into an executable jar.
The last thing that happens in the Maven build is the creation of a Docker container image that’s pushed to the local Docker repository running on your Travis build machine. The creation of the Docker image is carried out using the Spotify Docker plugin (https://github.com/spotify/docker-maven-plugin). If you’re interested in how the Spotify Docker plug-in works within the build process, please refer to appendix A, “Setting up your desktop environment”. The Maven build process and the Docker configuration are explained there.
At this point in the build, the services have been compiled and packaged and a Docker container image has been created on the Travis build machine. You’re now going to push the Docker container image to a central Docker repository via your travis_scripts/deploy_to_docker_hub.sh script. A Docker repository is like a Maven repository for your created Docker images. Docker images can be tagged and uploaded to it, and other projects can download and use the images.
For this code example, you’re going to use the Docker hub (https://hub.docker.com/). The following listing shows the commands used in the travis_scripts/deploy_to_docker_hub.sh script.
echo "Pushing service docker images to docker hub ...."
docker login -u $DOCKER_USERNAME -p $DOCKER_PASSWORD
docker push johncarnell/tmx-authentication-service:$BUILD_NAME
docker push johncarnell/tmx-licensing-service:$BUILD_NAME
docker push johncarnell/tmx-organization-service:$BUILD_NAME
docker push johncarnell/tmx-confsvr:$BUILD_NAME
docker push johncarnell/tmx-eurekasvr:$BUILD_NAME
docker push johncarnell/tmx-zuulsvr:$BUILD_NAME
The flow of this shell script is straightforward. The first thing you have to do is log in to Docker hub using the Docker command line-tools and the user credentials of the Docker Hub account the images are going to be pushed to. Remember, your credentials for Docker Hub are stored as encrypted environment variables:
docker login -u $DOCKER_USERNAME -p $DOCKER_PASSWORD
Once the script has logged in, the code will push each individual microservice's Docker image residing in the local Docker repository running on the Travis build server, to the Docker Hub repository:
docker push johncarnell/tmx-confsvr:$BUILD_NAME
In the previous command you tell the Docker command line tool to push to the Docker hub (which is the default hub that the Docker command line tools use) to the johncarnell account. The image being pushed will be the tmx-confsvr image with the tag name of the value from the $BUILD_NAME environment variable.
At this point, all of the code has been built and tagged and a Docker image has been created. You’re now ready to deploy your services to the Amazon ECS container you created back in section 10.1.3. The work to do this deployment is found in travis_scripts/deploy_to_amazon_ecs.sh. The following listing shows the code from this script.
echo "Launching $BUILD_NAME IN AMAZON ECS"
ecs-cli configure --region us-west-1 \
                  --access-key $AWS_ACCESS_KEY
                  --secret-key $AWS_SECRET_KEY
                  --cluster spmia-tmx-dev
ecs-cli compose --file docker/common/docker-compose.yml up
rm –rf ~/.ecs
In the Amazon console, Amazon only shows the name of the state/city/country the region is in and not the actual region name (us-west-1, us-east-1, and so on). For example, if you were to look in the Amazon console and wanted to see the Northern California region, there would be no indication that the region name is us-west-1. For a list of all the Amazon regions (and endpoints for each service), please refer to http://docs.aws.amazon.com/general/latest/gr/rande.html.
Because a new build virtual machine is kicked off by Travis with every build, you need to configure your build environment’s ecs-cli client with your AWS access and secret key. Once that’s complete, you can then kick off a deploy to your ECS cluster using the ecs-cli compose command and a docker-compose.yml file. Your docker-compose.yml is parameterized to use the build name (contained in the environment variable $BUILD_NAME).
You have one last step to your build process: kicking off a platform test. After every deployment to a new environment, you kick off a set of platform tests that check to make sure all your services are functioning properly. The goal of the platform tests is to call the microservices in the deployed build and ensure that the services are functioning properly.
I’ve separated the platform test job from the main build so that it can be invoked independently of the main build. To do this, I use the Travis CI REST API to programmatically invoke the platform tests. The travis_scripts/trigger_platform_tests.sh script does this work. The following listing shows the code from this script.
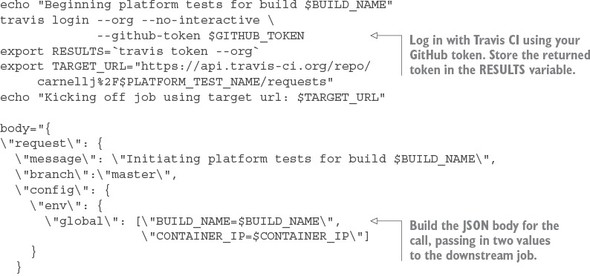
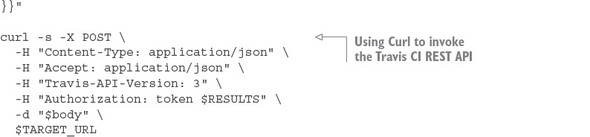
The first thing you do in listing 10.8 is use the Travis CI command-line tool to log in to Travis CI and get an OAuth2 token you can use to call other Travis REST APIs. You store this OAUTH2 token in the $RESULTS environment variable.
Next, you build the JSON body for the REST API call. Your downstream Travis CI job kicks off a series of Python scripts that tests your API. This downstream job expects two environment variables to be set. In the JSON body being built in listing 10.8, you’re passing in two environment variables, $BUILD_NAME and $CONTAINER_IP, that will be passed to your testing job:
\"env\": {
 \"global\": [\"BUILD_NAME=$BUILD_NAME\",
              \"CONTAINER_IP=$CONTAINER_IP\"]
}
The last action in your script is to invoke the Travis CI build job that runs your platform test scripts. This is done by using the curl command to call the Travis CI REST endpoint for your test job:
 curl -s -X POST \
  -H "Content-Type: application/json" \
  -H "Accept: application/json" \
  -H "Travis-API-Version: 3" \
  -H "Authorization: token $RESULTS" \
  -d "$body" \
  $TARGET_URL
The platform test scripts are stored in a separate GitHub repository called chapter10-platform-tests (https://github.com/carnellj/chapter10-platform-tests). This repository has three Python scripts that test the Spring Cloud Config server, the Eureka server, and the Zuul server. The Zuul server platform tests also test the licensing and organization services. These tests aren’t comprehensive in the sense that they exercise every aspect of the services, but they do exercise enough of the service to ensure they’re functioning.
We’re not going to walk through the platform tests. The tests are straightforward and a walk-through of the tests would not add a significant amount of value to this chapter.
As this chapter (and the book) closes out, I hope you’ve gained an appreciation for the amount of work that goes into building a build/deployment pipeline. A well-functioning build and deployment pipeline is critical to the deployment of services. The success of your microservice architecture depends on more than just the code involved in the service:
I had two goals when laying out the code examples in this book and choosing the runtime technologies needed to deploy the code. The first goal was make sure that the code examples were consumable and easy to set up. Remember, a microservices application has multiple moving parts, and setting up these parts to run cleanly with minimal effort for the reader can be difficult if there is not some forethought.
The second goal was for each chapter to be completely standalone so that you could pick any chapter in the book and have a complete runtime environment available that encapsulates all the services and software needed to run the code examples in the chapter without dependencies on other chapters.
To this end, you’ll see the following technology and patterns used throughout every chapter in this book:
All provisioning of the Docker images is done with simple shell scripts.
To build the software for all chapters, you’ll need to have the following software installed on your desktop. It’s important to note that these are the versions of software I worked with for the book. The software may work with other versions, but this is what I built the code with:
I’m not going to walk through how to install each of these components. Each of the software packages listed in the bulleted list has simple installation instructions and should be installable with minimal effort. Docker has a GUI client for installation.
All the source code for the book is in my GitHub repository (http://github.com/carnellj). Each chapter in the book has its own source code repository. Here’s a listing of all the GitHub repositories used in the book:
With GitHub, you can download the files as a zip file using the web UI. Every GitHub repository will have a download button on it. Figure A.1 shows where the download button is in the GitHub repository for chapter 1.
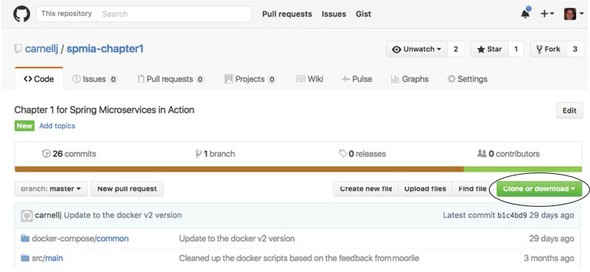
If you’re a command-line user, you can install the git client and clone the project. For example, if you wanted to download chapter 1 from GitHub using the git client, you could open a command line and issue the following command:
git clone https://github.com/carnellj/spmia-chapter1.git
This will download all the chapter 1 project files into a directory called spmia-chapter1 in the directory you ran the git command from.
Every chapter in the book has one or more services associated with it. Each service in a chapter has its own project directory. For instance, if you look at chapter 6 (http://github.com/carnellj/spmia-chapter6), you’ll see that there are seven services in it. These services are
Every service directory in a chapter is structured as a Maven-based build project. Inside each project is a src/main directory with the following sub-directories:
Because all chapters in the book follow the same structure and use Maven as their build tool, it becomes extremely simple to build the source code. Every chapter has at the root of the directory a pom.xml that acts as parent pom for all the sub-chapters. If you want to compile the source code and build the Docker images for all the projects within a single chapter, you need to run the following at the root of the chapter:
mvn clean package docker:build
This will execute the Maven pom.xml file in each of the service directories. It will also build the Docker images locally.
If you want to build a single service within the chapter, you can change to that specific service directory and run the mvn clean package docker:build command.
During the build process, all the services in the book are packaged as Docker images. This process is carried out by the Spotify Maven plugin. For an example of this plugin in action, you can look at the chapter 3 licensing service’s pom.xml file (chapter3/licensing-service). The following listing shows the XML fragment that configures this plugin in each service’s pom.xml file.
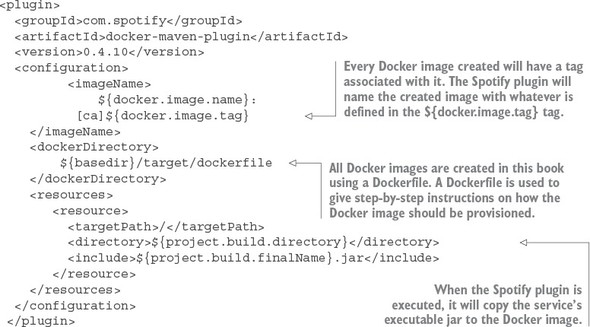
The XML fragment does three things:
The following listing shows the contents of the Dockerfile from your licensing service.
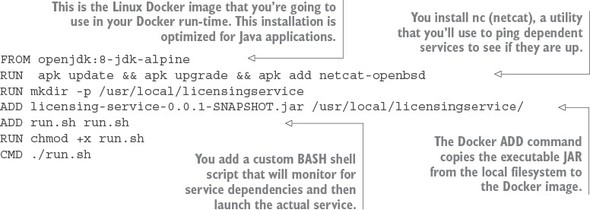
In the Dockerfile from this listing you’re provisioning your instance using Alpine Linux (https://alpinelinux.org/). Alpine Linux is a small Linux distribution that’s often used to build Docker images. The Alpine Linux image you’re using already has Java JDK installed on it.
When you’re provisioning your Docker image, you’re going to install a command-line utility called nc. The nc command is used to ping a server and see if a specific port is online. You’re going to use it in your run.sh command script to ensure that before you launch your service, all its dependent services (for example, the database and the Spring Cloud Config service) have started. The nc command does this by watching the ports the dependent services listen on. This installation of nc is done via the RUN apk update && apk upgrade && apk add netcat-openbsd, running the services using Docker Compose.
Next, your Dockerfile will make a directory for the licensing service’s executable jar file and then copy the jar file from the local file system to a directory that was created on the Docker image. This is all done via the ADD licensing-service-0.0.1-SNAPSHOT.jar/usr/local/licensingservice/.
The next step in the provisioning process is to install the run.sh script via the ADD command. The run.sh script is a custom script I wrote that launches the target service when the Docker image is started. It uses the nc command to listen for the ports of any key service dependencies that the licensing service needs and then blocks until those dependencies are started.
The following listing shows how the run.sh is used to launch the licensing service.
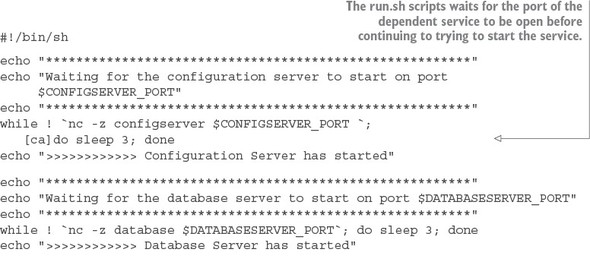
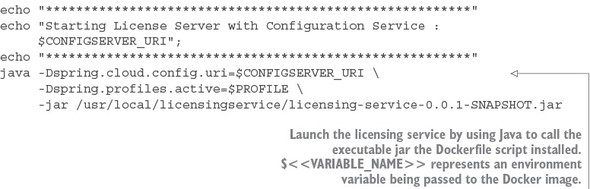
Once the run.sh command is copied to your licensing service Docker image, the CMD./run.sh Docker command is used to tell Docker to execute the run.sh launch script when the actual image starts.
I’m giving you a high-level overview of how Docker provisions an image. If you want to learn more about Docker in depth, I suggest looking at Jeff Nickoloff’s Docker in Action (Manning, 2016) or Adrian Mouat’s Using Docker (O’Reilly, 2016). Both books are excellent Docker resources.
After the Maven build has been executed, you can now launch all the services for the chapter by using Docker Compose. Docker Compose is installed as part of the Docker installation process. It’s a service orchestration tool that allows you to define services as a group and then launch together as a single unit. Docker Compose includes capabilities for also defining environment variables with each service.
Docker Compose uses a YAML file for defining the services that are going to be launched. Each chapter in this book has a file called “<<chapter>>/docker/common/docker-compose.yml”. This file contains the service definitions used to launch the services in the chapter. Let’s look at the docker-compose.yml file used in chapter 3. The following listing shows the contents of this file.
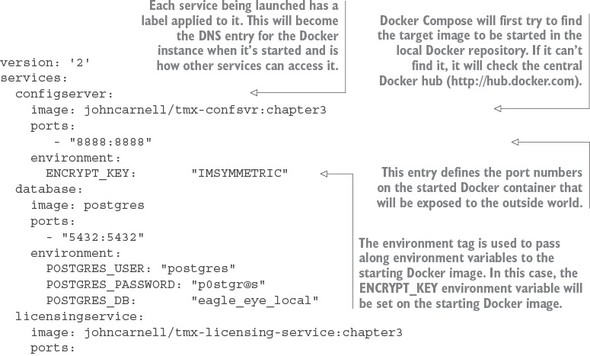
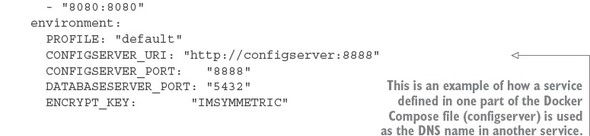
In the docker-compose.yml from listing A.4, we see three services being defined (configserver, database, and licensing service). Each service has a Docker image defined with it using the image tag. As each service starts, it will expose ports through the port tag and then pass environment variables to the starting Docker container via the environment tag.
Go ahead and start your Docker containers by executing the following command from the root of chapter directory pulled down from GitHub:
docker-compose –f docker/common/docker-compose.yml up
When this command is issued, docker-compose starts all the services defined in the docker-compose.yml file. Each service will print its standard out to the console. Figure A.2 shows the output from the docker-compose.yml file in chapter 3.
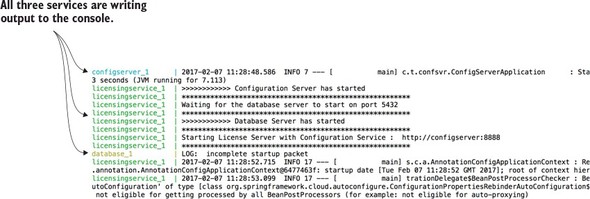
Every line written to standard out by a service started using Docker Compose will have the name of the service printed to standard out. When you’re launching a Docker Compose orchestration, finding errors being printed out can be painful. If you want to look at the output for a Docker-based service, start your docker-compose command in detached mode with the –d option (docker-compose -f docker/common/docker-compose.yml up –d). Then you can look at the specific logs for that container by issuing the docker-compose command with the logs option (docker-compose -f docker/common/docker-compose.yml logs -f licensingservice).
All the Docker containers used this in this book are ephemeral—they won’t retain their state when they’re started and stopped. Keep this in mind if you start playing with code and you see your data disappear after your restart your containers. If you want to make your Postgres database persistent between the starting and stopping of containers, I’d point you to the Postgres Docker notes (https://hub.docker.com/_/postgres/).
From reading chapter 7, you might be thinking that OAuth2 doesn’t look too complicated. After all, you have an authentication service that checks a user’s credentials and issues a token back to the user. The token can, in turn, be presented every time the user wants to call a service protected by the OAuth2 server.
Unfortunately, the real world is never simple. With the interconnected nature of the web and cloud-based applications, users have come to expect that they can securely share their data and integrate functionality between different applications owned by different services. This presents a unique challenge from a security perspective because you want to integrate across different applications while not forcing users to share their credentials with each application they want to integrate with.
Fortunately, OAuth2 is a flexible authorization framework that provides multiple mechanisms for applications to authenticate and authorize users without forcing them to share credentials. Unfortunately, it’s also one of the reasons why OAuth2 is considered complicated. These authentication mechanisms are called authentication grants. OAuth2 has four forms of authentication grants that client applications can use to authenticate users, receive an access token, and then validate that token. These grants are
In the following sections I walk through the activities that take place during the execution of each of these OAuth2 grant flows. I also talk about when to use one grant type over another.
An OAuth2 password grant is probably the most straightforward grant type to understand. This grant type is used when both the application and the services explicitly trust one another. For example, the EagleEye web application and the EagleEye web services (the licensing and organization) are both owned by ThoughtMechanix, so there’s a natural trust relationship that exists between them.
To be explicit, when I refer to a “natural trust relationship” I mean that the application and services are completely owned by the same organization. They’re managed under the same policies and procedures.
When a natural trust relationship exists, there’s little concern about exposing an OAuth2 access token to the calling application. For example, the EagleEye web application can use the OAuth2 password grant to capture the user’s credentials and directly authenticate against the EagleEye OAuth2 service. Figure B.1 shows the password grant in action between EagleEye and the downstream services.
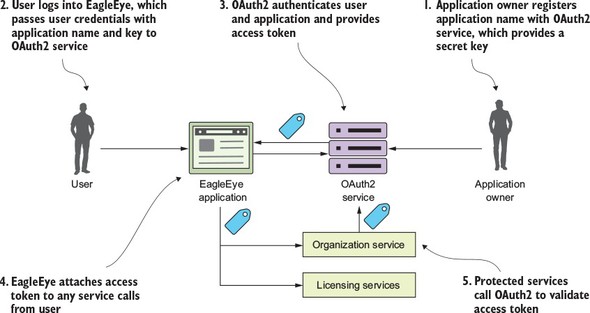
In figure B.1 the following actions are taking place:
The client credentials grant is typically used when an application needs to access an OAuth2 protected resource, but no human being is involved in the transaction. With the client credentials grant type, the OAuth2 server only authenticates based on application name and the secret key provided by the owner of the resource. Again, the client credential task is usually used when both applications are owned by the same company. The difference between the password grant and the client credential grant is that a client credential grant authenticates by only using the registered application name and the secret key.
For example, let’s say that once an hour the EagleEye application has a data analytics job that runs. As part of its work, it makes calls out to EagleEye services. However, the EagleEye developers still want that application to authenticate and authorize itself before it can access the data in those services. This is where the client credential grant can be used. Figure B.2 shows this flow.
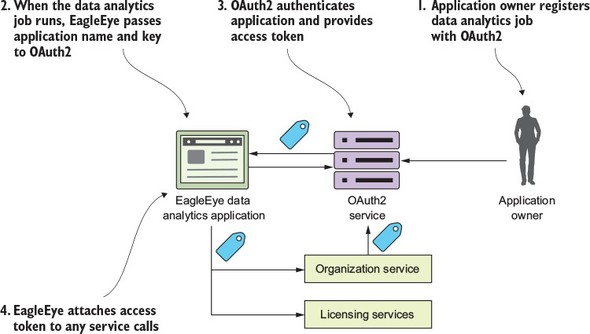
The authorization code grant is by far the most complicated of the OAuth2 grants, but it’s also the most common flow used because it allows different applications from different vendors to share data and services without having to expose a user’s credentials across multiple applications. It also enforces an extra layer of checking by not letting a calling application immediately get an OAuth2 access token, but rather a “pre-access” authorization code.
The easy way to understand the authorization grant is through an example. Let’s say you have an EagleEye user who also uses Salesforce.com. The EagleEye customer’s IT department has built a Salesforce application that needs data from an EagleEye service (the organization service). Let’s walk through figure B.3 and see how the authorization code grant flow works to allow Salesforce to access data from the EagleEye organization service, without the EagleEye customer ever having to expose their EagleEye credentials to Salesforce.
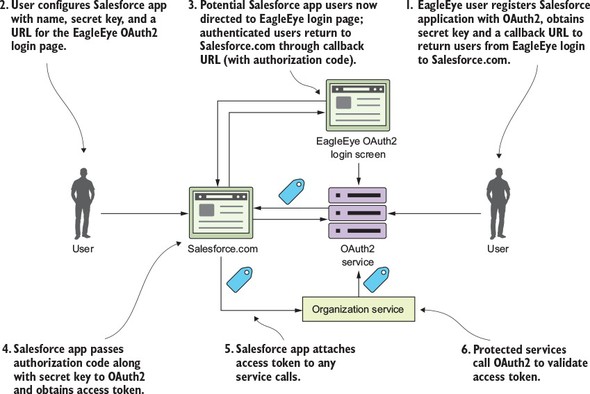
Wow! I need to come up for air. Application-to-application integration is convoluted. The key to note from this entire process is that even though the user is logged into Salesforce and they’re accessing EagleEye data, at no time were the user’s EagleEye credentials directly exposed to Salesforce. After the initial authorization code was generated and provided by the EagleEye OAuth2 service, the user never had to provide their credentials back to the EagleEye service.
The authorization grant is used when you’re running a web application through a traditional server-side web programming environment like Java or .NET. What happens if your client application is a pure JavaScript application or a mobile application that runs completely in a web browser and doesn’t rely on server-side calls to invoke third-party services?
This is where the last grant type, the implicit grant, comes into play. Figure B.4 shows the general flow of what occurs in the implicit grant.
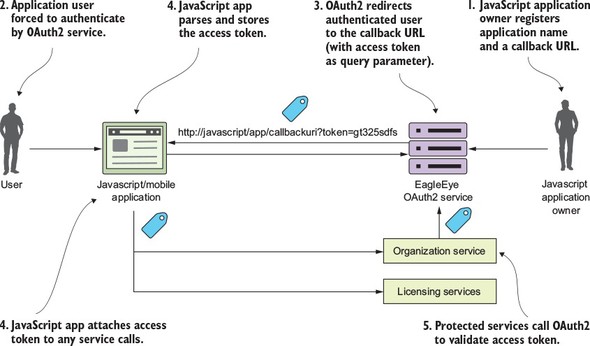
With an implicit grant, you’re usually working with a pure JavaScript application running completely inside of the browser. In the other flows, the client is communicating with an application server that’s carrying out the user’s requests and the application server is interacting with any downstream services. With an implicit grant type, all the service interaction happens directly from the user’s client (usually a web browser). In figure B.4, the following activities are taking place:
Keep several things in mind regarding the OAuth2 implicit grant:
When an OAuth2 access token is issued, it has a limited amount of time that it’s valid and will eventually expire. When the token expires, the calling application (and user) will need to re-authenticate with the OAuth2 service. However, in most of the Oauth2 grant flows, the OAuth2 server will issue both an access token and a refresh token. A client can present the refresh token to the OAuth2 authentication service and the service will validate the refresh token and then issue a new OAuth2 access token. Let’s look at figure B.5 and walk through the refresh token flow:
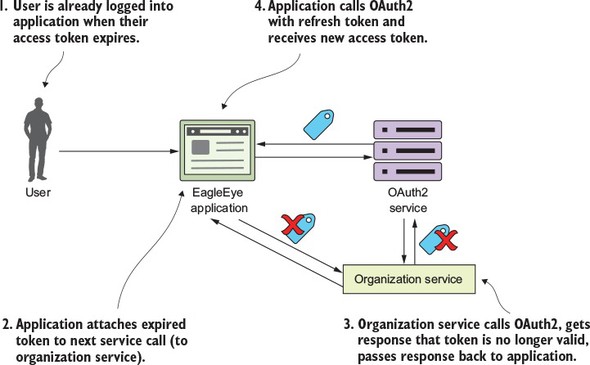
[A][B][C][D][E][F][G][H][I][J][L][M][N][O][P][Q][R][S][T][U][V][W][X][Z]
abstract access
access tokens, OAuth2
access_token attribute, 2nd
accounts, creating in Papertrail
Amazon ECS (Elastic Container Service)
creating clusters
manually deploying Eagle Eye services to
starting services in
Amazon ElastiCache Service
Amazon RDS (Relational Database Service)
Amazon Web Services.
See AWS.
annotation, Spring Cloud
antMatcher() method
Apache Avro protocol
Apache Maven, 2nd, 3rd
Apache Thrift
APIs (application program interfaces)
Application class
applications
architecture
of build/deployment pipeline
of configuration management
of microservices
of service discovery
of Spring Cloud Stream
binder
channel
sink
source
attack surface, of microservices
auditing
authenticated users
overview
protecting service by
authentication service
modifying to issue JWT
setting up for EagleEye OAuth2
authenticationManagerBean() method
AuthenticationServerConfigurer class
authorization, 2nd
authorization code grants
authorizedGrantTypes() method
@Autowired annotation, 2nd
AWS (Amazon Web Services)
AWS_ACCESS_KEY variable
AWS_SECRET_KEY variable
@Bean tag
before_install attribute, 2nd
binders
Bitbucket
Bootstrap classes
setting up in Spring Cloud Config
writing
bootstrapping services, managing
branches.only attribute
brittleness, between services
$BUILD_NAME variable
build/deployment patterns, microservices
build/deployment pipeline
architecture of
implementing with GitHub
implementing with Travis CI
in action
buildFallbackLicenseList() method
bulkhead pattern
implementing
overview
CaaS (Container as a Service), 2nd
cache, clearing when message is received
cache.directories attribute
cacheOrganizationObject() method
caching lookups with Redis
configuring licensing service with Spring Data Redis dependencies
constructing database connection to Redis server
defining Spring Data Redis repositories
using Redis and licensing service to store and read organization data
call() method
Callable class
capturing messaging traces
CD (Continuous Delivery)
channels
custom, defining
overview
checkRedisCache() method, 2nd
choreography, of messages
CI (Continuous Integration)
circuit breaker pattern, implementing
customizing timeout
timing out call to organization microservices
circuitBreaker.errorThresholdPercentage property, 2nd
circuitBreaker.requestVolumeThreshold property, 2nd
circuitBreaker.sleepWindowInMilliseconds property, 2nd
classes
bootstrap
HystrixConcurrencyStrategy, define custom
Java callable
client applications, registering with OAuth2 service
client credential grants
client resiliency patterns
bulkhead
circuit breaker
client-side load balancing
fallback
microservices
overview
with Netflix Hystrix, 2nd
fallback processing
fine-tuning
implementing bulkhead pattern
implementing circuit breaker
setting up licensing servers to use
thread context and
with Spring Cloud
fallback processing
implementing bulkhead pattern
setting up licensing servers to use
client resiliency, why it matters
client-side load balancing, 2nd, 3rd, 4th
ClientDetailsServiceConfigurer class
ClientHttpRequestInterceptor
clientType parameter
cloud
defined
microservices and
running on desktop
building Docker images
building projects
compiling projects
downloading projects from GitHub
launching services with Docker Compose
required software
service discovery in
architecture of
using Netflix Eureka
using Spring
cloud caching
cloud-based applications
building
microservices
build/deployment patterns
building with Spring Boot
client resiliency patterns
core development patterns
logging and tracing patterns
overview
routing patterns
security patterns
Spring
microservices and
overview
Spring Boot, building microservices with
cloud-based microservices
Spring Cloud, building with
Netflix Hystrix libraries
Netflix Ribbon libraries
Netflix Zuul service gateway
provisioning implementations
Spring Boot
Spring Cloud Config
Spring Cloud Security
Spring Cloud service discovery
Spring Cloud Sleuth
Spring Cloud Stream
CloudFormation
clusters
in Amazon ECS
Redis
coarse-grained microservices
@Column attribute
commandPoolProperties attribute, 2nd
commandProperties attribute, 2nd, 3rd
commands, Netflix Hystrix
communication protocols
complexity, managing
configuration
building Spring Cloud configuration servers
setting up Spring Cloud Config bootstrap class
using Spring Cloud configuration server with filesystem
controlling with Spring Cloud configuration server
integrating Spring Cloud Config with Spring Boot client
managing complexity
managing configuration
licensing services to use Spring Cloud Config
licensing services with Spring Data Redis
management
architecture
implementing
microservices
Netflix Zuul
of core run-time, in Travis CI
of microservices, managing
of Netflix Hystrix
protecting sensitive information
configuring microservices to use encryption on client side
decrypting property
downloading Oracle JCE jars for encryption
encrypting property
installing Oracle JCE jars for encryption
setting up encryption keys
routes
dynamic reloading
in Netflix Zuul
service to point to OAuth2 authentication service
services, to point to Zipkin
Spring Cloud
syslog connector
Zipkin server
configuration servers
Spring Cloud
building
controlling configuration with
refreshing properties using
using with Git
wiring in data source using
@Configuration tag
configure() method, 2nd, 3rd, 4th, 5th
consistency
Consul, 2nd
Container as a Service.
See CaaS.
Continuous Delivery.
See CD.
Continuous Integration.
See CI.
Controller class
Cookie header parameter
core run-time configuration, in Travis CI
coreSize attribute
correlation IDs
adding to HTTP response with Netflix Zuul
building post-filter receiving
building pre-filter generating
Spring Cloud Sleuth and
using in service calls
custom RestTemplate to ensure correlation ID propogates forward
UserContext to make HTTP headers easily accessible
UserContextFilter to intercept incoming HTTP requests
UserContextInteceptor to ensure correlation ID propogates forward
coupling
loose
tight between services
credential management
CRM (customer relationship management), 2nd
cross-cutting concerns
CRUD (Create, Read, Update, Delete), 2nd
CrudRepository class
custom fields, parsing out of JWT
custom spans, adding
customizing timeout on circuit breaker
D parameters
data source, wiring in using Spring Cloud
data transformations
database, constructing connection to Redis server
debugging
decomposing business problems
/decrypt endpoint
decrypting property
@DefaultProperties annotation
DelegatingUserContextCallable
DelegatingUserContextCallable class
dependencies
server, settting up
Spring Cloud Sleuth
Spring Data Redis
deploying
EagleEye
microservices
architecture of build/deployment pipeline
build/deployment pipeline in action
enabling service to build in Travis CI
implementing build/deployment pipeline
with EagleEye
service assembly
desktops, running cloud on
building Docker images
building projects
compiling projects
downloading projects from GitHub
launching services with Docker Compose
required software
development patterns, microservices
DevOps (developer operations)
DevOps engineer, 2nd
discovery, of services, 2nd
architecture of
automated mapping of routes using
building Spring Eureka service
in cloud
locating services
manual mapping of routes using
registering services with Spring-based Eureka server
using Netflix Eureka
using Spring
using to look up service
DiscoveryClient, looking up service instances with
distributed caching
clearing cache when message is received
defining custom channels
using Redis to cache lookups
configuring licensing service with Spring Data Redis dependencies
constructing database connection to Redis server
defining Spring Data Redis repositories
using Redis and licensing service to store and read organization data
distributed systems, complexity of building
distributed tracing
with Spring Cloud Sleuth
correlation ID and
log aggregation and
with Zipkin, 2nd
adding custom spans
capturing messaging traces
configuring server
configuring services to point to
installing server
integrating Spring Cloud Sleuth dependencies
setting tracing levels
tracing transactions
visualizing complex transactions
DNS (Domain Name Service)
Docker
creating images, in Travis CI
images, building
output, redirecting to Papertrail
Docker Compose, launching services with
Docker Hub, pushing images to
Docker Maven plugin, 2nd
docker ps command
DOCKER_PASSWORD variable
DOCKER_USERNAME variable
docker-compose command
docker-compose.yml
docker.sock
downloading projects from GitHub
durability
dynamic reloading, route configuration
dynamic route filters, building
forwarding route
implementing run() method
skeleton of
dynamic routing
EagleEye
configuring users
creating an Amazon ECS clusters
creating PostgreSQL database using Amazon RDS
creating Redis cluster in Amazon ElastiCache Service
deploying
setting up OAuth2 authentication service
EBS (Elastic Block Storage)
ECS (Elastic Container Service)
ecs-cli command, 2nd
ecs-cli configure command
ecs-cli ps command
ecsInstanceRole
EDA (Event Driven Architecture)
ELB (Enterprise Load Balancer)
@EnableAuthorizationServer annotation
@EnableBinding annotation, 2nd
@EnableCircuitBreaker annotation, 2nd
@EnableDiscoveryClient annotation, 2nd
@EnableEurekaClient annotation
@EnableFeignClients annotation, 2nd
@EnableResourceServer annotation
@EnableZipkinServer annotation
@EnableZipkinStreamServer annotation
@EnableZuulProxy annotation
@EnableZuulServer annotation
/encrypt endpoint
ENCRYPT_KEY environment variable
encrypted variables
encrypting
configuring microservices to use on client side
downloading Oracle JCE jars
installing Oracle JCE jars
property
setting up keys
encryption keys, setting up
endpoints, protecting
authenticating users
configuring EagleEye users
registering client applications with OAuth2 service
setting up EagleEye OAuth2 authentication service
@Entity annotation
environment tag
environment variables
Etcd
Eureka, 2nd
eureka.client.fetchRegistry attribute, 2nd
eureka.client.registerWithEureka attribute, 2nd
eureka.instance.preferIpAddress property
eureka.serviceUrl.defaultZone attribute
event processing
event-driven architecture, with Spring Cloud Stream
architecture
distributed caching
downsides of messaging architecture
using messaging to communicate state changes between services
using synchronous request-response approach to communicate state change
writing message consumer
writing message producer
execution.isolation.thread.timeoutInMilliseconds property
expires_in attribute
extending JWT (JavasScript Web Tokens)
F5 load balancer
FaaS (Functions as a Service)
fallback pattern
fallback strategy, processing
fallbackMethod, 2nd
@FeignClient annotation
fields, parsing out of JWT
filesystem, using with Spring Cloud configuration servers
filterOrder() method
filters
building
generating correlation IDs
in Netflix Zuul
receiving correlation IDs
filterType() method, 2nd
FilterUtils class
fine-grained microservices
flexibility
forwardToSpecialRoute() method
geographic distribution
GET HTTP endpoint
getAbRoutingInfo() method
getCorrelationId() method
getInstances() method
getLicense() method, 2nd
getLicenses() method
getLicensesByOrg() method, 2nd, 3rd
getOrg() method
getOrganization() method, 2nd
getOrganizationId() function
getOrgDbCall
Git, using with Spring Cloud configuration servers
GitHub
downloading projects from
implementing build/deployment pipeline with
GITHUB_TOKEN variable, 2nd
Gradle
grants, in OAuth2
authorization code grants
client credential grants
implicit grants
password grants
Groovy
HAProxy
health, of microservices
helloRemoteServiceCall method
horizontal scalability, 2nd
HTTP headers
HTTP requests
HTTP response
HTTP status codes
HTTPs, using for service communication
HttpSecurity class
hystrix-javanica dependencies
@HystrixCommand annotation, 2nd, 3rd, 4th, 5th, 6th
HystrixConcurrencyStrategy
configure Spring Cloud to use
define custom classes
define Java callable classes to inject usercontext into Hystrix commands
HystrixRuntimeException
IaaS (Infrastructure as a Service), 2nd
@Id annotation
IETF (Internet Engineering Task Force)
ignored-services attribute
images
building in Docker
creating in Travis CI
pushing to Docker Hub
immutable servers, 2nd
implicit grants
inbound port access
inboundOrgChanges
individual services
infection-style protocol
infrastructure
init() method
@Input annotation
installing Zipkin server
integrating
Spring Cloud Config with Spring Boot client
configuring licensing service to use Spring Cloud Config
directly reading properties using @Value annotation
refreshing properties using Spring Cloud configuration server
setting up licensing service Spring Cloud Config server dependencies
using Spring Cloud configuration server with Git
wiring in data source using Spring Cloud configuration server
Spring Cloud Sleuth dependencies with Zipkin
integration tests
intercepting incoming HTTP requests
interface design
invoking services
with Netflix Feign client
with Ribbon-aware Spring RestTemplate
J2EE stack
Java
building microservices with
skeleton projects
Spring Boot controller
writing Bootstrap class
define callable class to inject usercontext into Hystrix commands
java.lang.ThreadLocal
JCE (Java Cryptography Extension)
JedisConnectionFactory
JPA (Java Persistence Annotations)
JSON (JavaScript Object Notation), 2nd
JWT (JavasScript Web Tokens)
consuming in microservices
extending
modifying authentication service to issue
OAuth2 and
parsing custom field out of
jwtAccessTokenConverter() method
JWTOAuth2Config class, 2nd
JWTTokenStoreConfig class, 2nd, 3rd
License class, 2nd
license.withComment() method
LicenseRepository class
LicenseService class
LicenseService.getLicensesByOrder() method
LicenseServiceController class
licensestatic endpoint
licensing services
configuring to use Spring Cloud Config
configuring with Spring Data Redis
server dependencies
setting up to use Netflix Hystrix
setting up to use Spring Cloud
using with Redis to store and read organization data
writing message consumer in
licensing, adding Spring Cloud Sleuth to
licensingGroup
LinkedBlockingQueue
locating services
locking unneeded network ports
log aggregation, Spring Cloud Sleuth and
adding correlation ID to HTTP response with Netflix Zuul
configuring syslog connector
creating Papertrail account
implementing Papertrail
implementing Spring Cloud Sleuth
redirecting Docker output to Papertrail
searching for Spring Cloud Sleuth trace IDs in Papertrail
log correlation
loggerSink() method
logging
logging and tracing patterns, microservices
logging driver, Docker
lookups, caching with Redis
configuring licensing service with Spring Data Redis dependencies
constructing database connection to Redis server
defining Spring Data Redis repositories
using Redis and licensing service to store and read organization data
loose coupling
main() method, 2nd
mapping routes
automated using service discovery
manual using service discovery
manual using static URLs
Maven BOM (Bill of Materials)
maxQueueSize attribute
maxQueueSize property, 2nd
MDA (Message Driven Architecture)
Mercurial
message handling, semantics of
message services
MessageChannel class
messages
choreography of
clearing cache when received
visibility of
writing consumer
in licensing service
message services in action
writing producer
in organization service
message services in action
messaging architecture, disadvantages of
messaging traces, capturing
messaging, communicating state changes between services with
durability
flexibility
loose coupling
scalability
metric collection
metrics.rollingStats.numBuckets property
metrics.rollingStats.timeInMilliseconds property
metricsRollingStats.numBuckets property
metricsRollingStats.timeInMilliseconds property
microservices
accessing with services gateway
build/deployment patterns
building in Travis CI
building with Spring Boot
client resiliency patterns
cloud and
communicating health of
configuring to use encryption on client side
consuming JWT in
core development patterns
deploying
architecture of build/deployment pipeline
build/deployment pipeline in action
enabling service to build in Travis CI
implementing build/deployment pipeline
with EagleEye
Java, building with
skeleton projects
Spring Boot controller
writing Bootstrap class
limiting attack surface by locking down unneeded network ports
logging and tracing patterns
managing configuration of
overview
protecting single endpoint
routing patterns
securing
JWT and OAuth2
organization service using OAuth2
with OAuth2
security patterns
Spring Boot, building with, 2nd
designing microservice architecture
for runtime
skeleton projects
Spring Boot controller
writing Bootstrap class
timing out call to
when not to use
complexity of building distributed systems
consistency
data transformations
server sprawl
types of applications
mvn spring-boot:run command
NAS (Network Area Storage)
nc command
Netflix Eureka
building service using Spring Boot
configuring Netflix Zuul to communicate with
registering services with Spring-based server
service discovery using
Netflix Feign
Netflix Hystrix
and Spring Cloud
client resiliency patterns with
fallback processing
fine-tuning
implementing bulkhead pattern
implementing circuit breaker
setting up licensing servers to use
thread context and
commands
configuration of
thread context and
HystrixConcurrencyStrategy
ThreadLocal
Netflix Ribbon, 2nd
Netflix Zuul
adding correlation ID to HTTP response with
building pre-filter generating correlation IDs
configuring routes in
automated mapping routes via service discovery
dynamically reload route configuration
manual mapping of routes using static URLs
mapping routes manually using service discovery
service timeouts and
configuring to communicate with Netflix Eureka
filters
service routing with, 2nd
building dynamic route filter
building post-filter receiving correlation IDs
services gateways
setting up Spring Boot project
using Spring Cloud annotation for services
network ports, locking to limit microservices attack surface
notifications attribute
OAuth2
adding jars to individual services
grant types
authorization code
client credential
implicit
password
JWT and
consuming JWT in microservices
extending JWT
modifying authentication service to issue JWT
parsing custom field out of JWT
propagating access tokens
protecting organization service with
adding OAuth2 jars to individual services
adding Spring Security to individual services
configuring service to point to OAuth2 authentication service
defining what can access services
defining who can access services
propagating OAuth2 access tokens
protecting single endpoint with
authenticating users
configuring EagleEye users
registering client applications with OAuth2 service
setting up EagleEye authentication service
refreshing tokens
registering client applications with service
securing microservices with
setting up EagleEye authentication service
OAuth2Config class, 2nd, 3rd
ODS (operational data store)
Oracle JCE (Java Cryptography Extension)
downloading jars for encryption
installing jars for encryption
organization data
organization ID
organization services
inflexible in adding new consumers to changes in
protecting
writing message producer in
OrganizationChangeHandler class
OrganizationChangeModel class
organizationId parameter
OrganizationRedisRepository interface
OrganizationRedisRepositoryImpl
organizationservice
orgChangeTopic, 2nd
outbound port access
output, redirecting to Papertrail
output() method
PaaS (Platform as a Service), 2nd
packaging service assembly
Papertrail
creating account
implementing
redirecting Docker output to
searching for Spring Cloud Sleuth trace IDs in
parsing custom fields out of JWT
password grants
@PathVariable annotation, 2nd
patterns
bulkhead, 2nd
circuit breaker, 2nd, 3rd
client resiliency
bulkhead
circuit breaker
client-side load balancing
fallback
overview
with Netflix Hystrix, 2nd
with Spring Cloud, 2nd, 3rd
client-side load balancing
fallback
PCI (Payment Card Industry), 2nd
peer-to-peer model
PEP (policy enforcement point), 2nd
Phoenix servers, 2nd
physical server
pipelines, build/deployment
architecture of
implementing with GitHub
implementing with Travis CI
in action
Platform as a Service.
See PaaS.
platform tests, 2nd
PLATFORM_TEST_NAME variable
port tag
post-filter, building to receive correlation IDs
Postgres database, 2nd, 3rd, 4th, 5th
PostgreSQL database, creating with Amazon RDS
POSTMAN
pre-build tools, in Travis CI
pre-filter, for generating correlation IDs
preferIpAddress attribute
private APIs, zoning services into
propagating OAuth2 access tokens
propagation
properties
decrypting
directly reading using @Value annotation
encrypting
refreshing using Spring Cloud configuration servers
propogating correlation IDs
with RestTemplate
withUserContextInteceptor
protected resource
protecting
endpoints
authenticating users
configuring EagleEye users
registering client applications with OAuth2 service
setting up EagleEye OAuth2 authentication service
services
by authenticated users
via specific role
protecting organization service, with OAuth2
provisioning
public APIs, zoning services into
publishOrgChange() method
queueSizeRejectionThreshold attribute
RabbitMQ
reading properties using @Value annotation
readLicensingDataFromRedis
redirecting Docker output to Papertrail
Redis
constructing database connection to server
creating clusters in Amazon ElastiCache Service
to cache lookups
configuring licensing service with Spring Data Redis dependencies
constructing database connection to Redis server
defining Spring Data Redis repositories
using Redis and licensing service to store and read organization data
using with licensing service to store and read organization data
RedisTemplate
/refresh endpoint
refresh_token attribute, 2nd
refreshing
properties using Spring Cloud configuration servers
tokens
@RefreshScope annotation
registering
client applications, 2nd
services, with Spring-based Eureka server
registration, of services
reloading route configuration
repositories, Spring Data Redis
@RequestMapping annotation, 2nd
resource owner
ResponseBody class
ResponseFilter
REST endpoint
REST philosophy
REST-oriented (Representational State Transfer)
@RestController annotation
RestTemplate
Ribbon-aware
to ensure correlation ID propagates forward
restTemplate.exchange() method
$RESULTS variable
retrieveOrgInfo() method
Ribbon project
route filters, building dynamic
forwarding route
implementing run() method
skeleton of
routes
configuring in Netflix Zuul
automated mapping routes via service discovery
dynamically reload route configuration
manual mapping of routes using static URLs
mapping routes manually using service discovery
service timeouts and
forwarding
mapping
automated using service discovery
manual using service discovery
manual using static URLs
routing patterns, microservices
run-time configuration, CI
run() method, 2nd
runtime, building microservices for
communicating microservice health
service assembly
service bootstrapping
service discovery
service registration
SaaS (Software as a Service)
Sampler class
scalability
Scope attribute
scopes() method
searching for Spring Cloud Sleuth trace IDs
searchLocations attribute
secret() method
Secure Sockets Layer.
See SSL.
securing microservices, 2nd
accessing microservices with services gateway
JWT and OAuth2
limiting attack surface of microservices
protecting organization service using OAuth2
protecting single endpoint with OAuth2
protecting single endpoint with Spring
using HTTPs for service communication
using SSL for service communication
with OAuth2
zoning services into public API and private API
security patterns, microservices
security.oauth2.resource.userInfoUri property
semantics, of message handling
SEMAPHORE-based isolation
send() method
sensitive information, protecting
configuring microservices to use encryption on client side
decrypting property
downloading Oracle JCE jars for encryption
encrypting property
installing Oracle JCE jars for encryption
setting up encryption keys
server
dependencies
Zipkin
configuring
installing
server sprawl
server.port attribute
service assembly
deploying
packaging
service bootstrapping, managing configuration of microservices
service calls, using correlation IDs in
custom RestTemplate to ensure correlation ID propogates forward
UserContext to make HTTP headers easily accessible
UserContextFilter to intercept incoming HTTP requests
UserContextInteceptor to ensure correlation ID propogates forward
service discovery
architecture of
automated mapping of routes using
building Spring Eureka service
in cloud
architecture of
using Netflix Eureka
using Spring
locating services
manual mapping of routes using
registering services with Spring-based Eureka server
using Netflix Eureka
using Spring
using to look up service
invoking services with Netflix Feign client
invoking services with Ribbon-aware Spring RestTemplate
looking up service instances with Spring DiscoveryClient
service granularity, 2nd
service interfaces
service monitoring
service registration
service routing
with Netflix Zuul, 2nd
building dynamic route filter
building post-filter receiving correlation IDs
building pre-filter generating correlation IDs
configuring routes
configuring to communicate with Netflix Eureka
filters
services gateways
setting up Spring Boot project
using Spring Cloud annotation for services
with Spring Cloud, 2nd
building dynamic route filter
building post-filter receiving correlation IDs
services gateways
using annotation for Netflix Zuul services
service startups
service timeouts, 2nd
ServiceInstance class
servicename.ribbon.ReadTimeout property
services
brittleness between
communicating state changes between with messaging
durability
flexibility
loose coupling
scalability
configuring to point to Zipkin
defining what has access to
protecting service by authenticated users
protecting service via specific role
defining who has access to, 2nd
protecting service by authenticated users
protecting service via specific role
invoking
with Netflix Feign client
with Ribbon-aware Spring RestTemplate
launching with Docker Compose
locating
looking up using service discovery
invoking services with Netflix Feign client
invoking services with Ribbon-aware Spring RestTemplate
looking up service instances with Spring DiscoveryClient
protecting
by authenticated users
via specific role
registering with Spring-based Eureka server
starting in Amazon ECS
tight coupling between
zoning into public API and private API
services gateways
accessing microservices with
overview
setContext() method
setCorrelationId() method
shouldFilter() method, 2nd
Simple Queueing Service.
See SQS.
SimpleHostRoutingFilter class
Single Sign On.
See SSO.
sinks
skeleton projects
SOAP (Simple Object Access Protocol)
Software as a Service.
See SaaS.
software engineer
Source class
source control code, tagging in Travis CI
sources
span ID
spans, custom
SpecialRoutes
SpecialRoutesFilter, 2nd, 3rd
SPIA (Single Page Internet Applications)
Spring
microservices and
overview
protecting single endpoint with
authenticating users
configuring EagleEye users
registering client applications with OAuth2 service
setting up EagleEye OAuth2 authentication service
registering services with Netflix Eureka server
service discovery using
Spring Actuator module
Spring Boot
building microservices with, 2nd, 3rd
designing architecture
for runtime
skeleton projects
Spring Boot controller
writing Bootstrap class
building Netflix Eureka service with
client
controller
setting up Netflix Zuul project
when not to use microservices
complexity of building distributed systems
consistency
data transformations
server sprawl
types of applications
Spring Cloud
and Netflix Hystrix
building microservices with
Netflix Hystrix libraries
Netflix Ribbon libraries
Netflix Zuul service gateway
provisioning implementations
Spring Boot
Spring Cloud Config
Spring Cloud Security
Spring Cloud service discovery
Spring Cloud Sleuth
Spring Cloud Stream
client resiliency patterns with
fallback processing
implementing bulkhead pattern
setting up licensing servers to use
configuration servers
building
controlling configuration with
refreshing properties using
using with filesystem
using with Git
wiring in data source using
configuring to use custom HystrixConcurrencyStrategy
service discovery
service routing with, 2nd
building dynamic route filter
building post-filter receiving correlation IDs
services gateways
using annotation for Netflix Zuul services
Spring Cloud Config
configuring licensing service to use
integrating with Spring Boot client
directly reading properties using @Value annotation
refreshing properties using Spring Cloud configuration server
using Spring Cloud configuration server with Git
wiring in data source using Spring Cloud configuration server
setting up bootstrap classes
setting up licensing service server dependencies
Spring Cloud Security
Spring Cloud Sleuth
adding to licensing
adding to organization
anatomy of trace
correlation ID and
dependencies
distributed tracing with
implementing
log aggregation and
adding correlation ID to HTTP response with Zuul
configuring syslog connector
creating Papertrail account
implementing Papertrail
implementing Spring Cloud Sleuth
redirecting Docker output to Papertrail
trace IDs
Spring Cloud Stream
architecture of
binder
channel
sink
source
event-driven architecture with
distributed caching
downsides of messaging architecture
using messaging to communicate state changes between services
using synchronous request-response approach to communicate state change
writing message consumer
writing message producer
Spring Data Redis
defining repositories
dependencies
Spring Security, adding to individual services
spring-cloud-security dependency
spring-cloud-sleuth-zipkin dependency
spring-cloud-starter-eureka library
spring-cloud-starter-sleuth dependency
spring-security-jwt dependency
spring-security-oauth2 dependency
spring.application.name property, 2nd
spring.cloud.config.uri property
spring.cloud.stream.bindings property
spring.cloud.stream.bindings.input.group property
spring.datasource.password
spring.profiles.active property
spring.stream.bindings.kafka property
spring.stream.bindings.output property
spring.zipkin.baseUrl property
@SpringBootApplication annotation
SQS (Simple Queueing Service)
SSL (Secure Sockets Layer), 2nd
SSO (Single Sign On)
state changes
communicating between services with messaging
durability
flexibility
loose coupling
scalability
communicating with synchronous request-response approach
brittleness between services
inflexible in adding new consumers to changes in the organization service
tight coupling between services
static routing
static URLs, manual mapping of routes using
@StreamListener annotation, 2nd
SubscribableChannel class
Subversion
sudo attribute
synchronous request-response approach
brittleness between services
inflexible in adding new consumers to changes in the organization service
tight coupling between services
SynchronousQueue
syslog, configuring connector
@Table annotation
tag_name value
tagging source control code
technology-neutral protocol
ThoughtMechanix
thread context, Netflix Hystrix and
HystrixConcurrencyStrategy
ThreadLocal
THREAD isolation
ThreadLocal, Netflix Hystrix and
ThreadLocalAwareStrategy.java
ThreadLocalConfiguration
threadPoolKey property
threadPoolProperties attribute, 2nd
Thrift
timeout, customizing on circuit breaker
tmx-correlation-id header, 2nd
token_type attribute
tokens, refreshing
tokenServices() method
tools, installation in Travis CI
trace ID
traceability
Tracer class, 2nd
tracing
setting levels
transactions with Zipkin
TrackingFilter class, 2nd, 3rd
transactions
complex, visualizing
tracing with Zipkin
Travis CI
enabling service to build in
building microservices
core build run-time configuration
creating Docker images
executing build
invoking platform tests
pre-build tool installations
pushing images to Docker Hub
starting services in Amazon ECS
tagging source control code
implementing build/deployment pipeline with
travis.yml file
Twelve-Factor Application manifesto
UDDI (Universal Description, Discovery, and Integration) repository
unit tests
URLs (Uniform Resource Locator)
UserContext, 2nd
usercontext
UserContext.AUTH_TOKEN
UserContextFilter, 2nd
UserContextFilter class
UserContextHolder class
UserContextInteceptor
UserContextInterceptor class, 2nd, 3rd
userDetailsServiceBean() method
users
authenticated, protecting service by
authenticating
of EagleEye, configuring
useSpecialRoute() method
utils package
@Value annotation
versioning scheme
virtual containers
virtual machine images
visibility, of messages
visualizing complex transactions
VPC (Virtual Private Cloud)
WebSecurityConfigurerAdapter
WebSecurityConfigurerAdapter class
WebSphere
wiring data source
withClient() method
wrapCallable() method
writing Bootstrap classes
XML (Extensible Markup Language)
Zipkin
configuring services to point to
distributed tracing with, 2nd
adding custom spans
capturing messaging traces
configuring server
configuring services to point to
installing server
integrating Spring Cloud Sleuth dependencies
setting tracing levels
tracing transactions
visualizing complex transactions
server
configuring
installing
tracing transactions with
ZooKeeper
ZuulFilter class, 2nd
ZuulRequestHeaders
zuulservice
Chapter 1. Welcome to the cloud, Spring
Figure 1.9. Service discovery and routing are key parts of any large-scale microservice application.
Chapter 2. Building microservices with Spring Boot
Figure 2.1. Interview the EagleEye users, and understand how they do their day-to-day work.
Figure 2.2. A simplified EagleEye data model
Figure 2.4. The licensing service starting successfully
Figure 2.5. Your licensing service being called with POSTMAN
Figure 2.6. When a microservice starts up, it goes through multiple steps in its lifecycle.
Figure 2.9. A service discovery agent abstracts away the physical location of a service.
Figure 2.10. The service discovery agent uses the exposes health URL to check microservice health.
Chapter 3. Controlling your configuration with Spring Cloud configuration server
Figure 3.1. The application configuration data is read during the service bootstrapping phase.
Figure 3.2. Configuration management conceptual architecture
Figure 3.4. Retrieving default configuration information for the licensing service
Figure 3.5. Retrieving configuration information for the licensing service using the dev profile
Figure 3.6. Retrieving configuration information using the dev profile
Figure 3.8. Using the /encrypt endpoint you can encrypt values.
Chapter 4. On service discovery
Figure 4.1. A traditional service location resolution model using DNS and a load balancer
Figure 4.6. Calling the Eureka REST API with the results being JSON
Chapter 5. When bad things happen: client resiliency patterns with Spring Cloud and Netflix Hystrix
Figure 5.5. A HystrixRuntimeException is thrown when a remote call takes too long.
Figure 5.6. Your service invocation using a Hystrix fallback
Figure 5.7. Default Hystrix thread pool shared across multiple resource types
Figure 5.8. Hystrix command tied to segregated thread pools
Figure 5.10. Adding a correlation ID to the licensing service call’s HTTP header
Chapter 6. Service routing with Spring Cloud and Zuul
Figure 6.4. Each service that’s mapped in Eureka will now be mapped as a Zuul route.
Figure 6.5. The results of the Zuul /routes call with a manual mapping of the organization service
Figure 6.6. Only one organization service is now defined in Zuul.
Figure 6.7. Using a prefix, Zuul will map a /api prefix to every service it manages.
Figure 6.8. Your routes in Zuul now have an /api prefix.
Figure 6.9. You’ve now mapped a static route to your licensing service.
Figure 6.10. You now see that the /api/licensestatic now maps to a service ID called licensestatic
Figure 6.15. The flow of a call to the organization service through the SpecialRoutesFilter
Chapter 7. Securing your microservices
Figure 7.1. OAuth2 allows a user to authenticate without constantly having to present credentials.
Figure 7.2. Setting up basic authentication using the application key and secret
Figure 7.4. Payload returned after a successful client credential validation
Figure 7.5. Looking up user information based on the issued OAuth2 token
Figure 7.6. Trying to call the organization service will result in a failed call.
Figure 7.7. Passing in the OAuth2 access token on the call to the organization service
Figure 7.8. The OAuth2 token has to be carried throughout the entire call chain.
Figure 7.9. The access and refresh tokens from your authentication call are now JWT tokens.
Figure 7.10. Using http://jswebtoken.io allows you to decode the contents.
Figure 7.11. An example of extending the JWT token with a organizationId
Figure 7.12. The Zuul server parses out the organization ID from the JWT token as it passes through.
Figure 7.13. A microservice security architecture is more than implementing OAuth2.
Chapter 8. Event-driven architecture with Spring Cloud Stream
Figure 8.4. When organization service data changes it will publish a message to Kafka.
Figure 8.5. When a message comes into the Kafka orgChangeTopic, the licensing service will respond.
Figure 8.7. Updating the contact phone number using the organization service
Chapter 9. Distributed tracing with Spring Cloud Sleuth and Zipkin
Figure 9.5. To begin, create an account on Papertrail.
Figure 9.6. Next choose how you’re going to send log data to Papertrail.
Figure 9.7. Papertrail uses Syslog as one of the mechanisms for sending data to it.
Figure 9.9. The trace ID allows you to filter all log entries related to that single transaction.
Figure 9.17. You’re looking for the licensing service invocation where a Kafka message is received.
Figure 9.18. Using Zipkin you can see the Kafka message being published by the organization service.
Figure 9.19. With the custom spans defined, they’ll now show up in the transaction trace.
Chapter 10. Deploying your microservices
Figure 10.2. Selecting whether the database is going to be a production database or a test database
Figure 10.3. Setting up the basic database configuration
Figure 10.4. Setting up the security group, port, and backup options for the RDS database
Figure 10.5. Your created Amazon RDS/PostgreSQL database
Figure 10.8. ECS offers a wizard to bootstrap a new service container. You’re not going to use it.
Figure 10.9. Starting the process of creating an ECS cluster
Figure 10.10. In the “Create Cluster” screen size the EC2 instances used to host the Docker cluster.
Figure 10.12. Configuring the Container IAM role
Figure 10.13. The ECS cluster up and running
Figure 10.14. Checking the status of the deployed services
Figure 10.16. Technologies used in the EagleEye build
Figure 10.18. Encrypted Travis environment variables are placed directly in the .travis.yml file.
Appendix A. Running a cloud on your desktop
Figure A.1. The GitHub UI allows you to download a project as a zip file.
Figure A.2. All output from the started Docker containers is written to standard out.
Appendix B. OAuth2 grant types
Chapter 3. Controlling your configuration with Spring Cloud configuration server
Table 3.1. Open source projects for implementing a configuration management system
Chapter 5. When bad things happen: client resiliency patterns with Spring Cloud and Netflix Hystrix
Table 5.1. Configuration Values for @HystrixCommand Annotations
Chapter 9. Distributed tracing with Spring Cloud Sleuth and Zipkin
Table 9.1. Options for Log Aggregation Solutions for Use with Spring Boot
Chapter 1. Welcome to the cloud, Spring
Listing 1.1. Hello World with Spring Boot: a simple Spring microservice
Chapter 2. Building microservices with Spring Boot
Listing 2.1. Maven pom file for the licensing service
Listing 2.2. Introducing the @SpringBootApplication annotation
Listing 2.3. Marking the LicenseServiceController as a Spring RestController
Chapter 3. Controlling your configuration with Spring Cloud configuration server
Listing 3.1. Setting up the pom.xml for the Spring Cloud configuration server
Listing 3.2. The bootstrap class for your Spring Cloud Config server
Listing 3.3. Spring Cloud configuration’s application.yml file
Listing 3.4. Additional Maven dependencies needed by the licensing service
Listing 3.5. Configuring the licensing services bootstrap.yml
Listing 3.6. The JPA model code for a single license record
Listing 3.7. LicenseRepository interface defines the query methods
Listing 3.8. LicenseService class used to execute database commands
Listing 3.9. ServiceConfig used to centralize application properties
Chapter 4. On service discovery
Listing 4.1. Adding dependencies to your pom.xml
Listing 4.2. Setting up your Eureka configuration in the application.yml file
Listing 4.3. Annotating the bootstrap class to enable the Eureka server
Listing 4.4. Modifying your organization service’s application.yml to talk to Eureka
Listing 4.5. Calling the licensing service with different REST Clients
Listing 4.6. getLicense() function will use multiple methods to perform a REST call
Listing 4.7. Setting up the bootstrap class to use the Eureka Discovery Client
Listing 4.8. Using the DiscoveryClient to look up information
Listing 4.9. Annotating and defining a RestTemplate construction method
Listing 4.10. Using a Ribbon-backed RestTemplate to call a service
Listing 4.11. Enabling the Spring Cloud/Netflix Feign client in the licensing service
Listing 4.12. Defining a Feign interface for calling the organization service
Chapter 5. When bad things happen: client resiliency patterns with Spring Cloud and Netflix Hystrix
Listing 5.1. The @EnableCircuitBreaker annotation used to activate Hystrix in a service
Listing 5.2. Wrappering a remote resource call with a circuit breaker
Listing 5.3. Randomly timing out a call to the licensing service database
Listing 5.4. Customizing the time out on a circuit breaker call
Listing 5.5. Implementing a fallback in Hystrix
Listing 5.6. Creating a bulkhead around the getLicensesByOrg() method
Listing 5.7. Configuring the behavior of a circuit breaker
Listing 5.8. The UserContextFilter parsing the HTTP header and retrieving data
Listing 5.9. All UserContext data is managed by UserContextHolder
Listing 5.10. Defining your own Hystrix concurrency strategy
Listing 5.11. Propagating the UserContext with DelegatingUserContextCallable.java
Listing 5.12. Hooking custom HystrixConcurrencyStrategy class into Spring Cloud
Chapter 6. Service routing with Spring Cloud and Zuul
Listing 6.1. Setting up the Zuul Server bootstrap class
Listing 6.2. Configuring the Zuul server to talk to Eureka
Listing 6.3. Setting up custom routes with a prefix
Listing 6.4. Mapping the licensing service to a static route
Listing 6.5. Mapping licensing service statically to multiple routes
Listing 6.6. Zuul pre-filter for generating correlation IDs
Listing 6.7. Retrieving the tmx-correlation-id from the HTTP headers
Listing 6.8. Mapping the correlation ID to the UserContext class
Listing 6.9. Storing the HTTP header values inside the UserContext class
Listing 6.10. The UserContextHolder stores the UserContext in a ThreadLocal
Listing 6.11. All outgoing microservice calls have the correlation ID injected into them
Listing 6.12. Adding the UserContextInterceptor to the RestTemplate class
Listing 6.13. Injecting the correlation ID into the HTTP response
Listing 6.14. The skeleton of your route filter
Listing 6.15. The run() method for the SpecialRoutesFilter is where the work begins
Listing 6.16. Invoking the SpecialRouteservice to see if a routing record exists
Listing 6.17. Determining whether to use the alternative service route
Listing 6.18. The forwardToSpecialRoute invokes the alternative service
Chapter 7. Securing your microservices
Listing 7.1. The authentication-service bootstrap class
Listing 7.2. OAuth2Config service defines what applications can use your service
Listing 7.3. Defining the User ID, password and roles for your application
Listing 7.4. Configuring the bootstrap class to be a protected resource
Listing 7.5. Restricting access to only authenticated users
Listing 7.6. Restricting deletes to the ADMIN role only
Listing 7.7. Using the OAuth2RestTemplate to propagate the OAuth2 access token
Listing 7.8. Setting up the JWT token store
Listing 7.9. Hooking JWT into your authentication service via the JWTOAuth2Config class
Listing 7.10. Creating a custom RestTemplate class to inject the JWT token
Listing 7.11. The UserContextInterceptor will inject the JWT token into your REST calls
Listing 7.12. Using a JWT token enhancer class to add a custom field
Listing 7.13. Hooking in your TokenEnhancer
Listing 7.14. Parsing the organizationId out of your JWT Token
Chapter 8. Event-driven architecture with Spring Cloud Stream
Listing 8.1. The annotated Application.java class
Listing 8.2. Publishing a message to the message broker
Listing 8.3. The Spring Cloud Stream configuration for publishing a message
Listing 8.4. Publishing a message in your organization service
Listing 8.5. Consuming a message using Spring Cloud Stream
Listing 8.6. Mapping the licensing service to a message topic in Kafka
Listing 8.7. Adding the Spring Redis Dependencies
Listing 8.8. Establishing how your licensing service will communicate with Redis
Listing 8.9. OrganizationRedisRepository defines methods used to call Redis
Listing 8.10. The OrganizationRedisRepositoryImpl implementation
Listing 8.11. OrganizationRestTemplateClient class will implement cache logic
Listing 8.12. Defining a custom input channel for the licensing service
Listing 8.13. Modifying the licensing service to use your custom input channel
Listing 8.14. Using the new custom channel in the OrganizationChangeHandler
Listing 8.15. Processing an organization change in the licensing service
Chapter 9. Distributed tracing with Spring Cloud Sleuth and Zipkin
Listing 9.1. Adding Spring Cloud Sleuth to Zuul
Listing 9.2. Adding the Spring Cloud Sleuth trace ID via a Zuul POST filter
Listing 9.3. Client-side Spring Cloud Sleuth and Zipkin dependences
Listing 9.4. JAR dependencies needed for Zipkin service
Listing 9.5. Building your Zipkin servers bootstrap class
Listing 9.6. Instrumenting the call to read licensing data from Redis
Chapter 10. Deploying your microservices
Listing 10.1. Anatomy of the .travis.yml build
Listing 10.2. Configuring the core run-time for your build
Listing 10.3. Pre-build installation steps
Listing 10.4. Executing the build
Listing 10.5. Tagging the chapter 10 code repository with the GitHub release API
Listing 10.6. Pushing created Docker images to Docker Hub
Listing 10.7. Deploying Docker Images to EC2
Listing 10.8. Kicking off the platform tests using Travis CI REST API
Appendix A. Running a cloud on your desktop
Listing A.1. Spotify Docker Maven plugin used to create Dockerimage
Listing A.2. Dockerfile prepares Docker image
Listing A.3. run.sh script used to launch the licensing service
Listing A.4. The docker-compose.yml file defines the services that are to be launched
![]()
For online information and ordering of this and other Manning books, please visit www.manning.com. The publisher offers discounts on this book when ordered in quantity. For more information, please contact
       Special Sales Department
       Manning Publications Co.
       20 Baldwin Road
       PO Box 761
       Shelter Island, NY 11964
       Email: orders@manning.com
©2017 by Manning Publications Co. All rights reserved.
No part of this publication may be reproduced, stored in a retrieval system, or transmitted, in any form or by means electronic, mechanical, photocopying, or otherwise, without prior written permission of the publisher.
Many of the designations used by manufacturers and sellers to distinguish their products are claimed as trademarks. Where those designations appear in the book, and Manning Publications was aware of a trademark claim, the designations have been printed in initial caps or all caps.
Recognizing the importance of preserving what has been written, it is Manning’s policy to have the books we publish printed
on acid-free paper, and we exert our best efforts to that end. Recognizing also our responsibility to conserve the resources
of our planet, Manning books are printed on paper that is at least 15 percent recycled and processed without the use of elemental
chlorine.
|
Manning Publications Co. 20 Baldwin Road PO Box 761 Shelter Island, NY 11964 |
Acquisition editor: Greg Wild
Development editor: Marina Michaels
Technical development editor: Raphael Villela
Copyeditor: Katie Petito
Proofreader: Melody Dolab
Technical proofreader: Joshua White
Review editor: Aleksandar Dragosavljevic
Typesetter: Marija Tudor
Cover designer: Marija Tudor
ISBN 9781617293986
Printed in the United States of America
1 2 3 4 5 6 7 8 9 10 – EBM – 22 21 20 19 18 17
To my brother Jason, who even in his darkest moments showed me the true meaning of strength and dignity. You are a role model as a brother, husband, and father.
Chapter 1. Welcome to the cloud, Spring
Chapter 2. Building microservices with Spring Boot
Chapter 3. Controlling your configuration with Spring Cloud configuration server
Chapter 4. On service discovery
Chapter 5. When bad things happen: client resiliency patterns with Spring Cloud and Netflix Hystrix
Chapter 6. Service routing with Spring Cloud and Zuul
Chapter 7. Securing your microservices
Chapter 8. Event-driven architecture with Spring Cloud Stream
Chapter 9. Distributed tracing with Spring Cloud Sleuth and Zipkin
Chapter 10. Deploying your microservices
Chapter 1. Welcome to the cloud, Spring
1.2. What is Spring and why is it relevant to microservices?
1.3. What you’ll learn in this book
1.4. Why is this book relevant to you?
1.5. Building a microservice with Spring Boot
1.6. Why change the way we build applications?
1.7. What exactly is the cloud?
1.8. Why the cloud and microservices?
1.9. Microservices are more than writing the code
1.9.1. Core microservice development pattern
1.9.2. Microservice routing patterns
1.9.3. Microservice client resiliency patterns
1.9.4. Microservice security patterns
1.10. Using Spring Cloud in building your microservices
1.10.3. Spring Cloud service discovery
1.10.4. Spring Cloud/Netflix Hystrix and Ribbon
Chapter 2. Building microservices with Spring Boot
2.1. The architect’s story: designing the microservice architecture
2.1.1. Decomposing the business problem
2.2. When not to use microservices
2.3. The developer’s tale: building a microservice with Spring Boot and Java
2.3.1. Getting started with the skeleton project
2.3.2. Booting your Spring Boot application: writing the Bootstrap class
2.3.3. Building the doorway into the microservice: the Spring Boot controller
2.4. The DevOps story: building for the rigors of runtime
2.4.1. Service assembly: packaging and deploying your microservices
2.4.2. Service bootstrapping: managing configuration of your microservices
2.4.3. Service registration and discovery: how clients communicate with your microservices
Chapter 3. Controlling your configuration with Spring Cloud configuration server
3.1. On managing configuration (and complexity)
3.2. Building our Spring Cloud configuration server
3.2.1. Setting up the Spring Cloud Config Bootstrap class
3.2.2. Using Spring Cloud configuration server with the filesystem
3.3. Integrating Spring Cloud Config with a Spring Boot client
3.3.1. Setting up the licensing service Spring Cloud Config server dependencies
3.3.2. Configuring the licensing service to use Spring Cloud Config
3.3.3. Wiring in a data source using Spring Cloud configuration server
3.3.4. Directly Reading Properties using the @Value Annotation
3.3.5. Using Spring Cloud configuration server with Git
3.3.6. Refreshing your properties using Spring Cloud configuration server
3.4. Protecting sensitive configuration information
3.4.1. Download and install Oracle JCE jars needed for encryption
3.4.2. Setting up an encryption key
3.4.3. Encrypting and decrypting a property
3.4.4. Configure microservices to use encryption on the client side
Chapter 4. On service discovery
4.2. On service discovery in the cloud
4.2.1. The architecture of service discovery
4.2.2. Service discovery in action using Spring and Netflix Eureka
4.3. Building your Spring Eureka Service
4.4. Registering services with Spring Eureka
4.5. Using service discovery to look up a service
4.5.1. Looking up service instances with Spring DiscoveryClient
4.5.2. Invoking services with Ribbon-aware Spring RestTemplate
Chapter 5. When bad things happen: client resiliency patterns with Spring Cloud and Netflix Hystrix
5.1. What are client-side resiliency patterns?
5.2. Why client resiliency matters
5.4. Setting up the licensing server to use Spring Cloud and Hystrix
5.5. Implementing a circuit breaker using Hystrix
5.7. Implementing the bulkhead pattern
5.8. Getting beyond the basics; fine-tuning Hystrix
5.9. Thread context and Hystrix
Chapter 6. Service routing with Spring Cloud and Zuul
6.1. What is a services gateway?
6.2. Introducing Spring Cloud and Netflix Zuul
6.2.1. Setting up the Zuul Spring Boot project
6.3. Configuring routes in Zuul
6.3.1. Automated mapping routes via service discovery
6.3.2. Mapping routes manually using service discovery
6.3.3. Manual mapping of routes using static URLs
6.4. The real power of Zuul: filters
6.5. Building your first Zuul pre-filter generating correlation IDs
6.6. Building a post filter receiving correlation IDs
6.7. Building a dynamic route filter
6.7.1. Building the skeleton of the routing filter
Chapter 7. Securing your microservices
7.2. Starting small: using Spring and OAuth2 to protect a single endpoint
7.2.1. Setting up the EagleEye OAuth2 authentication service
7.2.2. Registering client applications with the OAuth2 service
7.3. Protecting the organization service using OAuth2
7.3.1. Adding the Spring Security and OAuth2 jars to the individual services
7.3.2. Configuring the service to point to your OAuth2 authentication service
7.4. JavaScript Web Tokens and OAuth2
7.4.1. Modifying the authentication service to issue JavaScript Web Tokens
7.4.2. Consuming JavaScript Web Tokens in your microservices
7.5. Some closing thoughts on microservice security
Use HTTPS/Secure Sockets Layer (SSL) for all service communication
Use a services gateway to access your microservices
Zone your services into a public API and private API
Limit the attack surface of your microservices by locking down unneeded network ports
Chapter 8. Event-driven architecture with Spring Cloud Stream
8.1. The case for messaging, EDA, and microservices
8.1.1. Using synchronous request-response approach to communicate state change
8.1.2. Using messaging to communicate state changes between services
8.2. Introducing Spring Cloud Stream
8.3. Writing a simple message producer and consumer
8.3.1. Writing the message producer in the organization service
8.3.2. Writing the message consumer in the licensing service
8.4. A Spring Cloud Stream use case: distributed caching
8.4.1. Using Redis to cache lookups
8.4.2. Defining custom channels
8.4.3. Bringing it all together: clearing the cache when a message is received
Chapter 9. Distributed tracing with Spring Cloud Sleuth and Zipkin
9.1. Spring Cloud Sleuth and the correlation ID
9.1.1. Adding Spring Cloud sleuth to licensing and organization
9.2. Log aggregation and Spring Cloud Sleuth
9.2.1. A Spring Cloud Sleuth/Papertrail implementation in action
9.2.2. Create a Papertrail account and configure a syslog connector
9.2.3. Redirecting Docker output to Papertrail
9.2.4. Searching for Spring Cloud Sleuth trace IDs in Papertrail
9.2.5. Adding the correlation ID to the HTTP response with Zuul
9.3. Distributed tracing with Open Zipkin
9.3.1. Setting up the Spring Cloud Sleuth and Zipkin dependencies
9.3.2. Configuring the services to point to Zipkin
9.3.3. Installing and configuring a Zipkin server
9.3.5. Using Zipkin to trace transactions
9.3.6. Visualizing a more complex transaction
Chapter 10. Deploying your microservices
10.1. EagleEye: setting up your core infrastructure in the cloud
10.1.1. Creating the PostgreSQL database using Amazon RDS
10.2. Beyond the infrastructure: deploying EagleEye
10.3. The architecture of a build/deployment pipeline
10.4. Your build and deployment pipeline in action
10.5. Beginning your build deploy/pipeline: GitHub and Travis CI
10.6. Enabling your service to build in Travis CI
10.6.1. Core build run-time configuration
10.6.2. Pre-build tool installations
10.6.4. Tagging the source control code
10.6.5. Building the microservices and creating the Docker images
10.6.6. Pushing the images to Docker Hub
Appendix A. Running a cloud on your desktop
A.2. Downloading the projects from GitHub
A.4. Building and compiling the projects
Appendix B. OAuth2 grant types
It’s ironic that in writing a book, the last part of the book you write is often the beginning of the book. It’s also often the most difficult part to put down on paper. Why? Because you have to explain to everyone why you’re so passionate about a subject that you spent the last one and a half years of your life writing a book about it. It’s hard to articulate why anyone would spend such a large amount of time on a technical book. One rarely writes software books for the money or the fame.
Here’s the reason why I wrote this book: I love writing code. It’s a calling for me and it’s also a creative activity—akin to drawing, painting, or playing an instrument. Those outside the field of software development have a hard time understanding this. I especially like building distributed applications. For me, it’s an amazing thing to see an application work across dozens (even hundreds) of servers. It’s like watching an orchestra playing a piece of music. While the final product of an orchestra is beautiful, the making of it is often a lot of hard work and requires a significant amount of practice. The same goes for writing a massively distributed application.
Since I entered the software development field 25 years ago, I’ve watched the industry struggle with the “right” way to build distributed applications. I’ve seen distributed service standards such as CORBA rise and fall. Monstrously big companies have tried to push big and, often, proprietary protocols. Anyone remember Microsoft’s Distributed Component Object Model (DCOM) or Oracle’s J2EE’s Enterprise Java Beans 2 (EJB)? I watched as technology companies and their followers rushed to build service-oriented architectures (SOA) using heavy XML-based schemas.
In each case, these approaches for building distributed systems often collapsed under their own weight. I’m not saying that these technologies weren’t used to build some very powerful applications. The reality is that they couldn’t keep up with the demand of the users. Ten years ago, smartphones were just being introduced to the market and cloud computing was in the earliest stage of infancy. Also, the standards and technology for distributed application development were too complicated for the average developer to understand and easily use in practice. Nothing speaks truth in the software development industry like written code. When the standards get in the way of this, the standards quickly get discarded.
When I first heard of the microservices approach to building applications I was more than a little skeptical. “Great, another silver-bullet approach to building distributed applications,” I thought. However, as I started diving into the concepts, I realized the simplicity of microservices could be a game changer. A microservice architecture focuses on building small services that use simple protocols (HTTP and JSON) to communicate. That’s it. You can write a microservice with nearly any programming language. There’s beauty in this simplicity.
However, while building an individual microservice is easy, operationalizing and scaling it is difficult. Getting hundreds of small distributed components to work together and then building a resilient application from them can be incredibly difficult to do. In distributed computing, failure is a fact of life and how your application deals with it is incredibly difficult to get right. To paraphrase my colleagues Chris Miller and Shawn Hagwood: “If it’s not breaking once in a while, you’re not building.”
It’s these failures that inspired me to write this book. I hate to build things from scratch when I don’t have to. The reality is that Java is the lingua franca for most application development efforts, especially in the enterprise. The Spring framework has for many organizations become the de facto framework for most application development. I’d already been doing application development in Java for almost 20 years (I remember the Dancing Duke applet) and Spring for almost 10 years. As I began my microservices journey, I was delighted and excited to watch the emergence of Spring Cloud.
The Spring Cloud framework provides out-of-the-box solutions for many of the common development and operational problems you’ll run into as a microservice developer. Spring Cloud lets you use only the pieces you need and minimizes the amount of work you need to do to build and deploy production-ready Java micro-services. It does this by using other battle-hardened technologies from companies and groups such as Netflix, HashiCorp, and the Apache foundation.
I’ve always considered myself an average developer who, at the end of the day, has deadlines to meet. That’s why I undertook the project of writing this book. I wanted a book that I could use in my day-to-day work. I wanted something with direct (and hopefully) straightforward code examples. I always want to make sure that the material in this book can be consumed as individual chapters or in its entirety. I hope you find this book useful and I hope you enjoy reading it as much as I enjoyed writing it.
As I sit down to write these acknowledgments, I can’t help but think back to 2014 when I ran my first marathon. Writing a book is a lot like running a marathon. Writing the proposal and the outline for the book is much like the training process. It gets your thoughts in shape, it focuses you for what’s ahead and, yes, near the end of the process, it can be more than a little tedious and brutal.
When you start writing the book, it’s a lot like race day. You start the marathon excited and full of energy. You know you’re trying to do something bigger than anything you might have done before and it’s both exciting and nerve-wracking. This is what you’ve trained for, but at the same time, there’s always that small voice of doubt in the back of your mind that says you won’t finish what you started.
What I’ve learned from running is that races aren’t completed one mile at a time. Instead, they’re run one foot in front of the other. The miles run are the sum of the individual footsteps. When my children are struggling with something, I laugh and ask them, “How do you write a book? One word, one single step at a time.” They usually roll their eyes, but in the end there’s no other way around this indisputable and ironclad law.
However, when you run a marathon, you might be the one running the race, but you’re never running it alone. There’s a whole team of people there to give you support, time, and advice along the way. It has been the same experience writing this book.
I’d like to start by thanking Manning for the support they gave me in writing this book. It started with Greg Wild, my acquisitions editor, who patiently worked with me as I refined the core concepts in this book and guided me through the proposal process. Along the way, Marina Michaels, my development editor, kept me honest and challenged me to become a better author. I’d also like to thank Raphael Villela and Joshua White, my technical editors, who constantly checked my work and ensured the overall quality of the examples and the code I produced. I’m extremely grateful for the time, talent, and commitment each of these individuals put into into the overall project. I’d also like to thank the reviewers who provided feedback on the manuscript throughout the writing and development process: Aditya Kumar, Adrian M. Rossi, Ashwin Raj, Christian Bach, Edgar Knapp, Jared Duncan, Jiri Pik, John Guthrie, Mirko Bernardoni, Paul Balogh, Pierluigi Riti, Raju Myadam, Rambabu Posa, Sergey Evsikov, and Vipul Gupta.
I want to close these acknowledgments with a deep sense of thanks for the love and time my family has given me in working on this project. To my wife Janet, you have been my best friend and the love of my life. When I’m tired and want to give up, I only have to listen for the sound of your footsteps next to me to know that you’re always running beside me, never telling me no, and always pushing me forward.
To my son Christopher, you’re growing up to be an incredible young man. I cannot wait for the day when you truly discover your passion, because there will be nothing in this world that can stop you from reaching your goals.
To my daughter Agatha, I’d give all the money I have to see the world through your eyes for just 10 minutes. The experience would make me a better author and more importantly a better person. Your intellect, your power of observation, and creativity humble me.
To my four-year-old son, Jack: Buddy, thank you being patient with me whenever I said, “I can’t play right now because Daddy has to work on the book.” You always make me laugh and you make this whole family complete. Nothing makes me happier than when I see you being the jokester and playing with everyone in the family.
My race with this book is done. Like my marathon, I’ve left nothing on the table in writing this book. I have nothing but gratitude for the Manning team and the MEAP readers who bought this book early and gave me so much valuable feedback. I hope in the end that you enjoy this book as much as I enjoyed writing it. Thank you.
Spring Microservices in Action was written for the practicing Java/Spring developer who needs hands-on advice and examples of how to build and operationalize microservice-based applications. When I wrote this book, I wanted it to be based around core microservice patterns that aligned with Spring Boot and Spring Cloud examples that demonstrated the patterns in action. As such, you’ll find specific microservice design patterns discussed in almost every chapter, along with examples of the patterns implemented using Spring Boot and Spring Cloud.
Spring Microservices in Action consists of 10 chapters and two appendixes:
Spring Microservices in Action includes code in every chapter. All code examples are available in my GitHub repository, and each chapter has its own repository. You can find an overview page with links to each chapter’s code repository at https://github.com/carnellj/spmia_overview. A zip containing all source code is also available from the publisher’s website at www.manning.com/books/spring-microservices-in-action.
All code in this book is built to run on Java 8 using Maven as the main build tool. Please refer to appendix A of this book for full details on the software tools you’ll need to compile and run the code examples.
One of the core concepts I followed as I wrote this book was that the code examples in each chapter should run independently of those in the other chapters. As such, every service we create for a chapter builds to a corresponding Docker image. When code from previous chapters is used, it’s included as both source and a built Docker image. We use Docker compose and the built Docker images to guarantee that you have a reproducible run-time environment for every chapter.
This book contains many examples of source code both in numbered listings and in line with normal text. In both cases, source code is formatted in a fixed-width font like this to separate it from ordinary text. Sometimes code is also in bold to highlight code that has changed from previous steps in the chapter, such as when a new feature adds to an existing line of code.
In many cases, the original source code has been reformatted; we’ve added line breaks and reworked indentation to accommodate
the available page space in the book. In rare cases, even this wasn’t enough, and listings include line-continuation markers
(). Additionally, comments in the source code have often been removed from the listings when the code is described in the text.
Code annotations accompany many of the listings, highlighting important concepts.
Purchase of Spring Microservices in Action includes free access to a private web forum run by Manning Publications where you can make comments about the book, ask technical questions, and receive help from the author and from other users. To access the forum and subscribe to it, point your web browser to www.manning.com/books/spring-microservices-in-action. This page provides information on how to get on the forum once you’re registered, what kind of help is available, and the rules of conduct on the forum.
Manning’s commitment to our readers is to provide a venue where a meaningful dialog between individual readers and between readers and the author can take place. It is not a commitment to any specific amount of participation on the part of the author, whose contributions to the AO remain voluntary (and unpaid). We suggest you ask the author challenging questions, lest his interest stray!
JOHN CARNELL is a senior cloud engineer at Genesys, where he works in Genesys’s PureCloud division. John spends the majority of his day hands-on building telephony-based microservices using the AWS platform. His day-to-day job centers on designing and building microservices across a number of technology platforms including Java, Clojure, and Go.
John is a prolific speaker and writer. He regularly speaks at local user groups and has been a regular speaker on “The No Fluff Just Stuff Software Symposium.” Over the last 20 years, John has authored, co-authored, and been a technical reviewer for a number of Java-based technology books and industry publications.
John holds a Bachelor of the Arts (BA) from Marquette University and a Masters of Business Administration (MBA) from the University of Wisconsin Oshkosh.
John is a passionate technologist and is constantly exploring new technologies and programming languages. When John isn’t speaking, writing, or coding, he lives with his wife Janet, his three children, Christopher, Agatha, and Jack, and yes, his dog Vader, in Cary, North Carolina.
During his free time (which there’s very little of) John runs, chases after his children, and studies Filipino martial arts.
John can be reached at john_carnell@yahoo.com.
The figure on the cover of Spring Microservices in Action is captioned a “A Man from Croatia.” This illustration is taken from a recent reprint of Balthasar Hacquet’s Images and Descriptions of Southwestern and Eastern Wenda, Illyrians, and Slavs, published by the Ethnographic Museum in Split, Croatia, in 2008. Hacquet (1739–1815) was an Austrian physician and scientist who spent many years studying the botany, geology, and ethnography of many parts of the Austrian Empire, as well as the Veneto, the Julian Alps, and the western Balkans, inhabited in the past by peoples of the Illyrian tribes. Hand drawn illustrations accompany the many scientific papers and books that Hacquet published.
The rich diversity of the drawings in Hacquet’s publications speaks vividly of the uniqueness and individuality of the eastern Alpine and northwestern Balkan regions just 200 years ago. This was a time when the dress codes of two villages separated by a few miles identified people uniquely as belonging to one or the other, and when members of a social class or trade could be easily distinguished by what they were wearing. Dress codes have changed since then and the diversity by region, so rich at the time, has faded away. It is now often hard to tell the inhabitant of one continent from another, and today the inhabitants of the picturesque towns and villages in the Slovenian Alps or Balkan coastal towns are not readily distinguishable from the residents of other parts of Europe.
We at Manning celebrate the inventiveness, the initiative, and the fun of the computer business with book covers based on costumes from two centuries ago, brought back to life by illustrations such as this one.
The one constant in the field of software development is that we as software developers sit in the middle of a sea of chaos and change. We all feel the churn as new technologies and approaches appear suddenly on the scene, causing us to reevaluate how we build and deliver solutions for our customers. One example of this churn is the rapid adoption by many organizations of building applications using microservices. Microservices are distributed, loosely coupled software services that carry out a small number of well-defined tasks.
This book introduces you to the microservice architecture and why you should consider building your applications with them. We’re going to look at how to build microservices using Java and two Spring framework projects: Spring Boot and Spring Cloud. If you’re a Java developer, Spring Boot and Spring Cloud will provide an easy migration path from building traditional, monolithic Spring applications to microservice applications that can be deployed to the cloud.
Before the concept of microservices evolved, most web-based applications were built using a monolithic architectural style. In a monolithic architecture, an application is delivered as a single deployable software artifact. All the UI (user interface), business, and database access logic are packaged together into a single application artifact and deployed to an application server.
While an application might be a deployed as a single unit of work, most of the time there will be multiple development teams working on the application. Each development team will have their own discrete pieces of the application they’re responsible for and oftentimes specific customers they’re serving with their functional piece. For example, when I worked at a large financial services company, we had an in-house, custom-built customer relations management (CRM) application that involved the coordination of multiple teams including the UI, the customer master, the data warehouse, and the mutual funds team. Figure 1.1 illustrates the basic architecture of this application.
The problem here is that as the size and complexity of the monolithic CRM application grew, the communication and coordination costs of the individual teams working on the application didn’t scale. Every time an individual team needed to make a change, the entire application had to be rebuilt, retested and redeployed.
The concept of a microservice originally crept into the software development community’s consciousness around 2014 and was a direct response to many of the challenges of trying to scale both technically and organizationally large, monolithic applications. Remember, a microservice is a small, loosely coupled, distributed service. Microservices allow you to take a large application and decompose it into easy-to--manage components with narrowly defined responsibilities. Microservices help combat the traditional problems of complexity in a large code base by decomposing the large code base down into small, well-defined pieces. The key concept you need to embrace as you think about microservices is decomposing and unbundling the functionality of your applications so they’re completely independent of one another. If we take the CRM application we saw in figure 1.1 and decompose it into microservices, it might look like what’s shown in figure 1.2.
Looking at figure 1.2, you can see that each functional team completely owns their service code and service infrastructure. They can build, deploy, and test independently of each other because their code, source control repository, and the infrastructure (app server and database) are now completely independent of the other parts of the application.
A microservice architecture has the following characteristics:
I often joke with my colleagues that microservices are the gateway drug for building cloud applications. You start building microservices because they give you a high degree of flexibility and autonomy with your development teams, but you and your team quickly find that the small, independent nature of microservices makes them easily deployable to the cloud. Once the services are in the cloud, their small size makes it easy to start up large numbers of instances of the same service, and suddenly your applications become more scalable and, with forethought, more resilient.
Spring has become the de facto development framework for building Java-based applications. At its core, Spring is based on the concept of dependency injection. In a normal Java application, the application is decomposed into classes where each class often has explicit linkages to other classes in the application. The linkages are the invocation of a class constructor directly in the code. Once the code is compiled, these linkage points can’t be changed.
This is problematic in a large project because these external linkages are brittle and making a change can result in multiple downstream impacts to other code. A dependency injection framework, such as Spring, allows you to more easily manage large Java projects by externalizing the relationship between objects within your application through convention (and annotations) rather than those objects having hard-coded knowledge about each other. Spring sits as an intermediary between the different Java classes of your application and manages their dependencies. Spring essentially lets you assemble your code together like a set of Lego bricks that snap together.
Spring’s rapid inclusion of features drove its utility, and the framework quickly became a lighter weight alternative for enterprise application Java developers looking for a way to building applications using the J2EE stack. The J2EE stack, while powerful, was considered by many to be bloatware, with many features that were never used by application development teams. Further, a J2EE application forced you to use a full-blown (and heavy) Java application server to deploy your applications.
What’s amazing about the Spring framework and a testament to its development community is its ability to stay relevant and reinvent itself. The Spring development team quickly saw that many development teams were moving away from monolithic applications where the application’s presentation, business, and data access logic were packaged together and deployed as a single artifact. Instead, teams were moving to highly distributed models where services were being built as small, distributed services that could be easily deployed to the cloud. In response to this shift, the Spring development team launched two projects: Spring Boot and Spring Cloud.
Spring Boot is a re-envisioning of the Spring framework. While it embraces core features of Spring, Spring Boot strips away many of the “enterprise” features found in Spring and instead delivers a framework geared toward Java-based, REST-oriented (Representational State Transfer)[1] microservices. With a few simple annotations, a Java developer can quickly build a REST microservice that can be packaged and deployed without the need for an external application container.
While we cover REST later in chapter 2, it’s worthwhile to read Roy Fielding’s PHD dissertation on building REST-based applications (http://www.ics.uci.edu/~fielding/pubs/dissertation/top.htm). It’s still one of the best explanations of REST available.
While we cover REST in more detail in chapter 2, the core concept behind REST is that your services should embrace the use of the HTTP verbs (GET, POST, PUT, and DELETE) to represent the core actions of the service and use a lightweight web-oriented data serialization protocol, such as JSON, for requesting and receiving data from the service.
Because microservices have become one of the more common architectural patterns for building cloud-based applications, the Spring development community has given us Spring Cloud. The Spring Cloud framework makes it simple to operationalize and deploy microservices to a private or public cloud. Spring Cloud wraps several popular cloud-management microservice frameworks under a common framework and makes the use and deployment of these technologies as easy to use as annotating your code. I cover the different components within Spring Cloud later in this chapter.
This book is about building microservice-based applications using Spring Boot and Spring Cloud that can be deployed to a private cloud run by your company or a public cloud such as Amazon, Google, or Pivotal. With this book, we cover with hands-on examples
By the time you’re done reading this book, you should have the knowledge needed to build and deploy a Spring Boot-based microservice. You’ll also understand the key design decisions need to operationalize your microservices. You’ll understand how service configuration management, service discovery, messaging, logging and tracing, and security all fit together to deliver a robust microservices environment. Finally, you’ll see how your microservices can be deployed within a private or public cloud.
If you’ve gotten this far into reading chapter 1, I suspect that
I chose to write this book for two reasons. First, while I’ve seen many good books on the conceptual aspects of microservices, I couldn’t a find a good Java-based book on implementing microservices. While I’ve always considered myself a programming language polyglot (someone who knows and speaks several languages), Java is my core development language and Spring has been the development framework I “reach” for whenever I build a new application. When I first came across Spring Boot and Spring Cloud, I was blown away. Spring Boot and Spring Cloud greatly simplified my development life when it came to building microservice-based applications running in the cloud.
Second, as I’ve worked throughout my career as both an architect and engineer, I’ve found that many times the technology books that I purchase have tended to go to one of two extremes. They are either conceptual without concrete code examples, or are mechanical overviews of a particular framework or programming language. I wanted a book that would be a good bridge and middle ground between the architecture and engineering disciplines. As you read this book, I want to give you a solid introduction to the microservice patterns development and how they’re used in real-world application development, and then back these patterns up with practical and easy-to-understand code examples using Spring Boot and Spring Cloud.
Let’s shift gears for a moment and walk through building a simple microservice using Spring Boot.
I’ve always had the opinion that a software development framework is well thought out and easy to use if it passes what I affectionately call the “Carnell Monkey Test.” If a monkey like me (the author) can figure out a framework in 10 minutes or less, it has promise. That’s how I felt the first time I wrote a sample Spring Boot service. I want you to have to the same experience and joy, so let’s take a minute to see how to write a simple “Hello World” REST-service using Spring Boot.
In this section, we’re not going to do a detailed walkthrough of much of the code presented. Our goal is to give you a taste of writing a Spring Boot service. We’ll go into much more detail in chapter 2.
Figure 1.3 shows what your service is going to do and the general flow of how Spring Boot microservice will process a user’s request.
This example is by no means exhaustive or even illustrative of how you should build a production-level microservice, but it should cause you to take a pause because of how little code it took to write it. We’re not going to go through how to set up the project build files or the details of the code until chapter 2. If you’d like to see the Maven pom.xml file and the actual code, you can find it in the chapter 1 section of the downloadable code. All the source code for chapter 1 can be retrieved from the GitHub repository for the book at https://github.com/carnellj/spmia-chapter1.
Please make sure you read appendix A before you try to run the code examples for the chapters in this book. Appendix A covers the general pro-ject layout of all the projects in the book, how to run the build scripts, and how to fire up the Docker environment. The code examples in this chapter are simple and designed to be run natively right from your desktop without the information in additional chapters. However, in later chapters you’ll quickly begin using Docker to run all the services and infrastructure used in this book. Don’t go too far into the book without reading appendix A on setting up your desktop environment.
For this example, you’re going to have a single Java class called simpleservice/src/com/thoughtmechanix/application/simpleservice/Application.java that will be used to expose a REST endpoint called /hello.
The following listing shows the code for Application.java.
In listing 1.1 you’re basically exposing a single GET HTTP endpoint that will take two parameters (firstName and lastName) on the URL and then return a simple JSON string that has a payload containing the message “Hello firstName lastName”. If you were to call the endpoint /hello/john/carnell on your service (which I’ll show shortly) the return of the call would be
{"message":"Hello john carnell"}
Let’s fire up your service. To do this, go to the command prompt and issue the following command:
mvn spring-boot:run
This command, mvn, will use a Spring Boot plug-in to start the application using an embedded Tomcat server.
The Spring Boot framework has strong support for both Java and the Groovy programming languages. You can build microservices with Groovy and no project setup. Spring Boot also supports both Maven and the Gradle build tools. I’ve limited the examples in this book to Java and Maven. As a long-time Groovy and Gradle aficionado, I have a healthy respect for the language and the build tool, but to keep the book manageable and the material focused, I’ve chosen to go with Java and Maven to reach the largest audience possible.
If everything starts correctly, you should see what’s shown in figure 1.4 from your command-line window.
If you examine the screen in figure 1.4, you’ll notice two things. First, a Tomcat server was started on port 8080. Second, a GET endpoint of /hello/{firstName}/{lastName} is exposed on the server.
You’re going to call your service using a browser-based REST tool called POSTMAN (https://www.getpostman.com/). Many tools, both graphical and command line, are available for invoking a REST-based service, but I’ll use POSTMAN for all my examples in this book. Figure 1.5 shows the POSTMAN call to the http://localhost:8080/hello/john/carnell endpoint and the results returned from the service.
Obviously, this simple example doesn’t demonstrate the full power of Spring Boot. But what it should show is that you can write a full HTTP JSON REST-based service with route-mapping of URL and parameters in Java with as few as 25 lines of code. As any experienced Java developer will tell you, writing anything meaningful in 25 lines of code in Java is extremely difficult. Java, while being a powerful language, has acquired a reputation of being wordy compared to other languages.
We’re done with our brief tour of Spring Boot. We now have to ask this question: because we can write our applications using a microservice approach, does this mean we should? In the next section, we’ll walk through why and when a microservice approach is justified for building your applications.
We’re at an inflection point in history. Almost all aspects of modern society are now wired together via the internet. Companies that used to serve local markets are suddenly finding that they can reach out to a global customer base. However, with a larger global customer base also comes global competition. These competitive pressures mean the following forces are impacting the way developers have to think about building applications:
To meet these expectations, we, as application developers, have to embrace the paradox that to build high-scalable and highly redundant applications we need to break our applications into small services that can be built and deployed independently of one another. If we “unbundle” our applications into small services and move them away from a single monolithic artifact, we can build systems that are
To this end, as we begin our discussion of microservices keep the following in mind:
Small, Simple, and Decoupled Services = Scalable, Resilient, and Flexible Applications
The term “cloud” has become overused. Every software vendor has a cloud and everyone’s platform is cloud-enabled, but if you cut through the hype, three basic models exist in cloud-based computing. These are
To better understand these concepts, let’s map the everyday task of making a meal to the different models of cloud computing. When you want to eat a meal, you have four choices:
Figure 1.6 shows each model.
The difference between these options is about who’s responsible for cooking these meals and where the meal is going to be cooked. In the on-premise model, eating a meal at home requires you to do all the work, using your own oven and ingredients already in the home. A store-bought meal is like using the Infrastructure as a Service (IaaS) model of computing. You’re using the store’s chef and oven to pre-bake the meal, but you’re still responsible for heating the meal and eating it at the house (and cleaning up the dishes afterward).
In a Platform as a Service (PaaS) model you still have responsibility for the meal, but you further rely on a vendor to take care of the core tasks associated with making a meal. For example, in a PaaS model, you supply the plates and furniture, but the restaurant owner provides the oven, ingredients, and the chef to cook them. In the Software as a Service (SaaS) model, you go to a restaurant where all the food is prepared for you. You eat at the restaurant and then you pay for the meal when you’re done. you also have no dishes to prepare or wash.
The key items at play in each of these models are ones of control: who’s responsible for maintaining the infrastructure and what are the technology choices available for building the application? In a IaaS model, the cloud vendor provides the basic infrastructure, but you’re accountable for selecting the technology and building the final solution. On the other end of the spectrum, with a SaaS model, you’re a passive consumer of the service provided by the vendor and have no input on the technology selection or any accountability to maintain the infrastructure for the application.
I’ve documented the three core cloud platform types (IaaS, PaaS, SaaS) that are in use today. However, new cloud platform types are emerging. These new platforms include Functions as a Service (FaaS) and Container as a Service (CaaS). FaaS-based (https://en.wikipedia.org/wiki/Function_as_a_Service) applications use technologies like Amazon’s Lambda technologies and Google Cloud functions to build applications deployed as “serverless” chunks of code that run completely on the cloud provider’s platform computing infrastructure. With a FaaS platform, you don’t have to manage any server infrastructure and only pay for the computing cycles required to execute the function.
With the Container as a Service (CaaS) model, developers build and deploy their microservices as portable virtual containers (such as Docker) to a cloud provider. Unlike an IaaS model, where you the developer have to manage the virtual machine the service is deployed to, with CaaS you’re deploying your services in a lightweight virtual container. The cloud provider runs the virtual server the container is running on as well as the provider’s comprehensive tools for building, deploying, monitoring, and scaling containers. Amazon’s Elastic Container Service (ECS) is an example of a CaaS-based platform. In chapter 10 of this book, we’ll see how to deploy the microservices you’ve built to Amazon ECS.
It’s important to note that with both the FaaS and CaaS models of cloud computing, you can still build a microservice-based architecture. Remember, the concept of microservices revolves around building small services, with limited responsibility, using an HTTP-based interface to communicate. The emerging cloud computing platforms, such as FaaS and CaaS, are really about alternative infrastructure mechanisms for deploying microservices.
One of the core concepts of a microservice-based architecture is that each service is packaged and deployed as its own discrete and independent artifact. Service instances should be brought up quickly and each instance of the service should be indistinguishable from another.
As a developer writing a microservice, sooner or later you’re going to have to decide whether your service is going to be deployed to one of the following:
The advantage of cloud-based microservices centers around the concept of elasticity. Cloud service providers allow you to quickly spin up new virtual machines and containers in a matter of minutes. If your capacity needs for your services drop, you can spin down virtual servers without incurring any additional costs. Using a cloud provider to deploy your microservices gives you significantly more horizontal scalability (adding more servers and service instances) for your applications. Server elasticity also means that your applications can be more resilient. If one of your microservices is having problems and is falling over, spinning up new service instances can you keep your application alive long enough for your development team to gracefully resolve the issue.
For this book, all the microservices and corresponding service infrastructure will be deployed to an IaaS-based cloud provider using Docker containers. This is a common deployment topology used for microservices:
Earlier in the chapter we discussed three types of cloud platforms (Infrastructure as a Service, Platform as a Service, and Software as a Services). For this book, I’ve chosen to focus specifically on building microservices using an IaaS-based approach. While certain cloud providers will let you abstract away the deployment infrastructure for your microservice, I’ve chosen to remain vendor-independent and deploy all parts of my application (including the servers).
For instance, Amazon, Cloud Foundry, and Heroku give you the ability to deploy your services without having to know about the underlying application container. They provide a web interface and APIs to allow you to deploy your application as a WAR or JAR file. Setting up and tuning the application server and the corresponding Java container are abstracted away from you. While this is convenient, each cloud provider’s platform has different idiosyncrasies related to its individual PaaS solution.
An IaaS approach, while more work, is portable across multiple cloud providers and allows us to reach a wider audience with our material. Personally, I’ve found that PaaS-based cloud solutions can allow you to quickly jump start your development effort, but once your application reaches enough microservices, you start to need the flexibility the IaaS style of cloud development provides.
Earlier in the chapter, I mentioned new cloud computing platforms such as Function as a Service (FaaS) and Container as a Service (CaaS). If you’re not careful, FaaS-based platforms can lock your code into a cloud vendor platform because your code is deployed to a vendor-specific runtime engine. With a FaaS-based model, you might be writing your service using a general programming language (Java, Python, JavaScript, and so on), but you’re still tying yourself heavily to the underlying vendor APIs and runtime engine that your function will be deployed to.
The services built in this book are packaged as Docker containers. One of the reasons why I chose Docker is that as a container technology, Docker is deployable to all the major cloud providers. Later in chapter 10, I demonstrate how to package microservices using Docker and then deploy these containers to Amazon’s cloud platform.
While the concepts around building individual microservices are easy to understand, running and supporting a robust microservice application (especially when running in the cloud) involves more than writing the code for the service. Writing a robust service includes considering several topics. Figure 1.7 highlights these topics.
Let’s walk through the items in figure 1.7 in more detail:
This book takes a patterns-based approach as we answer these questions. With a patterns-based approach, we lay out common designs that can be used across different technology implementations. While we’ve chosen to use Spring Boot and Spring Cloud to implement the patterns we’re going to use in this book, nothing will keep you from taking the concepts presented here and using them with other technology platforms. Specifically, we cover the following six categories of microservice patterns:
Let’s walk through these patterns in more detail.
The core development microservice development pattern addresses the basics of building a microservice. Figure 1.8 highlights the topics we’ll cover around basic service design.
The microservice routing patterns deal with how a client application that wants to consume a microservice discovers the location of the service and is routed over to it. In a cloud-based application, you might have hundreds of microservice instances running. You’ll need to abstract away the physical IP address of these services and have a single point of entry for service calls so that you can consistently enforce security and content policies for all service calls.
Service discovery and routing answer the question, “How do I get my client’s request for a service to a specific instance of a service?”
In figure 1.9, service discovery and service routing appear to have a hard-coded sequence of events between them (first comes service routing and the service discovery). However, the two patterns aren’t dependent on one another. For instance, we can implement service discovery without service routing. You can implement service routing without service discovery (even though its implementation is more difficult).
Because microservice architectures are highly distributed, you have to be extremely sensitive in how you prevent a problem in a single service (or service instance) from cascading up and out to the consumers of the service. To this end, we’ll cover four client resiliency patterns:
Figure 1.10 shows how these patterns protect the consumer of service from being impacted when a service is misbehaving. I cover these four topics in chapter 5.
I can’t write a book on microservices without talking about microservice security. In chapter 7 we’ll cover three basic security patterns. These patterns are
Figure 1.11 shows how you can implement the three patterns described previously to build an authentication service that can protect your microservices.
At this point I’m not going to go too deeply into the details of figure 1.10. There’s a reason why security requires a whole chapter. (It could honestly be a book in itself.)
The beauty of the microservice architecture is that a monolithic application is broken down into small pieces of functionality that can be deployed independently of one another. The downside of a microservice architecture is that it’s much more difficult to debug and trace what the heck is going on within your application and services.
For this reason, we’ll look at three core logging and tracing patterns:
Figure 1.12 shows how these patterns fit together. We’ll cover the logging and tracing patterns in greater detail in chapter 9.
One of the core parts of a microservice architecture is that each instance of a microservice should be identical to all its other instances. You can’t allow “configuration drift” (something changes on a server after it’s been deployed) to occur, because this can introduce instability in your applications.
“I made only one small change on the stage server, but I forgot to make the change in production.” The resolution of many down systems when I’ve worked on critical situations teams over the years has often started with those words from a developer or system administrator. Engineers (and most people in general) operate with good intentions. They don’t go to work to make mistakes or bring down systems. Instead they’re doing the best they can, but they get busy or distracted. They tweak something on a server, fully intending to go back and do it in all the environments.
At a later point, an outage occurs and everyone is left scratching their heads wondering what’s different between the lower environments in production. I’ve found that the small size and limited scope of a microservice makes it the perfect opportunity to introduce the concept of “immutable infrastructure” into an organization: once a service is deployed, the infrastructure it’s running on is never touched again by human hands.
An immutable infrastructure is a critical piece of successfully using a microservice architecture, because you have to guarantee in production that every microservice instance you start for a particular microservice is identical to its brethren.
To this end, our goal is to integrate the configuration of your infrastructure right into your build-deployment process so that you no longer deploy software artifacts such as a Java WAR or EAR to an already-running piece of infrastructure. Instead, you want to build and compile your microservice and the virtual server image it’s running on as part of the build process. Then, when your microservice gets deployed, the entire machine image with the server running on it gets deployed.
Figure 1.13 illustrates this process. At the end of the book we’ll look at how to change your build and deployment pipeline so that your microservices and the servers they run on are deployed as a single unit of work. In chapter 10 we cover the following patterns and topics:
Our goal with these patterns and topics is to ruthlessly expose and stamp out configuration drift as quickly as possible before it can hit your upper environments, such as stage or production.
For the code examples in this book (except chapter 10), everything will run locally on your desktop machine. The first two chapters can be run natively directly from the command line. Starting in chapter 3, all the code will be compiled and run as Docker containers.
In this section, I briefly introduce the Spring Cloud technologies that you’ll use as you build out your microservices. This is a high-level overview; when you use each technology in this book, I’ll teach you the details on each as needed.
Implementing all these patterns from scratch would be a tremendous amount of work. Fortunately for us, the Spring team has integrated a wide number of battle-tested open source projects into a Spring subproject collectively known as Spring Cloud. (http://projects.spring.io/spring-cloud/).
Spring Cloud wraps the work of open source companies such as Pivotal, HashiCorp, and Netflix in delivering patterns. Spring Cloud simplifies setting up and configuring of these projects into your Spring application so that you can focus on writing code, not getting buried in the details of configuring all the infrastructure that can go with building and deploying a microservice application.
Figure 1.14 maps the patterns listed in the previous section to the Spring Cloud projects that implement them.
Let’s walk through these technologies in greater detail.
Spring Boot is the core technology used in our microservice implementation. Spring Boot greatly simplifies microservice development by simplifying the core tasks of building REST-based microservices. Spring Boot also greatly simplifies mapping HTTP-style verbs (GET, PUT, POST, and DELETE) to URLs and the serialization of the JSON protocol to and from Java objects, as well as the mapping of Java exceptions back to standard HTTP error codes.
Spring Cloud Config handles the management of application configuration data through a centralized service so your application configuration data (particularly your environment specific configuration data) is cleanly separated from your deployed microservice. This ensures that no matter how many microservice instances you bring up, they’ll always have the same configuration. Spring Cloud Config has its own property management repository, but also integrates with open source projects such as the following:
With Spring Cloud service discovery, you can abstract away the physical location (IP and/or server name) of where your servers are deployed from the clients consuming the service. Service consumers invoke business logic for the servers through a logical name rather than a physical location. Spring Cloud service discovery also handles the registration and deregistration of services instances as they’re started up and shut down. Spring Cloud service discovery can be implemented using Consul (https://www.consul.io/) and Eureka (https://github.com/Netflix/eureka) as its service discovery engine.
Spring Cloud heavily integrates with Netflix open source projects. For microservice client resiliency patterns, Spring Cloud wraps the Netflix Hystrix libraries (https://github.com/Netflix/Hystrix) and Ribbon project (https://github.com/Netflix/Ribbon) and makes using them from within your own microservices trivial to implement.
Using the Netflix Hystrix libraries, you can quickly implement service client resiliency patterns such as the circuit breaker and bulkhead patterns.
While the Netflix Ribbon project simplifies integrating with service discovery agents such as Eureka, it also provides client-side load-balancing of service calls from a service consumer. This makes it possible for a client to continue making service calls even if the service discovery agent is temporarily unavailable.
Spring Cloud uses the Netflix Zuul project (https://github.com/Netflix/zuul) to provide service routing capabilities for your microservice application. Zuul is a service gateway that proxies service requests and makes sure that all calls to your microservices go through a single “front door” before the targeted service is invoked. With this centralization of service calls, you can enforce standard service policies such as a security authorization authentication, content filtering, and routing rules.
Spring Cloud Stream (https://cloud.spring.io/spring-cloud-stream/) is an enabling technology that allows you to easily integrate lightweight message processing into your microservice. Using Spring Cloud Stream, you can build intelligent microservices that can use asynchronous events as they occur in your application. With Spring Cloud Stream, you can quickly integrate your microservices with message brokers such as RabbitMQ (https://www.rabbitmq.com/) and Kafka (http://kafka.apache.org/).
Spring Cloud Sleuth (https://cloud.spring.io/spring-cloud-sleuth/) allows you to integrate unique tracking identifiers into the HTTP calls and message channels (RabbitMQ, Apache Kafka) being used within your application. These tracking numbers, sometimes referred to as correlation or trace ids, allow you to track a transaction as it flows across the different services in your application. With Spring Cloud Sleuth, these trace IDs are automatically added to any logging statements you make in your microservice.
The real beauty of Spring Cloud Sleuth is seen when it’s combined with logging aggregation technology tools such as Papertrail (http://papertrailapp.com) and tracing tools such as Zipkin (http://zipkin.io). Papertail is a cloud-based logging platform used to aggregate logs in real time from different microservices into one queryable database. Open Zipkin takes data produced by Spring Cloud Sleuth and allows you to visualize the flow of your service calls involved for a single transaction.
Spring Cloud Security (https://cloud.spring.io/spring-cloud-security/) is an authentication and authorization framework that can control who can access your services and what they can do with your services. Spring Cloud Security is token-based and allows services to communicate with one another through a token issued by an authentication server. Each service receiving a call can check the provided token in the HTTP call to validate the user’s identity and their access rights with the service.
In addition, Spring Cloud Security supports the JavaScript Web Token (https://jwt.io). The JavaScript Web Token (JWT) framework standardizes the format of how a OAuth2 token is created and provides standards for digitally signing a created token.
For the provisioning implementations, we’re going to make a technology shift. The Spring framework(s) are geared toward application development. The Spring frameworks (including Spring Cloud) don’t have tools for creating a “build and deployment” pipeline. To implement a “build and deployment” pipeline you’re going to use the following tools: Travis CI (https://travis-ci.org) for your build tool and Docker (https://www.docker.com/) to build the final server image containing your microservice.
To deploy your built Docker containers, we end the book with an example of how to deploy the entire application stack built throughout this book to Amazon’s cloud.
In the last section, we walked through all the different Spring Cloud technologies that you’re going to use as you build out your microservices. Because each of these technologies are independent services, it’s obviously going to take more than one chapter to explain all of them in detail. However, as I wrap up this chapter, I want to leave you with a small code example that again demonstrates how easy it is to integrate these technologies into your own microservice development effort.
Unlike the first code example in listing 1.1, you can’t run this code example because a number of supporting services need to be set up and configured to be used. Don’t worry, though; the setup costs for these Spring Cloud services (configuration service, service discovery) are a one-time cost in terms of setting up the service. Once they’re set up, your individual microservices can use these capabilities over and over again. We couldn’t fit all that goodness into a single code example at the beginning of the book.
The code shown in the following listing quickly demonstrates how the service discovery, circuit breaker, bulkhead, and client-side load balancing of remote services were integrated into our “Hello World” example.
This code has a lot packed into it, so let’s walk through it. Keep in mind that this listing is only an example and isn’t found in the chapter 1 GitHub repository source code. I’ve included it here to give you a taste of what’s to come later in the book.
The first thing you should notice is the @EnableCircuitBreaker and @EnableEurekaClient annotations. The @EnableCircuitBreaker annotation tells your Spring microservice that you’re going to use the Netflix Hystrix libraries in your application. The @EnableEurekaClient annotation tells your microservice to register itself with a Eureka Service Discovery agent and that you’re going to use service discovery to look up remote REST services endpoints in your code. Note that configuration is happening in a property file that will tell the simple service the location and port number of a Eureka server to contact. You first see Hystrix being used when you declare your hello method:
@HystrixCommand(threadPoolKey = "helloThreadPool")
public String helloRemoteServiceCall(String firstName, String lastName)
The @HystrixCommand annotation is doing two things. First, any time the helloRemoteServiceCall method is called, it won’t be directly invoked. Instead, the method will be delegated to a thread pool managed by Hystrix. If the call takes too long (default is one second), Hystrix steps in and interrupts the call. This is the implementation of the circuit breaker pattern. The second thing this annotation does is create a thread pool called helloThreadPool that’s managed by Hystrix. All calls to helloRemoteServiceCall method will only occur on this thread pool and will be isolated from any other remote service calls being made.
The last thing to note is what’s occurring inside the helloRemoteServiceCall method. The presence of the @EnableEurekaClient has told Spring Boot that you’re going to use a modified RestTemplate class (this isn’t how the Standard Spring RestTemplate would work out of the box) whenever you make a REST service call. This RestTemplate class will allow you to pass in a logical service ID for the service you’re trying to invoke:
ResponseEntity<String> restExchange = restTemplate.exchange (http://logical-service-id/name/{firstName}/{lastName}
Under the covers, the RestTemplate class will contact the Eureka service and look up the physical location of one or more of the “name” service instances. As a consumer of the service, your code never has to know where that service is located.
Also, the RestTemplate class is using Netflix’s Ribbon library. Ribbon will retrieve a list of all the physical endpoints associated with a service. Every time the service is called by the client, it “round-robins” the call to the different service instances on the client without having to go through a centralized load balancer. By eliminating a centralized load balancer and moving it to the client, you eliminate another failure point (load balancer going down) in your application infrastructure.
I hope that at this point you’re impressed, because you’ve added a significant number of capabilities to your microservice with only a few annotations. That’s the real beauty behind Spring Cloud. You as a developer get to take advantage of battle-hardened microservice capabilities from premier cloud companies like Netflix and Consul. These capabilities, if used outside of Spring Cloud, can be complex and obtuse to set up. Spring Cloud simplifies their use to literally nothing more than a few simple Spring Cloud annotations and configuration entries.
I want to make sure this book provides examples that you can relate to as you go about your day-to-day job. To this end, I’ve structured the chapters in this book and the corresponding code examples around the adventures (misadventures) of a fictitious company called ThoughtMechanix.
ThoughtMechanix is a software development company whose core product, EagleEye, provides an enterprise-grade software asset management application. It provides coverage for all the critical elements: inventory, software delivery, license management, compliance, cost, and resource management. Its primary goal is to enable organizations to gain an accurate point-in-time picture of its software assets.
The company is approximately 10 years old. While they’ve experienced solid revenue growth, internally they’re debating whether they should be re-platforming their core product from a monolithic on-premise-based application or move their application to the cloud. The re-platforming involved with EagleEye can be a “make or break” moment for a company.
The company is looking at rebuilding their core product EagleEye on a new architecture. While much of the business logic for the application will remain in place, the application itself will be broken down from a monolithic design to a much smaller microservice design whose pieces can be deployed independently to the cloud. The examples in this book won’t build the entire ThoughtMechanix application. Instead you’ll build specific microservices from the problem domain at hand and then build the infrastructure that will support these services using various Spring Cloud (and some non-Spring-Cloud) technologies.
The ability to successfully adopt cloud-based, microservice architecture will impact all parts of a technical organization. This includes the architecture, engineering, testing, and operations teams. Input will be needed from each group and, in the end, they’re probably going to need reorganization as the team reevaluates their responsibilities in this new environment. Let’s start our journey with ThoughtMechanix as you begin the fundamental work of identifying and building out several of the microservices used in EagleEye and then building these services using Spring Boot.
The history of software development is littered with the tales of large development projects that after an investment of millions of dollars and hundreds of thousands of software developer hours, and with many of the best and brightest minds in the industry working on them, somehow never managed to deliver anything of value to their customers and literally collapsed under their own complexity and weight.
These mammoth projects tended to follow large, traditional waterfall development methodologies that insisted that all the application’s requirements and design be defined at the beginning of the project. So much emphasis was placed on getting all the specifications for the software “correct” that there was little leeway to meet new business requirements, or refactor and learn from mistakes made in the early stages of development.
The reality, though, is that software development isn’t a linear process of definition and execution, but rather an evolutionary one where it takes several iterations of communicating with, learning from, and delivering to the customer before the development team truly understands the problem at hand.
Compounding the challenges of using traditional waterfall methodologies is that many times the granularity of the software artifacts being delivered in these projects are
A microservice-based architecture takes a different approach to delivering functionality. Specifically, microservice-based architectures have these characteristics:
Why are these microservice architecture attributes important to cloud-based development? Cloud-based applications in general have the following:
This chapter provides you with the foundation you need to target and identify microservices in your business problem, build the skeleton of a microservice, and then understand the operational attributes that need to be in place for a microservice to be deployed and managed successfully in production.
To successfully design and build microservices, you need to approach microservices as if you’re a police detective interviewing witnesses to a crime. Even though every witness saw the same events take place, their interpretation of the crime is shaped by their background, what was important to them (for example, what motivates them), and what environmental pressures were brought to bear at that moment they witnessed the event. Participants each have their own perspectives (and biases) of what they consider important.
Like a successful police detective trying to get to the truth, the journey to build a successful microservice architecture involves incorporating the perspectives of multiple individuals within your software development organization. Although it takes more than technical people to deliver an entire application, I believe that the foundation for successful microservice development starts with the perspectives of three critical roles:
In this chapter, I’ll demonstrate how to design and build a set of microservices from the perspective of each of these roles using Spring Boot and Java. By the time the chapter concludes, you’ll have a service that can be packaged and deployed to the cloud.
An architect’s role on a software project is to provide a working model of the problem that needs to be solved. The job of the architect is to provide the scaffolding against which developers will build their code so that all the pieces of the application fit together.
When building a microservices architecture, a project’s architect focuses on three key tasks:
In the face of complexity, most people try to break the problem on which they’re working into manageable chunks. They do this so they don’t have to try to fit all the details of the problem in their heads. Instead, they break the problem down abstractly into a few key parts and then look for the relationships that exist between these parts.
In a microservices architecture, the architect breaks the business problem into chunks that represent discrete domains of activity. These chunks encapsulate the business rules and the data logic associated with a particular part of the business domain.
Although you want microservices to encapsulate all the business rules for carrying out a single transaction, this isn’t always feasible. You’ll often have situations where you need to have groups of microservices working across different parts of the business domain to complete an entire transaction. An architect teases apart the service boundaries of a set of microservices by looking at where the data domain doesn’t seem to fit together.
For example, an architect might look at a business flow that’s to be carried out by code and realize that they need both customer and product information. The presence of two discrete data domains is a good indication that multiple microservices are at play. How the two different parts of the business transaction interact usually becomes the service interface for the microservices.
Breaking apart a business domain is an art form rather than a black-and-white science. Use the following guidelines for identifying and decomposing a business problem into microservice candidates:
Let’s take these guidelines and apply them to a real-world problem. Chapter 1 introduced an existing software product called EagleEye that’s used for managing software assets such as software licenses and secure socket layer (SSL) certificates. These items are deployed to various servers throughout an organization.
EagleEye is a traditional monolithic web application that’s deployed to a J2EE application server residing within a customer’s data center. Your goal is to tease apart the existing monolithic application into a set of services.
You’re going to start by interviewing all the users of the EagleEye application and discussing with them how they interact and use EagleEye. Figure 2.1 captures a summary of the conversations you might have with the different business customers. By looking at how the users of EagleEye interact with the application and how the data model for the application is broken out, you can decompose the EagleEye problem domain into the following microservice candidates.
In the figure, I’ve highlighted a number of nouns and verbs that have come up during conversations with the business users. Because this is an existing application, you can look at the application and map the major nouns back to tables in the physical data model. An existing application may have hundreds of tables, but each table will usually map back to a single set of logical entities.
Figure 2.2 shows a simplified data model based on conversations with EagleEye customers. Based on the business interviews and the data model, the microservice candidates are organization, license, contract, and assets services.
Once you have a simplified data model, you can begin the process of defining what microservices you’re going to need in the application. Based on the data model in figure 2.2, you can see the potential for four microservices based on the following elements:
The goal is to take these major pieces of functionality and extract them into completely self-contained units that can be built and deployed independently of each other. But extracting services from the data model involves more than repackaging code into separate projects. It’s also about teasing out the actual database tables the services are accessing and only allowing each individual service to access the tables in its specific domain. Figure 2.3 shows how the application code and the data model become “chunked” into individual pieces.
After you’ve broken a problem domain down into discrete pieces, you’ll often find yourself struggling to determine whether you’ve achieved the right level of granularity for your services. A microservice that’s too coarse- or fine-grained will have a number of telltale attributes that we’ll discuss shortly.
When you’re building a microservice architecture, the question of granularity is important, but you can use the following concepts to determine the correct solution:
How do you know whether your microservices are the right size? If a microservice is too coarse-grained, you’ll likely see the following:
A service with too many responsibilities—The general flow of the business logic in the service is complicated and seems to be enforcing an overly diverse array of business rules.
The service is managing data across a large number of tables—A microservice is the system of record for the data it manages. If you find yourself persisting data to multiple tables or reaching out to tables outside of the immediate database, this is a clue the service is too big. I like to use the guideline that a microservice should own no more than three to five tables. Any more, and your service is likely to have too much responsibility.
Too many test cases—Services can grow in size and responsibility over time. If you have a service that started with a small number of test cases and ends up with hundreds of unit and integration test cases, you might need to refactor.
What about a microservice that’s too fine-grained?
The microservices in one part of the problem domain breed like rabbits—If everything becomes a microservice, composing business logic out of the services becomes complex and difficult because the number of services needed to get a piece of work done grows tremendously. A common smell is when you have dozens of microservices in an application and each service interacts with only a single database table.
Your microservices are heavily interdependent on one another—You find that the microservices in one part of the problem domain keep calling back and forth between each other to complete a single user request.
Your microservices become a collection of simple CRUD (Create, Replace, Update, Delete) services—Microservices are an expression of business logic and not an abstraction layer over your data sources. If your microservices do nothing but CRUD-related logic, they’re probably too fine-grained.
A microservices architecture should be developed with an evolutionary thought process where you know that you aren’t going to get the design right the first time. That’s why it’s better to start with your first set of services being more coarse-grained than fine-grained. It’s also important not to be dogmatic with your design. You may run into physical constraints on your services where you’ll need to make an aggregation service that joins data together because two separate services will be too chatty, or where no clear boundaries exist between the domain lines of a service.
In the end, take a pragmatic approach and deliver, rather than waste time trying to get the design perfect and then have nothing to show for your effort.
The last part of the of the architect’s input is about defining how the microservices in your application are going to talk with one another. When building business logic with microservices, the interfaces for the services should be intuitive and developers should get a rhythm of how all the services work in the application by learning one or two of the services in the application.
In general, the following guidelines can be used for thinking about service interface design:
All the basic guidelines drive to one thing, making your service interfaces easy to understand and consumable. You want a developer to sit down and look at the service interfaces and start using them. If a microservice isn’t easy to consume, developers will go out of their way to work around and subvert the intention of the architecture.
We’ve spent this chapter talking about why microservices are a powerful architectural pattern for building applications. But I haven’t touched on when you shouldn’t use microservices to build your applications. Let’s walk through them:
Because microservices are distributed and fine-grained (small), they introduce a level of complexity into your application that wouldn’t be there in more monolithic applications. Microservice architectures require a high degree of operational maturity. Don’t consider using microservices unless your organization is willing to invest in the automation and operational work (monitoring, scaling) that a highly distributed application needs to be successful.
One of the most common deployment models for microservices is to have one microservice instance deployed on one server. In a large microservices-based application, you might end up with 50 to 100 servers or containers (usually virtual) that have to be built and maintained in production alone. Even with the lower cost of running these services in the cloud, the operational complexity of having to manage and monitor these servers can be tremendous.
The flexibility of microservices has to be weighed against the cost of running all of these servers.
Microservices are geared toward reusability and are extremely useful for building large applications that need to be highly resilient and scalable. This is one of the reasons why so many cloud-based companies have adopted microservices. If you’re building small, departmental-level applications or applications with a small user base, the complexity associated with building on a distributed model such as microservices might be more expense then it’s worth.
As you begin looking at microservices, you need to think through the data usage patterns of your services and how service consumers are going to use them. A microservice wraps around and abstracts away a small number of tables and works well as a mechanism for performing “operational” tasks such as creating, adding, and performing simple (non-complex) queries against a store.
If your applications need to do complex data aggregation or transformation across multiple sources of data, the distributed nature of microservices will make this work difficult. Your microservices will invariably take on too much responsibility and can also become vulnerable to performance problems.
Also keep in mind that no standard exists for performing transactions across microservices. If you need transaction management, you will need to build that logic yourself. In addition, as you’ll see in chapter 7, microservices can communicate amongst themselves by using messages. Messaging introduces latency in data updates. Your applications need to handle eventual consistency where updates that are applied to your data might not immediately appear.
When building a microservice, moving from the conceptual space to the implementation space requires a shift in perspective. Specifically, as a developer, you need to establish a basic pattern of how each of the microservices in your application is going to be implemented. While each service is going to be unique, you want to make sure that you’re using a framework that removes boilerplate code and that each piece of your microservice is laid out in the same consistent fashion.
In this section, we’ll explore the developer’s priorities in building the licensing microservice from your EagleEye domain model. Your licensing service is going to be written using Spring Boot. Spring Boot is an abstraction layer over the standard Spring libraries that allows developers to quickly build Groovy- and Java-based web applications and microservices with significantly less ceremony and configuration than a full-blown Spring application.
For your licensing service example, you’ll use Java as your core programming language and Apache Maven as your build tool.
Over the next several sections you’re going to
To begin, you’ll create a skeleton project for the licensing. You can either pull down the source code down from GitHub (https://github.com/carnellj/spmia-chapter2) or create a licensing-service project directory with the following directory structure:
Once you’ve pulled down or created this directory structure, begin by writing your Maven script for the project. This will be the pom.xml file located at the root of the project directory. The following listing shows the Maven POM file for your licensing service.
We won’t go through the entire script in detail, but note a few key areas as we begin. Spring Boot is broken into many individual projects. The philosophy is that you shouldn’t have to “pull down the world” if you aren’t going to use different pieces of Spring Boot in your application. This also allows the various Spring Boot projects to release new versions of code independently of one another. To help simplify the life of the developers, the Spring Boot team has gathered related dependent projects into various “starter” kits. In part 1 of the Maven POM you tell Maven that you need to pull down version 1.4.4 of the Spring Boot framework
In parts 2 and 3 of the Maven file, you identify that you’re pulling down the Spring Web and Spring Actuator starter kits. These two projects are at the heart of almost any Spring Boot REST-based service. You’ll find that as you build more functionality into your services, the list of these dependent projects becomes longer.
Also, Spring Source has provided Maven plugins that simplify the build and deployment of the Spring Boot applications. Step 4 tells your Maven build script to install the latest Spring Boot Maven plugin. This plugin contains a number of add-on tasks (such as spring-boot:run) that simplify your interaction between Maven and Spring Boot.
Finally, you’ll see a comment that sections of the Maven file have been removed. For the sake of the trees, I didn’t include the Spotify Docker plugins in listing 2.1.
Every chapter in this book includes Docker files for building and deploying the application as Docker containers. You can find details of how to build these Docker images in the README.md file in the code sections of each chapter.
Your goal is to get a simple microservice up and running in Spring Boot and then iterate on it to deliver functionality. To this end, you need to create two classes in your licensing service microservice:
As you’ll see shortly, Spring Boot uses annotations to simplify setting up and configuring the service. This becomes evident as you look at the bootstrap class in the following listing. This bootstrap class is in the src/main/java/com/thoughtmechanix/licenses/Application.java file.
The first thing to note in this code is the use of the @SpringBootApplication annotation. Spring Boot uses this annotation to tell the Spring container that this class is the source of bean definitions for use in Spring. In a Spring Boot application, you can define Spring Beans by
Under the covers, the @SpringBootApplication annotation marks the Application class in listing 2.2 as a configuration class, then begins auto-scanning all the classes on the Java class path for other Spring Beans.
The second thing to note is the Application class’s main() method. In the main() method, the SpringApplication.run(Application.class, args), the call starts the Spring container and returns a Spring ApplicationContext object. (You aren’t doing anything with the ApplicationContext, so it isn’t shown in the code.)
The easiest thing to remember about the @SpringBootApplication annotation and the corresponding Application class is that it’s the bootstrap class for the entire microservice. Core initialization logic for the service should be placed in this class.
Now that you’ve gotten the build script out of the way and implemented a simple Spring Boot Bootstrap class, you can begin writing your first code that will do something. This code will be your Controller class. In a Spring boot application, a Controller class exposes the services endpoints and maps the data from an incoming HTTP request to a Java method that will process the request.
All the microservices in this book follow the REST approach to building your services. An in-depth discussion of REST is outside of the scope this book,[1] but for your purposes, all the services you build will have the following characteristics:
Probably the most comprehensive coverage of the design of REST services is the book REST in Practice by Ian Robinson, et al (O’Reilly, 2010).
Use HTTP as the invocation protocol for the service—The service will be exposed via HTTP endpoint and will use the HTTP protocol to carry data to and from the services.
Map the behavior of the service to standard HTTP verbs—REST emphasizes having services map their behavior to the HTTP verbs of POST, GET, PUT, and DELETE verbs. These verbs map to the CRUD functions found in most services.
Use JSON as the serialization format for all data going to and from the service—This isn’t a hard-and-fast principle for REST-based microservices, but JSON has become lingua franca for serializing data that’s going to be submitted and returned by a microservice. XML can be used, but many REST-based applications make heavy use of JavaScript and JSON (JavaScript Object Notation). JSON is the native format for serializing and deserializing data being consumed by JavaScript-based web front-ends and services.
Use HTTP status codes to communicate the status of a service call—The HTTP protocol has developed a rich set of status codes to indicate the success or failure of a service. REST-based services take advantage of these HTTP status codes and other web-based infrastructure, such as reverse proxies and caches, which can be integrated with your microservices with relative ease.
HTTP is the language of the web and using HTTP as the philosophical framework for building your service is a key to building services in the cloud.
Your first controller class is located in src/main/java/com/thoughtmechanix/licenses/controllers/LicenseServiceController.java. This class will expose four HTTP endpoints that will map to the POST, GET, PUT, and DELETE verbs.
Let’s walk through the controller class and look at how Spring Boot provides a set of annotations that keeps the effort needed to expose your service endpoints to a minimum and allows you to focus on building the business logic for the service. We’ll start by looking at the basic controller class definition without any class methods in it yet. The following listing shows the controller class that you built for your licensing service.
We’ll begin our exploration by looking at the @RestController annotation. The @RestController is a class-level Java annotation and tells the Spring Container that this Java class is going to be used for a REST-based service. This annotation automatically handles the serialization of data passed into the services as JSON or XML (by default the @RestController class will serialize returned data into JSON). Unlike the traditional Spring @Controller annotation, the @RestController annotation doesn’t require you as the developer to return a ResponseBody class from your controller class. This is all handled by the presence of the @RestController annotation, which includes the @ResponseBody annotation.
Multiple protocols can be used to send data back and forth between HTTP-based microservices. JSON has emerged as the de facto standard for several reasons.
First, compared to other protocols such as the XML-based SOAP (Simple Object Access Protocol), it’s extremely lightweight in that you can express your data without having much textual overhead.
Second, it’s easily read and consumed by a human being. This is an underrated quality for choosing a serialization protocol. When a problem arises, it’s critical for developers to look at a chunk of JSON and quickly, visually process what’s in it. The simplicity of the protocol makes this incredibly easy to do.
Third, JSON is the default serialization protocol used in JavaScript. Since the dramatic rise of JavaScript as a programming language and the equally dramatic rise of Single Page Internet Applications (SPIA) that rely heavily on JavaScript, JSON has become a natural fit for building REST-based applications because it’s what the front-end web clients use to call services.
Other mechanisms and protocols are more efficient than JSON for communicating between services. The Apache Thrift (http://thrift.apache.org) framework allows you to build multi-language services that can communicate with one another using a binary protocol. The Apache Avro protocol (http://avro.apache.org) is a data serialization protocol that converts data back and forth to a binary format between client and server calls.
If you need to minimize the size of the data you’re sending across the wire, I recommend you look at these protocols. But it has been my experience that using straight-up JSON in your microservices works effectively and doesn’t interpose another layer of communication to debug between your service consumers and service clients.
The second annotation shown in listing 2.3 is the @RequestMapping annotation. You can use the @RequestMapping annotation as a class-level and method-level annotation. The @RequestMapping annotation is used to tell the Spring container the HTTP endpoint that the service is going to expose to the world. When you use the class-level @RequestMapping annotation, you’re establishing the root of the URL for all the other endpoints exposed by the controller.
In listing 2.3, the @RequestMapping(value="/v1/organizations/{organizationId}/licenses") uses the value attribute to establish the root of the URL for all endpoints exposed in the controller class. All service endpoints exposed in this controller will start with /v1/organizations/{organizationId}/licenses as the root of their endpoint. The {organizationId} is a placeholder that indicates how you expect the URL to be parameterized with an organizationId passed in every call. The use of organizationId in the URL allows you to differentiate between the different customers who might use your service.
Now you’ll add the first method to your controller. This method will implement the GET verb used in a REST call and return a single License class instance, as shown in the following listing. (For purposes of this discussion you’ll instantiate a Java class called License.)
The first thing you’ve done in this listing is annotate the getLicenses() method with a method level @RequestMapping annotation, passing in two parameters to the annotation: value and method. With a method-level @RequestMapping annotation, you’re building on the root-level annotation specified at the top of the class to match all HTTP requests coming to the controller with the endpoint /v1/organizations/{organizationId}/licences/{licensedId}. The second parameter of the annotation, method, specifies the HTTP verb that the method will be matched on. In the previous example, you’re matching on the GET method as represented by the RequestMethod.GET enumeration.
The second thing to note about listing 2.4 is that you use the @PathVariable annotation in the parameter body of the getLicenses() method. (2) The @Path-Variable annotation is used to map the parameter values passed in the incoming URL (as denoted by the {parameterName} syntax) to the parameters of your method. In your code example from listing 2.4, you’re mapping two parameters from the URL, organizationId and licenseId, to two parameter-level variables in the method:
@PathVariable("organizationId") String organizationId,
@PathVariable("licenseId")   String licenseId)
Before you get too far down the path of writing microservices, make sure that you (and potentially other teams in your organization) establish standards for the endpoints that will be exposed via your services. The URLs (Uniform Resource Locator) for the microservice should be used to clearly communicate the intent of the service, the resources the service manages, and the relationships that exist between the resources managed within the service. I’ve found the following guidelines useful for naming service endpoints:
At this point you have something you can call as a service. From a command line window, go to your project directory where you’ve downloaded the sample code and execute the following Maven command:
mvn spring-boot:run
As soon as you hit the Return key, you should see Spring Boot launch an embedded Tomcat server and start listening on port 8080.
Once the service is started, you can directly hit the exposed endpoint. Because your first method exposed is a GET call, you can use a number of methods for invoking the service. My preferred method is to use a chrome-based tool like POSTMAN or CURL for calling the service. Figure 2.5 shows a GET performed on the http://localhost:8080/v1/organizations/e254f8c-c442-4ebe-a82a-e2fc1d1ff78a/licenses/f3831f8c-c338-4ebe-a82a-e2fc1d1ff78a endpoint.
At this point you have a running skeleton of a service. But from a development perspective, this service isn’t complete. A good microservice design doesn’t eschew segregating the service into well-defined business logic and data access layers. As you progress in later chapters, you’ll continue to iterate on this service and delve further into how to structure it.
Let’s switch to the final perspective: exploring how a DevOps engineer would operationalize the service and package it for deployment to the cloud.
For the DevOps engineer, the design of the microservice is all about managing the service after it goes into production. Writing the code is often the easy part. Keeping it running is the hard part.
While DevOps is a rich and emerging IT field, you’ll start your microservice development effort with four principles and build on these principles later in the book. These principles are
These four principles expose the paradox that can exist with microservice development. Microservices are smaller in size and scope, but their use introduces more moving parts in an application, especially because microservices are distributed and running independently of each other in their own distributed containers. This introduces a high degree of coordination and more opportunities for failure points in the application.
From a DevOps perspective, you must address the operational needs of a microservice up front and translate these four principles into a standard set of lifecycle events that occur every time a microservice is built and deployed to an environment. The four principles can be mapped to the following operational lifecycle steps:
Figure 2.6 shows how these four steps fit together.
One of my biggest hopes with this book is that you realize that a successful microservice architecture requires strong application development and DevOps practices. One of the most succinct summaries of these practices can be found in Heroku’s Twelve-Factor Application manifesto (https://12factor.net/). This document provides 12 best practices you should always keep in the back of your mind when building microservices. As you read this book, you’ll see these practices intertwined into the examples. I’ve summarized them as follows:
Codebase—All application code and server provisioning information should be in version control. Each microservice should have its own independent code repository within the source control systems.
Dependencies—Explicitly declare the dependencies your application uses through build tools such as Maven (Java). Third-party JAR dependence should be declared using their specific version numbers. This allows your microservice to always be built using the same version of libraries.
Config—Store your application configuration (especially your environment-specific configuration) independently from your code. Your application configuration should never be in the same repository as your source code.
Backing services—Your microservice will often communicate over a network to a database or messaging system. When it does, you should ensure that at any time, you can swap out your implementation of the database from an in-house managed service to a third-party service. In chapter 10, we demonstrate this when you move your services away from a locally managed Postgres database to one managed by Amazon.
Build, release, run—Keep your build, release, and run pieces of deploying your application completely separate. Once code is built, the developer should never make changes to the code at runtime. Any changes need to go back to the build process and be redeployed. A built service is immutable and cannot be changed.
Processes—Your microservices should always be stateless. They can be killed and replaced at any timeout without the fear that a loss-of-a-service instance will result in data loss.
Port binding—A microservice is completely self-contained with the runtime engine for the service packaged in the service executable. You should run the service without the need for a separated web or application server. The service should start by itself on the command line and be accessed immediately through an exposed HTTP port.
Concurrency—When you need to scale, don’t rely on a threading model within a single service. Instead, launch more microservice instances and scale out horizontally. This doesn’t preclude using threading within your microservice, but don’t rely on it as your sole mechanism for scaling. Scale out, not up.
Disposability—Microservices are disposable and can be started and stopped on demand. Startup time should be minimized and processes should shut down gracefully when they receive a kill signal from the operating system.
Dev/prod parity—Minimize the gaps that exist between all of the environments in which the service runs (including the developer’s desktop). A developer should use the same infrastructure locally for the service development in which the actual service will run. It also means that the amount of time that a service is deployed between environments should be hours, not weeks. As soon as code is committed, it should be tested and then promoted as quickly as possible from Dev all the way to Prod.
Logs—Logs are a stream of events. As logs are written out, they should be streamable to tools, such as Splunk (http://splunk.com) or Fluentd (http://fluentd.org), that will collate the logs and write them to a central location. The microservice should never be concerned about the mechanics of how this happens and the developer should visually look at the logs via STDOUT as they’re being written out.
Admin processes—Developers will often have to do administrative tasks against their services (data migration or conversion). These tasks should never be ad hoc and instead should be done via scripts that are managed and maintained through the source code repository. These scripts should be repeatable and non-changing (the script code isn’t modified for each environment) across each environment they’re run against.
From a DevOps perspective, one of the key concepts behind a microservice architecture is that multiple instances of a microservice can be deployed quickly in response to a change application environment (for example, a sudden influx of user requests, problems within the infrastructure, and so on).
To accomplish this, a microservice needs to be packaged and installable as a single artifact with all of its dependencies defined within it. This artifact can then be deployed to any server with a Java JDK installed on it. These dependencies will also include the runtime engine (for example, an HTTP server or application container) that will host the microservice.
This process of consistently building, packaging, and deploying is the service assembly (step 1 in figure 2.6). Figure 2.7 shows additional details about the service assembly step.
Fortunately, almost all Java microservice frameworks will include a runtime engine that can be packaged and deployed with the code. For instance, in the Spring Boot example in figure 2.7, you can use Maven and Spring Boot to build an executable Java jar file that has an embedded Tomcat engine built right into the JAR. In the following command-line example, you’re building the licensing service as an executable JAR and then starting the JAR file from the command-line:
mvn clean package && java –jar target/licensing-service-0.0.1-SNAPSHOT.jar
For certain operation teams, the concept of embedding a runtime environment right in the JAR file is a major shift in the way they think about deploying applications. In a traditional J2EE enterprise organization, an application is deployed to an application server. This model implies that the application server is an entity in and of itself and would often be managed by a team of system administrators who managed the configuration of the servers independently of the applications being deployed to them.
This separation of the application server configuration from the application introduces failure points in the deployment process, because in many organizations the configuration of the application servers isn’t kept under source control and is managed through a combination of the user interface and home-grown management scripts. It’s too easy for configuration drift to creep into the application server environment and suddenly cause what, on the surface, appear to be random outages.
The use of a single deployable artifact with the runtime engine embedded in the artifact eliminates many of these opportunities for configuration drift. It also allows you to put the whole artifact under source control and allows the application team to be able to better reason through how their application is built and deployed.
Service bootstrapping (step 2 in figure 2.6) occurs when the microservice is first starting up and needs to load its application configuration information. Figure 2.8 provides more context for the bootstrapping processing.
As any application developer knows, there will be times when you need to make the runtime behavior of the application configurable. Usually this involves reading your application configuration data from a property file deployed with the application or reading the data out of a data store such as a relational database.
Microservices often run into the same type of configuration requirements. The difference is that in microservice application running in the cloud, you might have hundreds or even thousands of microservice instances running. Further complicating this is that the services might be spread across the globe. With a high number of geographically dispersed services, it becomes unfeasible to redeploy your services to pick up new configuration data.
Storing the data in a data store external to the service solves this problem, but microservices in the cloud offer a set of unique challenges:
In chapter 3, I show how to manage your microservice application configuration data using things like a simple key-value data store.
From a microservice consumer perspective, a microservice should be location-transparent, because in a cloud-based environment, servers are ephemeral. Ephemeral means the servers that a service is hosted on usually have shorter lives then a service running in a corporate data center. Cloud-based services can be started and torn down quickly with an entirely new IP address assigned to the server on which the services are running.
By insisting that services are treated as short-lived disposable objects, microservice architectures can achieve a high-degree of scalability and availability by having multiple instances of a service running. Service demand and resiliency can be managed as quickly as the situation warrants. Each service has a unique and non-permanent IP address assigned to it. The downside to ephemeral services is that with services constantly coming up and down, managing a large pool of ephemeral services manually or by hand is an invitation to an outage.
A microservice instance needs to register itself with the third-party agent. This registration process is called service discovery (see step 3, service discovery, in figure 2.6; see figure 2.9 for details on this process). When a microservice instance registers with a service discovery agent, it will tell the discovery agent two things: the physical IP address or domain address of the service instance, and a logical name that an application can use to look up in a service. Certain service discovery agents will also require a URL back to the registering service that can be used by the service discovery agent to perform health checks.
The service client then communicates with the discovery agent to look up the service’s location.
A service discovery agent doesn’t act only as a traffic cop that guides the client to the location of the service. In a cloud-based microservice application, you’ll often have multiple instances of a service running. Sooner or later, one of those service instances will fail. The service discovery agent monitors the health of each service instance registered with it and removes any service instances from its routing tables to ensure that clients aren’t sent a service instance that has failed.
After a microservice has come up, the service discovery agent will continue to monitor and ping the health check interface to ensure that that service is available. This is step 4 in figure 2.6. Figure 2.10 provides context for this step.
By building a consistent health check interface, you can use cloud-based monitoring tools to detect problems and respond to them appropriately.
If the service discovery agent discovers a problem with a service instance, it can take corrective action such as shutting down the ailing instance or bringing additional service instances up.
In a microservices environment that uses REST, the simplest way to build a health check interface is to expose an HTTP end-point that can return a JSON payload and HTTP status code. In a non-Spring-Boot-based microservice, it’s often the developer’s responsibility to write an endpoint that will return the health of the service.
In Spring Boot, exposing an endpoint is trivial and involves nothing more than modifying your Maven build file to include the Spring Actuator module. Spring Actuator provides out-of-the-box operational endpoints that will help you understand and manage the health of your service. To use Spring Actuator, you need to make sure you include the following dependencies in your Maven build file:
<dependency>
  <groupId>org.springframework.boot</groupId>
  <artifactId>spring-boot-starter-actuator</artifactId>
</dependency>
If you hit the http://localhost:8080/health endpoint on the licensing service, you should see health data returned. Figure 2.11 provides an example of the data returned.
As you can see in figure 2.11, the health check can be more than an indicator of what’s up and down. It also can give information about the state of the server on which the microservice instance is running. This allows for a much richer monitoring experience.[2]
Spring Boot offers a significant number of options for customizing your health check. For more details on this, please check out the excellent book Spring Boot in Action (Manning Publications, 2015). Author Craig Walls gives an exhaustive overview of all the different mechanisms for configuring Spring Boot Actuators.
Microservices in the cloud seem deceptively simple. But to be successful with them, you need to have an integrated view that pulls the perspective of the architect, the developer, and DevOps engineer together into a cohesive vision. The key takeaways for each of these perspectives are
At one point or another, a developer will be forced to separate configuration information from their code. After all, it has been drilled into their heads since school that they shouldn’t hard-code values into the application code. Many developers will use a constants class file in their application to help centralize all their configuration in one place. Application configuration data written directly into the code is often problematic because every time a change to the configuration has to be made the application has to be recompiled and/or redeployed. To avoid this, developers will separate the configuration information from the application code completely. This makes it easy to make changes to configuration without going through a recompile process, but also introduces complexity because you now have another artifact that needs to be managed and deployed with the application.
Many developers will turn to the lowly property file (or YAML, JSON, or XML) to store their configuration information. This property file will sit out on a server often containing database and middleware connection information and metadata about the application that will drive the application’s behavior. Segregating your application into a property file is easy and most developers never do any more operationalization of their application configuration then placing their configuration file under source control (if that) and deploying it as part of their application.
This approach might work with a small number of applications, but it quickly falls apart when dealing with cloud-based applications that may contain hundreds of microservices, where each microservice in turn might have multiple service instances running.
Suddenly configuration management becomes a big deal as application and operations team in a cloud-based environment have to wrestle with a rat’s nest of which configuration files go where. Cloud-based microservices development emphasizes
This chapter will introduce you to the core principles and patterns needed to manage application configuration data in a cloud-based microservice application.
Managing application configuration is critical for microservices running in the cloud because microservice instances need to be launched quickly with minimal human intervention. Every time a human being needs to manually configure or touch a service to get it deployed is an opportunity for configuration drift, an unexpected outage and a lag-time in responding to scalability challenges with the application.
Let’s begin our discussion about application configuration management by establishing four principles we want to follow:
One of the key things to remember is that when you separate your configuration information outside of your actual code, you’re creating an external dependency that will need to be managed and version controlled. I can’t emphasize enough that the application configuration data needs to be tracked and version-controlled because mismanaged application configuration is a fertile breeding ground for difficult-to-detect bugs and unplanned outages.
I’ve experienced firsthand the dangers of not having a strategy for managing your application configuration data. While working at a Fortune 500 financial services company, I was asked to help bring a large WebSphere upgrade project back on track. The company in question had more than 120 applications on WebSphere and needed to upgrade their infrastructure from WebSphere 6 to WebSphere 7 before the entire application environment went end-of-life in terms of maintenance by the vendor.
The project had already been going on for a year and had only one out of 120 applications deployed. The project had cost a million dollars of effort in people and hardware costs, and with its current trajectory was on track to take another two years to finish the upgrade.
When I started working with the application team, one (and just one) of the major problems I uncovered was that the application team managed all their configuration for their databases and the endpoints for their services inside of property files. These property files were managed by hand and weren’t under source control. With 120 applications spread across four environments and multiple WebSphere nodes for each application, this rat’s nest of configuration files led to the team trying to migrate 12,000 configuration files that were spread across hundreds of servers and applications running on the server. (You’re reading that number right: 12,000.) These files were only for application configuration, not even application server configuration.
I convinced the project sponsor to take two months to consolidate all the application information down to a centralized, version-controlled configuration repository with 20 configuration files. When I asked the framework team how things got to the point where they had 12,000 configuration files, the lead engineer on the team said that originally they designed their configuration strategy around a small group of applications. However, the number of web applications built and deployed exploded over five years, and even though they begged for money and time to rework their configuration management approach, their business partners and IT leaders never considered it a priority.
Not spending the time up front to figure out how you’re going to do configuration management can have real (and costly) downstream impacts.
As you’ll remember from chapter 2, the loading of configuration management for a microservice occurs during the bootstrapping phase of the microservice. As a reminder, figure 3.1 shows the microservice lifecycle.
Let’s take the four principles we laid out earlier in section 3.1 (segregate, abstract, centralize, and harden) and see how these four principles apply when the service is bootstrapping. Figure 3.2 explores the bootstrapping process in more detail and shows how a configuration service plays a critical role in this step.
In figure 3.2, you see several activities taking place:
At this point we’ve worked through the conceptual architecture that illustrates the different pieces of a configuration management pattern and how these pieces fit together. We’re now going to move on to look at the different solutions for the pattern and then see a concrete implementation.
Fortunately, you can choose among a large number of battle-tested open source projects to implement a configuration management solution. Let’s look at several of the different choices available and compare them. Table 3.1 lays out these choices.
|
Project Name |
Description |
Characteristics |
|---|---|---|
| Etcd | Open source project written in Go. Used for service discovery and key-value management. Uses the raft (https://raft.github.io/) protocol for its distributed computing model. | Very fast and scalable Distributable Command-line driven Easy to use and setup |
| Eureka | Written by Netflix. Extremely battle-tested. Used for both service discovery and key-value management. | Distribute key-value store. Flexible; takes effort to set up Offers dynamic client refresh out of the box |
| Consul | Written by Hashicorp. Similar to Etcd and Eureka in features, but uses a different algorithm for its distributed computing model (SWIM protocol; https://www.cs.cornell.edu/~asdas/research/dsn02-swim.pdf). | Fast Offers native service discovery with the option to integrate directly with DNS Doesn’t offer client dynamic refresh right out of the box |
| ZooKeeper | An Apache project that offers distributed locking capabilities. Often used as a configuration management solution for accessing key-value data. | Oldest, most battle-tested of the solutions The most complex to use Can be used for configuration management, but should be considered only if you’re already using ZooKeeper in other pieces of your architecture |
| Spring Cloud configuration server | An open source project that offers a general configuration management solution with different back ends. It can integrate with Git, Eureka, and Consul as a back end. | Non-distributed key/value store Offers tight integration for Spring and non-Spring services Can use multiple back ends for storying configuration data including a shared filesystem, Eureka, Consul, and Git |
All the solutions in table 3.1 can easily be used to build a configuration management solution. For the examples in this chapter and throughout the rest of the book, you’ll use Spring Cloud configuration server. I chose this solution for several reasons, including the following:
For the rest of this chapter, you’re going to
The Spring Cloud configuration server is a REST-based application that’s built on top of Spring Boot. It doesn’t come as a standalone server. Instead, you can choose to either embed it in an existing Spring Boot application or start a new Spring Boot project with the server embedded it.
The first thing you need to do is set up a new project directory called confsvr. Inside the consvr directory you’ll create a new Maven file that will be used to pull down the JARs necessary to start up on your Spring Cloud configuration server. Rather than walk through the entire Maven file, I’ll list the key parts in the following listing.
In the Maven file in this previous listing, you start out by declaring the version of Spring Boot you’re going to use for your microservice (version 1.4.4). The next important part of the Maven definition is the Spring Cloud Configuration parent BOM (Bill of Materials) that you’re going to use. Spring Cloud is a massive collection of independent projects all moving with their own releases. This parent BOM contains all the third-party libraries and dependencies that are used in the cloud project and the version numbers of the individual projects that make up that version. In this example, you’re using version Camden.SR5 of Spring Cloud. By using the BOM definition, you can guarantee that you’re using compatible versions of the subprojects in Spring Cloud. It also means that you don’t have to declare version numbers for your sub-dependencies. The rest of the example in listing 3.1 deals with declaring the specific Spring Cloud dependencies that you’ll use in the service. The first dependency is the spring-cloud-starter-config dependency that’s used by all Spring Cloud projects. The second dependency is the spring-cloud-config-server starter project. This contains the core libraries for the spring-cloud-config-server.
Spring Cloud uses a non-traditional mechanism for labeling Maven projects. Spring Cloud is a collection of independent subprojects. The Spring Cloud team does their releases through what they call the “release train.” All the subprojects that make up Spring Cloud are packaged under one Maven bill of materials (BOM) and released as a whole. The Spring Cloud team has been using the name of London subway stops as the name of their releases, with each incrementing major release giving a London subway stop that has the next highest letter. There have been three releases: Angel, Brixton, and Camden. Camden is by far the newest release, but still has multiple release candidate branches for the subprojects within it.
One thing to note is that Spring Boot is released independently of the Spring Cloud release train. Therefore, different versions of Spring Boot are incompatible with different releases of Spring Cloud. You can see the version dependences between Spring Boot and Spring Cloud, along with the different subproject versions contained within the release train, by referring to the Spring Cloud website (http://projects.spring.io/spring-cloud/).
You still need to set up one more file to get the core configuration server up and running. This file is your application.yml file and is in the confsvr/src/main/resources directory. The application.yml file will tell your Spring Cloud configuration service what port to listen to and where to locate the back end that will serve up the configuration data.
You’re almost ready to bring up your Spring Cloud configuration service. You need to point the server to a back-end repository that will hold your configuration data. For this chapter, you’ll use the licensing service that you began to build in chapter 2 as an example of how to use Spring Cloud Config. To keep things simple, you’ll set up application configuration data for three environments: a default environment for when you run the service locally, a dev environment, and a production environment.
In Spring Cloud configuration, everything works off a hierarchy. Your application configuration is represented by the name of the application and then a property file for each environment you want to have configuration information for. In each of these environments, you’ll set up two configuration properties:
Figure 3.3 illustrates how you’ll set up and use the Spring Cloud configuration service. One thing to note is that as you build out your config service, it will be another microservice running in your environment. Once it’s set up, the contents of the service can be access via a http-based REST endpoint.
The naming convention for the application configuration files are appname-env.yml. As you can see from the diagram in figure 3.3, the environment names translate directly into the URLs that will be accessed to browse configuration information. Later, when you start the licensing microservice example, the environment you want to run the service against is specified by the Spring Boot profile that you pass in on the command-line service startup. If a profile isn’t passed in on the command line, Spring Boot will always default to the configuration data contained in the application.yml file packaged with the application.
Here’s an example of some of the application configuration data you’ll serve up for the licensing service. This is the data that will be contained within the confsvr/src/main/resources/config/licensingservice/licensingservice.yml file that was referred to in figure 3.3. Here’s part of the contents of this file:
tracer.property: "I AM THE DEFAULT"
spring.jpa.database: "POSTGRESQL"
spring.datasource.platform:  "postgres"
spring.jpa.show-sql: "true"
spring.database.driverClassName: "org.postgresql.Driver"
spring.datasource.url: "jdbc:postgresql://database:5432/eagle_eye_local"
spring.datasource.username: "postgres"

spring.datasource.password: "p0stgr@s"
spring.datasource.testWhileIdle: "true"
spring.datasource.validationQuery: "SELECT 1"
spring.jpa.properties.hibernate.dialect: "org.hibernate.dialect.PostgreSQLDialect"
I advise against using a filesystem-based solution for medium-to-large cloud applications. Using the filesystem approach means that you need to implement a shared file mount point for all cloud configuration servers that want to access the application configuration data. Setting up shared filesystem servers in the cloud is doable, but it puts the onus of maintaining this environment on you.
I’m showing the filesystem approach as the easiest example to use when getting your feet wet with Spring Cloud configuration server. In a later section, I’ll show how to configure Spring Cloud configuration server to use a cloud-based Git provider like Bitbucket or GitHub to store your application configuration.
Every Spring Cloud service covered in this book always needs a bootstrap class that will be used to launch the service. This bootstrap class will contain two things: a Java main() method that acts as the entry point for the Service to start in, and a set of Spring Cloud annotations that tell the starting service what kind of Spring Cloud behaviors it’s going to launch for the service.
The following listing shows the confsvr/src/main/java/com/thought mechanix/confsvr/Application.java class that’s used as the bootstrap class for your configuration service.
Next you’ll set up your Spring Cloud configuration server with our simplest example: the filesystem.
The Spring Cloud configuration server uses an entry in the confsvr/src/main/resources/application.yml file to point to the repository that will hold the application configuration data. Setting up a filesystem-based repository is the easiest way to accomplish this.
To do this, add the following information to the configuration server’s application.yml file. The following listing shows the contents of your Spring Cloud configuration server’s application.yml file.
In the configuration file in this listing, you started by telling the configuration server what port number it should listen to for all requests for configuration:
server:
   port: 8888
Because you’re using the filesystem for storing application configuration information, you need to tell Spring Cloud configuration server to run with the “native” profile:
profiles:
   active: native
The last piece in the application.yml file provides Spring Cloud configuration with the directory where the application data resides:
server:
   native:
      searchLocations: file:///Users/johncarnell1/book/spmia_code/chapter3-code/confsvr/src/main/resources/config
The important parameter in the configuration entry is the searchLocations attribute. This attribute provides a comma separated list of the directories for each application that’s going to have properties managed by the configuration server. In the previous example, you only have the licensing service configured.
Be aware that if you use the local filesystem version of Spring Cloud Config, you’ll need to modify the spring.cloud.config.server.native.searchLocations attribute to reflect your local file path when running your code locally.
You now have enough work done to start the configuration server. Go ahead and start the configuration server using the mvn spring-boot:run command. The server should now come up with the Spring Boot splash screen on the command line. If you point your browser over to http://localhost:8888/licensingservice/default, you’ll see JSON payload being returned with all of properties contained within the licensingservice.yml file. Figure 3.4 shows the results of calling this endpoint.
If you want to see the configuration information for the dev-based licensing service environment, hit the GET http://localhost:8888/licensingservice/dev endpoint. Figure 3.5 shows the result of calling this endpoint.
If you look closely, you’ll see that when you hit the dev endpoint, you’re returning back both the default configuration properties for the licensing service and the dev licensing service configuration. The reason why Spring Cloud configuration is returning both sets of configuration information is that the Spring framework implements a hierarchical mechanism for resolving properties. When the Spring Framework does property resolution, it will always look for the property in the default properties first and then override the default with an environment-specific value if one is present.
In concrete terms, if you define a property in the licensingservice.yml file and don’t define it in any of the other environment configuration files (for example, the licensingservice-dev.yml), the Spring framework will use the default value.
This isn’t the behavior you’ll see by directly calling the Spring Cloud configuration REST endpoint. The REST endpoint will return all configuration values for both the default and environment specific value that was called.
Let’s see how you can hook up the Spring Cloud configuration server to your licensing microservice.
In the previous chapter, you built a simple skeleton of your licensing service that did nothing more than return a hardcoded Java object representing a single licensing record from your database. In the next example, you’ll build out the licensing service and talk to a Postgres database holding your licensing data.
You’re going to communicate with the database using Spring Data and map your data from the licensing table to a POJO holding the data. Your database connection and a simple property are going to be read out of Spring Cloud configuration server. Figure 3.6 shows what’s going to happen between the licensing service and the Spring Cloud configuration service.
When the licensing service is first started, you’ll pass it via the command line two pieces of information: the Spring profile and the endpoint the licensing service should use to communicate with the Spring Cloud configuration service. The Spring profile value maps to the environment of the properties being retrieved for the Spring service. When the licensing service first boots up, it will contact the Spring Cloud Config service via an endpoint built from the Spring profile passed into it. The Spring Cloud Config service will then use the configured back end config repository (filesystem, Git, Consul, Eureka) to retrieve the configuration information specific to the Spring profile value passed in on the URI. The appropriate property values are then passed back to the licensing service. The Spring Boot framework will then inject these values into the appropriate parts of the application.
Let’s change our focus from the configuration server to the licensing service. The first thing you need to do is add a couple of more entries to the Maven file in your licensing service. The entries that need to be added are shown in the following listing.
The first and second dependencies, spring-boot-starter-data-jpa and PostgreSQL, import the Spring Data Java Persistence API (JPA) and the Postgres JDBC drivers. The last dependency, the spring-cloud-config-client, contains all the classes needed to interact with the Spring Cloud configuration server.
After the Maven dependencies have been defined, you need to tell the licensing service where to contact the Spring Cloud configuration server. In a Spring Boot service that uses Spring Cloud Config, configuration information can be set in one of two configuration files: bootstrap.yml and application.yml.
The bootstrap.yml file reads the application properties before any other configuration information used. In general, the bootstrap.yml file contains the application name for the service, the application profile, and the URI to connect to a Spring Cloud Config server. Any other configuration information that you want to keep local to the service (and not stored in Spring Cloud Config) can be set locally in the services in the application.yml file. Usually, the information you store in the application.yml file is configuration data that you might want to have available to a service even if the Spring Cloud Config service is unavailable. Both the bootstrap.yml and application.yml files are stored in a projects src/main/resources directory.
To have the licensing service communicate with your Spring Cloud Config service, you need to add a licensing-service/src/main/resources/bootstrap.yml file and set three properties: spring.application.name, spring.profiles.active, and spring.cloud.config.uri.
The licensing services bootstrap.yml file is shown in the following listing.
The Spring Boot applications support two mechanisms to define a property: YAML (Yet another Markup Language) and a “.” separated property name. We chose YAML (Yet Another Markup Language) as the means for configuring our application. The hierarchical format of YAML property values map directly to the spring.application.name, spring.profiles.active, and spring.cloud.config.uri names.
The spring.application.name is the name of your application (for example, licensingservice) and must map directly to the name of the directory within your Spring Cloud configuration server. For the licensing service, you want a directory on the Spring Cloud configuration server called licensingservice.
The second property, the spring.profiles.active, is used to tell Spring Boot what profile the application should run as. A profile is a mechanism to differentiate the configuration data consumed by the Spring Boot application. For the licensing service’s profile, you’ll support the environment the service is going to map directly to in your cloud configuration environment. For instance, by passing in dev as our profile, the Spring Cloud config server will use the dev properties. If you set a profile, the licensing service will use the default profile.
The third and last property, the spring.cloud.config.uri, is the location where the licensing service should look for the Spring Cloud configuration server endpoint. By default, the licensing service will look for the configuration server at http://localhost:8888. Later in the chapter you’ll see how to override the different properties defined in the boostrap.yml and application.yml files on application startup. This will allow you to tell the licensing microservice which environment it should be running in.
Now, if you bring up the Spring Cloud configuration service, with the corresponding Postgres database running on your local machine, you can launch the licensing service using its default profile. This is done by changing to the licensing-services directory and issuing the following commands:
mvn spring-boot: run
By running this command without any properties set, the licensing server will automatically attempt to connect to the Spring Cloud configuration server using the endpoint (http://localhost:8888) and the active profile (default) defined in the bootstrap.yml file of the licensing service.
If you want to override these default values and point to another environment, you can do this by compiling the licensingservice project down to a JAR and then run the JAR with a -D system property override. The following command line call demonstrates how to launch the licensing service with a non-default profile:
java  -Dspring.cloud.config.uri=http://localhost:8888 \
      -Dspring.profiles.active=dev \
      -jar target/licensing-service-0.0.1-SNAPSHOT.jar
With the previous command line, you’re overriding the two parameters: spring.cloud.config.uri and spring.profiles.active. With the -Dspring.cloud.config.uri=http://localhost:8888 system property, you’re pointing to a configuration server running away from your local box.
If you try to run the licensing service downloaded from the GitHub repository (https://github.com/carnellj/spmia-chapter3) from your desktop using the previous Java command, it will fail because you don’t have a desktop Postgres server running and the source code in the GitHub repository is using encryption on the config server. We’ll cover using encryption later in the chapter. The previous example demonstrates how to override Spring properties via the command line.
With the –Dspring.profiles.active=dev system property, you’re telling the licensing service to use the dev profile (read from the configuration server) to connect to a dev instance of a database.
In the examples you’re hard-coding the values to pass in to the –D parameter values. In the cloud, most of the application config data you need will be in your configuration server. However, for the information you need to start your service (such as the data for the configuration server), you’d start the VM instance or Docker container and pass in an environment variable.
All the code examples for each chapter can be completely run from within Docker containers. With Docker, you simulate different environments through environment-specific Docker-compose files that orchestrate the startup of all of your services. Environment-specific values needed by the containers are passed in as environment variables to the container. For example, to start your licensing service in a dev environment, the docker/dev/docker-compose.yml file contains the following entry for the licensing-service:
The environment entry in the file contains the values of two variables PROFILE, which is the Spring Boot profile the licensing service is going to run under. The CONFIGSERVER_URI is passed to your licensing service and defines the Spring Cloud configuration server instance the service is going to read its configuration data from.
In your startup scripts that are run by the container, you then pass these environment variables as –D parameters to our JVMS starting the application. In each project, you bake a Docker container, and that Docker container uses a startup script that starts the software in the container. For the licensing service, the startup script that gets baked into the container can be found at licensing-service/src/main/docker/run.sh. In the run.sh script, the following entry starts your licensing-service JVM:
echo "********************************************************"
echo "Starting License Server with Configuration Service :  $CONFIGSERVER_URI";
echo "********************************************************"
java -Dspring.cloud.config.uri=$CONFIGSERVER_URI
-Dspring.profiles.active=$PROFILE -jar /usr/local/licensingservice/licensing-service-0.0.1-SNAPSHOT.jar
Because you enhance all your services with introspection capabilities via Spring Boot Actuator, you can confirm the environment you are running against by hitting http://localhost:8080/env. The /env endpoint will provide a complete list of the configuration information about the service, including the properties and endpoints the service has booted with, as shown in figure 3.7.
The key thing to note from figure 3.7 is that the active profile for the licensing service is dev. By inspecting the returned JSON, you can also see that the Postgres database being returned is a development URI of jdbc:postgresql://database:5432/eagle_eye_dev.
Every organization is going to have different rules about how to implement security around their services. Many organizations believe services shouldn’t broadcast any information about themselves and won’t allow things like a /env endpoint to be active on a service as they believe (rightfully so) that this will provide too much information for a potential hacker. Spring Boot provides a wealth of capabilities on how to configure what information is returned by the Spring Actuators endpoints that are the outside the scope of this book. Craig Walls’ excellent book, Spring Boot in Action, covers this subject in detail, and I highly recommend that you review your corporate security policies and Walls’ book to provide the right level of detail you want exposed through Spring Actuator.
At this point, you have the database configuration information being directly injected into your microservice. With the database configuration set, configuring your licensing microservice becomes an exercise in using standard Spring components to build and retrieve the data from the Postgres database. The licensing service has been refactored into different classes with each class having separate responsibilities. These classes are shown in table 3.2.
|
Class Name |
Location |
|---|---|
| License | licensing-service/src/main/java/com/thoughtmechanix/licenses/model |
| LicenseRepository | licensing-service/src/main/java/com/thoughtmechanix/licenses/repository |
| LicenseService | licensing-service/src/main/java/com/thoughtmechanix/licenses/services |
The License class is the model class that will hold the data retrieved from your licensing database. The following listing shows the code for the License class.
The class uses several Java Persistence Annotations (JPA) that help the Spring Data framework map the data from the licenses table in the Postgres database to the Java object. The @Entity annotation lets Spring know that this Java POJO is going to be mapping objects that will hold data. The @Table annotation tells Spring/JPA what database table should be mapped. The @Id annotation identifies the primary key for the database. Finally, each one of the columns from the database that is going to be mapped to individual properties is marked with a @Column attribute.
The Spring Data and JPA framework provides your basic CRUD methods for accessing a database. If you want to build methods beyond that, you can use a Spring Data Repository interface and basic naming conventions to build those methods. Spring will at startup parse the name of the methods from the Repository interface, convert them over to a SQL statement based on the names, and then generate a dynamic proxy class under the covers to do the work. The repository for the licensing service is shown in the following listing.
The repository interface, LicenseRepository, is marked with the @Repository annotation which tells Spring that it should treat this interface as a repository and generate a dynamic proxy for it. Spring offers different types of repositories for data access. You’ve chosen to use the Spring CrudRepository base class to extend your LicenseRepository class. The CrudRepository base class contains basic CRUD methods. In addition to the CRUD method extended from CrudRepository, you’ve added two custom query methods for retrieving data from the licensing table. The Spring Data framework will pull apart the name of the methods to build a query to access the underlying data.
The Spring Data framework provides an abstraction layer over various database platforms and isn’t limited to relational databases. NoSQL databases such as MongoDB and Cassandra are also supported.
Unlike the previous incarnation of the licensing service in chapter 2, you’ve now separated the business and data access logic for the licensing service out of the LicenseController and into a standalone Service class called LicenseService.
package com.thoughtmechanix.licenses.services;

import com.thoughtmechanix.licenses.config.ServiceConfig;
import com.thoughtmechanix.licenses.model.License;
import com.thoughtmechanix.licenses.repository.LicenseRepository;
import org.springframework.beans.factory.annotation.Autowired;
import org.springframework.stereotype.Service;

import java.util.List;
import java.util.UUID;

@Service
public class LicenseService {

    @Autowired
    private LicenseRepository licenseRepository;

    @Autowired
    ServiceConfig config;

    public License getLicense(String organizationId,String licenseId) {
        License license = licenseRepository.findByOrganizationIdAndLicenseId(
organizationId, licenseId);
        return license.withComment(config.getExampleProperty());
    }

    public List<License> getLicensesByOrg(String organizationId){
        return licenseRepository.findByOrganizationId( organizationId );
    }

    public void saveLicense(License license){
        license.withId( UUID.randomUUID().toString());
        licenseRepository.save(license);
    }
      /*Rest of the code removed for conciseness*/
}
The controller, service, and repository classes are wired together using the standard Spring @Autowired annotation.
In the LicenseService class in the previous section, you might have noticed that you’re setting the license.withComment() value in the getLicense() code with a value from the config.getExampleProperty() class. The code being referred to is shown here:
public License getLicense(String organizationId,String licenseId) {
       License license = licenseRepository.findByOrganizationIdAndLicenseId(
organizationId, licenseId);
return license.withComment(config.getExampleProperty());
    }
If you look at the licensing-service/src/main/java/com/thoughtmechanix/licenses/config/ServiceConfig.java class, you’ll see a property annotated with the @Value annotation. The following listing shows the @Value annotation being used.
package com.thoughtmechanix.licenses.config;

import org.springframework.beans.factory.annotation.Value;
import org.springframework.stereotype.Component;

@Component
public class ServiceConfig{

  @Value("${example.property}")
  private String exampleProperty;

  public String getExampleProperty(){
    return exampleProperty;
  }
}
While Spring Data “auto-magically” injects the configuration data for the database into a database connection object, all other properties must be injected using the @Value annotation. With the previous example, the @Value annotation pulls the example.property from the Spring Cloud configuration server and injects it into the example.property attribute on the ServiceConfig class.
While it’s possible to directly inject configuration values into properties in individual classes, I’ve found it useful to centralize all of the configuration information into a single configuration class and then inject the configuration class into where it’s needed.
As mentioned earlier, using a filesystem as the backend repository for Spring Cloud configuration server can be impractical for a cloud-based application because the development team has to set up and manage a shared filesystem that’s mounted on all instances of the Cloud configuration server.
Spring Cloud configuration server integrates with different backend repositories that can be used to host application configuration properties. One I’ve used successfully is to use Spring Cloud configuration server with a Git source control repository.
By using Git you can get all the benefits of putting your configuration management properties under source control and provide an easy mechanism to integrate the deployment of your property configuration files in your build and deployment pipeline.
To use Git, you’d swap out the filesystem back configuration in the configuration service’s bootstrap.yml file with the following listing’s configuration.
The three key pieces of configuration in the previous example are the spring.cloud.config.server, spring.cloud.config.server.git.uri, and the spring.cloud.config.server.git.searchPaths properties. The spring.cloud.config.server property tells the Spring Cloud configuration server to use a non-filesystem-based backend repository. In the previous example you’re going to connect to the cloud-based Git repository, GitHub.
The spring.cloud.config.server.git.uri properties provide the URL of the repository you’re connecting to. Finally, the spring.cloud.config.server.git.searchPaths property tells the Spring Cloud Config server the relative paths on the Git repository that should be searched when the Cloud configuration server comes up. Like the filesystem version of the configuration, the value in the spring.cloud.config.server.git.seachPaths attribute will be a comma-s-eparated list for each service hosted by the configuration service.
One of the first questions that comes up from development teams when they want to use the Spring Cloud configuration server is how can they dynamically refresh their applications when a property changes. The Spring Cloud configuration server will always serve the latest version of a property. Changes made to a property via its underlying repository will be up-to-date.
However, Spring Boot applications will only read their properties at startup time, so property changes made in the Spring Cloud configuration server won’t be automatically picked up by the Spring Boot application. Spring Boot Actuator does offer a @RefreshScope annotation that will allow a development team to access a /refresh endpoint that will force the Spring Boot application to reread its application configuration. The following listing shows the @RefreshScope annotation in action.
package com.thoughtmechanix.licenses;

import org.springframework.boot.SpringApplication;
import org.springframework.boot.autoconfigure.SpringBootApplication;
import org.springframework.cloud.context.config.annotation.RefreshScope;


@SpringBootApplication
@RefreshScope
public class Application {
    public static void main(String[] args) {
        SpringApplication.run(Application.class, args);
    }
}
Note a couple of things about the @RefreshScope annotation. First, the annotation will only reload the custom Spring properties you have in your application configuration. Items such as your database configuration that are used by Spring Data won’t be reloaded by the @RefreshScope annotation. To perform the refresh, you can hit the http://<yourserver>:8080/refresh endpoint.
When using Spring Cloud configuration service with microservices, one thing you need to consider before you dynamically change properties is that you might have multiple instances of the same service running, and you’ll need to refresh all of those services with their new application configurations. There are several ways you can approach this problem:
Spring Cloud configuration service does offer a “push”-based mechanism called Spring Cloud Bus that will allow the Spring Cloud configuration server to publish to all the clients using the service that a change has occurred. Spring Cloud configuration requires an extra piece of middleware running (RabbitMQ). This is an extremely useful means of detecting changes, but not all Spring Cloud configuration backends support the “push” mechanism (that is, the Consul server).
In the next chapter you’ll use Spring Service Discovery and Eureka to register all instances of a service. One technique I’ve used to handle application configuration refresh events is to refresh the application properties in Spring Cloud configuration and then write a simple script to query the service discovery engine to find all instances of a service and call the /refresh endpoint directly.
Finally, you can restart all the servers or containers to pick up the new property. This is a trivial exercise, especially if you’re running your services in a container service such as Docker. Restarting Docker containers literally takes seconds and will force a reread of the application configuration.
Remember, cloud-based servers are ephemeral. Don’t be afraid to start new instances of a service with their new configuration, direct traffic to the new services, and then tear down the old ones.
By default, Spring Cloud configuration server stores all properties in plain text within the application’s configuration files. This includes sensitive information such as database credentials.
It’s an extremely poor practice to keep sensitive credentials stored as plain text in your source code repository. Unfortunately, it happens far more often than you think. Spring Cloud Config does give you the ability to encrypt your sensitive properties easily. Spring Cloud Config supports using both symmetric (shared secret) and asymmetric encryption (public/private key).
We’re going to see how to set up your Spring Cloud configuration server to use encryption using with a symmetric key. To do this you’ll need to
To begin, you need to download and install Oracle’s Unlimited Strength Java Cryptography Extension (JCE). This isn’t available through Maven and must be downloaded from Oracle Corporation.[1] Once you’ve downloaded the zip files containing the JCE jars, you must do the following:
http://www.oracle.com/technetwork/java/javase/downloads/jce8-download-2133166.html. This URL might be subject to change. A quick search on Google for Java Cryptography Extensions should always return you the right values.
I’ve walked through the manual steps you need to install JCE on your laptop. Because we use Docker to build all our services as Docker containers, I’ve scripted the download and installation of these JAR files in the Spring Cloud Config Docker container. The following OS X shell script snippet shows how I automated this using the curl (https://curl.haxx.se/) command-line tool:
cd /tmp/
curl –k-LO "http://download.oracle.com/otn-pub/java/jce/8/jce_policy-8.zip"
     -H 'Cookie: oraclelicense=accept-securebackup-cookie' &&  unzip jce_policy-8.zip
rm jce_policy-8.zip
yes |cp -v /tmp/UnlimitedJCEPolicyJDK8/*.jar /usr/lib/jvm/java-1.8-openjdk/jre/lib/security/
I’m not going to walk through all of the details, but basically I use CURL to download the JCE zip files (note the Cookie header parameter passed via the -H attribute on the curl command) and then unzip the files and copy them to the /usr/lib/jvm/java-1.8-openjdk/jre/lib/security directory in my Docker container.
If you look at the src/main/docker/Dockerfile file in the source code for this chapter, you can see an example of this scripting in action.
Once the JAR files are in place, you need to set a symmetric encryption key. The symmetric encryption key is nothing more than a shared secret that’s used by the encrypter to encrypt a value and the decrypter to decrypt a value. With the Spring Cloud configuration server, the symmetric encryption key is a string of characters you select that’s passed to the service via an operating system environment variable called ENCRYPT_KEY. For the purposes of this book you’ll always set the ENCRYPT_KEY environment variable to be
export ENCRYPT_KEY=IMSYMMETRIC
Note two things regarding symmetric keys:
For the purposes of this book, I did two things that I wouldn’t normally recommend in a production deployment:
You’re now ready to begin encrypting properties for use in Spring Cloud Config. You’ll encrypt the licensing services Postgres database password you’ve been using to access EagleEye data. This property, called spring.datasource.password, is currently set as plain text to be the value p0stgr@s.
When you fire up your Spring Cloud Config instance, Spring Cloud Config detects that the ENCRYPT_KEY environment variable is set and automatically adds two new endpoints (/encrypt and /decrypt) to the Spring Cloud Config service. You’ll use the /encrypt endpoint to encrypt the p0stgr@s value.
Figure 3.8 shows how to encrypt the p0stgr@s value using the /encrypt endpoint and POSTMAN. Please note that whenever you call the /encrypt or /decrypt endpoints, you need to make sure you do a POST to these endpoints.
If you wanted to decrypt the value, you’d use the /decrypt endpoint passing in the encrypted string in the call.
You can now add the encrypted property to your GitHub or filesystem-based configuration file for the licensing service using the following syntax:
spring.datasource.password:"{cipher} 858201e10fe3c9513e1d28b33ff417a66e8c8411dcff3077c53cf53d8a1be360"
Spring Cloud configuration server requires all encrypted properties to be prepended with a value of {cipher}. The {cipher} value tells Spring Cloud configuration server it’s dealing with an encrypted value. Fire up your Spring Cloud configuration server and hit the GET http://localhost:8888/licensingservice/default endpoint.
Figure 3.9 shows the results of this call.
You’ve made the spring.datasource.password more secure by encrypting the property, but you still have a problem. The database password is exposed as plain text when you hit the http://localhost:8888/licensingservice/default endpoint.
By default, Spring Cloud Config will do all the property decryption on the server and pass the results back to the applications consuming the properties as plain, unencrypted text. However, you can tell Spring Cloud Config to not decrypt on the server and make it the responsibility of the application retrieving the configuration data to decrypt the encrypted properties.
To enable client side decryption of properties, you need to do three things:
The first thing you need to do is disable the server-side decryption of properties in Spring Cloud Config. This is done by setting the Spring Cloud Config’s src/main/resources/application.yml file to set the property spring.cloud.config.server.encrypt.enabled: false. That’s all you have to do on the Spring Cloud Config server.
Because the licensing service is now responsible for decrypting the encrypted properties, you need to first set the symmetric key on the licensing service by making sure that the ENCRYPT_KEY environment variable is set with the same symmetric key (for example, IMSYMMETRIC) that you used with your Spring Cloud Config server.
Next you need to include the spring-security-rsa JAR dependencies in with licensing service:
<dependency>
   <groupId>org.springframework.security</groupId>
   <artifactId>spring-security-rsa</artifactId>
</dependency>
These JAR files contain the Spring code needed to decrypt the encrypted properties being retrieved from Spring Cloud Config. With these changes in place, you can start the Spring Cloud Config and licensing services. If you hit the http://localhost:8888/licensingservice/default endpoint you’ll see the spring.datasource.password returned in it is encrypted form. Figure 3.10 shows the output from the call.
Application configuration management might seem like a mundane topic, but it’s of critical importance in a cloud-based environment. As we’ll discuss in more detail in later chapters, it’s critical that your applications and the servers they run on be immutable and that the entire server being promoted is never manually configured between environments. This flies in the face of traditional deployment models where you deploy an application artifact (for example, a JAR or WAR file) along with its property files to a “fixed” environment.
With a cloud-based model, the application configuration data should be segregated completely from the application, with the appropriate configuration data needs injected at runtime so that the same server/application artifact are consistently promoted through all environments.
In any distributed architecture, we need to find the physical address of where a machine is located. This concept has been around since the beginning of distributed computing and is known formally as service discovery. Service discovery can be something as simple as maintaining a property file with the addresses of all the remote services used by an application, or something as formalized (and complicated) as a UDDI (Universal Description, Discovery, and Integration) repository.[1]
Service discovery is critical to microservice, cloud-based applications for two key reasons. First, it offers the application team the ability to quickly horizontally scale up and down the number of service instances running in an environment. The service consumers are abstracted away from the physical location of the service via service discovery. Because the service consumers don’t know the physical location of the actual service instances, new service instances can be added or removed from the pool of available services.
This ability to quickly scale services without disrupting the service consumers is an extremely powerful concept, because it moves a development team used to building monolithic, single-tenant (for example, one customer) applications away from thinking about scaling only in terms of adding bigger, better hardware (vertical scaling) to the more powerful approach to scaling by adding more servers (horizontal scaling).
A monolithic approach usually drives development teams down the path of over-buying their capacity needs. Capacity increases come in clumps and spikes and are rarely a smooth steady path. Microservices allow us to scale up/down new service instances. Service discovery helps abstract that these deployments are occurring away from the service consumer.
The second benefit of service discovery is that it helps increase application resiliency. When a microservice instance becomes unhealthy or unavailable, most service discovery engines will remove that instance from its internal list of available services. The damage caused by a down service will be minimized because the service discovery engine will route services around the unavailable service.
We’ve gone through the benefits of service discovery, but what’s the big deal about it? After all, can’t we use tried-and-true methods such as DNS (Domain Name Service) or a load balancer to help facilitate service discovery? Let’s walk through why that won’t work with a microservices-based application, particularly one that’s running in the cloud.
Whenever you have an application calling resources spread across multiple servers, it needs to locate the physical location of those resource. In the non-cloud world, this service location resolution was often solved through a combination of DNS and a network load balancer. Figure 4.1 illustrates this model.
An application needs to invoke a service located in another part of the organization. It attempts to invoke the service by using a generic DNS name along with a path that uniquely represents the service that the application was trying to invoke. The DNS name would resolve to a commercial load balancer, such as the popular F5 load balancer (http://f5.com) or an open source load balancer such as HAProxy (http://haproxy.org).
The load balancer, upon receiving the request from the service consumer, locates the physical address entry in a routing table based on the path the user was trying to access. This routing table entry contains a list of one or more servers hosting the service. The load balancer then picks one of the servers in the list and forwards the request onto that server.
Each instance of a service is deployed to one or more application servers. The number of these application servers was often static (for example, the number of application servers hosting a service didn’t go up and down) and persistent (for example, if a server running an application server crashed, it would be restored to the same state it was at the time of the crash, and would have the same IP and configuration that it had previously.)
To achieve a form of high availability, a secondary load balancer is sitting idle and pinging the primary load balancer to see if it’s alive. If it isn’t alive, the secondary load balancer becomes active, taking over the IP address of the primary load balancer and beginning serving requests.
While this type of model works well with applications running inside of the four walls of a corporate data center and with a relatively small number of services running on a group of static servers, it doesn’t work well for cloud-based microservice applications. Reasons for this include
These four reasons aren’t a general indictment of load balancers. They work well in a corporate environment where the size and scale of most applications can be handled through a centralized network infrastructure. In addition, load balancers still have a role to play in terms of centralizing SSL termination and managing service port security. A load balancer can lock down inbound (ingress) and outbound (egress) port access to all the servers sitting behind it. This concept of least network access is often a critical component when trying to meet industry-standard certification requirements such as PCI (Payment Card Industry) compliance.
However, in the cloud where you have to deal with massive amounts of transactions and redundancy, a centralized piece of network infrastructure doesn’t ultimately work as well because it doesn’t scale effectively and isn’t cost-efficient. Let’s now look at how you can implement a robust-service discovery mechanism for cloud-based applications.
The solution for a cloud-based microservice environment is to use a service-discovery mechanism that’s
In the following section(s) we’re going to
To begin our discussion around service discovery architecture, we need to understand four concepts. These general concepts are shared across all service discovery implementations:
Figure 4.2 shows the flow of these four bullets and what typically occurs in a service discovery pattern implementation.
In figure 4.2, one or more service discovery nodes have been started. These service discovery instances are usually unique and don’t have a load balancer that sits in front of them.
As service instances start up, they’ll register their physical location, path, and port that they can be accessed by with one or more service discovery instances. While each instance of a service will have a unique IP address and port, each service instance that comes up will register under the same service ID. A service ID is nothing more than a key that uniquely identifies a group of the same service instances.
A service will usually only register with one service discovery service instance. Most service discovery implementations use a peer-to-peer model of data propagation where the data around each service instance is communicated to all the other nodes in the cluster.
Depending on the service discovery implementation, the propagation mechanism might use a hard-coded list of services to propagate to or use a multi-casting protocol like the “gossip”[2] or “infection-style”[3] protocol to allow other nodes to “discover” changes in the cluster.
Finally, each service instance will push to or have pulled from its status by the service discovery service. Any services failing to return a good health check will be removed from the pool of available service instances.
Once a service has registered with a service discovery service, it’s ready to be used by an application or service that needs to use its capabilities. Different models exist for a client to “discover” a service. A client can rely solely on the service discovery engine to resolve service locations each time a service is called. With this approach, the service discovery engine will be invoked every time a call to a registered microservice instance is made. Unfortunately, this approach is brittle because the service client is completely dependent on the service discovery engine to be running to find and invoke a service.
A more robust approach is to use what’s called client-side load balancing.[4] Figure 4.3 illustrates this approach.
In this model, when a consuming actor needs to invoke a service
Let’s now take the generic service discovery pattern and apply it to your EagleEye problem domain.
Now you’re going to implement service discovery by setting up a service discovery agent and then registering two services with the agent. You’ll then have one service call another service by using the information retrieved by service discovery. Spring Cloud offers multiple methods for looking up information from a service discovery agent. We’ll also walk through the strengths and weakness of each approach.
Once again, the Spring Cloud project makes this type of setup trivial to undertake. You’ll use Spring Cloud and Netflix’s Eureka service discovery engine to implement your service discovery pattern. For the client-side load balancing you’ll use Spring Cloud and Netflix’s Ribbon libraries.
In the previous two chapters, you kept your licensing service simple and included the organization name for the licenses with the license data. In this chapter, you’ll break the organization information into its own service.
When the licensing service is invoked, it will call the organization service to retrieve the organization information associated with the designated organization ID. The actual resolution of the organization service’s location will be held in a service discovery registry. For this example, you’ll register two instances of the organization service with a service discovery registry and then use client-side load balancing to look up and cache the registry in each service instance. Figure 4.4 shows this arrangement:
Any new organization services instance will now be visible to the licensing service locally, while any non-healthy instances will be removed from the local cache.
Next, you’ll implement this design by setting up your Spring Cloud Eureka service.
In this section, you’ll set up our Eureka service using Spring Boot. Like the Spring Cloud configuration service, setting up a Spring Cloud Eureka Service starts with building a new Spring Boot project and applying annotations and configurations. Let’s begin with your maven pom.xml.[5] The following listing shows the Eureka service dependencies you’ll need for the Spring Boot project you’re setting up.
All source code in this chapter can be downloaded from GitHub (https://github.com/carnellj/spmia-chapter4). The Eureka service is in the chapter 4/eurekasvr example. All services in this chapter were built using Docker and Docker Compose so they can be brought up in a single instance.
You’ll then need to set up the src/main/resources/application.yml file with the configuration needed to set up the Eureka service running in standalone mode (for example, no other nodes in the cluster), as shown in the next listing.
The key properties being set are the server.port attribute that sets the default port used for the Eureka service. The eureka.client.registerWithEureka attribute tells the service not to register with a Eureka service when the Spring Boot Eureka application starts because this is the Eureka service. The eureka.client.fetchRegistry attribute is set to false so that when the Eureka service starts, it doesn’t try to cache its registry information locally. When running a Eureka client, you’ll want to change this value for the Spring Boot services that are going to register with Eureka.
You’ll notice that the last attribute, eureka.server.waitTimeInMsWhenSync Empty, is commented out. When you’re testing your service locally you should uncomment this line because Eureka won’t immediately advertise any services that register with it. It will wait five minutes by default to give all of the services a chance to register with it before advertising them. Uncommenting this line for local testing will help speed up the amount of time it will take for the Eureka service to start and show services registered with it.
Individual services registering will take up to 30 seconds to show up in the Eureka service because Eureka requires three consecutive heartbeat pings from the service spaced 10 seconds apart before it will say the service is ready for use. Keep this in mind as you’re deploying and testing your own services.
The last piece of setup work you’re going to do in setting up your Eureka service is adding an annotation to the application bootstrap class you’re using to start your Eureka service. For the Eureka service, the application bootstrap class can be found in the src/main/java/com/thoughtmechanix/eurekasvr/EurekaServer-Application.java class. The following listing shows where to add your annotations.
You use only one new annotation to tell your service to be a Eureka service; that’s @EnableEurekaServer. At this point you can start up the Eureka service by running the mvn spring-boot:run or run docker-compose (see appendix A) to start the service. Once this command is run, you should have a running Eureka service with no services registered in it. Next you’ll build out the organization service and register it with your Eureka service.
At this point you have a Spring-based Eureka server up and running. In this section, you’ll configure your organization and licensing services to register themselves with your Eureka server. This work is done in preparation for having a service client look up a service from your Eureka registry. By the time you’re done with this section, you should have a firm understanding of how to register a Spring Boot microservice with Eureka.
Registering a Spring Boot-based microservice with Eureka is an extremely simple exercise. For the purposes of this chapter, we’re not going to walk through all of the Java code involved with writing the service (we purposely kept that amount of code small), but instead focus on registering the service with the Eureka service registry you created in the previous section.
The first thing you need to do is add the Spring Eureka dependency to your organization service’s pom.xml file:
The only new library that’s being used is the spring-cloud-starter-eureka library. The spring-cloud-starter-eureka artifact holds the jar files that Spring Cloud will use to interact with your Eureka service.
After you’ve set up your pom.xml file, you need to tell Spring Boot to register the organization service with Eureka. This registration is done via additional configuration in the organization service’s src/main/java/resources/application.yml file, as shown in the following listing.
Every service registered with Eureka will have two components associated with it: the application ID and the instance ID. The application ID is used to represent a group service instance. In a Spring-Boot-based microservice, the application ID will always be the value set by the spring.application.name property. For your organization service, your spring.application.name is creatively named organizationservice. The instance ID will be a random number meant to represent a single service instance.
Remember that normally the spring.application.name property goes in the bootstrap.yml file. I’ve included it in the application.yml for illustrative purposes. The code will work with the spring.application.name but the proper place long-term for this attribute is the bootstrap.yml file.
The second part of your configuration provides how and where the service should register with the Eureka service. The eureka.instance.preferIpAddress property tells Eureka that you want to register the service’s IP address to Eureka rather than its hostname.
By default, Eureka will try to register the services that contact it by hostname. This works well in a server-based environment where a service is assigned a DNS-backed host name. However, in a container-based deployment (for example, Docker), containers will be started with randomly generated hostnames and no DNS entries for the containers.
If you don’t set the eureka.instance.preferIpAddress to true, your client applications won’t properly resolve the location of the hostnames because there will be no DNS entry for that container. Setting the preferIpAddress attribute will inform the Eureka service that client wants to be advertised by IP address.
Personally, we always set this attribute to true. Cloud-based microservices are supposed to be ephemeral and stateless. They can be started up and shut down at will. IP addresses are more appropriate for these types of services.
The eureka.client.registerWithEureka attribute is the trigger to tell the organization service to register itself with Eureka. The eureka.client.fetchRegistry attribute is used to tell the Spring Eureka Client to fetch a local copy of the registry. Setting this attribute to true will cache the registry locally instead of calling the Eureka service with every lookup. Every 30 seconds, the client software will re-contact the Eureka service for any changes to the registry.
The last attribute, the eureka.serviceUrl.defaultZone attribute, holds a comma-separated list of Eureka services the client will use to resolve to service locations. For our purposes, you’re only going to have one Eureka service.
Setting up multiple URL services isn’t enough for high availability. The eureka.serviceUrl.defaultZone attribute only provides a list of Eureka services for the client to communicate with. You also need to set up the Eureka services to replicate the contents of their registry with each other.
A group of Eureka registries communicate with each other using a peer-to-peer communication model where each Eureka service has to be configured to know about the other nodes in the cluster. Setting up a Eureka cluster is outside of the scope of this book. If you’re interested in setting up a Eureka cluster, please visit the Spring Cloud project’s website for further information.[6]
At this point you’ll have a single service registered with your Eureka service.
You can use Eureka’s REST API to see the contents of the registry. To see all the instances of a service, hit the following GET endpoint:
http://<eureka service>:8761/eureka/apps/<APPID>
For instance, to see the organization service in the registry you can call http://-localhost:8761/eureka/apps/organizationservice.
The default format returned by the Eureka service is XML. Eureka can also return the data in figure 4.5 as a JSON payload, but you have to set the Accept HTTP header to be application/json. An example of the JSON payload is shown in figure 4.6.
When a service registers with Eureka, Eureka will wait for three successive health checks over the course of 30 seconds before the service becomes available via a Eureka. This warm-up period throws developers off because they think that Eureka hasn’t registered their services if they try to call their service immediately after the service has been launched. This is evident in our code examples running in the Docker environment, because the Eureka service and the application services (licensing and organization services) all start up at the same time. Be aware that after starting the application, you may receive 404 errors about services not being found, even though the service itself has started. Wait 30 seconds before trying to call your services.
In a production environment, your Eureka services will already be running and if you’re deploying an existing service, the old services will still be in place to take requests.
You now have the organization service registered with Eureka. You can also have the licensing service call the organization service without having direct knowledge of the location of any of the organization services. The licensing service will look up the physical location of the organization by using Eureka.
For our purposes, we’re going to look at three different Spring/Netflix client libraries in which a service consumer can interact with Ribbon. These libraries will move from the lowest level of abstraction for interacting with Ribbon to the highest. The libraries we’ll explore include
Let’s walk through each of these clients and see their use in the context of the licensing service. Before we start into the specifics of the client, I wrote a few convenience classes and methods in the code so you can play with the different client types using the same service endpoint.
First, I’ve modified the src/main/java/com/thoughtmechanix/licenses/controllers/LicenseServiceController.java to include a new route for the license services. This new route will allow you to specify the type of client you want to invoke the service with. This is a helper route so that as we explore each of the different methods for invoking the organization service via Ribbon, you can try each mechanism through a single route. The following listing shows the code for the new route in the LicenseServiceController class.
In this code, the clientType parameter passed on the route will drive the type of client we’re going to use in the code examples. The specific types you can pass in on this route include
Because I’m using the same code for all three types of client, you might see situations where you’ll see annotations for certain clients even when they don’t seem to be needed. For example, you’ll see both the @EnableDiscoveryClient and @EnableFeignClients annotations in the code, even when the text is only explaining one of the client types. This is so I can use one code base for my examples. I’ll call out these redundancies and code whenever they are encountered.
In the src/main/java/com/thoughtmechanix/licenses/services/License Service.java class, I’ve added a simple method called retrieveOrgInfo() that will resolve based on the clientType passed into the route the type of client that will be used to look up an organization service instance. The getLicense() method on the LicenseService class will use retrieveOrgInfo() to retrieve the organization data from the Postgres database.
public License getLicense(String organizationId, String licenseId, String clientType) {
    License license = licenseRepository.findByOrganizationIdAndLicenseId(
              organizationId, licenseId);

    Organization org = retrieveOrgInfo(organizationId, clientType);

    return license
        .withOrganizationName( org.getName())
        .withContactName( org.getContactName())
        .withContactEmail( org.getContactEmail() )
        .withContactPhone( org.getContactPhone() )
        .withComment(config.getExampleProperty());
  }
You can find each of the clients we built using the Spring DiscoveryClient, the Spring RestTemplate, or the Feign libraries in the src/main/java/com/thoughtmechanix/licenses/clients package of the licensing-service source code.
The Spring DiscoveryClient offers the lowest level of access to Ribbon and the services registered within it. Using the DiscoveryClient, you can query for all the services registered with the ribbon client and their corresponding URLs.
Next, you’ll build a simple example of using the DiscoveryClient to retrieve one of the organization service URLs from Ribbon and then call the service using a standard RestTemplate class. To begin using the DiscoveryClient, you first need to annotate the src/main/java/com/thoughtmechanix/licenses/Application.java class with the @EnableDiscoveryClient annotation, as shown in the next listing.
The @EnableDiscoveryClient annotation is the trigger for Spring Cloud to enable the application to use the DiscoveryClient and Ribbon libraries. The @EnableFeignClients annotation can be ignored for now as we’ll be covering it shortly.
Now, let’s look at your implementation of the code that calls the organization service via the Spring DiscoveryClient, as shown in the following listing. You can find this in src/main/java/com/thoughtmechanix/licenses/OrganizationDiscovery Client.java.
The first item of interest in the code is the DiscoveryClient. This is the class you’ll use to interact with Ribbon. To retrieve all instances of the organization services registered with Eureka, you can use the getInstances() method, passing in the key of service you’re looking for, to retrieve a list of ServiceInstance objects.
The ServiceInstance class is used to hold information about a specific instance of a service including its hostname, port and URI.
In listing 4.8, you take the first ServiceInstance class in your list to build a target URL that can then be used to call your service. Once you have a target URL, you can use a standard Spring RestTemplate to call your organization service and retrieve data.
I’m walking through the DiscoveryClient to be completed in our discussion of building service consumers with Ribbon. The reality is that you should only use the DiscoveryClient directly when your service needs to query Ribbon to understand what services and service instances are registered with it. There are several problems with this code including the following:
You aren’t taking advantage of Ribbon’s client side load-balancing—By calling the DiscoveryClient directly, you get back a list of services, but it becomes your responsibility to choose which service instances returned you’re going to invoke.
You’re doing too much work—Right now, you have to build the URL that’s going to be used to call your service. It’s a small thing, but every piece of code that you can avoid writing is one less piece of code that you have to debug.
Observant Spring developers might have noticed that you’re directly instantiating the RestTemplate class in the code. This is antithetical to normal Spring REST invocations, as normally you’d have the Spring Framework inject the RestTemplate the class using it via the @Autowired annotation.
You instantiated the RestTemplate class in listing 4.8 because once you’ve enabled the Spring DiscoveryClient in the application class via the @EnableDiscoveryClient annotation, all RestTemplates managed by the Spring framework will have a Ribbon-enabled interceptor injected into them that will change how URLs are created with the RestTemplate class. Directly instantiating the RestTemplate class allows you to avoid this behavior.
In summary, there are better mechanisms for calling a Ribbon-backed service.
Next, we’re going to see an example of how to use a RestTemplate that’s Ribbon-aware. This is one of the more common mechanisms for interacting with Ribbon via Spring. To use a Ribbon-aware RestTemplate class, you need to define a Rest-Template bean construction method with a Spring Cloud annotation called @LoadBalanced. For the licensing service, the method that will be used to create the RestTemplate bean can be found in src/main/java/com/thoughtmechanix/licenses/Application.java.
The following listing shows the getRestTemplate() method that will create the Ribbon-backed Spring RestTemplate bean.
In early releases of Spring Cloud, the RestTemplate class was automatically backed by Ribbon. It was the default behavior. However, since Spring Cloud Release Angel, the RestTemplate in Spring Cloud is no longer backed by Ribbon. If you want to use Ribbon with the RestTemplate, you must explicitly annotate it using the @LoadBalanced annotation.
Now that the bean definition for the Ribbon-backed RestTemplate class is defined, any time you want to use the RestTemplate bean to call a service, you only need to auto-wire it into the class using it.
Using the Ribbon-backed RestTemplate class pretty much behaves like a standard Spring RestTemplate class, except for one small difference in how the URL for target service is defined. Rather than using the physical location of the service in the RestTemplate call, you’re going to build the target URL using the Eureka service ID of the service you want to call.
Let’s see this difference by looking at the following listing. The code for this listing can be found in the src/main/java/com/thoughtmechanix/licenses/-clients/OrganizationRestTemplate.java class.
This code should look somewhat similar to the previous example, except for two key differences. First, the Spring Cloud DiscoveryClient is nowhere in sight. Second, the URL being used in the restTemplate.exchange() call should look odd to you:
restTemplate.exchange(

  "http://organizationservice/v1/organizations/{organizationId}",
   HttpMethod.GET,
 null, Organization.class, organizationId);
The server name in the URL matches the application ID of the organizationservice key that you registered the organization service with in Eureka:
http://{applicationid}/v1/organizations/{organizationId}
The Ribbon-enabled RestTemplate will parse the URL passed into it and use whatever is passed in as the server name as the key to query Ribbon for an instance of a service. The actual service location and port are completely abstracted from the developer.
In addition, by using the RestTemplate class, Ribbon will round-robin load balance all requests among all the service instances.
An alternative to the Spring Ribbon-enabled RestTemplate class is Netflix’s Feign client library. The Feign library takes a different approach to calling a REST service by having the developer first define a Java interface and then annotating that interface with Spring Cloud annotations to map what Eureka-based service Ribbon will invoke. The Spring Cloud framework will dynamically generate a proxy class that will be used to invoke the targeted REST service. There’s no code being written for calling the service other than an interface definition.
To enable the Feign client for use in your licensing service, you need to add a new annotation, @EnableFeignClients, to the licensing service’s src/main/java/com/thoughtmechanix/licenses/Application.java class. The following listing shows this code.
Now that you’ve enabled the Feign client for use in your licensing service, let’s look at a Feign client interface definition that can be used to call an endpoint on the organization service. The following listing shows an example. The code in this listing can be found in the src/main/java/com/thoughtmechanix/licenses/clients/OrganizationFeignClient.java class.
You start the Feign example by using the @FeignClient annotation and passing it the name of the application id of the service you want the interface to represent. Next you’ll define a method, getOrganization(), in your interface that can be called by the client to invoke the organization service.
How you define the getOrganization() method looks exactly like how you would expose an endpoint in a Spring Controller class. First, you’re going to define a @RequestMapping annotation for the getOrganization() method that will map the HTTP verb and endpoint that will be exposed on the organization service invocation. Second, you’ll map the organization ID passed in on the URL to an organizationId parameter on the method call, using the @PathVariable annotation. The return value from the call to the organization service will be automatically mapped to the Organization class that’s defined as the return value for the getOrganization() method.
To use the OrganizationFeignClient class, all you need to do is autowire and use it. The Feign Client code will take care of all the coding work for you.
When you use the standard Spring RestTemplate class, all service calls’ HTTP status codes will be returned via the ResponseEntity class’s getStatusCode() method. With the Feign Client, any HTTP 4xx – 5xx status codes returned by the service being called will be mapped to a FeignException. The FeignException will contain a JSON body that can be parsed for the specific error message.
Feign does provide you the ability to write an error decoder class that will map the error back to a custom Exception class. Writing this decoder is outside the scope of this book, but you can find examples of this in the Feign GitHub repository at (https://github.com/Netflix/feign/wiki/Custom-error-handling).
All systems, especially distributed systems, will experience failure. How we build our applications to respond to that failure is a critical part of every software developer’s job. However, when it comes to building resilient systems, most software engineers only take into account the complete failure of a piece of infrastructure or a key service. They focus on building redundancy into each layer of their application using techniques such as clustering key servers, load balancing between services, and segregation of infrastructure into multiple locations.
While these approaches take into account the complete (and often spectacular) loss of a system component, they address only one small part of building resilient systems. When a service crashes, it’s easy to detect that it’s no longer there, and the application can route around it. However, when a service is running slow, detecting that poor performance and routing around it is extremely difficult because
What’s insidious about problems caused by poorly performing remote services is that they’re not only difficult to detect, but can trigger a cascading effect that can ripple throughout an entire application ecosystem. Without safeguards in place, a single poorly performing service can quickly take down multiple applications. Cloud-based, microservice-based applications are particularly vulnerable to these types of outages because these applications are composed of a large number of fine-grained, distributed services with different pieces of infrastructure involved in completing a user’s transaction.
Client resiliency software patterns are focused on protecting a remote resource’s (another microservice call or database lookup) client from crashing when the remote resource is failing because that remote service is throwing errors or performing poorly. The goal of these patterns is to allow the client to “fail fast,” not consume valuable resources such as database connections and thread pools, and prevent the problem of the remote service from spreading “upstream” to consumers of the client.
There are four client resiliency patterns:
Figure 5.1 demonstrates how these patterns sit between the microservice service consumer and the microservice.
These patterns are implemented in the client calling the remote resource. The implementation of these patterns logically sit between the client consuming the remote resources and the resource itself.
We introduced the client-side load balancing pattern in the last chapter (chapter 4) when talking about service discovery. Client-side load balancing involves having the client look up all of a service’s individual instances from a service discovery agent (like Netflix Eureka) and then caching the physical location of said service instances. Whenever a service consumer needs to call that service instance, the client-side load balancer will return a location from the pool of service locations it’s maintaining.
Because the client-side load balancer sits between the service client and the service consumer, the load balancer can detect if a service instance is throwing errors or behaving poorly. If the client-side load balancer detects a problem, it can remove that service instance from the pool of available service locations and prevent any future service calls from hitting that service instance.
This is exactly the behavior that Netflix’s Ribbon libraries provide out of the box with no extra configuration. Because we covered client-side load balancing with Net-flix Ribbon in chapter 4, we won’t go into any more detail on that in this chapter.
The circuit breaker pattern is a client resiliency pattern that’s modeled after an electrical circuit breaker. In an electrical system, a circuit breaker will detect if too much current is flowing through the wire. If the circuit breaker detects a problem, it will break the connection with the rest of the electrical system and keep the downstream components from the being fried.
With a software circuit breaker, when a remote service is called, the circuit breaker will monitor the call. If the calls take too long, the circuit breaker will intercede and kill the call. In addition, the circuit breaker will monitor all calls to a remote resource and if enough calls fail, the circuit break implementation will pop, failing fast and preventing future calls to the failing remote resource.
With the fallback pattern, when a remote service call fails, rather than generating an exception, the service consumer will execute an alternative code path and try to carry out an action through another means. This usually involves looking for data from another data source or queueing the user’s request for future processing. The user’s call will not be shown an exception indicating a problem, but they may be notified that their request will have to be fulfilled at a later date.
For instance, suppose you have an e-commerce site that monitors your user’s behavior and tries to give them recommendations of other items they could buy. Typically, you might call a microservice to run an analysis of the user’s past behavior and return a list of recommendations tailored to that specific user. However, if the preference service fails, your fallback might be to retrieve a more general list of preferences that’s based off all user purchases and is much more generalized. This data might come from a completely different service and data source.
The bulkhead pattern is based on a concept from building ships. With a bulkhead design, a ship is divided into completely segregated and watertight compartments called bulkheads. Even if the ship’s hull is punctured, because the ship is divided into watertight compartments (bulkheads), the bulkhead will keep the water confined to the area of the ship where the puncture occurred and prevent the entire ship from filling with water and sinking.
The same concept can be applied to a service that must interact with multiple remote resources. By using the bulkhead pattern, you can break the calls to remote resources into their own thread pools and reduce the risk that a problem with one slow remote resource call will take down the entire application. The thread pools act as the bulkheads for your service. Each remote resource is segregated and assigned to the thread pool. If one service is responding slowly, the thread pool for that one type of service call will become saturated and stop processing requests. Service calls to other services won’t become saturated because they’re assigned to other thread pools.
We’ve talked about these different patterns in the abstract; however, let’s drill down to a more specific example of where these patterns can be applied. Let’s walk through a common scenario I’ve run into and see why client resiliency patterns such as the circuit breaker pattern are critical for implementing a service-based architecture, particularly a microservice architecture running in the cloud.
In figure 5.2, I show a typical scenario involving the use of remote resource like a database and remote service.
In the scenario in figure 5.2, three applications are communicating in one fashion or another with three different services. Applications A and B communicate directly with Service A. Service A retrieves data from a database and calls Service B to do work for it. Service B retrieves data from a completely different database platform and calls out to another service, Service C, from a third-party cloud provider whose service relies heavily on an internal Network Area Storage (NAS) device to write data to a shared file system. In addition, Application C directly calls Service C.
Over the weekend, a network administrator made what they thought was a small tweak to the configuration on the NAS, as shown in bold in figure 5.2. This change appears to work fine, but on Monday morning, any reads to a particular disk subsystem start performing extremely slowly.
The developer who wrote Service B never anticipated slowdowns occurring with calls to Service C. They wrote their code so that the writes to their database and the reads from the service occur within the same transaction. When Service C starts running slowly, not only does the thread pool for requests to Service C start backing up, the number of database connections in the service container’s connection pools become exhausted because these connections are being held open because the calls out to Service C never complete.
Finally, Service A starts running out of resources because it’s calling Service B, which is running slow because of Service C. Eventually, all three applications stop responding because they run out of resources while waiting for requests to complete.
This whole scenario could be avoided if a circuit-breaker pattern had been implemented at each point where a distributed resource had been called (either a call to the database or a call to the service). In figure 5.2, if the call to Service C had been implemented with a circuit breaker, then when service C started performing poorly, the circuit breaker for that specific call to Service C would have been tripped and failed fast without eating up a thread. If Service B had multiple endpoints, only the endpoints that interacted with that specific call to Service C would be impacted. The rest of Service B’s functionality would still be intact and could fulfill user requests.
A circuit breaker acts as a middle man between the application and the remote service. In the previous scenario, a circuit breaker implementation could have protected Applications A, B, and C from completely crashing.
In figure 5.3, the Service B (the client) is never going to directly invoke Service C. Instead, when the call is made, Service B is going to delegate the actual invocation of the service to the circuit breaker, which will take the call and wrap it in a thread (usually managed by a thread pool) that’s independent of the originating caller. By wrapping the call in a thread, the client is no longer directly waiting for the call to complete. Instead, the circuit breaker is monitoring the thread and can kill the call if the thread runs too long.
Three scenarios are shown in figure 5.3. In the first scenario, the happy path, the circuit breaker will maintain a timer and if the call to the remote service completes before the timer runs out, everything is good and Service B can continue its work. In the partial degradation scenario, Service B will call Service C through the circuit breaker. This time, though, Service C is running slow and the circuit breaker will kill the connection out to the remote service if it doesn’t complete before the timer on the thread maintained by the circuit breaker times out.
Service B will then get an error from making the call, but Service B won’t have resources (that is, its own thread or connection pools) tied up waiting for Service C to complete. If the call to Service C is timed-out by the circuit breaker, the circuit breaker will start tracking the number of failures that have occurred.
If enough errors on the service have occurred within a certain time period, the circuit breaker will now “trip” the circuit and all calls to Service C will fail without calling Service C.
This tripping of the circuit allows three things to occur:
Finally, the circuit breaker will occasionally let calls through to a degraded service, and if those calls succeed enough times in a row, the circuit breaker will reset itself.
The key thing a circuit break patterns offers is the ability for remote calls to
In a large cloud-based application with hundreds of services, this graceful recovery is critical because it can significantly cut down on the amount of time needed to restore service and significantly lessen the risk of a tired operator or application engineer causing greater problems by having them intervene directly (restarting a failed service) in the restoration of the service.
Building implementations of the circuit breaker, fallback, and bulkhead patterns requires intimate knowledge of threads and thread management. Let’s face it, writing robust threading code is an art (which I’ve never mastered) and doing it correctly is difficult. To implement a high-quality set of implementations for the circuit-breaker, fallback, and bulkhead patterns would require a tremendous amount of work. Fortunately, you can use Spring Cloud and Netflix’s Hystrix library to provide you a battle-tested library that’s used daily in Netflix’s microservice architecture.
In the next several sections of this chapter we’re going to cover how to
To begin our exploration of Hystrix, you need to set up your project pom.xml to import the Spring Hystrix dependencies. You’ll take your licensing service that we’ve been building and modify its pom.xml by adding the maven dependencies for Hystrix:
<dependency>
 <groupId>org.springframework.cloud</groupId>
 <artifactId>spring-cloud-starter-hystrix</artifactId>
</dependency>
<dependency>
  <groupId>com.netflix.hystrix</groupId>
  <artifactId>hystrix-javanica</artifactId>
  <version>1.5.9</version>
</dependency>
The first <dependency> tag (spring-cloud-starter-hystrix) tells Maven to pull down the Spring Cloud Hystrix dependencies. This second <dependency> tag (hystrix-javanica) will pull down the core Netflix Hystrix libraries. With the Maven dependencies set up, you can go ahead and begin your Hystrix implementation using the licensing and organization services you built in previous chapters.
You don’t have to include the hystrix-javanica dependencies directly in the pom.xml. By default, the spring-cloud-starter-hystrix includes a version of the hystrix-javanica dependencies. The Camden.SR5 release of the book used hystrix-javanica-1.5.6. The version of hystrix-javanica had an inconsistency introduced into it that caused the Hystrix code without a fallback to throw a java.lang.reflect. UndeclaredThrowableException instead of a com.netflix. hystrix.exception.HystrixRuntimeException. This was a breaking change for many developers who used older versions of Hystrix. The hystrix-javanica libraries fixed this in later releases, so I’ve purposely used a later version of hystrix-javanica instead of using the default version pulled in by Spring Cloud.
The last thing that needs to be done before you can begin using Hystrix circuit breakers within your application code is to annotate your service’s bootstrap class with the @EnableCircuitBreaker annotation. For example, for the licensing service, you’d add the @EnableCircuitBreaker annotation to the licensing-service/src/main/java/com/thoughtmechanix/licenses/Application.java class. The following listing shows this code.
If you forget to add the @EnableCircuitBreaker annotation to your bootstrap class, none of your Hystrix circuit breakers will be active. You won’t get any warning or error messages when the service starts up.
We’re going to look at implementing Hystrix in two broad categories. In the first category, you’re going to wrap all calls to your database in the licensing and organization service with a Hystrix circuit breaker. You’re then going to wrap the inter-service calls between the licensing service and the organization service using Hystrix. While these are two different categories calls, you’ll see that the use of Hystrix will be exactly the same. Figure 5.4 shows what remote resources you’re going to wrap with a Hystrix circuit breaker.
Let’s start our Hystrix discussion by showing how to wrap the retrieval of licensing service data from the licensing database using a synchronous Hystrix circuit breaker. With a synchronous call, the licensing service will retrieve its data but will wait for the SQL statement to complete or for a circuit-breaker time-out before continuing processing.
Hystrix and Spring Cloud use the @HystrixCommand annotation to mark Java class methods as being managed by a Hystrix circuit breaker. When the Spring framework sees the @HystrixCommand, it will dynamically generate a proxy that will wrapper the method and manage all calls to that method through a thread pool of threads specifically set aside to handle remote calls.
You’re going to wrap the getLicensesByOrg() method in your licensing-service/src/main/java/com/thoughtmechanix/licenses/services/LicenseService.java class, as shown in the following listing.
If you look at the code in listing 5.2 in the source code repository, you’ll see several more parameters on the @HystrixCommand annotation than what’s shown in the previous listing. We’ll get into those parameters later in the chapter. The code in listing 5.2 is using the @HystrixCommand annotation with all its default values.
This doesn't look like a lot of code, and it's not, but there is a lot of functionality inside this one annotation. With the use of the @HystrixCommand annotation, any time the getLicensesByOrg() method is called, the call will be wrapped with a Hystrix circuit breaker. The circuit breaker will interrupt any call to the getLicensesByOrg() method any time the call takes longer than 1,000 milliseconds.
This code example would be boring if the database is working properly. Let's simulate the getLicensesByOrg() method running into a slow database query by having the call take a little over a second on approximately every one in three calls. The following listing demonstrates this.
If you hit the http://localhost/v1/organizations/e254f8c-c442-4ebe-a82a-e2fc1d1ff78a/licenses/ endpoint enough times, you should see a timeout error message returned from the licensing service. Figure 5.5 shows this error.
Now, with @HystrixCommand annotation in place, the licensing service will interrupt a call out to its database if the query takes too long. If the database calls take longer than 1,000 milliseconds to execute the Hystrix code wrapping, your service call will throw a com.nextflix.hystrix.exception.HystrixRuntimeException exception.
The beauty of using method-level annotations for tagging calls with circuit-breaker behavior is that it’s the same annotation whether you’re accessing a database or calling a microservice.
For instance, in your licensing service you need to look up the name of the organization associated with the license. If you want to wrap your call to the organization service with a circuit breaker, it’s as simple as breaking the RestTemplate call into its own method and annotating it with the @HystrixCommand annotation:
@HystrixCommand
private Organization getOrganization(String organizationId) {
 return organizationRestClient.getOrganization(organizationId);
}
While using the @HystrixCommand is easy to implement, you do need to be careful about using the default @HystrixCommand annotation with no configuration on the annotation. By default, when you specify a @HystrixCommand annotation without properties, the annotation will place all remote service calls under the same thread pool. This can introduce problems in your application. Later in the chapter when we talk about implementing the bulkhead pattern, we’ll show you how to segregate these remote service calls into their own thread pools and configure the behavior of the thread pools to be independent of one another.
One of the first questions I often run into when working with new developers and Hystrix is how they can customize the amount of time before a call is interrupted by Hystrix. This is easily accomplished by passing additional parameters into the @HystrixCommand annotation. The following listing demonstrates how to customize the amount of time Hystrix waits before timing out a call.
Hystrix allows you to customize the behavior of the circuit breaker through the commandProperties attribute. The commandProperties attribute accepts an array of HystrixProperty objects that can pass in custom properties to configure the Hystrix circuit breaker. In listing 5.4, you use the execution.isolation.thread.timeoutInMilliseconds property to set the maximum timeout a Hystrix call will wait before failing to be 12 seconds.
Now if you rebuild and rerun the code example, you’ll never get a timeout error because your artificial timeout on the call is 11 seconds while your @HystrixCommand annotation is now configured to only time out after 12 seconds.
It should be obvious that I’m using a circuit breaker timeout of 12 seconds as a teaching example. In a distributed environment, I often get nervous if I start hearing comments from development teams that a 1 second timeout on remote service calls is too low because their service X takes on average 5-6 seconds.
This usually tells me that unresolved performance problems exist with the service being called. Avoid the temptation to increase the default timeout on Hystrix calls unless you absolutely cannot resolve a slow running service call.
If you do have a situation where part of your service calls are going to take longer than other service calls, definitely look at segregating these service calls into separate thread pools.
Part of the beauty of the circuit breaker pattern is that because a “middle man” is between the consumer of a remote resource and the resource itself, you have an opportunity for the developer to intercept a service failure and choose an alternative course of action to take.
In Hystrix, this is known as a fallback strategy and is easily implemented. Let’s see how to build a simple fallback strategy for your licensing database that simply returns a licensing object that says no licensing information is currently available. The following listing demonstrates this.
In the source code from the GitHub repository, I comment out the fallbackMethod line so that you can see the service call randomly fail. To see the fallback code in listing 5.5 in action you’ll need to uncomment out the fallbackMethod attribute. Otherwise, you will never see the fallback actually being invoked.
To implement a fallback strategy with Hystrix you have to do two things. First, you need to add an attribute called fallbackMethod to the @HystrixCommand annotation. This attribute will contain the name of a method that will be called when Hystrix has to interrupt a call because it’s taking too long.
The second thing you need to do is define a fallback method to be executed. This fallback method must reside in the same class as the original method that was protected by the @HystrixCommand. The fallback method must have the exact same method signature as the originating function as all of the parameters passed into the original method protected by the @HystrixCommand will be passed to the fallback.
In the example in listing 5.5, the fallback method buildFallbackLicense-List() is simply constructing a single License object containing dummy information. You could have your fallback method read this data from an alternative data source, but for demonstration purposes you’re going to construct a list that would have been returned by your original function call.
The fallback strategy works extremely well in situations where your microservice is retrieving data and the call fails. In one organization I worked at, we had customer information stored in an operational data store (ODS) and also summarized in a data warehouse.
Our happy path was to always retrieve the most recent data and calculate summary information for it on the fly. However, after a particularly nasty outage where a slow database connection took down multiple services, we decided to protect the service call that retrieved and summarized the customer’s information with a Hystrix fallback implementation. If the call to the ODS failed due to a performance problem or an error, we used a fallback to retrieve the summarized data from our data warehouse tables.
Our business team decided that giving the customer’s older data was preferable to having the customer see an error or have the entire application crash. The key when choosing whether to use a fallback strategy is the level of tolerance your customers have to the age of their data and how important it is to never let them see the application having problems.
Here are a few things to keep in mind as you determine whether you want to implement a fallback strategy:
Now that you have your fallback in place, go ahead and call your endpoint again. This time when you hit it and encounter a timeout error (remember you have a one in 3 chance) you shouldn’t get an exception back from the service call, but instead have the dummy license values returned.
In a microservice-based application you’ll often need to call multiple microservices to complete a particular task. Without using a bulkhead pattern, the default behavior for these calls is that the calls are executed using the same threads that are reserved for handling requests for the entire Java container. In high volumes, performance problems with one service out of many can result in all of the threads for the Java container being maxed out and waiting to process work, while new requests for work back up. The Java container will eventually crash. The bulkhead pattern segregates remote resource calls in their own thread pools so that a single misbehaving service can be contained and not crash the container.
Hystrix uses a thread pool to delegate all requests for remote services. By default, all Hystrix commands will share the same thread pool to process requests. This thread pool will have 10 threads in it to process remote service calls and those remote services calls could be anything, including REST-service invocations, database calls, and so on. Figure 5.7 illustrates this.
This model works fine when you have a small number of remote resources being accessed within an application and the call volumes for the individual services are relatively evenly distributed. The problem is if you have services that have far higher volumes or longer completion times then other services, you can end up introducing thread exhaustion into your Hystrix thread pools because one service ends up dominating all of the threads in the default thread pool.
Fortunately, Hystrix provides an easy-to-use mechanism for creating bulkheads between different remote resource calls. Figure 5.8 shows what Hystrix managed resources look like when they’re segregated into their own “bulkheads.”
To implement segregated thread pools, you need to use additional attributes exposed through the @HystrixCommand annotation. Let’s look at some code that will
The following listing demonstrates how to set up a bulkhead around all calls surrounding the look-up of licensing data from our licensing service.
The first thing you should notice is that we’ve introduced a new attribute, threadPoolkey, to your @HystrixCommand annotation. This signals to Hystrix that you want to set up a new thread pool. If you set no further values on the thread pool, Hystrix sets up a thread pool keyed off the name in the threadPoolKey attribute, but will use all default values for how the thread pool is configured.
To customize your thread pool, you use the threadPoolProperties attribute on the @HystrixCommand. This attribute takes an array of HystrixProperty objects. These HystrixProperty objects can be used to control the behavior of the thread pool. You can set the size of the thread pool by using the coreSize attribute.
You can also set up a queue in front of the thread pool that will control how many requests will be allowed to back up when the threads in the thread pool are busy. This queue size is set by the maxQueueSize attribute. Once the number of requests exceeds the queue size, any additional requests to the thread pool will fail until there is room in the queue.
Note two things about the maxQueueSize attribute. First, if you set the value to -1, a Java SynchronousQueue will be used to hold all incoming requests. A synchronous queue will essentially enforce that you can never have more requests in process then the number of threads available in the thread pool. Setting the maxQueueSize to a value greater than one will cause Hystrix to use a Java LinkedBlockingQueue. The use of a LinkedBlockingQueue allows the developer to queue up requests even if all threads are busy processing requests.
The second thing to note is that the maxQueueSize attribute can only be set when the thread pool is first initialized (for example, at startup of the application). Hystrix does allow you to dynamically change the size of the queue by using the queueSizeRejectionThreshold attribute, but this attribute can only be set when the maxQueueSize attribute is a value greater than 0.
What’s the proper sizing for a custom thread pool? Netflix recommends the following formula:
(requests per second at peak when the service is healthy * 99th percentile latency in seconds) + small amount of extra threads for overhead
You often don’t know the performance characteristics of a service until it has been under load. A key indicator that the thread pool properties need to be adjusted is when a service call is timing out even if the targeted remote resource is healthy.
At this point we’ve looked at the basic concepts of setting up a circuit breaker and bulkhead pattern using Hystrix. We’re now going to go through and see how to really customize the behavior of the Hystrix’s circuit breaker. Remember, Hystrix does more than time out long-running calls. Hystrix will also monitor the number of times a call fails and if enough calls fail, Hystrix will automatically prevent future calls from reaching the service by failing the call before the requests ever hit the remote resource.
There are two reasons for this. First, if a remote resource is having performance problems, failing fast will prevent the calling application from having to wait for a call to time out. This significantly reduces the risk that the calling application or service will experience its own resource exhaustion problems and crashes. Second, failing fast and preventing calls from service clients will help a struggling service keep up with its load and not crash completely under the load. Failing fast gives the system experiencing performance degradation time to recover.
To understand how to configure the circuit breaker in Hystrix, you need to first understand the flow of how Hystrix determines when to trip the circuit breaker. Figure 5.9 shows the decision process used by Hystrix when a remote resource call fails.
Whenever a Hystrix command encounters an error with a service, it will begin a 10-second timer that will be used to examine how often the service call is failing. This 10-second window is configurable. The first thing Hystrix does is look at the number of calls that have happened within the 10-second window. If the number of calls is less than a minimum number of calls that need to occur within the window, then Hystrix will not take action even if several of the calls failed. For example, the default number of calls that need to occur before Hystrix will even consider action within the 10-second window is 20. If 15 of those calls fail within a 10-second period, not enough of the calls have occurred for them to “trip” the circuit breaker even if all 15 calls failed. Hystrix will continue letting calls go through to the remote service.
When the minimum number of remote resource calls has occurred within the 10-second window, Hystrix will begin looking at the percentage of overall failures that have occurred. If the overall percentage of failures is over the threshold, Hystrix will trigger the circuit breaker and fail almost all future calls. As we’ll discuss shortly, Hystrix will let part of the calls through to “test” and see if the service is backing up. The default value for the error threshold is 50%.
If that percentage has been exceeded, Hystrix will “trip” the circuit breaker and prevent further calls from hitting the remote resource. If that percentage of remote calls hasn’t been triggered and the 10-second window has been passed, Hystrix will reset the circuit breaker statistics.
When Hystrix has “tripped” the circuit breaker on a remote call, it will try to start a new window of activity. Every five seconds (this value is configurable), Hystrix will let a call through to the struggling service. If the call succeeds, Hystrix will reset the circuit breaker and start letting calls through again. If the call fails, Hystrix will keep the circuit breaker closed and try again in another five seconds.
Based on this, you can see that there are five attributes you can use to customize the circuit breaker behavior. The @HystrixCommand annotation exposes these five attributes via the commandPoolProperties attribute. While the threadPoolProperties attribute allows you to set the behavior of the underlying thread pool used in the Hystrix command, the commandPoolProperties attribute allows you to customize the behavior of the circuit breaker associated with Hystrix command. The following listing shows the names of the attributes along with how to set values in each of them.
@HystrixCommand(
   fallbackMethod = "buildFallbackLicenseList",
   threadPoolKey = "licenseByOrgThreadPool",
   threadPoolProperties ={
         @HystrixProperty(name = "coreSize",value="30"),
        @HystrixProperty(name="maxQueueSize"value="10"),
   },
   commandPoolProperties ={
     @HystrixProperty(
      name="circuitBreaker.requestVolumeThreshold",
       value="10"),
       @HystrixProperty(
      name="circuitBreaker.errorThresholdPercentage",
       value="75"),

         @HystrixProperty(
           name="circuitBreaker.sleepWindowInMilliseconds",
           value="7000"),
            @HystrixProperty(
           name="metrics.rollingStats.timeInMilliseconds",
            value="15000")
         @HystrixProperty(
           name="metrics.rollingStats.numBuckets",
            value="5")}
     )
  public List<License> getLicensesByOrg(String organizationId){
   logger.debug("getLicensesByOrg Correlation id: {}",
   UserContextHolder
               .getContext()
               .getCorrelationId());
    randomlyRunLong();

    return licenseRepository.findByOrganizationId(organizationId);
  }
The first property, circuitBreaker.requestVolumeTheshold, controls the amount of consecutive calls that must occur within a 10-second window before Hystrix will consider tripping the circuit breaker for the call. The second property, circuitBreaker.errorThresholdPercentage, is the percentage of calls that must fail (due to timeouts, an exception being thrown, or a HTTP 500 being returned) after the circuitBreaker.requestVolumeThreshold value has been passed before the circuit breaker it tripped. The last property in the previous code example, circuitBreaker.sleepWindowInMilliseconds, is the amount of time Hystrix will sleep once the circuit breaker is tripped before Hystrix will allow another call through to see if the service is healthy again.
The last two Hystrix properties (metrics.rollingStats.timeInMilliseconds and metrics.rollingStats.numBuckets) are named a bit differently than the previous properties, but they still control the behavior of the circuit breaker. The first property, metrics.rollingStats.timeInMilliseconds, is used to control the size of the window that will be used by Hystrix to monitor for problems with a service call. The default value for this is 10,000 milliseconds (that is, 10 seconds).
The second property, metrics.rollingStats.numBuckets, controls the number of times statistics are collected in the window you’ve defined. Hystrix collects metrics in buckets during this window and checks the stats in those buckets to determine if the remote resource call is failing. The number of buckets defined must evenly divide into the overall number of milliseconds set for rollingStatus.inMilliseconds stats. For example, in your custom settings in the previous listing, Hystrix will use a 15-second window and collect statistics data into five buckets of three seconds in length.
The smaller the statistics window you check in and the greater the number of buckets you keep within the window will drive up CPU and memory utilization on a high-volume service. Be aware of this and fight the temptation to set the metrics collection windows and buckets to be fine-grained until you need that level of visibility.
The Hystrix library is extremely configurable and lets you tightly control the behavior of the circuit breaker and bulkhead patterns you define with it. By modifying the configuration of a Hystrix circuit breaker, you can control the amount of time Hystrix will wait before timing out a remote call. You can also control the behavior of when a Hystrix circuit breaker will trip and when Hystrix tries to reset the circuit breaker.
With Hystrix you can also fine-tune your bulkhead implementations by defining individual thread groups for each remote service call and then configure the number of threads associated with each thread group. This allows you to fine-tune your remote service calls because certain calls will have higher volumes then others, while other remote resource calls will have higher volumes.
The key thing to remember as you look at configuring your Hystrix environment is that you have three levels of configuration with Hystrix:
Every Hystrix property has values set by default that will be used by every @HystrixCommand annotation in the application unless they’re set at the Java class level or overridden for individual Hystrix thread pools within a class.
Hystrix does let you set default parameters at the class level so that all Hystrix commands within a specific class share the same configurations. The class-level properties are set via a class-level annotation called @DefaultProperties. For example, if you wanted all the resources within a specific class to have a timeout of 10 seconds, you could set the @DefaultProperties in the following manner:
@DefaultProperties(
  commandProperties = {
   @HystrixProperty(
    name = "execution.isolation.thread.timeoutInMilliseconds",
   value = "10000")}
class MyService { ... }
Unless explicitly overridden at a thread-pool level, all thread pools will inherit either the default properties at the application level or the default properties defined in the class. The Hystrix threadPoolProperties and commandProperties are also tied to the defined command key.
For the coding examples, I’ve hard-coded all the Hystrix values in the application code. In a production system, the Hystrix data that’s most likely to need to be tweaked (timeout parameters, thread pool counts) would be externalized to Spring Cloud Config. This way if you need to change the parameter values, you could change the values and then restart the service instances without having to recompile and redeploy the application.
For individual Hystrix pools, I will keep the configuration as close to the code as possible and place the thread-pool configuration right in the @HystrixCommand annotation. Table 5.1 summarizes all of the configuration values used to set up and configure our @HystrixCommand annotations.
|
Property Name |
Default Value |
Description |
|---|---|---|
| fallbackMethod | None | Identifies the method within the class that will be called if the remote call times out. The callback method must be in the same class as the @HystrixCommand annotation and must have the same method signature as the calling class. If no value, an exception will be thrown by Hystrix. |
| threadPoolKey | None | Gives the @HystrixCommand a unique name and creates a thread pool that is independent of the default thread pool. If no value is defined, the default Hystrix thread pool will be used. |
| threadPoolProperties | None | Core Hystrix annotation attribute that’s used to configure the behavior of a thread pool. |
| coreSize | 10 | Sets the size of the thread pool. |
| maxQueueSize | -1 | Maximum queue size that will set in front of the thread pool. If set to -1, no queue is used and instead Hystrix will block until a thread becomes available for processing. |
| circuitBreaker.request-VolumeThreshold | 20 | Sets the minimum number of requests that must be processed within the rolling window before Hystrix will even begin examining whether the circuit breaker will be tripped. Note: This value can only be set with the commandPoolProperties attribute. |
| circuitBreaker.error-ThresholdPercentage | 50 | The percentage of failures that must occur within the rolling window before the circuit breaker is tripped. Note: This value can only be set with the commandPoolProperties attribute. |
| circuitBreaker.sleep-WindowInMilliseconds | 5,000 | The number of milliseconds Hystrix will wait before trying a service call after the circuit breaker has been tripped. Note: This value can only be set with the commandPoolProperties attribute. |
| metricsRollingStats.timeInMilliseconds | 10,000 | The number of milliseconds Hystrix will collect and monitor statistics about service calls within a window. |
| metricsRollingStats.numBuckets | 10 | The number of metrics buckets Hystrix will maintain within its monitoring window. The more buckets within the monitoring window, the lower the level of time Hystrix will monitor for faults within the window. |
When an @HystrixCommand is executed, it can be run with two different isolation strategies: THREAD and SEMAPHORE. By default, Hystrix runs with a THREAD isolation. Each Hystrix command used to protect a call runs in an isolated thread pool that doesn’t share its context with the parent thread making the call. This means Hystrix can interrupt the execution of a thread under its control without worrying about interrupting any other activity associated with the parent thread doing the original invocation.
With SEMAPHORE-based isolation, Hystrix manages the distributed call protected by the @HystrixCommand annotation without starting a new thread and will interrupt the parent thread if the call times out. In a synchronous container server environment (Tomcat), interrupting the parent thread will cause an exception to be thrown that cannot be caught by the developer. This can lead to unexpected consequences for the developer writing the code because they can’t catch the thrown exception or do any resource cleanup or error handling.
To control the isolation setting for a command pool, you can set a command-Properties attribute on your @HystrixCommand annotation. For instance, if you wanted to set the isolation level on a Hystrix command to use a SEMAPHORE isolation, you’d use
@HystrixCommand(
commandProperties = {
 @HystrixProperty(
    name="execution.isolation.strategy", value="SEMAPHORE")})
By default, the Hystrix team recommends you use the default isolation strategy of THREAD for most commands. This keeps a higher level of isolation between you and the parent thread. THREAD isolation is heavier than using the SEMAPHORE isolation. The SEMAPHORE isolation model is lighter-weight and should be used when you have a high-volume on your services and are running in an asynchronous I/O programming model (you are using an asynchronous I/O container such as Netty).
Hystrix, by default, will not propagate the parent thread’s context to threads managed by a Hystrix command. For example, any values set as ThreadLocal values in the parent thread will not be available by default to a method called by the parent thread and protected by the @HystrixCommand object. (Again, this is assuming you are using a THREAD isolation level.)
This can be a little obtuse, so let’s see a concrete example. Often in a REST-based environment you are going to want to pass contextual information to a service call that will help you operationally manage the service. For example, you might pass a correlation ID or authentication token in the HTTP header of the REST call that can then be propagated to any downstream service calls. The correlation ID allows you to have a unique identifier that can be traced across multiple service calls in a single transaction.
To make this value available anywhere in your service call, you might use a Spring Filter class to intercept every call into your REST service and retrieve this information from the incoming HTTP request and store this contextual information in a custom UserContext object. Then, anytime your code needs to access this value in your REST service call, your code can retrieve the UserContext from the ThreadLocal storage variable and read the value. The following listing shows an example Spring Filter that you can use in your licensing service. You can find the code at licensingservice/src/main/java/com/thoughtmechanix/licenses/utils/UserContextFilter.java.
The UserContextHolder class is used to store the UserContext in a ThreadLocal class. Once it’s stored in the ThreadLocal storage, any code that’s executed for a request will use the UserContext object stored in the UserContextHolder. The UserContextHolder class is shown in the following listing. This class is found at licensing-service/src/main/java/com/thoughtmechanix/licenses/utils/UserContextHolder.java.
At this point you can add a couple of log statements to your licensing service. You’ll add logging to the following licensing service classes and methods:
Next you’ll call your service passing in a correlation ID using an HTTP header called tmx-correlation-id and a value of TEST-CORRELATION-ID. Figure 5.10 shows a HTTP GET call to http://localhost:8080/v1/organizations/e254f8c-c442-4ebe-a82a-e2fc1d1ff78a/licenses/ in Postman.
Once this call is submitted, you should see three log messages writing out the passed-in correlation ID as it flows through the UserContext, LicenseServiceController, and LicenseServer classes:
UserContext Correlation id: TEST-CORRELATION-ID
LicenseServiceController Correlation id: TEST-CORRELATION-ID
LicenseService.getLicenseByOrg Correlation:
As expected, once the call hits the Hystrix protected method on License-Service.getLicensesByOrder(), you’ll get no value written out for the correlation ID. Fortunately, Hystrix and Spring Cloud offer a mechanism to propagate the parent thread’s context to threads managed by the Hystrix Thread pool. This mechanism is called a HystrixConcurrencyStrategy.
Hystrix allows you to define a custom concurrency strategy that will wrap your Hystrix calls and allows you to inject any additional parent thread context into the threads managed by the Hystrix command. To implement a custom HystrixConcurrency-Strategy you need to carry out three actions:
All the examples for the HystrixConcurrencyStrategy can be found in the licensing-service/src/main/java/com/thoughtmechanix/licenses/hystrix package.
The first thing you need to do is define your HystrixConcurrencyStrategy. By default, Hystrix only allows you to define one HystrixConcurrencyStrategy for an application. Spring Cloud already defines a concurrency strategy used to handle propagating Spring security information. Fortunately, Spring Cloud allows you to chain together Hystrix concurrency strategies so you can define and use your own concurrency strategy by “plugging” it into the Hystrix concurrency strategy.
Our implementation of a Hystrix concurrency strategy can be found in the licensing services hystrix package and is called ThreadLocalAwareStrategy.java. The following listing shows the code for this class.
Note a couple of things in the class implementation in listing 5.10. First, because Spring Cloud already defines a HystrixConcurrencyStrategy, every method that could be overridden needs to check whether an existing concurrency strategy is present and then either call the existing concurrency strategy’s method or the base Hystrix concurrency strategy method. You have to do this as a convention to ensure that you properly invoke the already-existing Spring Cloud’s HystrixConcurrency-Strategy that deals with security. Otherwise, you can have nasty behavior when trying to use Spring security context in your Hystrix protected code.
The second thing to note is the wrapCallable() method in listing 5.11. In this method, you pass in Callable implementation, DelegatingUserContext-Callable, that will be used to set the UserContext from the parent thread executing the user’s REST service call to the Hystrix command thread protecting the method that’s doing the work within.
The next step in propagating the thread context of the parent thread to your Hystrix command is to implement the Callable class that will do the propagation. For this example, this call is in the hystrix package and is called DelegatingUser-ContextCallable.java. The following listing shows the code from this class.
When a call is made to a Hystrix protected method, Hystrix and Spring Cloud will instantiate an instance of the DelegatingUserContextCallable class, passing in the Callable class that would normally be invoked by a thread managed by a Hystrix command pool. In the previous listing, this Callable class is stored in a Java property called delegate. Conceptually, you can think of the delegate property as being the handle to the method protected by a @HystrixCommand annotation.
In addition to the delegated Callable class, Spring Cloud is also passing along the UserContext object off the parent thread that initiated the call. With these two values set at the time the DelegatingUserContextCallable instance is created, the real action will occur in the call() method of your class.
The first thing to do in the call() method is set the UserContext via the UserContextHolder.setContext() method. Remember, the setContext() method stores a UserContext object in a ThreadLocal variable specific to the thread being run. Once the UserContext is set, you then invoke the call() method of the delegated Callable class. This call to delegate.call() invokes the method protected by the @HystrixCommand annotation.
Now that you have your HystrixConcurrencyStrategy via the ThreadLocal-AwareStrategy class and your Callable class defined via the DelegatingUserContextCallable class, you need to hook them in Spring Cloud and Hystrix. To do this, you’re going to define a new configuration class. This configuration, called ThreadLocalConfiguration, is shown in the following listing.
This Spring configuration class basically rebuilds the Hystrix plugin that manages all the different components running within your service. In the init() method, you’re grabbing references to all the Hystrix components used by the plugin. You then register your custom HystrixConcurrencyStrategy (ThreadLocalAwareStrategy).
HystrixPlugins.getInstance().registerConcurrencyStrategy(
  new ThreadLocalAwareStrategy(existingConcurrencyStrategy));
Remember, Hystrix allows only one HystrixConcurrencyStrategy. Spring will attempt to autowire in any existing HystrixConcurrencyStrategy (if it exists). Finally, when you’re all done, you re-register the original Hystrix components that you grabbed at the beginning of the init() method back with the Hystrix plugin.
With these pieces in place, you can now rebuild and restart your licensing service and call it via the GET (http://localhost:8080/v1/organizations/e254f8c-c442-4ebe-a82a-e2fc1d1ff78a/licenses/) shown earlier in figure 5.10. Now, when this call is completed, you should see the following output in your console window:
UserContext Correlation id: TEST-CORRELATION-ID
LicenseServiceController Correlation id: TEST-CORRELATION-ID
LicenseService.getLicenseByOrg Correlation: TEST-CORRELATION-ID
It’s a lot of work to produce one little result, but it’s unfortunately necessary when you use Hystrix with THREAD-level isolation.
In a distributed architecture like a microservices one, there will come a point where you’ll need to ensure that key behaviors such as security, logging, and tracking of users across multiple service calls occur. To implement this functionality, you’ll want these attributes to be consistently enforced across all of your services without the need for each individual development team to build their own solutions. While it’s possible to use a common library or framework to assist with building these capabilities directly in an individual service, doing so has three implications.
First, it’s difficult to consistently implement these capabilities in each service being built. Developers are focused on delivering functionality, and in the whirlwind of day-to-day activity they can easily forget to implement service logging or tracking. (I personally am guilty of this.) Unfortunately, for those of us working in a heavily regulated industry, such as financial services or healthcare, showing consistent and documented behavior in your systems is often a key requirement for complying with government regulations.
Second, properly implementing these capabilities is a challenge. Things like microservice security can be a pain to set up and configure with each service being implemented. Pushing the responsibilities to implement a cross-cutting concern like security down to the individual development teams greatly increases the odds that someone will not implement it properly or will forget to do it.
Third, you’ve now created a hard dependency across all your services. The more capabilities you build into a common framework shared across all your services, the more difficult it is to change or add behavior in your common code without having to recompile and redeploy all your services. This might not seem like a big deal when you have six microservices in your application, but it’s a big deal when you have a larger number of services, perhaps 30 or more. Suddenly an upgrade of core capabilities built into a shared library becomes a months-long migration process.
To solve this problem, you need to abstract these cross-cutting concerns into a service that can sit independently and act as a filter and router for all the microservice calls in your application. This cross-cutting concern is called a services gateway. Your service clients no longer directly call a service. Instead, all calls are routed through the service gateway, which acts as a single Policy Enforcement Point (PEP), and are then routed to a final destination.
In this chapter, we’re going to see how to use Spring Cloud and Netflix’s Zuul to implement a services gateway. Zuul is Netflix’s open source services gateway implementation. Specifically, we’re going to look at how to use Spring Cloud and Zuul to
Let’s dive into more detail on how a services gateway fits into the overall microservices being built in this book.
Until now, with the microservices you’ve built in earlier chapters, you’ve either directly called the individual services through a web client or called them programmatically via a service discovery engine such as Eureka.
A service gateway acts as an intermediary between the service client and a service being invoked. The service client talks only to a single URL managed by the service gateway. The service gateway pulls apart the path coming in from the service client call and determines what service the service client is trying to invoke. Figure 6.2 illustrates how like a “traffic” cop directing traffic, the service gateway directs the user to a target microservice and corresponding instance. The service gateway sits as the gatekeeper for all inbound traffic to microservice calls within your application. With a service gateway in place, your service clients never directly call the URL of an individual service, but instead place all calls to the service gateway.
Because a service gateway sits between all calls from the client to the individual services, it also acts as a central Policy Enforcement Point (PEP) for service calls. The use of a centralized PEP means that cross-cutting service concerns can be implemented in a single place without the individual development teams having to implement these concerns. Examples of cross-cutting concerns that can be implemented in a service gateway include
Earlier in chapter 4 when I introduced Eureka, I talked about how centralized load balancers can be single point of failure and a bottleneck for your services. A service gateway, if not implemented correctly, can carry the same risk. Keep the following in mind as you build your service gateway implementation.
Load balancers are still useful when out in front of individual groups of services. In this case, a load balancer sitting in front of multiple service gateway instances is an appropriate design and ensures your service gateway implementation can scale. Having a load balancer sit in front of all your service instances isn’t a good idea because it becomes a bottleneck.
Keep any code you write for your service gateway stateless. Don’t store any information in memory for the service gateway. If you aren’t careful, you can limit the scalability of the gateway and have to ensure that the data gets replicated across all service gateway instances.
Keep the code you write for your service gateway light. The service gateway is the “chokepoint” for your service invocation. Complex code with multiple database calls can be the source of difficult-to-track-down performance problems in the service gateway.
Let’s now look at how to implement a service gateway using Spring Cloud and Netflix Zuul.
Spring Cloud integrates with the Netflix open source project Zuul. Zuul is a services gateway that’s extremely easy to set up and use via Spring Cloud annotations. Zuul offers a number of capabilities, including
To get started with Zuul, you’re going to do three things:
If you’ve been following the chapters sequentially in this book, the work you’re about to do should be familiar. To build a Zuul server, you need to set up a new Spring Boot service and define the corresponding Maven dependencies. You can find the project source code for this chapter in the GitHub repository for this book (https://github.com/carnellj/spmia-chapter6). Fortunately, little is needed to set up Zuul in Maven. You only need to define one dependency in your zuulsvr/pom.xml file:
<dependency>
  <groupId>org.springframework.cloud</groupId>
  <artifactId>spring-cloud-starter-zuul</artifactId>
</dependency>
This dependency tells the Spring Cloud framework that this service will be running Zuul and initialize Zuul appropriately.
After you’ve defined the maven dependencies, you need to annotate the bootstrap class for the Zuul services. The bootstrap class for the Zuul service implementation can be found in the zuulsvr/src/main/java/com/thoughtmechanix/zuulsvr/Application.java class.
That’s it. There’s only one annotation that needs to be in place: @EnableZuulProxy.
If you look through the documentation or have auto-complete turned on, you might notice an annotation called @EnableZuulServer. Using this annotation will create a Zuul Server that doesn’t load any of the Zuul reverse proxy filters or use Netflix Eureka for service discovery. (We’ll get into the topic of Zuul and Eureka integration shortly.) @EnableZuulServer is used when you want to build your own routing service and not use any Zuul pre-built capabilities. An example of this would be if you wanted to use Zuul to integrate with a service discovery engine other than Eureka (for example, Consul). We’ll only use the @EnableZuulProxy annotation in this book.
The Zuul proxy server is designed by default to work on the Spring products. As such, Zuul will automatically use Eureka to look up services by their service IDs and then use Netflix Ribbon to do client-side load balancing of requests from within Zuul.
I often read chapters out of order in a book, jumping to the specific topics I’m most interested in. If you do the same and don’t know what Netflix Eureka and Ribbon are, I suggest you read chapter 4 before proceeding much further. Zuul uses those technologies heavily to carry out work, so understanding the service discovery capabilities that Eureka and Ribbon bring to the table will make understanding Zuul that much easier.
The last step in the configuration process is to modify your Zuul server’s zuulsvr/src/main/resources/application.yml file to point to your Eureka server. The following listing shows the Zuul configuration needed for Zuul to communicate with Eureka. The configuration in the listing should look familiar because it’s the same configuration we walked through in chapter 4.
eureka:
 instance:
  preferIpAddress: true
 client:
  registerWithEureka: true
  fetchRegistry: true
  serviceUrl:
    defaultZone: http://localhost:8761/eureka/
Zuul at its heart is a reverse proxy. A reverse proxy is an intermediate server that sits between the client trying to reach a resource and the resource itself. The client has no idea it’s even communicating to a server other than a proxy. The reverse proxy takes care of capturing the client’s request and then calls the remote resource on the client’s behalf.
In the case of a microservices architecture, Zuul (your reverse proxy) takes a microservice call from a client and forwards it onto the downstream service. The service client thinks it’s only communicating with Zuul. For Zuul to communicate with the downstream clients, Zuul has to know how to map the incoming call to a downstream route. Zuul has several mechanisms to do this, including
All route mappings for Zuul are done by defining the routes in the zuulsvr/src/main/resources/application.yml file. However, Zuul can automatically route requests based on their service IDs with zero configuration. If you don’t specify any routes, Zuul will automatically use the Eureka service ID of the service being called and map it to a downstream service instance. For instance, if you wanted to call your organizationservice and used automated routing via Zuul, you would have your client call the Zuul service instance, using the following URL as the endpoint:
http://localhost:5555/organizationservice/v1/organizations/e254f8c-c442-4ebe-a82a-e2fc1d1ff78a
Your Zuul server is accessed via http://localhost:5555. The service you’re trying (organizationservice) to invoke is represented by the first part of the endpoint path in the service.
Figure 6.3 illustrates this mapping in action.
The beauty of using Zuul with Eureka is that not only do you now have a single endpoint that you can make calls through, but with Eureka, you can also add and remove instances of a service without ever having to modify Zuul. For instance, you can add a new service to Eureka, and Zuul will automatically route to it because it’s communicating with Eureka about where the actual physical services endpoints are located.
If you want to see the routes being managed by the Zuul server, you can access the routes via the /routes endpoint on the Zuul server. This will return a listing of all the mappings on your service. Figure 6.4 shows the output from hitting http://localhost:5555/routes.
In figure 6.4 the mappings for the services registered with Zuul are shown on the left-hand side of the JSON body returned from the /route calls. The actual Eureka service IDs the routes map to are shown on the right.
Zuul allows you to be more fine-grained by allowing you to explicitly define route mappings rather than relying solely on the automated routes created with the service’s Eureka service ID. Suppose you wanted to simplify the route by shortening the organization name rather than having your organization service accessed in Zuul via the default route of /organizationservice/v1/organizations/{organization-id}. You can do this by manually defining the route mapping in zuulsvr/src/main/resources/application.yml:
zuul:
  routes:
   organizationservice: /organization/**
By adding this configuration, you can now access the organization service by hitting the /organization/v1/organizations/{organization-id} route. If you check the Zuul server’s endpoint again, you should see the results shown in figure 6.5.
If you look carefully at figure 6.5 you’ll notice that two entries are present for the organization service. The first service entry is the mapping you defined in the application.yml file: "organization/**": "organizationservice". The second service entry is the automatic mapping created by Zuul based on the organization service’s Eureka ID: "/organizationservice/**": "organizationservice".
When you use automated route mapping where Zuul exposes the service based solely on the Eureka service ID, if no instances of the service are running, Zuul will not expose the route for the service. However, if you manually map a route to a service discovery ID and there are no instances registered with Eureka, Zuul will still show the route. If you try to call the route for the non-existent service, Zuul will return a 500 error.
If you want to exclude the automated mapping of the Eureka service ID route and only have available the organization service route that you’ve defined, you can add an additional Zuul parameter to your application.yml file, called ignored-services. The following code snippet shows how the ignored-services attribute can be used to exclude the Eureka service ID organizationservice from the automated mappings done by Zuul:
zuul:
 ignored-services: 'organizationservice'
 routes:
  organizationservice: /organization/**
The ignored-services attribute allows you to define a comma-separated list of Eureka service-IDs that you want to exclude from registration. Now, when your call the /routes endpoint on Zuul, you should only see the organization service mapping you’ve defined. Figure 6.6 shows the outcome of this mapping.
If you want to exclude all Eureka-based routes, you can set the ignored--services attribute to “*”.
A common pattern with a service gateway is to differentiate API routes vs. content routes by prefixing all your service calls with a type of label such as /api. Zuul supports this by using the prefix attribute in the Zuul configuration. Figure 6.7 lays out conceptually what this mapping prefix will look like.
In the following listing, we’ll see how to set up specific routes to your individual organization and Licensing services, exclude all of the eureka-generated services, and prefix your services with a /api prefix.
Once this configuration is done and the Zuul service has been reloaded, you should see the following two entries when hitting the /route endpoint: /api/organization and /api/licensing. Figure 6.8 shows these entries.
Let’s now look at how you can use Zuul to map to static URLs. Static URLs are URLs that point to services that aren’t registered with a Eureka service discovery engine.
Zuul can be used to route services that aren’t managed by Eureka. In these cases, Zuul can be set up to directly route to a statically defined URL. For example, let’s imagine that your license service is written in Python and you want to still proxy it through Zuul. You’d use the Zuul configuration in the following listing to achieve this.
Once this configuration change has been made, you can hit the /routes endpoint and see the static route added to Zuul. Figure 6.10 shows the results from the /routes listing.
At this point, the licensestatic endpoint won’t use Eureka and will instead directly route the request to the http://licenseservice-static:8081 endpoint. The problem is that by bypassing Eureka, you only have a single route to point requests at. Fortunately, you can manually configure Zuul to disable Ribbon integration with Eureka and then list the individual service instances that ribbon will load balance against. The following listing shows this.
Once this configuration is in place, a call to the /routes endpoint now shows that the /api/licensestatic route has been mapped to a service ID called licensestatic. Figure 6.10 shows this.
The problem with statically mapping routes and disabling Eureka support in Ribbon is that you’ve disabled Ribbon support for all your services running through your Zuul service gateway. This means that more load will be placed on your Eureka servers because Zuul can’t use Ribbon to cache the look-up of services. Remember, Ribbon doesn’t call Eureka every time it makes a call. Instead, it caches the location of the service instances locally and then checks with Eureka periodically for changes. With Ribbon out of the picture, Zuul will call Eureka every time it needs to resolve the location of a service.
Earlier in the chapter, I talked about how you might end up with multiple service gateways where different routing rules and policies would be enforced based on the type of services being called. For non-JVM applications, you could set up a separate Zuul server to handle these routes. However, I’ve found that with non-JVM-based languages, you’re better off setting up a Spring Cloud “Sidecar” instance. The Spring Cloud sidecar allows you to register non-JVM services with a Eureka instance and then proxy them through Zuul. I don’t cover Spring Sidecar in this book because you’re not writing any non-JVM services, but it’s extremely easy to set up a sidecar instance. Directions on how to do so can be found at the Spring Cloud website (http://cloud.spring.io/spring-cloud-netflix/spring-cloud-netflix.html#spring-cloud-ribbon-without-eureka).
The next thing we’re going to look at in terms of configuring routes in Zuul is how to dynamically reload routes. The ability to dynamically reload routes is useful because it allows you to change the mapping of routes without having to recycle the Zuul server(s). Existing routes can be modified quickly and new routes added within have to go through the act of recycling each Zuul server in your environment. In chapter 3, we covered how to use Spring Cloud Configuration service to externalize a microservices configuration data. You can use Spring Cloud configuration to externalize Zuul routes. In the EagleEye examples you can set up a new application folder in your config-repo (http://github.com/carnellj/config-repo) called zuulservice. Like your organization and licensing services, you’ll create three files—zuulservice.yml, zuulservice-dev.yml, and zuulservice-prod.yml—that will hold your route configuration.
To be consistent with the examples in the chapter 3 configuration, I’ve changed the route formats to move from a hierarchical format to the “.” format. The initial route configuration will have a single entry in it:
zuul.prefix=/api
If you hit the /routes endpoint, you should see all your Eureka-based services currently shown in Zuul with the prefix of /api. Now, if you wanted to add new route mappings on the fly, all you have to do is make the changes to the config file and then commit them back to the Git repository where Spring Cloud Config is pulling its configuration data from. For instance, if you wanted to disable all Eureka-based service registration and only expose two routes (one for the organization and one for the licensing service), you could modify the zuulservice-*.yml files to look like this:
zuul.ignored-services: '*'
zuul.prefix: /api
zuul.routes.organizationservice: /organization/**
zuul.routes.organizationservice: /licensing/**
Then you can commit the changes to GitHub. Zuul exposes a POST-based endpoint route /refresh that will cause it to reload its route configuration. Once this /refresh is hit, if you then hit the /routes endpoint, you’ll see that the two new routes are exposed and all the Eureka-based routes are gone.
Zuul uses Netflix’s Hystrix and Ribbon libraries to help prevent long-running service calls from impacting the performance of the services gateway. By default, Zuul will terminate and return an HTTP 500 error for any call that takes longer than one second to process a request. (This is the Hystrix default.) Fortunately, you can configure this behavior by setting the Hystrix timeout properties in your Zuul server’s configuration.
To set the Hystrix timeout for all of the services running through Zuul, you can use the hystrix.command.default.execution.isolation.thread.timeoutInMilliseconds property. For instance, if you wanted to set the default Hystrix time out to be 2.5 seconds, you could use the following configuration in your Zuul’s Spring Cloud config file:
zuul.prefix:  /api
zuul.routes.organizationservice: /organization/**
zuul.routes.licensingservice: /licensing/**
zuul.debug.request: true
hystrix.command.default.execution.isolation.thread.timeoutInMilliseconds: 2500
If you need to set the Hystrix timeout for specific service, you can replace the default part of the property with the Eureka service ID name of the service whose timeout you want to override. For instance, if you wanted to change only the licensingservice’s timeout to three seconds and leave the rest of the services to use the default Hystrix timeout, you could use something like this in your configuration:
hystrix.command.licensingservice.execution.isolation.thread.timeoutInMilliseconds: 3000
Finally, you need to be aware of one other timeout property. While you’ve overridden the Hystrix timeout, the Netflix Ribbon also times out any calls that take longer than five seconds. While I highly recommend you revisit the design of any call that takes longer than five seconds, you can override the Ribbon timeout by setting the following property: servicename.ribbon.ReadTimeout. For example, if you wanted to override the licensingservice to have a seven-second timeout, you’d use the following configuration:
hystrix.command.licensingservice.execution.
For configurations longer than five seconds you have to set both the Hystrix and the Ribbon timeouts.
While being able to proxy all requests through the Zuul gateway does allow you to simplify your service invocations, the real power of Zuul comes into play when you want to write custom logic that will be applied against all the service calls flowing through the gateway. Most often this custom logic is used to enforce a consistent set of application policies like security, logging, and tracking against all the services.
These application policies are considered cross-cutting concerns because you want them to be applied to all the services in your application without having to modify each service to implement them. In this fashion, Zuul filters can be used in a similar way as a J2EE servlet filter or a Spring Aspect that can intercept a wide body of behaviors and decorate or change the behavior of the call without the original coder being aware of the change. While a servlet filter or Spring Aspect is localized to a specific service, using Zuul and Zuul filters allows you implement cross-cutting concerns across all the services being routed through Zuul.
Zuul allows you to build custom logic using a filter within the Zuul gateway. A filter allows you to implement a chain of business logic that each service request passes through as it’s being implemented.
Zuul supports three types of filters:
Figure 6.11 shows how the pre-, post, and route filters fit together in terms of processing a service client’s request.
If you follow the flow laid out in figure 6.11, you’ll see everything start with a service client making a call to a service exposed through the service gateway. From there the following activities take place:
The best way to understand how to implement Zuul filters is to see them in use. To this end, in the next several sections you’ll build a pre-, route, and post filter and then run service client requests through them.
Figure 6.12 shows how these filters will fit together in processing requests to your EagleEye services.
Following the flow of figure 6.12, you’ll see the following filters being used:
Building filters in Zuul is an extremely simple activity. To begin, you’ll build a Zuul pre-filter, called the TrackingFilter, that will inspect all incoming requests to the gateway and determine whether there’s an HTTP header called tmx-correlation-id present in the request. The tmx-correlation-id header will contain a unique GUID (Globally Universal Id) that can be used to track a user’s request across multiple microservices.
We discussed the concept of a correlation ID in chapter 5. Here we’re going to walk through in more detail how to use Zuul to generate a correlation ID. If you skipped around in the book, I highly recommend you look at chapter 5 and read the section on Hystrix and Thread context. Your implementation of correlation IDs will be implemented using ThreadLocal variables and there’s extra work to do to have ThreadLocal variables work with Hystrix.
If the tmx-correlation-id isn’t present on the HTTP header, your Zuul TrackingFilter will generate and set the correlation ID. If there’s already a correlation ID present, Zuul won’t do anything with the correlation ID. The presence of a correlation ID means that this particular service call is part of a chain of service calls carrying out the user’s request. In this case, your TrackingFilter class will do nothing.
Let’s go ahead and look at the implementation of the TrackingFilter in the following listing. This code can also be found in the book samples in zuulsvr/src/main/java/com/thoughtmechanix/zuulsvr/filters/TrackingFilter.java.
To implement a filter in Zuul, you have to extend the ZuulFilter class and then override four methods: filterType(), filterOrder(), shouldFilter(), and run(). The first three methods in this list describe to Zuul what type of filter you’re building, what order it should be run in compared to the other filters of its type, and whether it should be active. The last method, run(), contains the business logic the filter is going to implement.
You’ve implemented a class called FilterUtils. This class is used to encapsulate common functionality used by all your filters. The FilterUtils class is located in the zuulsvr/src/main/java/com/thoughtmechanix/zuulsvr/FilterUtils.java. We’re not going to walk through the entire FilterUtils class, but the key methods we’ll discuss here are the getCorrelationId() and setCorrelationId() functions. The following listing shows the code for the FilterUtils getCorrelationId() method.
public String getCorrelationId(){
  RequestContext ctx = RequestContext.getCurrentContext();

  if (ctx.getRequest()
        .getHeader(CORRELATION_ID) !=null) {
 return ctx.getRequest()
           .getHeader(CORRELATION_ID);
  }
  else{
 return ctx.getZuulRequestHeaders()
           .get(CORRELATION_ID);
  }
}
The key thing to notice in listing 6.7 is that you first check to see if the tmx-correlation-ID is already set on the HTTP Headers for the incoming request. You do this using the ctx.getRequest().getHeader(CORRELATION_ID) call.
In a normal Spring MVC or Spring Boot service, the RequestContext would be of type org.springframework.web.servletsupport.Request- Context. However, Zuul gives a specialized RequestContext that has several additional methods for accessing Zuul-specific values. This request context is part of the com.netflix.zuul.context package.
If it isn’t there, you then check the ZuulRequestHeaders. Zuul doesn’t allow you to directly add or modify the HTTP request headers on an incoming request. If we add the tmx-correlation-id and then try to access it again later in the filter, it won’t be available as part of the ctx.getRequestHeader() call. To work around this, you use the FilterUtils getCorrelationId() method. You may remember that earlier in the run() method on your TrackingFilter class, you did exactly this with the following code snippet:
else{
  filterUtils.setCorrelationId(generateCorrelationId());
  logger.debug("tmx-correlation-id generated
   in tracking filter: {}.",
  filterUtils.getCorrelationId());
}
The setting of the tmx-correlation-id occurs with the FilterUtils set-CorrelationId() method:
public void setCorrelationId(String correlationId){
  RequestContext ctx =
    RequestContext.getCurrentContext();
  ctx.addZuulRequestHeader(CORRELATION_ID, correlationId);
}
In the FilterUtils setCorrelationId() method, when you want to add a value to the HTTP request headers, you use the RequestContext’s addZuulRequestHeader() method. This method will maintain a separate map of HTTP headers that were added while a request was flowing through the filters with your Zuul server. The data contained within the ZuulRequestHeader map will be merged when the target service is invoked by your Zuul server.
Now that you’ve guaranteed that a correlation ID has been added to every microservice call flowing through Zuul, how do you ensure that
To implement this, you’re going to build a set of three classes into each of your microservices. These classes will work together to read the correlation ID (along with other information you’ll add later) off the incoming HTTP request, map it to a class that’s easily accessible and useable by the business logic in the application, and then ensure that the correlation ID is propagated to any downstream service calls.
Figure 6.13 demonstrates how these different pieces are going to be built out using your licensing service.
Let’s walk through what’s happening in figure 6.13:
The subject of whether you should use common libraries across your microservices is a gray area in microservice design. Microservice purists will tell you that you shouldn’t use a custom framework across your services because it introduces artificial dependencies in your services. Changes in business logic or a bug can introduce wide scale refactoring of all your services. On the other side, other microservice practitioners will say that a purist approach is impractical because certain situations exist (like the previous UserContextFilter example) where it makes sense to build a common library and share it across services.
I think there’s a middle ground here. Common libraries are fine when dealing with infrastructure-style tasks. If you start sharing business-oriented classes, you’re asking for trouble because you’re breaking down the boundaries between the services.
I seem to be breaking my own advice with the code examples in this chapter, because if you look at all the services in the chapter, they all have their own copies of the UserContextFilter, UserContext, and UserContextInterceptor classes. The reason I took a share-nothing approach here is that I don’t want to complicate the code examples in this book by having to create a shared library that would have to be published to a third-party Maven repository. Hence, all the classes in the utils package of the service are shared across all the services.
The first class you’re going to build is the UserContextFilter class. This class is an HTTP servlet filter that will intercept all incoming HTTP requests coming into the service and map the correlation ID (and a few other values) from the HTTP request to the UserContext class. The following listing shows the code for the UserContext class. The source for this class can be found in licensing-service/src/main/java/com/thoughtmechanix/licenses/utils/UserContextFilter.java.
Ultimately, the UserContextFilter is used to map the HTTP header values you’re interested in into a Java class, UserContext.
The UserContext class is used to hold the HTTP header values for an individual service client request being processed by your microservice. It consists of a getter/setter method that retrieves and stores values from java.lang.ThreadLocal. The following listing shows the code from the UserContext class. The source for this class can be found in licensing-service/src/main/java/com/thoughtmechanix/-licenses/utils/UserContext.java.
@Component
public class UserContext {
    public static final String CORRELATION_ID = "tmx-correlation-id";
    public static final String AUTH_TOKEN     = "tmx-auth-token";
    public static final String USER_ID        = "tmx-user-id";
    public static final String ORG_ID         = "tmx-org-id";
    private String correlationId= new String();
    private String authToken= new String();
    private String userId = new String();
    private String orgId = new String();

    public String getCorrelationId() { return correlationId;}
    public void setCorrelationId(String correlationId) {
      this.correlationId = correlationId;}

    public String getAuthToken() { return authToken;}
    public void setAuthToken(String authToken) {
      this.authToken = authToken;}

    public String getUserId() { return userId;}
    public void setUserId(String userId) { this.userId = userId;}

    public String getOrgId() { return orgId;}
    public void setOrgId(String orgId) {this.orgId = orgId;
  }
}
Now the UserContext class is nothing more than a POJO holding the values scraped from the incoming HTTP request. You use a class called zuulsvr/src/main/java/com/thoughtmechanix/zuulsvr/filters/UserContextHolder.java to store the UserContext in a ThreadLocal variable that is accessible in any method being invoked by the thread processing the user’s request. The code for UserContextHolder is shown in the following listing.
public class UserContextHolder {
  private static final ThreadLocal<UserContext> userContext
      = new ThreadLocal<UserContext>();

  public static final UserContext getContext(){
        UserContext context = userContext.get();

        if (context == null) {
            context = createEmptyContext();
            userContext.set(context);
        }

        return userContext.get();
  }

  public static final void setContext(UserContext context) {
    Assert.notNull(context,
     "Only non-null UserContext instances are permitted");
        userContext.set(context);
    }

    public static final UserContext createEmptyContext(){
        return new UserContext();
    }
}
The last piece of code that we’re going to look at is the UserContextInterceptor class. This class is used to inject the correlation ID into any outgoing HTTP-based service requests being executed from a RestTemplate instance. This is done to ensure that you can establish a linkage between service calls.
To do this you’re going to use a Spring Interceptor that’s being injected into the RestTemplate class. Let’s look at the UserContextInterceptor in the following listing.
To use the UserContextInterceptor you need to define a RestTemplate bean and then add the UserContextInterceptor to it. To do this, you’re going to add your own RestTemplate bean definition to the licensing-service/src/main/java/com/thoughtmechanix/licenses/Application.java class. The following listing shows the method that’s added to this class.
With this bean definition in place, any time you use the @Autowired annotation and inject a RestTemplate into a class, you’ll use the RestTemplate created in listing 6.11 with the UserContextInterceptor attached to it.
Now that you have correlation ID’s being passed to each service, it’s possible to trace a transaction as it flows through all the services involved in the call. To do this you need to ensure that each service logs to a central log aggregation point that captures log entries from all of your services into a single point. Each log entry captured in the log aggregation service will have a correlation ID associated to each entry. Implementing a log aggregation solution is outside the scope of this chapter, but in chapter 9, we’ll see how to use Spring Cloud Sleuth. Spring Cloud Sleuth won’t use the TrackingFilter that you built here, but it will use the same concepts of tracking the correlation ID and ensuring that it’s injected in every call.
Remember, Zuul executes the actual HTTP call on behalf of the service client. Zuul has the opportunity to inspect the response back from the target service call and then alter the response or decorate it with additional information. When coupled with capturing data with the pre-filter, a Zuul post filter is an ideal location to collect metrics and complete any logging associated with the user’s transaction. You’ll want to take advantage of this by injecting the correlation ID that you’ve been passing around to your microservices back to the user.
You’re going to do this by using a Zuul post filter to inject the correlation ID back into the HTTP response headers being passed back to the caller of the service. This way, you can pass the correlation ID back to the caller without ever having to touch the message body. The following listing shows the code for building a post filter. This code can be found in zuulsvr/src/main/java/com/thoughtmechanix/zuulsvr/filters/ResponseFilter.java.
Once the ResponseFilter has been implemented, you can fire up your Zuul service and call the EagleEye licensing service through it. Once the service has completed, you’ll see a tmx-correlation-id on the HTTP response header from the call. Figure 6.14 shows the tmx-correlation-id being sent back from the call.
Up until this point, all our filter examples have dealt with manipulating the service client calls before and after it has been routed to its target destination. For our last filter example, let’s look at how you can dynamically change the target route you want to send the user to.
The last Zuul filter we’ll look at is the Zuul route filter. Without a custom route filter in place, Zuul will do all its routing based on the mapping definitions you saw earlier in the chapter. However, by building a Zuul route filter, you can add intelligence to how a service client’s invocation will be routed.
In this section, you’ll learn about Zuul’s route filter by building a route filter that will allow you to do A/B testing of a new version of a service. A/B testing is where you roll out a new feature and then have a percentage of the total user population use that feature. The rest of the user population still uses the old service. In this example, you’re going to simulate rolling out a new version of the organization service where you want 50% of the users go to the old service and 50% of the users to go to the new service.
To do this you’re going to build a Zuul route filter, called SpecialRoutes-Filter, that will take the Eureka service ID of the service being called by Zuul and call out to another microservice called SpecialRoutes. The SpecialRoutes service will check an internal database to see if the service name exists. If the targeted service name exists, it will return a weight and target destination of an alternative location for the service. The SpecialRoutesFilter will then take the weight returned and, based on the weight, randomly generate a number that will be used to determine whether the user’s call will be routed to the alternative organization service or to the organization service defined in the Zuul route mappings. Figure 6.15 shows the flow of what happens when the SpecialRoutesFilter is used.
In figure 6.15, after the service client has called a service “fronted” by Zuul, the SpecialRoutesFilter takes the following actions:
We’re going to start walking through the code you used to build the SpecialRoutesFilter. Of all the filters we’ve looked at so far, implementing a Zuul route filter requires the most coding effort, because with a route filter you’re taking over a core piece of Zuul functionality, routing, and replacing it with your own functionality. We’re not going to go through the entire class in detail here, but rather work through the pertinent details.
The SpecialRoutesFilter follows the same basic pattern as the other Zuul filters. It extends the ZuulFilter class and sets the filterType() method to return the value of “route”. I’m not going to go into any more explanation of the filter-Order() and shouldFilter() methods as they’re no different from the previous filters discussed earlier in the chapter. The following listing shows the route filter skeleton.
package com.thoughtmechanix.zuulsvr.filters;

@Component
public class SpecialRoutesFilter extends ZuulFilter {
  @Override
  public String filterType() {
    return filterUtils.ROUTE_FILTER_TYPE;
  }

  @Override
  public int filterOrder() {}
  @Override
  public boolean shouldFilter() {}
  @Override
  public Object run() {}
}
The real work for the SpecialRoutesFilter begins in the run() method of the code. The following listing shows the code for this method.
The general flow of code in listing 6.15 is that when a route request hits the run() method in the SpecialRoutesFilter, it will execute a REST call to the SpecialRoutes service. This service will execute a lookup and determine if a routing record exists for the Eureka service ID of the target service being called. The call out to SpecialRoutes service is done in the getAbRoutingInfo() method. The get-AbRoutingInfo() method is shown in the following listing.
Once you’ve determined that there’s a routing record present for the target service, you need to determine whether you should route the target service request to the alternative service location or to the default service location statically managed by the Zuul route maps. To make this determination, you call the useSpecialRoute() method. The following listing shows this method.
This method does two things. First, the method checks the active field on the AbTestingRoute record returned from the SpecialRoutes service. If the record is set to "N," useSpecialRoute() method shouldn’t do anything because you don’t want to do any routing at this moment. Second, the method generates a random number between 1 and 10. The method will then check to see if the weight of the return route is less than the randomly generated number. If the condition is true, the useSpecialRoute method returns true indicating you do want to use the route.
Once you’ve determined that you do want to route the service request coming into the SpecialRoutesFilter, you’re going to forward the request onto the target service.
The actual forwarding of the route to the downstream service is where the majority of the work occurs in the SpecialRoutesFilter. While Zuul does provide helper functions to make this task easier, the majority of the work still lies with the developer. The forwardToSpecialRoute() method does the forwarding work for you. The code in this method borrows heavily from the source code for the Spring Cloud SimpleHost-RoutingFilter class. While we’re not going to go through all of the helper functions called in the forwardToSpecialRoute() method, we’ll walk through the code in this method, as shown in the following listing.
The key takeaway from the code in listing 6.18 is that you’re copying all of the values from the incoming HTTP request (the header parameters, HTTP verb, and the body) into a new request that will be invoked on the target service. The forwardToSpecial-Route() method then takes the response back from the target service and sets it on the HTTP request context used by Zuul. This is done via the setResponse() helper method (not shown). Zuul uses the HTTP request context to return the response back from the calling service client.
Now that you’ve implemented the SpecialRoutesFilter you can see it an action by calling the licensing service. As you may remember from earlier chapters, the licensing service calls the organization service to retrieve the contact data for the organization.
In the code example, the specialroutesservice has a database record for the organization service that will route the requests for calls to the organization service 50% of the time to the existing organization service (the one mapped in Zuul) and 50% of the time to an alternative organization service. The alternative organization service route returned from the SpecialRoutes service will be http://orgservice-new and will not be accessible directly from Zuul. To differentiate between the two services, I’ve modified the organization service(s) to pre-pend the text “OLD::” and “NEW::” to contact names returned by the organization service.
If you now hit the licensing service endpoint through Zuul
http://localhost:5555/api/licensing/v1/organizations/e254f8c-c442-4ebe-a82a-e2fc1d1ff78a/licenses/f3831f8c-c338-4ebe-a82a-e2fc1d1ff78a
you should see the contactName returned from the licensing service call flip between the OLD:: and NEW:: values. Figure 6.16 shows this.
A Zuul routes filter does take more effort to implement then a pre- or post filter, but it’s also one of the most powerful parts of Zuul because you’re able to easily add intelligence to the way your services are routed.
Security. The mention of the word will often cause an involuntary groan from the developer who hears it. You’ll hear them mutter and curse under their breath, “It’s obtuse, hard to understand, and even harder to debug.” Yet you won’t find any developer (except maybe for inexperienced developers) say that that they don’t worry about security.
A secure application involves multiple layers of protection, including
This chapter is only going to deal with the first bullet point in this list: how to authenticate that the user calling your microservice is who they say they are and determine whether they’re authorized to carry out the action they’re requesting from your microservice. The other two topics are extremely broad security topics that are outside the scope of this book.
To implement authorization and authentication controls, you’re going to use Spring Cloud security and the OAuth2 (Open Authentication) standard to secure your Spring-based services. OAuth2 is a token-based security framework that allows a user to authenticate themselves with a third-party authentication service. If the user successfully authenticates, they will be presented a token that must be sent with every request. The token can then be validated back to the authentication service. The main goal behind OAuth2 is that when multiple services are called to fulfill a user’s request, the user can be authenticated by each service without having to present their credentials to each service processing their request. Spring Boot and Spring Cloud each provide an out-of-the-box implementation of an OAuth2 service and make it extremely easy to integrate OAuth2 security into your service.
In this chapter, we’ll show you how to protect your microservices using OAuth2; however, a full-blown OAuth2 implementation also requires a front-web application to enter your user credentials. We won’t be going through how to set up the front-end application because that’s out of scope for a book on microservices. Instead, we’ll use a REST client, like POSTMAN, to simulate the presentation of credentials. For a good tutorial on how to configure your front-end application, I recommend you look at the following Spring tutorial: https://spring.io/blog/2015/02/03/sso-with-oauth2-angular-js-and-spring-security-part-v.
The real power behind OAuth2 is that it allows application developers to easily integrate with third-party cloud providers and do user authentication and authorization with those services without having to constantly pass the user’s credentials to the third-party service. Cloud providers such as Facebook, GitHub, and Salesforce all support OAuth2 as a standard.
Before we get into the technical details of protecting our services with OAuth2, let’s walk through the OAuth2 architecture.
OAuth2 is a token-based security authentication and authorization framework that breaks security down into four components. These four components are
The four components interact together to authenticate the user. The user only has to present their credentials. If they successfully authenticate, they’re issued an authentication token that can be passed from service to service. This is shown in figure 7.1.
OAuth2 is a token-based security framework. A user authenticates against the OAuth2 server by providing their credentials along with the application that they’re using to access the resource. If the user’s credentials are valid, the OAuth2 server provides a token that can be presented every time a service being used by the user’s application tries to access a protected resource (the microservice).
The protected resource can then contact the OAuth2 server to determine the validity of the token and retrieve what roles a user has assigned to them. Roles are used to group related users together and to define what resources that group of users can access. For the purposes of this chapter, you’re going to use OAuth2 and roles to define what service endpoints and what HTTP verbs a user can call on an endpoint.
Web service security is an extremely complicated subject. You have to understand who’s going to call your services (internal users to your corporate network, external users), how they’re going to call your service (internal web-based client, mobile device, web application outside your corporate network), and what actions they’re going to take with your code. OAuth2 allows you to protect your REST-based services across these different scenarios through different authentication schemes called grants. The OAuth2 specification has four types of grants:
We aren’t going to walk through each of these grant types or provide code examples for each grant type. That’s simply too much material to cover in one chapter. Instead, I’ll do the following:
I do provide overview material on the other OAuth2 grant types in appendix B, “OAuth2 grant types.” If you’re interested in diving into more detail on the OAuth2 spec and how to implement all the grant types, I highly recommend Justin Richer and Antonio Sanso’s book, OAuth2 in Action (Manning, 2017), which is a comprehensive explanation of OAuth2.
To understand how to set up the authentication and authorization pieces of OAuth2, you’re going to implement the OAuth2 password grant type. To implement this grant, you’ll do the following:
Like all the examples in this book’s chapters, your OAuth2 authentication service is going to be another Spring Boot service. The authentication service will authenticate the user credentials and issue a token. Every time the user tries to access a service protected by the authentication service, the authentication service will validate that the OAuth2 token was issued by it and that it hasn’t expired. The authentication service will be the equivalent of the authentication service in figure 7.1.
To get started, you’re going to set up two things:
You can find all code examples for the authentication service in the authentication-service directory. To set up an OAuth2 authentication server, you need the following Spring Cloud dependencies in the authentication-service/pom.xml file:
<dependency>
  <groupId>org.springframework.cloud</groupId>
  <artifactId>spring-cloud-security</artifactId>
</dependency>

<dependency>
  <groupId>org.springframework.security.oauth</groupId>
  <artifactId>spring-security-oauth2</artifactId>
</dependency>
The first dependency, spring-cloud-security, brings in the general Spring and Spring Cloud security libraries. The second dependency, spring-security-oauth2, pulls in the Spring OAuth2 libraries.
Now that the Maven dependencies are defined, you can work on the bootstrap class. This class can be found in the authentication-service/src/main/java/com/thoughtmechanix/authentication/Application.java class. The following listing shows the code for the Application.java class.
The first thing to note in this listing is the @EnableAuthorizationServer annotation. This annotation tells Spring Cloud that this service will be used as an OAuth2 service and to add several REST-based endpoints that will be used in the OAuth2 authentication and authorization processes.
The second thing you’ll see in listing 7.1 is the addition of an endpoint called /user (which maps to /auth/user). You’ll use this endpoint later in the chapter when you’re trying to access a service protected by OAuth2. This endpoint is called by the protected service to validate the OAuth2 access token and retrieve the assigned roles of the user accessing the protected service. I’ll discuss this endpoint in greater detail later in the chapter.
At this point you have an authentication service, but haven’t defined any applications, users, or roles within the authentication server. You can begin by registering the EagleEye application with your authentication service. To do this you’re going to set up an additional class in your authentication service called authentication-service/src/main/java/com/thoughtmechanix/authentication/security/OAuth2 Config.java.
This class will define what applications are registered with your OAuth2 authentication service. It’s important to note that just because an application is registered with your OAuth2 service, it doesn’t mean that the service will have access to any protected resources.
I’ve often found that developers “mix and match” the meaning of the terms authentication and authorization. Authentication is the act of a user proving who they are by providing credentials. Authorization determines whether a user is allowed to do what they’re trying to do. For instance, the user Jim could prove his identity by providing a user ID and password, but he may not be authorized to look at sensitive data such as payroll data. For the purposes of our discussion, a user must be authenticated before authorization takes place.
The OAuth2Config class defines what applications and the user credentials the OAuth2 service knows about. In the following listing you can see the OAuth2Config.java code.
The first thing to notice in the code is that you’re extending Spring’s AuthenticationServerConfigurer class and then marking the class with a @Configuration annotation. The AuthenticationServerConfigurer class is a core piece of Spring Security. It provides the basic mechanisms for carrying out key authentication and authorization functions. For the OAuth2Config class you’re going to override two methods. The first method, configure(), is used to define what client applications are registered with your authentication service. The configure() method takes a single parameter called clients of type ClientDetails-ServiceConfigurer. Let’s start walking through the code in the configure() method in a little more detail. The first thing you do in this method is register which client applications are allowed to access services protected by the OAuth2 service. I’m using “access” here in the broadest terms, because you control what the users of the client applications can do later by checking whether the user that the service is being invoked for is authorized to take the actions they’re trying to take:
clients.inMemory()
    .withClient("eagleeye")
    .secret("thisissecret")
    .authorizedGrantTypes("password",
                            "client_credentials")
    .scopes("webclient","mobileclient");
The ClientDetailsServiceConfigurer class supports two different types of stores for application information: an in-memory store and a JDBC store. For the purposes of this example, you’re going to use the clients.inMemory() store.
The two method calls withClient() and secret() provide the name of the application (eagleeye) that you’re registering along with a secret (a password, thisissecret) that will be presented when the EagleEye application calls your OAuth2 server to receive an OAuth2 access token.
The next method, authorizedGrantTypes(), is passed a comma-separated list of the authorization grant types that will be supported by your OAuth2 service. In your service, you’ll support the password and client credential grants.
The scopes() method is used to define the boundaries that the calling application can operate in when they’re asking your OAuth2 server for an access token. For instance, Thoughtmechanix might offer two different versions of the same application, a web-based application and a mobile phone based application. Each of these apps can use the same client name and secret key to ask for access to resources protected by the OAuth2 server. However, when the apps ask for a key, they need to define the specific scope they are operating in. By defining the scope, you can write authorization rules specific to the scope the client application is working in.
For instance, you might have a user who can access the EagleEye application with both the web-based client and the mobile-phone of the application. Each version of the application does the following:
Thus you’re going to register the EagleEye application with the same application name and secret key, but the web application will only use the “webclient” scope while the mobile phone version of the application will use the “mobileclient” scope. By using scope, you can then define authorization rules in your protected services that can limit what actions a client application can take based on the application they are logging in with. This will be regardless of what permissions the user has. For example, you might want to restrict what data a user can see based on whether they’re using a browser inside the corporate network versus browsing using an application on a mobile device. The practice of restricting data based on the access mechanism of the data is common when dealing with sensitive customer information (such as health records or tax information).
At this point you’ve registered a single application, EagleEye, with your OAuth2 server. However, because you’re using a password grant, you need to set up user accounts and passwords for those users before you start.
You’ve defined and stored application-level key names and secrets. You’re now going to set up individual user credentials and the roles that they belong to. User roles will be used to define the actions a group of users can do with a service.
Spring can store and retrieve user information (the individual user’s credentials and the roles assigned to the user) from an in-memory data store, a JDBC-backed relational database, or an LDAP server.
I want to be careful here in terms of definition. The OAuth2 application information for Spring can store its data in an in-memory or relational database. The Spring user credentials and security roles can be stored in an in-memory database, relational database, or LDAP (Active Directory) server. To keep things simple because our primary purpose is to walk through OAuth2, you’re going to use an in-memory data store.
For the code examples in this chapter, you’re going to define user roles using an in-memory data store. You’re going to define two user accounts: john.carnell and william.woodward. The john.carnell account will have the role of USER and the william.woodward account will have the role of ADMIN.
To configure your OAuth2 server to authenticate user IDs, you have to set up a new class: authentication-service/src/main/com/thoughtmechanix/authentication/security/WebSecurityConfigurer.java. The following listing shows the code for this class.
Like other pieces of the Spring Security framework, to set up users (and their roles), start by extending the WebSecurityConfigurerAdapter class and mark it with the @Configuration annotation. Spring Security is implemented in a fashion similar to how you snap Lego blocks together to build a toy car or model. As such, you need to provide the OAuth2 server a mechanism to authenticate users and return the user information about the authenticating user. This is done by defining two beans in your Spring WebSecurityConfigurerAdapter implementation: authentication-ManagerBean() and userDetailsServiceBean(). These two beans are exposed by using the default authentication authenticationManagerBean() and user-DetailsServiceBean() methods from the parent WebSecurityConfigurerAdapter class.
As you’ll remember from listing 7.2, these beans are injected into the configure--(AuthorizationServerEndpointsConfigurer endpoints) method shown in the OAuth2Config class:
public void configure( AuthorizationServerEndpointsConfigurer endpoints)
These two beans are used to configure the /auth/oauth/token and /auth/user endpoints that we’ll see in action shortly.
At this point you have enough of your base OAuth2 server functionality in place to perform application and user authentication for the password grant flow. Now you’ll simulate a user acquiring an OAuth2 token by using POSTMAN to POST to the http://localhost:8901/auth/oauth/token endpoint and provide the application, secret key, user ID, and password.
First, you need to set up POSTMAN with the application name and secret key. You’re going to pass these elements to your OAuth2 server endpoint using basic authentication. Figure 7.2 shows how POSTMAN is set up to execute a basic authentication call.
However, you’re not ready to make the call to get the token yet. Once the application name and secret key are configured, you need to pass in the following information in the service as HTTP form parameters:
Unlike other REST calls in this book, the parameters in this list will not be passed in as a JavaScript body. The OAuth2 standard expects all parameters passed to the token generation endpoint to be HTTP form parameters. Figure 7.3 shows how HTTP form parameters are configured for your OAuth2 call.
Figure 7.4 shows the JavaScript payload that’s returned from the /auth/oauth/token call.
The payload returned contains five attributes:
Now that you have a valid OAuth2 access token, we can use the /auth/user endpoint that you created in your authentication service to retrieve information about the user associated with the token. Later in the chapter, any services that are going to be protected resources will call the authentication service’s /auth/user endpoint to validate the token and retrieve the user information.
Figure 7.5 shows what the results would be if you called the /auth/user endpoint. As you look at figure 7.5, notice how the OAuth2 access token is passed in as an HTTP header.
In figure 7.5 you’re issuing a HTTP GET against the /auth/user endpoint. However, any time you call an OAuth2 protected endpoint (including the OAuth2 /auth/user endpoint) you need to pass along the OAuth2 access token. To do this, always create an HTTP header called Authorization and with a value of Bearer XXXXX. In the case of your call in figure 7.5, the HTTP header will be of the value Bearer e9decabc-165b-4677-9190-2e0bf8341e0b. The access token passed in is the access token returned when you called the /auth/oauth/token endpoint in figure 7.4.
If the OAuth2 access token is valid, the /auth/user endpoint will return information about the user, including what roles are assigned to them. For instance, from figure 7.10, you can see that the user john.carnell has the role of USER.
Spring assigns the prefix of ROLE_to user’s roles, so ROLE_USER means that john.carnell has the USER role.
Once you’ve registered an application with your OAuth2 authentication service and set up individual user accounts with roles, you can begin exploring how to protect a resource using OAuth2. While the creation and management of OAuth2 access tokens is the responsibility of the OAuth2 server, in Spring, the definition of what user roles have permissions to do what actions occurs at the individual service level.
To set up a protected resource, you need to take the following actions:
Let’s start with one of the simplest examples of setting up a protected resource by taking your organization service and ensuring that it can only be called by an authenticated user.
As usual with Spring microservices, you have to add a couple of dependencies to the organization service’s Maven organization-service/pom.xml file. Two dependencies are being added: Spring Cloud Security and Spring Security OAuth2. The Spring Cloud Security jars are the core security jars. They contain framework code, annotation definitions, and interfaces for implementing security within Spring Cloud. The Spring Security OAuth2 dependency contains all the classes needed to implement an OAuth2 authentication service. The maven entries for these two dependencies are
<dependency>
  <groupId>org.springframework.cloud</groupId>
  <artifactId>spring-cloud-security</artifactId>
</dependency>
<dependency>
  <groupId>org.springframework.security.oauth</groupId>
  <artifactId>spring-security-oauth2</artifactId>
</dependency>
Remember that once you set up the organization service as a protected resource, every time a call is made to the service, the caller has to include the Authentication HTTP header containing an OAuth2 access token to the service. Your protected resource then has to call back to the OAuth2 service to see if the token is valid.
You define the callback URL in your organization service’s application.yml file as the property security.oauth2.resource.userInfoUri. Here’s the callback configuration used in the organization service’s application.yml file.
security:
 oauth2:
  resource:
    userInfoUri: http://localhost:8901/auth/user
As you can see from the security.oauth2.resource.userInfoUri property, the callback URL is to the /auth/user endpoint. This endpoint was discussed earlier in the chapter in section 7.2.4, “Authenticating the user.”
Finally, you also need to tell the organization service that it’s a protected resource. Again, you do this by adding a Spring Cloud annotation to the organization service’s bootstrap class. The organization service’s bootstrap code is shown in the next listing and can be found in the organization-service/src/main/java/com/thoughtmechanix/organization/Application.java class.
The @EnableResourceServer annotation tells Spring Cloud and Spring Security that the service is a protected resource. The @EnableResourceServer enforces a filter that intercepts all incoming calls to the service, checks to see if there’s an OAuth2 access token present in the incoming call’s HTTP header, and then calls back to the callback URL defined in the security.oauth2.resource.userInfoUri to see if the token is valid. Once it knows the token is valid, the @EnableResourceServer annotation also applies any access control rules over who and what can access a service.
You’re now ready to begin defining the access control rules around the service. To define access control rules, you need to extend a Spring ResourceServerConfigurerAdapter class and override the classes configure() method. In the organization service, your ResourceServerConfiguration class is located in organization service/src/main/java/com/thoughtmechanix/organization/security/ResourceServerConfiguration.java. Access rules can range from extremely coarse-grained (any authenticated user can access the entire service) to fine-grained (only the application with this role, accessing this URL through a DELETE is allowed).
We discuss every permutation of Spring Security’s access control rules, but we can look at several of the more common examples. These examples include protecting a resource so that
The first thing you’re going to do is protect the organization service so that it can only be accessed by an authenticated user. The following listing shows how you can build this rule into the ResourceServerConfiguration.java class.
All access rules are going to be defined inside the configure() method. You’ll use the HttpSecurity class passed in by Spring to define your rules. In this example, you’re going to restrict all access to any URL in the organization service to authenticated users only.
If you were to access the organization service without an OAuth2 access token present in the HTTP header, you’d get a 401 HTTP response code along with a message indicating that a full authentication to the service is required.
Figure 7.6 shows the output of a call to the organization service without the OAuth2 HTTP header.
Next, you’ll call the organization service with an OAuth2 access token. To get an access token, see section 7.2.4, “Authenticating the user,” on how to generate the OAuth2 token. You want to cut and paste the value of the access_token field from the returned JavaScript call out to the /auth/oauth/token endpoint and use it in your call to the organization service. Remember, when you call the organization service, you need to add an HTTP header called Authorization with the value Bearer access_token value.
Figure 7.7 shows the callout to the organization service, but this time with an OAuth2 access token passed to it.
This is probably one of the simplest use cases for protecting an endpoint using OAuth2. Next, you’ll build on this and restrict access to a specific endpoint to a specific role.
In the next example, you’re going to lock down the DELETE call on your organization service to only those users with ADMIN access. As you’ll remember from section 7.2.3, “Configuring some EagleEye Users,” you created two user accounts that could access EagleEye services: john.carnell and william.woodward. The john.carnell account had the role of USER assigned to it. The william.woodward account had the USER role and the ADMIN role.
The following listing shows how to set up the configure() method to restrict access to the DELETE endpoint to only those authenticated users who have the ADMIN role.
In listing 7.6 you’re restricting the DELETE call on any endpoint starting with /v1/organizations in your service to the ADMIN role.:
.authorizeRequests()
  .antMatchers(HttpMethod.DELETE, "/v1/organizations/**")
  .hasRole("ADMIN")
The antMatcher() method can take a comma-separated list of endpoints. These endpoints can use a wildcard style notation for defining the endpoints you want to access. For instance, if you want to restrict any of the DELETE calls regardless of the version in the URL name, you could use a * in place of the version number in your URL definitions:
.authorizeRequests()
  .antMatchers(HttpMethod.DELETE, "/*/organizations/**")
.hasRole("ADMIN")
The last part of the authorization rule definition still defines that any other endpoint in your service needs to be access by an authenticated user:
.anyRequest()
.authenticated();
Now, if you were to get an OAuth2 token for the user john.carnell (password: password1) and try to call the DELETE endpoint for the organization service (http://-localhost:8085/v1/organizations/e254f8c-c442-4ebe-a82a-e2fc1d1ff78a), you’d get a 401 HTTP status code on the call and an error message indicating that the access was denied. The JavaScript text returned by your call would be
{
 "error": "access_denied",
 "error_description": "Access is denied"
}
If you tried the exact same call using the william.woodward user account (password: password2) and its OAuth2 token, you’d see a successful call would returned (a HTTP Status Code 204 – Not Content), and that organization would be deleted by the organization service.
At this point we’ve looked at two simple examples of calling and protecting a single service (the organization service) with OAuth2. However, often in a microservices environment, you’re going to have multiple service calls used to carry out a single transaction. In these types of situations, you need to ensure that that the OAuth2 access token is propagated from service call to service call.
To demonstrate propagating an OAuth2 token between services, we’re now going to see how to protect your licensing service with OAuth2. Remember, the licensing service calls the organization service to lookup information. The question becomes, how do you propagate the OAuth2 token from one service to another?
You’re going to set up a simple example where you’re going to have the licensing service call the organization service. Building on the examples from chapter 6, both services are running behind a Zuul gateway.
Figure 7.8 shows the basic flow of how an authenticated user’s OAuth2 token is going to flow through the Zuul gateway, to the licensing service, and then down to the organization service.
The following activity occurs in figure 7.8:
To implement these flows, you need to do two things. First, you need to modify your Zuul services gateway to propagate the OAuth2 token to the licensing service. By default, Zuul won’t forward sensitive HTTP headers such as Cookie, Set-Cookie, and Authorization to downstream services. To allow Zuul to propagate the “Authorization” HTTP header, you need to set the following configuration in your Zuul services gateway’s application.yml or Spring Cloud Config data store:
zuul.sensitiveHeaders: Cookie,Set-Cookie
This configuration is a blacklist of the sensitive headers that Zuul will keep from being propagated to a downstream service. The absence of the Authorization value in the previous list means Zuul will allow it through. If you don’t set the zuul.sensitiveHeaders property at all, Zuul will automatically block all three values from being propagated (Cookie, Set-Cookie, and Authorization).
Zuul can automatically propagate downstream OAuth2 access tokens and authorize incoming requests against the OAuth2 service by using the @EnableOAuth2Sso annotation. I purposely haven’t used this approach because my goal in this chapter is to show the basics of how OAuth2 works without adding another level of complexity (or debugging). While the configuration of the Zuul service’s gateway isn’t overly complicated, it would have added significantly more content to an already large chapter. If you’re interested in having a Zuul services gateway participate in Single Sign On (SSO), the Spring Cloud Security documentation has a short but comprehensive tutorial that covers the setup of the Spring server (http://cloud.spring.io/spring-cloud-security/spring-cloud-security.html).
The next thing you need to do is configure your licensing service to be an OAuth2 resource service and set up any authorization rules you want for the service. We’re not going to discuss in detail the licensing service configuration because we already discussed authorization rules in section 7.3.3, “Defining who and what can access the service.”
Finally, all you need to do is modify how the code in the licensing service calls the organization service. You need to ensure that the “Authorization” HTTP header is injected into the application call out to the Organization service. Without Spring Security, you’d have to write a servlet filter to grab the HTTP header off the incoming licensing service call and then manually add it to every outbound service call in the licensing service. Spring OAuth2 provides a new Rest Template class that supports OAuth2 calls. The class is called OAuth2RestTemplate. To use the OAuth2Rest-Template class you first need to expose it as a bean that can be auto-wired into a service calling another OAuth2 protected services. You do this in the licensing-service/src/main/java/com/thoughtmechanix/licenses/-Application.java class:
@Bean
 public OAuth2RestTemplate oauth2RestTemplate(
        OAuth2ClientContext oauth2ClientContext,
        OAuth2ProtectedResourceDetails details) {
        return new OAuth2RestTemplate(details, oauth2ClientContext);
    }
To see the OAuth2RestTemplate class in action you can look in the licensing--service/src/main/java/com/thoughtmechanix/licenses/clients/OrganizationRestTemplate.java class. The following listing shows how OAuth2 RestTemplate is auto-wired into this class.
OAuth2 is a token-based authentication framework, but ironically it doesn’t provide any standards for how the tokens in its specification are to be defined. To rectify the lack of standards around OAuth2 tokens, a new standard is emerging called JavaScript Web Tokens (JWT). JWT is an open standard (RFC-7519) proposed by the Internet Engineering Task Force (IETF) that attempts to provide a standard structure for OAuth2 tokens. JWT tokens are
Spring Cloud Security supports JWT out of the box. However, to use and consume JWT tokens, your OAuth2 authentication service and the services being protected by the authentication service must be configured in a different fashion. The configuration isn’t difficult, so let’s walk through the change.
I’ve chosen to keep the JWT configuration on a separate branch (called JWT_Example) in the GitHub repository for this chapter (https://github.com/carnellj/spmia-chapter7) because the standard Spring Cloud Security OAuth2 configuration and JWT-based OAuth2 configuration require different configuration classes.
For both the authentication service and the two microservices (licensing and organization service) that are going to be protected by OAuth2, you’ll need to add a new Spring Security dependency to their Maven pom.xml files to include the JWT OAuth2 libraries. This new dependency is
<dependency>
    <groupId>org.springframework.security</groupId>
    <artifactId>spring-security-jwt</artifactId>
</dependency>
After the Maven dependency is added, you need to first tell your authentication service how it’s going to generate and translate JWT tokens. To do this, you’re going to set up in the authentication service a new configuration class called authentication--service/src/java/com/thoughtmechanix/authentication/security/JWT TokenStoreConfig.java. The following listing shows the code for the class.
The JWTTokenStoreConfig class is used to define how Spring will manage the creation, signing, and translation of a JWT token. The tokenServices() method is going to use Spring security’s default token services implementation, so the work here is rote. The jwtAccessTokenConverter() method is the one we want to focus on. It defines how the token is going to be translated. The most important thing to note about this method is that you’re setting the signing key that will be used to sign your token.
For this example, you’re going to use a symmetrical key, which means both the authentication service and the services protected by the authentication service must share the same key between all of the services. The key is nothing more than a random string of values that’s store in the authentication services Spring Cloud Config entry (https://github.com/carnellj/config-repo/blob/master/authenticationservice/authenticationservice.yml). The actual value for the signing key is
signing.key: "345345fsdgsf5345"
Spring Cloud Security supports symmetrical key encryption and asymmetrical encryption using public/private keys. We’re not going to walk through setting up JWT using public/private keys. Unfortunately, little official documentation exists on the JWT, Spring Security, and public/private keys. If you’re interested in how to do this, I highly recommend you look at Baeldung.com (http://www.baeldung.com/spring-security-oauth-jwt). They do an excellent job of explaining JWT and public/private key setup.
In the JWTTokenStoreConfig from listing 7.8, you defined how JWT tokens were going to be signed and created. You now need to hook this into your overall OAuth2 service. In listing 7.2 you used the OAuth2Config class to define the configuration of your OAuth2 service. You set up the authentication manager that was going to be used by your service along with the application name and secrets. You’re going to replace the OAuth2Config class with a new class called authentication--service/src/main/java/com/thoughtmechanix/authentication/security/JWTOAuth2Config.java.
The following listing shows code for the JWTOAuth2Config class.
Now, if you rebuild your authentication service and restart it, you should see a JWT-based token returned. Figure 7.9 shows the results of your call to the authentication service now that it uses JWT.
The actual token itself isn’t directly returned as JavaScript. Instead, the JavaScript body is encoded using a Base64 encoding. If you’re interested in seeing the contents of a JWT token, you can use online tools to decode the token. I like to use an online tool from a company called Stormpath. Their tool, http://jsonwebtoken.io, is an online JWT decoder. Figure 7.10 shows the output from the decoded token.
It’s extremely important to understand that your JWT tokens are signed, but not encrypted. Any online JWT tool can decode the JWT token and expose its contents. I bring this up because the JWT specification does allow you extend the token and add additional information to the token. Don’t expose sensitive or Personally Identifiable Information (PII) in your JWT tokens.
You now have your OAuth2 authentication service creating JWT tokens. The next step is to configure your licensing and organization services to use JWT. This is a trivial exercise that requires you to do two things:
You need to do one final piece of work. Because the licensing service calls the organization service, you need to ensure that the OAuth2 token is propagated. This is normally done via the OAuth2RestTemplate class; however, the OAuth2RestTemplate class doesn’t propagate JWT-based tokens. To make sure that your licensing service does this, you need to add a custom RestTemplate bean that will perform this injection for you. This custom RestTemplate can found in the licensing-service/src/main/java/com/thoughtmechanix/licenses/Application.java class. The following listing shows this custom bean definition.
In the previous code you’re defining a custom RestTemplate bean that will use a ClientHttpRequestInterceptor. Recall from chapter 6 that the Client-Http-RequestInterceptor is a Spring class that allows you to hook in functionality to be executed before a REST-based call is made. This interceptor class is a variation of the UserContextInterceptor class you defined in chapter 6. This class is in the licensing-service/src/main/java/com/thoughtmechanix/licenses/utils/UserContextInterceptor.java. The following listing shows this class.
The UserContextInterceptor is using several of the utility classes from chapter 6. Remember, every one of your service uses a custom servlet filter (called User-ContextFilter) to parse out the authentication token and correlation ID from the HTTP header. In listing 7.11, you’re using the UserContext.AUTH_TOKEN value already parsed to populate the outgoing HTTP call.
That’s it. With these pieces in place, you can now call the licensing service (or organization service) and place the Base64-encoded JWT encoded in your HTTP Authorization header the value Bearer <<JWT-Token>>, and your service will properly read and validate the JWT token.
If you look closely at the JWT token in figure 7.10, you’ll notice the EagleEye organizationId field. (Figure 7.11 shows a more zoomed-in shot of the JWT Token shown earlier in figure 7.10.) This isn’t a standard JWT token field. It’s one I added by injecting a new field into the JWT token as it was being created.
Extending a JWT token is easily done by adding a Spring OAuth2 token enhancer class to your authentication service. The source for this class can found in the authentication-service/src/main/java/com/thoughtmechanix/authentication/security/JWTTokenEnhancer.java class. The following listing shows this code.
The last thing you need to do is tell your OAuth2 service to use your JWTToken-Enhancer class. You first need to expose a Spring bean for your JWTTokenEnhancer class. Do this by adding a bean definition to the JWTTokenStoreConfig class that was defined in listing 7.8:
package com.thoughtmechanix.authentication.security;

@Configuration
public class JWTTokenStoreConfig {
    //Rest of class removed for conciseness
    @Bean
    public TokenEnhancer jwtTokenEnhancer() {
        return new JWTTokenEnhancer();
    }
}
Once you’ve exposed the JWTTokenEnhancer as a bean, you can hook it into the JWTOAuth2Config class from listing 7.9. This is done in the configure() method of the class. The following listing shows the modification to the configure() method of the JWTOAuth2Config class.
At this point you’ve added a custom field to your JWT token. The next question you should have is, “How do I parse a custom field out of a JWT token?”
We’re going to turn to your Zuul gateway for an example of how to parse out a custom field in the JWT token. Specifically, you’re going to modify the TrackingFilter class we introduced in chapter 6 to decode the organizationId field out of the JWT token flowing through gateway.
To do this you’re going to pull in a JWT parser library and add to the Zuul server’s pom.xml file. Multiple token parsers are available and I chose the JJWT library (https://-github.com/jwtk/jjwt) to do the parsing. The Maven dependency for the library is
<dependency>
  <groupId>io.jsonwebtoken</groupId>
  <artifactId>jjwt</artifactId>
  <version>0.7.0</version>
</dependency>
Once the JJWT library is added, you can add a new method to your zuulsvr/src/main/java/com/thoughtmechanix/zuulsvr/filters/TrackingFilter.java class called get-OrganizationId(). The following listing shows this new method.
Once the getOrganizationId() function is implemented, you added a System.out.println to the run() method on the TrackingFilter to print out the organizationId parsed from your JWT token that’s flowing through the Zuul gateway, so you call any gateway-enabled REST endpoint. I used GET http://localhost:5555/api/licensing/v1/organizations/e254f8c-c442-4ebe-a82a-e2fc1d1ff78a/licenses/f3831f8c-c338-4ebe-a82a-e2fc1d1ff78a. Remember, when you make this call, you still need to set up all the HTTP form parameters and the HTTP authorization header to include the Authorization header and the JWT token.
Figure 7.12 shows the output to the command-line console displaying your parsed organizationId.
While this chapter has introduced you to the OAuth2 specification and how you can use Spring Cloud security to implement an OAuth2 authentication service, OAuth2 is only one piece of the microservice security puzzle. As you build your microservices for production use, you should be building your microservices security around the following practices:
Figure 7.13 shows how these different pieces fit together. Each of the bulleted items in the list maps to the numbers in figure 7.13.
Let’s examine each of the topic areas enumerated in the previous list and diagrams in more detail.
In all the code examples in this book, you’ve been using HTTP because HTTP is a simple protocol and doesn’t require setup on every service before you can start using the service.
In a production environment, your microservices should communicate only through the encrypted channels provided through HTTPS and SSL. The configuration and setup of the HTTPS can be automated through your DevOps scripts.
If your application needs to meet Payment Card Industry (PCI) compliance for credit card payments, you’ll be required to implement HTTPS for all service communication. Building all your services to use HTTPS early on is much easier than doing a migration project after your application and microservices are in production.
The individual servers, service endpoints, and ports your services are running on should never be directly accessible to the client. Instead, use a services gateway to act as an entry point and gatekeeper for your service calls. Configure the network layer on the operating system or container your microservices are running in to only accept traffic from the services gateway.
Remember, the services gateway can act as a policy enforcement point (PEP) that can be enforced against all services. Putting service calls through a services gateway such as Zuul allows you to be consistent in how you’re securing and auditing your services. A service gateway also allows you to lock down what port and endpoints you’re going to expose to the outside world.
Security in general is all about building layers of accessing and enforcing the concept of least privilege. Least privilege is the concept that a user should have the bare minimum network access and privileges to do their day-to-day job. To this end, you should implement least-privilege by separating your services into two distinct zones: public and private.
The public zone contains the public APIs that will be consumed by clients (EagleEye application). Public API microservices should carry out narrow tasks that are workflow-oriented. Public API microservices tend to be service aggregators, pulling data and carrying out tasks across multiple services.
Public microservices should be behind their own services gateway and have their own authentication service for performing OAuth2 authentication. Access to public services by client applications should go through a single route protected by the services gateway. In addition, the public zone should have its own authentication service.
The private zone acts as a wall to protect your core application functionality and data. The private zone should only be accessible through a single well-known port and should be locked down to only accept network traffic from the network subnet that the private services are running. The private zone should have its own services gateway and authentication service. Public API services should authenticate against the private zones authentication service. All application data should at least be in the private zone’s network subnet and only accessible by microservices residing in the private zone.
Many organizations take the approach that their security model should have a hard outer center, with a softer inner surface. What this means is that once traffic is inside the private API zone, communication between services in the private zone can be unencrypted (no HTTPS) and not require an authentication mechanism. Most of the time, this is done for convenience and developer velocity. The more security you have in place, the harder it is to debug problems, increasing the overall complexity of managing your application.
I tend to take a paranoid view of the world. (I worked in financial services for eight years, so paranoia comes with the territory.) I’d rather trade off the additional complexity (which can be mitigated through DevOps scripts) and enforce that all services running in my private API zone use SSL and are authenticated against the authentication service running in the private zone. The question that you have to ask yourself is, How willing are you to see your organization on the front page of your local newspaper because of a network breach?
Many developers don’t take a hard look at the absolute minimum number of ports they need to open for their services to function. Configure the operating system your service is running on to only allow the inbound and outbound access to ports needed by your service or a piece of infrastructure needed by your service (monitoring, log aggregation).
Don’t focus only on inbound access ports. Many developers forget to lock down their outbound ports. Locking down your outbound ports can prevent data from being leaked off your service in the event that the service itself has been compromised by an attacker. Also, make sure you look at network port access in both your public and private API zones.
When was the last time you sat down with another person and had a conversation? Think back about how you interacted with that other person. Was it a totally focused exchange of information where you said something and then did nothing else while you waited for the person to respond in full? Were you completely focused on the conversation and let nothing from the outside world distract you while you were speaking? If there were more than two people in the conversation, did you repeat something you said perfectly over and over to each conversation participant and wait in turn for their response? If you said yes to these questions, you have reached enlightenment, are a better human being than me, and should stop what you’re doing because you can now answer the age-old question, “What is the sound of one object clapping?” Also, I suspect you don’t have children.
The reality is that human beings are constantly in a state of motion, interacting with their environment around them, while sending out and receiving information from the things around them. In my house a typical conversation might be something like this. I’m busy washing the dishes while talking to my wife. I’m telling her about my day. She’s looking at her phone and she’s listening, processing what I’m saying, and occasionally responding back. As I’m washing the dishes, I hear a commotion in the next room. I stop what I’m doing, rush into the next room to find out what’s wrong and see that our rather large nine-month-old puppy, Vader, has taken my three-year-old son’s shoe, and is trotting around the living room carrying the shoe like a trophy. My three-year-old isn’t happy about this. I run through the house, chasing the dog until I get the shoe back. I then go back to the dishes and my conversation with my wife.
My point in telling you this isn’t to tell you about a typical day in my life, but rather to point out that our interaction with the world isn’t synchronous, linear, and narrowly defined to a request-response model. It’s message-driven, where we’re constantly sending and receiving messages. As we receive messages, we react to those messages, while often interrupting the primary task that we’re working on.
This chapter is about how to design and implement your Spring-based microservices to communicate with other microservices using asynchronous messages. Using asynchronous messages to communicate between applications isn’t new. What’s new is the concept of using messages to communicate events representing changes in state. This concept is called Event Driven Architecture (EDA). It’s also known as Message Driven Architecture (MDA). What an EDA-based approach allows you to do is to build highly decoupled systems that can react to changes without being tightly coupled to specific libraries or services. When combined with microservices, EDA allows you to quickly add new functionality into your application by merely having the service listen to the stream of events (messages) being emitted by your application.
The Spring Cloud project has made it trivial to build messaging-based solutions through the Spring Cloud Stream sub-project. Spring Cloud Stream allows you to easily implement message publication and consumption, while shielding your services from the implementation details associated with the underlying messaging platform.
Why is messaging important in building microservice-based applications? To answer that question, let’s start with an example. We’re going to use the two services we’ve been using throughout the book: your licensing and organization services. Let’s imagine that after these services are deployed to production, you find that the licensing service calls are taking an exceedingly long time when doing a lookup of organization information from the organization service. When you look at the usage patterns of the organization data, you find that the organization data rarely changes and that most of the data reads from the organization service are done by the primary key of the organization record. If you could cache the reads for the organization data without having to incur the cost of accessing a database, you could greatly improve the response time of the licensing service calls.
As you look at implementing a caching solution, you realize you have three core requirements:
Let’s look at two approaches for implementing these requirements. The first approach will implement the above requirements using a synchronous request-response model. When the organization state changes, the licensing and organization services communicate back and forth via their REST endpoints. The second approach will have the organization service emit an asynchronous event (message) that will communicate that the organization service data has changed. With the second approach, the organization service will publish a message to a queue that an organization record has been updated or deleted. The licensing service will listen with the intermediary, see that an organization event has occurred, and clear the organization data from its cache.
For your organization data cache, you’re going to use Redis (http://redis.io/), a distributed key-value store database. Figure 8.1 provides a high-level overview of how to build a caching solution using a traditional synchronous, request-response programming model.
In figure 8.1, when a user calls the licensing service, the licensing service will need to also look up organization data. The licensing service will first check to retrieve the desired organization by its ID from the Redis cluster. If the licensing service can’t find the organization data, it will call the organization service using a REST-based endpoint and then store the data returned in Redis, before returning the organization data back to the user. Now, if someone updates or deletes the organization record using the organization service’s REST endpoint, the organization service will need to call an endpoint exposed on the licensing service, telling it to invalidate the organization data in its cache. In figure 8.1, if you look at where the organization service calls back into the licensing service to tell it to invalidate the Redis cache, you can see at least three problems:
In figure 8.1 you can see tight coupling between the licensing and the organization service. The licensing service always had a dependency on the organization service to retrieve data. However, by having the organization service directly communicate back to the licensing service whenever an organization record has been updated or deleted, you’ve introduced coupling back from the organization service to the licensing service. For the data in the Redis cache to be invalidated, the organization service either needs an endpoint on the licensing service exposed that can be called to invalidate its Redis cache, or the organization service has to talk directly to the Redis server owned by the licensing service to clear the data in it.
Having the organization service talk to Redis has its own problems because you’re talking to a data store owned directly by another service. In a microservice environment, this a big no-no. While one can argue that the organization data rightly belongs to the organization service, the licensing service is using it in a specific context and could be potentially transforming the data or have built business rules around it. Having the organization service talking directly to the Redis service can accidently break rules the team owning the licensing service has implemented.
The tight coupling between the licensing service and the organization service has also introduced brittleness between the two services. If the licensing service is down or running slowly, the organization service can be impacted because the organization service is now communicating directly with the licensing service. Again, if you had the organization service talk directly to licensing service’s Redis data store, you’ve now created a dependency between the organization service and Redis. In this scenario, any problems with the shared Redis server now have the potential to take down both services.
The last problem with this architecture is that it’s inflexible. With the model in figure 8.1, if you had another service that was interested in when the organization data changes, you’d need to add another call from the organization service to that other service. This means a code change and redeployment of the organization service. If you use the synchronous, request-response model for communicating state change, you start to see almost a web-like pattern of dependency between your core services in your application and other services. The centers of these webs become your major points of failure within your application.
While messaging adds a layer of indirection between your services, you can still introduce tight coupling between two services using messaging. Later in the chapter you’re going to send messages between the organization and licensing service. These messages are going to be serialized and de-serialized to a Java object using JSON as the transport protocol for the message. Changes to the structure of the JSON message can cause problems when converting back and forth to Java if the two services don’t gracefully handle different versions of the same message type. JSON doesn’t natively support versioning. However, you can use Apache Avro (https://avro.apache.org/) if you need versioning. Avro is a binary protocol that has versioning built into it. Spring Cloud Stream does support Apache Avro as a messaging protocol. However, using Avro is outside the scope of this book, but we did want to make you aware that it does help if you truly need to worry about message versioning.
With a messaging approach, you’re going to inject a queue in between the licensing and organization service. This queue won’t be used to read data from the organization service, but will instead be used by the organization service to publish when any state changes within the organization data managed by the organization service occurs. Figure 8.2 demonstrates this approach.
In the model in figure 8.2, every time organization data changes, the organization service publishes a message out to a queue. The licensing service is monitoring the queue for messages and when a message comes in, clears the appropriate organization record out of the Redis cache. When it comes to communicating state, the message queue acts as an intermediary between the licensing and organization service. This approach offers four benefits:
A microservices application can be composed of dozens of small and distributed services that have to interact with each other and are interested in the data managed by one another. As you saw with the synchronous design proposed earlier, a synchronous HTTP response creates a hard dependency between the licensing and organization service. We can’t eliminate these dependencies completely, but we can try to minimize dependencies by only exposing endpoints that directly manage the data owned by the service. A messaging approach allows you to decouple the two services because when it comes to communicating state changes, neither service knows about each other. When the organization service needs to publish a state change, it writes a message to a queue. The licensing service only knows that it gets a message; it has no idea who has published the message.
The presence of the queue allows you to guarantee that a message will be delivered even if the consumer of the service is down. The organization service can keep publishing messages even if the licensing service in unavailable. The messages will be stored in the queue and will stay there until the licensing service is available. Conversely, with the combination of a cache and the queuing approach, if the organization service is down, the licensing service can degrade gracefully because at least part of the organization data will be in its cache. Sometimes old data is better than no data.
Since messages are stored in a queue, the sender of the message doesn’t have to wait for a response back from the consumer of the message. They can go on their way and continue their work. Likewise, if a consumer reading a message off the queue isn’t processing messages fast enough, it’s a trivial task to spin up more consumers and have them process those messages off the queue. This scalability approach fits well within a microservices model because one of the things I’ve been emphasizing through this book is that it should be trivial to spin up new instances of a microservice and have that additional microservice become another service that can process work off the message queue holding the messages. This is an example of scaling horizontally. Traditional scaling mechanisms for reading messages off a queue involved increasing the number of threads that a message consumer could process at one time. Unfortunately, with this approach, you were ultimately limited by the number of CPUs available to the message consumer. A microservice model doesn’t have this limitation because you’re scaling by increasing the number of machines hosting the service consuming the messages.
The sender of a message has no idea who is going to consume it. This means you can easily add new message consumers (and new functionality) without impacting the original sending service. This is an extremely powerful concept because new functionality can be added to an application without having to touch existing services. Instead, the new code can listen for events being published and react to them accordingly.
Like any architectural model, a messaging-based architecture has tradeoffs. A messaging-based architecture can be complex and requires the development team to pay close attention to several key things, including
Using messages in a microservice-based application requires more than understanding how to publish and consume messages. It requires you to understand how your application will behave based on the order messages are consumed and what happens if a message is processed out of order. For example, if you have strict requirements that all orders from a single customer must be processed in the order they are received, you’re going to have to set up and structure your message handling differently than if every message can be consumed independently of one another.
It also means that if you’re using messaging to enforce strict state transitions of your data, you need to think as you’re designing your application about scenarios where a message throws an exception, or an error is processed out of order. If a message fails, do you retry processing the error or do you let it fail? How do you handle future messages related to that customer if one of the customer messages fails? Again, these are all topics to think through.
Using messages in your microservices often means a mix of synchronous service calls and processing in services asynchronously. The asynchronous nature of messages means they might not be received or processed in close proximity to when the message is published or consumed. Also, having things like a correlation ID for tracking a user’s transactions across web service invocations and messages is critical to understanding and debugging what’s going on in your application. As you may remember from chapter 6, a correlation ID is a unique number that’s generated at the start of a user’s transaction and passed along with every service call. It should also be passed with every message that’s published and consumed.
As alluded to in the section on message visibility, messaging-based applications make it more difficult to reason through the business logic of their applications because their code is no longer being processed in a linear fashion with a simple block request-response model. Instead, debugging message-based applications can involve wading through the logs of several different services where the user transactions can be executed out of order and at different times.
The previous sections weren’t meant to scare you away from using messaging in your applications. Rather, my goal is to highlight that using messaging in your services requires forethought. I recently completed a major project where we needed to bring up and down a stateful set of AWS server instances for each one of our customers. We had to integrate a combination of microservice calls and messages using both AWS Simple Queueing Service (SQS) and Kafka. While the project was complex, I saw first-hand the power of messaging when at the end of the project we realized that we’d need to deal with having to make sure that we retrieved certain files off the server before the server could be terminated. This step had to be carried out about 75% of the way through the user workflow and the overall process couldn’t continue until the process was completed. Fortunately, we had a microservice (called our file recovery service) that could do much of the work to check and see if the files were off the server being decommissioned. Because the servers communicate all of their state changes (including that they’re being decommissioned) via events, we only had to plug the file recovery server into an event stream coming from the server being decommissioned and have them listen for a “decommissioning” event.
If this entire process had been synchronous, adding this file-draining step would have been extremely painful. But in the end, we needed an existing service we already had in production to listen to events coming off an existing messaging queue and react. The work was done in a couple of days and we never missed a beat in our project delivery. Messages allow you to hook together services without the services being hard-coded together in a code-based workflow.
Spring Cloud makes it easy to integrate messaging into your Spring-based microservices. It does this through the Spring Cloud Stream project (https://cloud.spring.io/spring-cloud-stream/). The Spring Cloud Stream project is an annotation-driven framework that allows you to easily build message publishers and consumers in your Spring application.
Spring Cloud Stream also allows you to abstract away the implementation details of the messaging platform you’re using. Multiple message platforms can be used with Spring Cloud Stream (including the Apache Kafka project and RabbitMQ) and the implementation-specific details of the platform are kept out of the application code. The implementation of message publication and consumption in your application is done through platform-neutral Spring interfaces.
For this chapter, you’re going to use a lightweight message bus called Kafka (https://kafka.apache.org/). Kafka is a lightweight, highly performant message bus that allows you asynchronously send streams of messages from one application to one or more other applications. Written in Java, Kafka has become the de facto message bus for many cloud-based applications because it’s highly reliable and scalable. Spring Cloud Stream also supports the use of RabbitMQ as a message bus. Both Kafka and RabbitMQ are strong messaging platforms, and I chose Kafka because that’s what I’m most familiar with.
To understand Spring Cloud Stream, let’s begin with a discussion of the Spring Cloud Stream architecture and familiarize ourselves with the terminology of Spring Cloud Stream. If you’ve never worked with a messaging based platform before, the new terminology involved can be somewhat overwhelming.
Let’s begin our discussion by looking at the Spring Cloud Stream architecture through the lens of two services communicating via messaging. One service will be the message publisher and one service will be the message consumer. Figure 8.3 shows how Spring Cloud Stream is used to facilitate this message passing.
With the publication and consumption of a message in Spring Cloud, four components are involved in publishing and consuming the message:
When a service gets ready to publish a message, it will publish the message using a source. A source is a Spring annotated interface that takes a Plain Old Java Object (POJO) that represents the message to be published. A source takes the message, serializes it (the default serialization is JSON), and publishes the message to a channel.
A channel is an abstraction over the queue that’s going to hold the message after it has been published by the message producer or consumed by a message consumer. A channel name is always associated with a target queue name. However, that queue name is never directly exposed to the code. Instead the channel name is used in the code, which means that you can switch the queues the channel reads or writes from by changing the application’s configuration, not the application’s code.
The binder is part of the Spring Cloud Stream framework. It’s the Spring code that talks to a specific message platform. The binder part of the Spring Cloud Stream framework allows you to work with messages without having to be exposed to platform--specific libraries and APIs for publishing and consuming messages.
In Spring Cloud Stream, when a service receives a message from a queue, it does it through a sink. A sink listens to a channel for incoming messages and de-serializes the message back into a plain old Java object. From there, the message can be processed by the business logic of the Spring service.
Now that we’ve walked through the basic components in Spring Cloud Stream, let’s look at a simple Spring Cloud Stream example. For the first example, you’re going to pass a message from your organization service to your licensing service. The only thing you’ll do with the message in the licensing service is to print a log message to the console.
In addition, because you’re only going to have one Spring Cloud Stream source (the message producer) and sink (message consumer) in this example, you’re going to start the example with a few simple Spring Cloud shortcuts that will make setting up the source in the organization service and a sink in the licensing service trivial.
You’re going to begin by modifying the organization service so that every time organization data is added, updated, or deleted, the organization service will publish a message to a Kafka topic indicating that the organization change event has occurred. Figure 8.4 highlights the message producer and build on the general Spring Cloud Stream architecture from figure 8.3.
The published message will include the organization ID associated with the change event and will also include what action occurred (Add, Update or Delete).
The first thing you need to do is set up your Maven dependencies in the organization service’s Maven pom.xml file. The pom.xml file can be found in the organization-service directory. In the pom.xml, you need to add two dependencies: one for the core Spring Cloud Stream libraries and the other to include the Spring Cloud Stream Kafka libraries:
<dependency>
    <groupId>org.springframework.cloud</groupId>
    <artifactId>spring-cloud-stream</artifactId>
  </dependency>
<dependency>
    <groupId>org.springframework.cloud</groupId>
    <artifactId>spring-cloud-starter-stream-kafka</artifactId>
</dependency>
Once the Maven dependencies have been defined, you need to tell your application that it’s going to bind to a Spring Cloud Stream message broker. You do this by annotating the organization service’s bootstrap class organization-service/src/main/java/com/thoughtmechanix/organization/Application.java with an @EnableBinding annotation. The following listing shows the organization service’s Application.java source code.
In listing 8.1, the @EnableBinding annotation tells Spring Cloud Stream that you want to bind the service to a message broker. The use of Source.class in the @EnableBinding annotation tells Spring Cloud Stream that this service will communicate with the message broker via a set of channels defined on the Source class. Remember, channels sit above a message queue. Spring Cloud Stream has a default set of channels that can be configured to speak to a message broker.
At this point you haven’t told Spring Cloud Stream what message broker you want the organization service to bind to. We’ll get to that shortly. Now, you can go ahead and implement the code that will publish a message.
The message publication code can be found in the organization-service/src/com/thoughtmechanix/organization/events/source/SimpleSourceBean.java class. The following listing shows the code for this class.
In listing 8.2 you inject the Spring Cloud Source class into your code. Remember, all communication to a specific message topic occurs through a Spring Cloud Stream construct called a channel. A channel is represented by a Java interface class. In this listing you’re using the Source interface. The Source interface is a Spring Cloud defined interface that exposes a single method called output(). The Source interface is a convenient interface to use when your service only needs to publish to a single channel. The output() method returns a class of type MessageChannel. The MessageChannel is how you’ll send messages to the message broker. Later in this chapter, I’ll show you how to expose multiple messaging channels using a custom interface.
The actual publication of the message occurs in the publishOrgChange() method. This method builds a Java POJO called OrganizationChangeModel. I’m not going to put the code for the OrganizationChangeModel in the chapter because this class is nothing more than a POJO around three data elements:
When you’re ready to publish the message, use the send() method on the MessageChannel class returned from the source.output() method.
source.output().send(MessageBuilder.withPayload(change).build());
The send() method takes a Spring Message class. You use a Spring helper class called MessageBuilder to take the contents of the OrganizationChangeModel class and convert it to a Spring Message class.
This all the code you need to send a message. However, at this point, everything should feel a little bit like magic because you haven’t seen how to bind your organization service to a specific message queue, let alone the actual message broker. This is all done through configuration. Listing 8.3 shows the configuration that does the mapping of your service’s Spring Cloud Stream Source to a Kafka message broker and a message topic in Kafka. This configuration information can be localized in your service’s application.yml file or inside a Spring Cloud Config entry for the service.
The configuration in listing 8.3 looks dense, but it’s straightforward. The configuration property spring.stream.bindings.output in the listing maps the source.output() channel in listing 8.2 to the orgChangeTopic on the message broker you’re going to communicate with. It also tells Spring Cloud Stream that messages being sent to this topic should be serialized as JSON. Spring Cloud Stream can serialize messages in multiple formats, including JSON, XML, and the Apache Foundation’s Avro format (https://avro.apache.org/).
The configuration property, spring.stream.bindings.kafka in listing 8.3, also tells Spring Cloud Stream to bind the service to Kafka. The sub-properties tell Spring Cloud Stream the network addresses of the Kafka message brokers and the Apache ZooKeeper servers that run with Kafka.
Now that you have the code written that will publish a message via Spring Cloud Stream and the configuration to tell Spring Cloud Stream that it’s going to use Kafka as a message broker, let’s look at where the publication of the message in your organization service actually occurs. This work will be done in the organization-service/src/main/java/com/thoughtmechanix/organization/services/OrganizationService.java class. The following listing shows the code for this class.
One of the most common questions I get from teams when they’re first embarking on their message journey is exactly how much data should go in their messages. My answer is, it depends on your application. As you may notice, in all my examples I only return the organization ID of the organization record that has changed. I never put a copy of the changes to the data in the message. In my examples (and in many of the problems I deal with in the telephony space), the business logic being executed is sensitive to changes in data. I used messages based on system events to tell other services that data state has changed, but I always force the other services to go back to the master (the service that owns the data) to retrieve a new copy of the data. This approach is costlier in terms of execution time, but it also guarantees I always have the latest copy of the data to work with. A chance still exists that the data you’re working with could change right after you’ve read it from the source system, but that’s much less likely than blindly consuming the information right off the queue.
Think carefully about how much data you’re passing around. Sooner or later, you’ll run into a situation where the data you passed is stale. It could be stale because a problem caused it to sit in a message queue too long, or a previous message containing data failed, and the data you’re passing in the message now represents data that’s in an inconsistent state (because your application relied on the message’s state rather than the actual state in the underlying data store). If you’re going to pass state in your message, also make sure to include a date-time stamp or version number in your message so that the services consuming the data can inspect the data being passed and ensure that it’s not older than the copy of the data they already have. (Remember, data can be retrieved out of order.)
At this point you’ve modified the organization service to publish a message to Kafka every time the organization service changes organization data. Anyone who’s interested can react without having to be explicitly called by the organization service. It also means you can easily add new functionality that can react to the changes in the organization service by having them listen to messages coming in on the message queue. Let’s now switch directions and look at how a service can consume a message using Spring Cloud Stream.
For this example, you’re going to have the licensing service consume the message published by the organization service. Figure 8.5 shows where the licensing service will fit into the Spring Cloud architecture first shown in figure 8.3.
To begin, you again need to add your Spring Cloud Stream dependencies to the licensing services pom.xml file. This pom.xml file can found in licensing-service directory of the source code for the book. Similar to the organization-service pom.xml file you saw earlier, you add the following two dependency entries:
<dependency>
    <groupId>org.springframework.cloud</groupId>
    <artifactId>spring-cloud-stream</artifactId>
  </dependency>

<dependency>
    <groupId>org.springframework.cloud</groupId>
    <artifactId>spring-cloud-starter-stream-kafka</artifactId>
</dependency>
Then you need to tell the licensing service that it needs to use Spring Cloud Stream to bind to a message broker. Like the organization service, we’re going to annotate the licensing services bootstrap class (licensing-service/src/main/java/com/thoughtmechanix/licenses/Application.java) with the @EnableBinding annotation. The difference between the licensing service and the organization service is the value you’re going to pass to the @EnableBinding annotation, as shown in the following listing.
Because the licensing service is a consumer of a message, you’re going to pass the @EnableBinding annotation the value Sink.class. This tells Spring Cloud Stream to bind to a message broker using the default Spring Sink interface. Similar to the Spring Cloud Steam Source interface described in section 8.3.1, Spring Cloud Stream exposes a default channel on the Sink interface. The channel on the Sink interface is called input and is used to listen for incoming messages on a channel.
Once you’ve defined that you want to listen for messages via the @EnableBinding annotation, you can write the code to process a message coming off the Sink input channel. To do this, use the Spring Cloud Stream @StreamListener annotation.
The @StreamListener annotation tells Spring Cloud Stream to execute the loggerSink() method every time a message is received off the input channel. Spring Cloud Stream will automatically de-serialize the message coming off the channel to a Java POJO called OrganizationChangeModel.
Once again, the actual mapping of the message broker’s topic to the input channel is done in the licensing service’s configuration. For the licensing service, its configuration is shown in the following listing and can be found in the licensing service’s licensing-service/src/main/resources/application.yml file.
The configuration in this listing looks like the configuration for the organization service. It has, however, two key differences. First, you now have a channel called input defined under the spring.cloud.stream.bindings property. This value maps to the Sink.INPUT channel defined in the code from listing 8.5. This property maps the input channel to the orgChangeTopic. Second, you see the introduction of a new property called spring.cloud.stream.bindings.input.group. The group property defines the name of the consumer group that will be consuming the message.
The concept of a consumer group is this: You might have multiple services with each service having multiple instances listening to the same message queue. You want each unique service to process a copy of a message, but you only want one service instance within a group of service instances to consume and process a message. The group property identifies the consumer group that the service belongs to. As long as all the service instances have the same group name, Spring Cloud Stream and the underlying message broker will guarantee that only one copy of the message will be consumed by a service instance belonging to that group. In the case of your licensing service, the group property value will be called licensingGroup.
Figure 8.6 illustrates how the consumer group is used to help enforce consume-once semantics for a message being consumed across multiple services.
At this point you have the organization service publishing a message to the org-Change-Topic every time a record is added, updated, or deleted and the licensing service receiving the message of the same topic. Now you’ll see this code in action by updating an organization service record and watching the console to see the corresponding log message appear from the licensing service.
To update the organization service record, you’re going to issue a PUT on the organization service to update the organization’s contact phone number. The endpoint you’re going to update with is http://localhost:5555/api/organization/v1/organizations/e254f8c-c442-4ebe-a82a-e2fc1d1ff78a. The body you’re going to send on the PUT call to the endpoint is
{
    "contactEmail": "mark.balster@custcrmco.com",
    "contactName": "Mark Balster",
    "contactPhone": "823-555-2222",
    "id": "e254f8c-c442-4ebe-a82a-e2fc1d1ff78a",
    "name": "customer-crm-co"
}
Figure 8.7 shows the returned output from this PUT call.
Once the organization service call has been made, you should see the following output in the console window running the services. Figure 8.8 show this output.
Now you have two services communicating with each other using messaging. Spring Cloud Stream is acting as the middleman for these services. From a messaging perspective, the services know nothing about each other. They’re using a messaging broker to communicate as an intermediary and Spring Cloud Stream as an abstraction layer over the messaging broker.
At this point you have two services communicating with messaging, but you’re not really doing anything with the messages. Now you’ll build the distributed caching example we discussed earlier in the chapter. You’ll have the licensing service always check a distributed Redis cache for the organization data associated with a particular license. If the organization data exists in the cache, you’ll return the data from the cache. If it doesn’t, you’ll call the organization service and cache the results of the call in a Redis hash.
When data is updated in the organization service, the organization service will issue a message to Kafka. The licensing service will pick up the message and issue a delete against Redis to clear out the cache.
Using Redis as a distributed cache is very relevant to microservices development in the cloud. With my current employer, we build our solution using Amazon’s Web Services (AWS) and are a heavy user of Amazon’s DynamoDB. We also use Amazon’s ElastiCache (Redis) to
Redis is far more than a caching solution, but it can fill that role if you need a distributed cache.
Now you’re going to begin by setting up the licensing service to use Redis. Fortunately, Spring Data already makes it simple to introduce Redis into your licensing service. To use Redis in the licensing service you need to do four things:
The first thing you need to do is include the spring-data-redis dependencies, along with the jedis and common-pools2 dependencies, into the licensing service’s pom.xml file. The dependencies to include are shown in the following listing.
<dependency>
   <groupId>org.springframework.data</groupId>
   <artifactId>spring-data-redis</artifactId>
   <version>1.7.4.RELEASE</version>
</dependency>

<dependency>
  <groupId>redis.clients</groupId>
  <artifactId>jedis</artifactId>
  <version>2.9.0</version>
</dependency>

<dependency>
  <groupId>org.apache.commons</groupId>
  <artifactId>commons-pool2</artifactId>
  <version>2.0</version>
</dependency>
Now that you have the dependencies in Maven, you need to establish a connection out to your Redis server. Spring uses the open source project Jedis (https://github.com/xetorthio/jedis) to communicate with a Redis server. To communicate with a specific Redis instance, you’re going to expose a JedisConnection-Factory in the licensing-service/src/main/java/com/thoughtmechanix/licenses/Application.java class as a Spring Bean. Once you have a connection out to Redis, you’re going to use that connection to create a Spring RedisTemplate object. The RedisTemplate object will be used by the Spring Data repository classes that you’ll implement shortly to execute the queries and saves of organization service data to your Redis service. The following listing shows this code.
The foundational work for setting up the licensing service to communicate with Redis is complete. Let’s now move over to writing the logic that will get, add, update, and delete data from Redis.
Redis is a key-value store data store that acts like a big, distributed, in-memory HashMap. In the simplest case, it stores data and looks up data by a key. It doesn’t have any kind of sophisticated query language to retrieve data. Its simplicity is its strength and one of the reasons why so many projects have adopted it for use in their projects.
Because you’re using Spring Data to access your Redis store, you need to define a repository class. As may you remember from early on in chapter 2, Spring Data uses user-defined repository classes to provide a simple mechanism for a Java class to access your Postgres database without having to write low-level SQL queries.
For the licensing service, you’re going to define two files for your Redis repository. The first file you’ll write will be a Java interface that’s going to be injected into any of the licensing service classes that are going to need to access Redis. This inter- face (licensing-service/src/main/java/com/thoughtmechanix/licenses/repository/OrganizationRedisRepository.java) is shown in the following listing.
package com.thoughtmechanix.licenses.repository;

import com.thoughtmechanix.licenses.model.Organization;

public interface OrganizationRedisRepository {
    void saveOrganization(Organization org);
    void updateOrganization(Organization org);
    void deleteOrganization(String organizationId);
    Organization findOrganization(String organizationId);
}
The second file is the implementation of the OrganizationRedisRepository interface. The implementation of the interface, the licensing-service/src/main/java/com/thoughtmechanix/licenses/repository/OrganizationRedisRepositoryImpl.java class, uses the RedisTemplate Spring bean you declared earlier in listing 8.8 to interact with the Redis server and carry out actions against the Redis server. The next listing shows this code in use.
The OrganizationRedisRepositoryImpl contains all the CRUD (Create, Read, Update, Delete) logic used for storing and retrieving data from Redis. There are two key things to note from the code in listing 8.10:
Now that you have the code in place to perform operations against Redis, you can modify your licensing service so that every time the licensing service needs the organization data, it will check the Redis cache before calling out to the organization service. The logic for checking Redis will occur in the licensing-service/src/main/java/com/thoughtmechanix/licenses/clients/OrganizationRestTemplate Client.java class. The code for this class is shown in the following listing.
The getOrganization() method is where the call to the organization service takes place. Before you make the actual REST call, you attempt to retrieve the Organization object associated with the call from Redis using the checkRedisCache() method. If the organization object in question is not in Redis, the code will return a null value. If a null value is returned from the checkRedisCache() method, the code will invoke the organization service’s REST endpoint to retrieve the desired organization record. If the organization service returns an organization, the returned organization object will be cached using the cacheOrganizationObject() method.
Pay close attention to exception handling when interacting with the cache. To increase resiliency, we never let the entire call fail if we cannot communicate with the Redis server. Instead, we log the exception and let the call go out to the organization service. In this particular use case, caching is meant to help improve performance and the absence of the caching server shouldn’t impact the success of the call.
With the Redis caching code in place, you should hit the licensing service (yes, you only have two services, but you have a lot of infrastructure) and see the logging messages in listing 8.10. If you were to do two back-to-back GET requests on the following licensing service endpoint, http://localhost:5555/api/licensing/v1/organizations/e254f8c-c442-4ebe-a82a-e2fc1d1ff78a/licenses/f3831f8c-c338-4ebe-a82a-e2fc1d1ff78a, you should see the following two output statements in your logs:
licensingservice_1     | 2016-10-26 09:10:18.455 DEBUG 28 --- [nio-8080-exec-
     1] c.t.l.c.OrganizationRestTemplateClient   : Unable to locate
     organization from the redis cache: e254f8c-c442-4ebe-a82a-e2fc1d1ff78a.

licensingservice_1     | 2016-10-26 09:10:31.602 DEBUG 28 --- [nio-8080-exec-
     2] c.t.l.c.OrganizationRestTemplateClient   : I have successfully
     retrieved an organization e254f8c-c442-4ebe-a82a-e2fc1d1ff78a from the
     redis cache: com.thoughtmechanix.licenses.model.Organization@6d20d301
The first line from the console shows the first time you tried to hit the licensing service endpoint for organization e254f8c-c442-4ebe-a82a-e2fc1d1ff78a. The licensing service first checked the Redis cache and couldn’t find the organization record it was looking for. The code then calls the organization service to retrieve the data. The second line that was printed from the console shows that when you hit the licensing service endpoint a second time, the organization record is now cached.
Previously you built your messaging integration between the licensing and organization services to use the default output and input channels that come packaged with the Source and Sink interfaces in the Spring Cloud Stream project. However, if you want to define more than one channel for your application or you want to customize the names of your channels, you can define your own interface and expose as many input and output channels as your application needs.
To create a custom channel, call inboundOrgChanges in the licensing service. You can define the channel in the licensing-service/src/main/java/com/thoughtmechanix/licenses/events/CustomChannels.java interface, as shown in the following listing.
The key takeaway from listing 8.12 is that for each custom input channel you want to expose, you mark a method that returns a SubscribableChannel class with the @Input annotation. If you want to define output channels for publishing messages, you’d use the @OutputChannel above the method that will be called. In the case of an output channel, the defined method will return a MessageChannel class instead of the SubscribableChannel class used with the input channel:
@OutputChannel("outboundOrg")
MessageChannel outboundOrg();
Now that you have a custom input channel defined, you need to modify two more things to use it in the licensing service. First, you need to modify the licensing service to map your custom input channel name to your Kafka topic. The following listing shows this.
To use your custom input channel, you need to inject the CustomChannels interface you defined into a class that’s going to use it to process messages. For the distributed caching example, I’ve moved the code for handling an incoming message to the following licensing-service class: licensing-service/src/main/java/com/-thoughtmechanix/licenses/events/handlers/OrganizationChange Handler.java. The following listing shows the message handling code that you’ll use with the inboundOrgChanges channel you defined.
At this point you don’t need to do anything with the organization service. The service is all set up to publish a message whenever an organization is added, updated, or deleted. All you have to do is build out the OrganizationChangeHandler class from listing 8.14. The following listing shows the full implementation of this class.
The microservices architecture is a powerful design paradigm for breaking down complex monolithic software systems into smaller, more manageable pieces. These manageable pieces can be built and deployed independently of each other; however, this flexibility comes at a price: complexity. Because microservices are distributed by nature, trying to debug where a problem is occurring can be maddening. The distributed nature of the services means that you have to trace one or more transactions across multiple services, physical machines, and different data stores, and try to piece together what exactly is going on.
This chapter lays out several techniques and technologies for making distributed debugging possible. In this chapter, we look at the following:
To accomplish the three things you’re going to use three different technologies:
To begin this chapter, we start with the simplest of tracing tools, the correlation ID.
Parts of this chapter rely on material covered in chapter 6 (specifically the material on Zuul pre-, response, and post filters). If you haven’t read chapter 6 yet, I recommend that you do so before you read this chapter.
We first introduced the concept of correlation IDs in chapter 5 and 6. A correlation ID is a randomly generated, unique number or string that’s assigned to a transaction when a transaction is initiated. As the transaction flows across multiple services, the correlation ID is propagated from one service call to another. In the context of chapter 6, you used a Zuul filter to inspect all incoming HTTP requests and inject a correlation ID if one wasn’t present.
Once the correlation ID was present, you used a custom Spring HTTP filter on every one of your services to map the incoming variable to a custom UserContext object. With the UserContext object in place, you could now manually add the correlation ID to any of your log statements by making sure you appended the correlation ID to the log statement, or, with a little work, add the correlation ID directly to Spring’s Mapped Diagnostic Context (MDC). You also wrote a Spring Interceptor that would ensure that all HTTP calls from a service would propagate the correlation ID by adding the correlation ID to the HTTP headers on any outbound calls.
Oh, and you had to perform Spring and Hystrix magic to make sure the thread context of the parent thread holding the correlation ID was properly propagated to Hystrix. Wow—in the end this was a lot of infrastructure that was put in place for something that you hope will only be looked at when a problem occurs (using a correlation ID to trace what’s going on with a transaction).
Fortunately, Spring Cloud Sleuth manages all this code infrastructure and complexity for you. By adding Spring Cloud Sleuth to your Spring Microservices, you can
With Spring Cloud Sleuth if you use Spring Boot’s logging implementation, you’ll automatically get correlation IDs added to the log statements you put in your microservices.
Let’s go ahead and add Spring Cloud Sleuth to your licensing and organization services.
To start using Spring Cloud Sleuth in your two services (licensing and organization), you need to add a single Maven dependency to the pom.xml files in both services:
<dependency>
  <groupId>org.springframework.cloud</groupId>
   <artifactId>spring-cloud-starter-sleuth</artifactId>
</dependency>
This dependency will pull in all the core libraries needed for Spring Cloud Sleuth. That’s it. Once this dependency is pulled in, your service will now
If everything is set up correctly, any log statements written within your service application code will now include Spring Cloud Sleuth trace information. For example, figure 9.1 shows what the service’s output would look like if you were to do an HTTP GET http://localhost:5555/api/organization/v1/organizations/e254f8c c442-4ebe-a82a-e2fc1d1ff78a on the organization service.
Spring Cloud Sleuth will add four pieces of information to each log entry. These four pieces (numbered to correspond with the numbers in figure 9.1) are
Up to now, we’ve only looked at the logging data produced by a single service call. Let’s look at what happens when you make a call to the licensing service at -GET http://localhost:5555/api/licensing/v1/organizations/e254f8c-c442-4ebe-a82a-e2fc1d1ff78a/licenses/f3831f8c-c338-4ebe-a82a-e2fc 1d1ff78a. Remember, the licensing service also has to call out to the organization service. Figure 9.2 shows the logging output from the two service calls.
By looking at figure 9.2, you can see that both the licensing and organization services have the same trace ID a9e3e1786b74d302. However, the licensing service has a span ID of a9e3e1786b74d302 (the same value as the transaction ID). The organization service has a span ID of 3867263ed85ffbf4.
By adding nothing more than a few POM dependencies, you’ve replaced all the correlation ID infrastructure that you built out in chapters 5 and 6. Personally, nothing makes me happier in this world then replacing complex, infrastructure-style code with someone else’s code.
In a large-scale microservice environment (especially in the cloud), logging data is a critical tool for debugging problems. However, because the functionality for a microservice-based application is decomposed into small, granular services and you can have multiple service instances for a single service type, trying to tie to log data from multiple services to resolve a user’s problem can be extremely difficult. Developers trying to debug a problem across multiple servers often have to try the following:
Each of the problems listed are real problems that I’ve run into. Debugging a problem across distributed servers is ugly work and often significantly increases the amount of time it takes to identify and resolve an issue.
A much better approach is to stream, real-time, all the logs from all of your service instances to a centralized aggregation point where the log data can be indexed and made searchable. Figure 9.3 shows at a conceptual level how this “unified” logging architecture would work.
Fortunately, there are multiple open source and commercial products that can help you implement the previously described logging architecture. Also, multiple implementation models exist that will allow you to choose between an on-premise, locally managed solution or a cloud-based solution. Table 9.1 summarizes several of the choices available for logging infrastructure.
|
Implementation Models |
Notes |
|
|---|---|---|
| Elasticsearch, Logstash, Kibana (ELK) | Open source Commercial Typically implemented on premise | http://elastic.co General purpose search engine Can do log-aggregation through the (ELK-stack) Requires the most hands-on support |
| Graylog | Open source Commercial On-premise | http://graylog.org Open-source platform that’s designed to be installed on premise |
| Splunk | Commercial only On-premise and cloud-based | http://splunk.com Oldest and most comprehensive of the log management and aggregation tools Originally an on-premise solution, but have since offered a cloud offering |
| Sumo Logic | Freemium Commercial Cloud-based | http://sumologic.com Freemium/tiered pricing model Runs only as a cloud service Requires a corporate work account to signup (no Gmail or Yahoo accounts) |
| Papertrail | Freemium Commercial Cloud-based | http://papertrailapp.com Freemium/tiered pricing model Runs only as a cloud service |
With all these choices, it might be difficult to choose which one is the best. Every organization is going to be different and have different needs.
For the purposes of this chapter, we’re going to look at Papertrail as an example of how to integrate Spring Cloud Sleuth-backed logs into a unified logging platform. I chose Papertrail because
In figure 9.3 we saw a general unified logging architecture. Let’s now see how the same architecture can be implemented with Spring Cloud Sleuth and Papertrail.
To set up Papertrail to work with your environment, we have to take the following actions:
Figure 9.4 shows the end state for your implementation and how Spring Cloud Sleuth and Papertrail fit together for your solution.
You’ll begin by setting up a Papertrail. To get started, go to https://papertrailapp.com and click on the green “Start Logging – Free Plan” button. Figure 9.5 shows this.
Papertrail doesn’t require a significant amount of information to get started; only a valid email address. Once you’ve filled out the account information, you’ll be presented with a screen to set up your first system to log data from. Figure 9.6 shows this screen.
By default, Papertrail allows you to send log data to it via a Syslog call (https://en.wikipedia.org/wiki/Syslog). Syslog is a log messaging format that originated in UNIX. Syslog allows for the sending of log messages over both TCP and UDP. Papertrail will automatically define a Syslog port that you can use to write log messages to. For the purposes of this discussion, you’ll use this default port. Figure 9.7 shows you the Syslog connect string that’s automatically generated when you click on the “Add your first system” button shown in figure 9.6.
At this point you’re all set up with Papertrail. You now have to configure your Docker environment to capture output from each of the containers running your services to the remote syslog endpoint defined in figure 9.7.
The connection string from figure 9.7 is unique to my account. You’ll need to make sure you use the connection string generated for you by Papertrail or define one via the Papertrail Settings > Log destinations menu option.
Normally, if you’re running each of your services in their own virtual machine, you’ll have to configure each individual service’s logging configuration to send its logging information to a to a remote syslog endpoint (like the one exposed through Papertrail).
Fortunately, Docker makes it incredibly easy to capture all the output from any Docker container running on a physical or virtual machine. The Docker daemon communicates with all of the Docker containers it’s managing through a Unix socket called docker.sock. Any container running on the server where Docker is running can connect to the docker.sock and receive all the messages generated by all of the other containers running on that server. In the simplest terms, docker.sock is like a pipe that your containers can plug into and capture the overall activities going on within the Docker runtime environment on the virtual server the Docker daemon is running on.
You’re going to use a “Dockerized” piece of software called Logspout (https://github.com/gliderlabs/logspout) that will listen to the docker.sock socket and then capture any standard out messages generated in Docker runtime and redirect the output to a remote syslog (Papertrail). To set up your Logspout container, you have to add a single entry to the docker-compose.yml file you use to fire up all of the Docker containers used for the code examples in this chapter. The docker/common/docker-compose.yml file you need to modify should have the following entry added to it:
logspout:
    image: gliderlabs/logspout
    command: syslog://logs5.papertrailapp.com:21218
    volumes:
      - /var/run/docker.sock:/var/run/docker.sock
In the previous code snippet, you’ll need to replace the value in the “command” attribute with the value supplied to you from Papertrail. If you use the previous Logspout snippet, your Logspout container will happily write your log entries to my Papertrail account.
Now when you fire up your Docker environment in this chapter, all data sent to a container’s standard output will be sent to Papertrail. You can see this for yourself by logging into your Papertrail account after you’ve started chapter 9’s Docker examples and clicking on the Events button in the top right part of your screen.
Figure 9.8 shows an example of what the data sent to Papertrail looks like.
Docker 1.6 and above do allow you to define alternative logging drivers to write the stdout/stderr messages written from each container. One of the logging drivers is a syslog driver that can be used to write the messages to a remote syslog listener.
Why did I choose Logspout instead of using the standard Docker log driver? The main reason is flexibility. Logspout offers features for customizing what logging data gets sent to your log aggregation platform. The features Logspout offers include
Now that your logs are flowing to Papertrail, you can really start appreciating Spring Cloud Sleuth adding trace IDs to all your log entries. To query for all the log entries related to a single transaction, all you need to do is take a trace ID and query for it in the query box of Papertrail’s event screen. Figure 9.9 shows how to execute a query by the Spring Cloud sleuth trace ID we used earlier in section 9.1.2: a9e3e1786b74d302
Don’t underestimate how important it is to have a consolidated logging architecture and a service correlation strategy thought out. It seems like a mundane task, but while I was writing this chapter, I used log aggregation tools similar to Papertrail to track down a race condition between three different services for a project I was working on. It turned out that the race condition has been there for over a year, but the service with the race condition had been functioning fine until we added a bit more load and one other actor in the mix to cause the problem.
We found the issue only after spending 1.5 weeks doing log queries and walking through the trace output of dozens of unique scenarios. We wouldn’t have found the problem without the aggregated logging platform that had been put in place. This experience reaffirmed several things:
If you inspect the HTTP response back from any service call made with Spring Cloud Sleuth, you’ll see that the trace ID used in the call is never returned in the HTTP response headers. If you inspect the documentation for Spring Cloud Sleuth, you’ll see that the Spring Cloud Sleuth team believes that returning any of the tracing data can be a potential security issue (though they don’t explicitly list their reasons why they believe this.)
However, I’ve found that the returning of a correlation or tracing ID in the HTTP response is invaluable when debugging a problem. Spring Cloud Sleuth does allow you to “decorate” the HTTP response information with its tracing and span IDs. However, the process to do this involves writing three classes and injecting two custom Spring beans. If you’d like to take this approach, you can see it in the Spring Cloud Sleuth documentation (http://cloud.spring.io/spring-cloud-static/spring-cloud-sleuth/1.0.12.RELEASE/). A much simpler solution is to write a Zuul “POST” filter that will inject the trace ID in the HTTP response.
In chapter 6 when we introduced the Zuul API gateway, we saw how to build a Zuul “POST” response filter to add the correlation ID you generated for use in your services to the HTTP response returned by the caller. You’re now going to modify that filter to add the Spring Cloud Sleuth header.
To set up your Zuul response filter, you need to add a single JAR dependencies to your Zuul server’s pom.xml file: spring-cloud-starter-sleuth. The spring-cloud-starter-sleuth dependency will be used to tell Spring Cloud Sleuth that you want Zuul to participate in a Spring Cloud trace. Later in the chapter, when we introduce Zipkin, you’ll see that the Zuul service will be the first call in any service invocation.
For chapter 9, this file can be found in zuulsvr/pom.xml. The following listing shows these dependencies.
Once this new dependency is in place, the actual Zuul “post” filter is trivial to implement. The following listing shows the source code used to build the Zuul filter. The file is located in zuulsvr/src/main/java/com/thoughtmechanix/zuulsvr/filters/ResponseFilter.java.
Because Zuul is now Spring Cloud Sleuth-enabled, you can access tracing information from within your ResponseFilter by autowiring in the Tracer class into the ResponseFilter. The Tracer class allows you to access information about the current Spring Cloud Sleuth trace being executed. The tracer.getCurrentSpan().traceIdString() method allows you to retrieve as a String the current trace ID for the transaction underway.
It’s trivial to add the trace ID to the outgoing HTTP response passing back through Zuul. This is done by calling
RequestContext ctx = RequestContext.getCurrentContext();
ctx.getResponse().addHeader("tmx-correlation-id",
       tracer.getCurrentSpan().traceIdString());
With this code now in place, if you invoke an EagleEye microservice through your Zuul gateway, you should get a HTTP response back called tmx-correlation-id. Figure 9.10 shows the results of a call to GET http://localhost:5555/api/licensing/v1/organizations/e254f8c-c442-4ebe-a82a-e2fc1d1ff78a/licenses/f3831f8c-c338-4ebe-a82a-e2fc1d1ff78a.
Figure 9.10 shows the results of a call to GET http://localhost:5555/api/licensing/v1/organizations/e254f8c-c442-4ebe-a82a-e2fc1d1ff78a/licenses/f3831f8c-c338-4ebe-a82a-e2fc1d1ff78a.
Having a unified logging platform with correlation IDs is a powerful debugging tool. However, for the rest of the chapter we’re going to move away from tracing log entries and instead look at how to visualize the flow of transactions as they move across different microservices. A clean, concise picture can be work more than a million log entries.
Distributed tracing involves providing a visual picture of how a transaction flows across your different microservices. Distributed tracing tools will also give a rough approximation of individual microservice response times. However, distributed tracing tools shouldn’t be confused with full-blown Application Performance Management (APM) packages. These packages can provide out-of-the-box, low-level performance data on the actual code within your service and can also provider performance data beyond response time, such as memory, CPU utilization, and I/O utilization.
This is where Spring Cloud Sleuth and the OpenZipkin (also referred to as Zipkin) project shine. Zipkin (http://zipkin.io/) is a distributed tracing platform that allows you to trace transactions across multiple service invocations. Zipkin allows you to graphically see the amount of time a transaction takes and breaks down the time spent in each microservice involved in the call. Zipkin is an invaluable tool for identifying performance issues in a microservices architecture.
Setting up Spring Cloud Sleuth and Zipkin involves four activities:
Up to now you’ve included two sets of Maven dependencies to your Zuul, licensing, and organization services. These JAR files were the spring-cloud-starter-sleuth and the spring-cloud-sleuth-core dependencies. The spring-cloud-starter-sleuth dependencies are used to include the basic Spring Cloud Sleuth libraries needed to enable Spring Cloud Sleuth within a service. The spring-cloud-sleuth-core dependencies are used whenever you have to programmatically interact with Spring Cloud Sleuth (which you’ll do again later in the chapter).
To integrate with Zipkin, you need to add a second Maven dependency called spring-cloud-sleuth-zipkin. The following listing shows the Maven entries that should be present in the Zuul, licensing, and organization services once the spring-cloud-sleuth-zipkin dependency is added.
<dependency>
   <groupId>org.springframework.cloud</groupId>
   <artifactId>spring-cloud-starter-sleuth</artifactId>
</dependency>
<dependency>
   <groupId>org.springframework.cloud</groupId>
   <artifactId>spring-cloud-sleuth-zipkin</artifactId>
</dependency>
With the JAR files in place, you need to configure each service that wants to communicate with Zipkin. You do this by setting a Spring property that defines the URL used to communicate with Zipkin. The property that needs to be set is the spring.zipkin.baseUrl property. This property is set in each service’s application.yml properties file.
The spring.zipkin.baseUrl can also be externalized as a property in Spring Cloud Config.
In the application.yml file for each service, the value is set to http://localhost:9411. However, at runtime I override this value using the ZIPKIN_URI (http://zipkin:9411) variable passed on each services Docker configuration (docker/common/docker-compose.yml) file.
Zipkin does have the ability to send its tracing data to a Zipkin server via RabbitMQ or Kafka. From a functionality perspective, there’s no difference in Zipkin behavior if you use HTTP, RabbitMQ, or Kafka. With the HTTP tracing, Zipkin uses an asynchronous thread to send performance data. The main advantage to using RabbitMQ or Kafka to collect your tracing data is that if your Zipkin server is down, any tracing messages sent to Zipkin will be “enqueued” until Zipkin can pick up the data.
The configuration of Spring Cloud Sleuth to send data to Zipkin via RabbitMQ and Kafka is covered in the Spring Cloud Sleuth documentation, so we won’t cover it here in any further detail.
To use Zipkin, you first need to set up a Spring Boot project the way you’ve done multiple times throughout the book. (In the code for the chapter, this is call zipkinsvr.) You then need to add two JAR dependencies to the zipkinsvr/pom.xml file. These two jar dependences are shown in the following listing.
One thing to notice about the JAR dependencies above is that they’re not Spring-Cloud-based dependencies. While Zipkin is a Spring-Boot-based project, the @EnableZipkinServer is not a Spring Cloud annotation. It’s an annotation that’s part of the Zipkin project. This often confuses people who are new to the Spring Cloud Sleuth and Zipkin, because the Spring Cloud team did write the @EnableZipkinStreamServer annotation as part of Spring Cloud Sleuth. The @EnableZipkinStreamServer annotation simplifies the use of Zipkin with RabbitMQ and Kafka.
I chose to use the @EnableZipkinServer because of its simplicity in setup for this chapter. With the @EnableZipkinStream server you need to set up and configure the services being traced and the Zipkin server to publish/listen to RabbitMQ or Kafka for tracing data. The advantage of the @EnableZipkinStreamServer annotation is that you can continue to collect trace data even if the Zipkin server is unavailable. This is because the trace messages will accumulate the trace data on a message queue until the Zipkin server is available for processing the records. If you use the @EnableZipkinServer annotation and the Zipkin server is unavailable, the trace data that would have been sent by the service(s) to Zipkin will be lost.
After the Jar dependencies are defined, you now need to add the @EnableZipkin Server annotation to your Zipkin services bootstrap class. This class is located in -zipkinsvr/src/main/java/com/thoughtmechanix/zipkinsvr/ZipkinServer Application.java. The following listing shows the code for the bootstrap class.
The key thing to note in this listing is the use of the @EnableZipkinServer annotation. This annotation enables you to start this Spring Boot service as a Zipkin server. At this point, you can build, compile, and start the Zipkin server as one of the Docker containers for the chapter.
Little configuration is needed to run a Zipkin server. One of the only things you’re going to have to configure when you run Zipkin is the back end data store that Zipkin will use to store the tracing data from your services. Zipkin supports four different back end data stores. These data stores are
By default, Zipkin uses an in-memory data store for storing tracing data. The Zipkin team recommends against using the in-memory database in a production system. The in-memory database can hold a limited amount of data and the data is lost when the Zipkin server is shut down or lost.
For the purposes of this book, you’ll use Zipkin with an in-memory data store. Configuring the individual data stores used in Zipkin is outside of the scope of this book, but if you’re interested in the topic, you can find more information at the Zipkin GitHub repository (https://github.com/openzipkin/zipkin/tree/master/zipkin-server).
At this point you have the clients configured to talk to a Zipkin server and you have the server configured and ready to be run. You need to do one more thing before you start using Zipkin. You need to define how often each service should write data to Zipkin.
By default, Zipkin will only write 10% of all transactions to the Zipkin server. The transaction sampling can be controlled by setting a Spring property on each of the services sending data to Zipkin. This property is called spring.sleuth.sampler.percentage. The property takes a value between 0 and 1:
For our purposes, you’re going to send trace information for all services. To do this, you can set the value of spring.sleuth.sampler.percentage or you can replace the default Sampler class used in Spring Cloud Sleuth with the AlwaysSampler. The AlwaysSampler can be injected as a Spring Bean into an application. For example, the licensing service has the AlwaysSampler defined as a Spring Bean in its licensing-service/src/main/java/com/thoughtmechanix/licenses/Application.java class as
@Bean
public Sampler defaultSampler() { return new AlwaysSampler();}
The Zuul, licensing, and organization services all have the AlwaysSampler defined in them so that in this chapter all transactions will be traced with Zipkin.
Let’s start this section with a scenario. Imagine you’re one of the developers on the EagleEye application and you’re on-call this week. You get a support ticket from a customer who’s complaining that one of the screens in the EagleEye application is running slow. You have a suspicion that the licensing service being used by the screen is running slow. But why and where? The licensing service relies on the organization service and both services make calls to different databases. Which service is the poor performer? Also, you know that these services are constantly being modified, so someone might have added a new service call into the mix. Understanding all the services that participate in the user’s transaction and their individual performance times is critical to supporting a distributed architecture such as a microservice architecture.
You’ll begin by using Zipkin to watch two transactions from your organization service as they’re traced by the Zipkin service. The organization service is a simple service that only makes a call to a single database. What you’re going to do is use POSTMAN to send two calls to the organization service (GET http://localhost:5555/api/organization/v1/organizations/e254f8c-c442-4ebe-a82a-e2fc1d1ff78a). The organization service calls will flow through a Zuul API gateway before the calls get directed downstream to an organization service instance.
After you’ve made two calls to the organization service, go to http://localhost:9411 and see what Zipkin has captured for trace results. Select the “organization service” from the dropdown box on the far upper left of the screen and then press the Find traces button. Figure 9.11 shows the Zipkin query screen after you’ve taken these actions.
Now if you look at the screenshot in figure 9.11, you’ll see that Zipkin captured two transactions. Each of the transactions is broken down into one or more spans. In Zipkin, a span represents a specific service or call in which timing information is being captured. Each of the transactions in figure 9.11 has three spans captured in it: two spans in the Zuul gateway, and then a span for the organization service. Remember, the Zuul gateway doesn’t blindly forward an HTTP call. It receives the incoming HTTP call, terminates the incoming call, and then builds a new call out to the targeted service (in this case, the organization service). This termination of the original call is how Zuul can add pre-, response, and post filters to each call entering the gateway. It’s also why we see two spans in the Zuul service.
The two calls to the organization service through Zuul took 3.204 seconds and 77.2365 milliseconds respectively. Because you queried on the organization service calls (and not the Zuul gateway calls), you can see that the organization service took 92% and 72% of the total amount of time of the transaction time.
Let’s dig into the details of the longest running call (3.204 seconds). You can see more detail by clicking on the transaction and drilling into the details. Figure 9.12 shows the details after you’ve clicked to drill down into further details.
In figure 9.12 you can see that the entire transaction from a Zuul perspective took approximately 3.204 seconds. However, the organization service call made by Zuul took 2.967 seconds of the 3.204 seconds involved in the overall call. Each span presented can be drilled down into for even more detail. Click on the organizationservice span and see what additional details can be seen from the call. Figure 9.13 shows the detail of this call.
One of the most valuable pieces of information in figure 9.13 is the breakdown of when the client (Zuul) called the organization service, when the organization service received the call, and when the organization service responded back. This type of timing information is invaluable in detecting and identifying network latency issues.
What if you want to understand exactly what service dependencies exist between service calls? You can call the licensing service through Zuul and then query Zipkin for licensing service traces. You can do this with a GET call to the licensing services http://localhost:5555/api/licensing/v1/organizations/e254f8c-c442-4ebe-a82a-e2fc1d1ff78a/licenses/f3831f8c-c338-4ebe-a82a-e2fc1d1ff78a endpoint.
Figure 9.14 shows the detailed trace of the call to the licensing service.
In figure 9.14, you can see that the call to the licensing service involves 4 discrete HTTP calls. You see the call to the Zuul gateway and then from the Zuul gateway to the licensing service. The licensing service then calls back through Zuul to call the organization service.
Spring Cloud Sleuth and Zipkin don’t trace HTTP calls. Spring Cloud Sleuth also sends Zipkin trace data on any inbound or outbound message channel registered in the service.
Messaging can introduce its own performance and latency issues inside of an application. A service might not be processing a message from a queue quickly enough. Or there could be a network latency problem. I’ve encountered all these scenarios while building microservice-based applications.
By using Spring Cloud Sleuth and Zipkin, you can identify when a message is published from a queue and when it’s received. You can also see what behavior takes place when the message is received on a queue and processed.
As you’ll remember from chapter 8, whenever an organization record is added, updated, or deleted, a Kafka message is produced and published via Spring Cloud Stream. The licensing service receives the message and updates a Redis key-value store it’s using to cache data.
Now you’ll go ahead and delete an organization record and watch the transaction be traced by Spring Cloud Sleuth and Zipkin. You can issue a DELETE http://local-host:5555/api/organization/v1/organizations/e254f8c-c442-4ebe-a82a-e2fc1d1ff78a via POSTMAN to the organization service.
Remember, earlier in the chapter we saw how to add the trace ID as an HTTP response header. You added a new HTTP response header called tmx-correlation-id. In my call, I had the tmx-correlation-id returned on my call with a value of 5e14cae0d90dc8d4. You can search Zipkin for this specific trace ID by entering the trace ID returned by your call via the search box in the upper-right hand corner of the Zipkin query screen. Figure 9.15 shows where you can enter the trace ID.
With the trace ID in hand you can query Zipkin for the specific transaction and can see the publication of a delete message to your output message change. This message channel, output, is used to publish to a Kafka topic call orgChangeTopic. Figure 9.16 shows the output message channel and how it appears in the Zipkin trace.
You can see the licensing service receive the message by querying Zipkin and looking for the received message. Unfortunately, Spring Cloud Sleuth doesn’t propagate the trace ID of a published message to the consumer(s) of that message. Instead, it generates a new trace ID. However, you can query Zipkin server for any license service transactions and order them by newest message. Figure 9.17 shows the results of this query.
Now that you’ve found your target licensing service transaction, you can drill down into the transaction. Figure 9.18 shows the results of this drilldown.
Until now you’ve used Zipkin to trace your HTTP and messaging calls from within your services. However, what if you want to perform traces out to third-party services that aren’t instrumented by Zipkin? For example, what if you want to get tracing and timing information for a specific Redis or Postgres SQL call? Fortunately, Spring Cloud Sleuth and Zipkin allow you to add custom spans to your transaction so that you can trace the execution time associated with these third-party calls.
Adding a custom span is incredibly easy to do in Zipkin. You can start by adding a custom span to your licensing service so that you can trace how long it takes to pull data out of Redis. Then you’re going to add a custom span to the organization service to see how long it takes to retrieve data from your organization database.
To add a custom span to the licensing service’s call to Redis, you’re going to instrument the licensing-service/src/main/java/com/thoughtmechanix/licenses/clients/OrganizationRestTemplateClient.java class. In this class you’re going to instrument the checkRedisCache() method. The following listing shows this code.
The code in listing 9.6 creates a custom span called readLicensingDataFrom-Redis. Now you’ll also add a custom span, called getOrgDbCall, to the organization service to monitor how long it takes to retrieve organization data from the Postgres database. The trace for organization service database calls can be seen in the organization-service/src/main/java/com/thoughtmechanix/organization/services/OrganizationService.java class. The method containing the custom trace is the getOrg() method call.
The following listing shows the source code from the organization service’s getOrg() method.
package com.thoughtmechanix.organization.services;

//Removed the imports for conciseness
@Service
public class OrganizationService {
  @Autowired
  private OrganizationRepository orgRepository;

  @Autowired
  private Tracer tracer;
  @Autowired
  SimpleSourceBean simpleSourceBean;

  private static final Logger logger =
      LoggerFactory.getLogger(OrganizationService.class);

  public Organization getOrg (String organizationId) {
 Span newSpan = tracer.createSpan("getOrgDBCall");

 logger.debug("In the organizationService.getOrg() call");
 try {
   return orgRepository.findById(organizationId);
 }finally{
   newSpan.tag("peer.service", "postgres");
   newSpan
      .logEvent(
         org.springframework.cloud.sleuth.Span.CLIENT_RECV);
   tracer.close(newSpan);
 }
}

    //Removed the code for conciseness
}
With these two custom spans in place, restart the services and then hit the GET http://localhost:5555/api/licensing/v1/organizations/e254f8c-c442 4ebe-a82a-e2fc1d1ff78a/licenses/f3831f8c-c338-4ebe-a82a-e2fc1d1ff78a endpoint. If we you look at the transaction in Zipkin, you should see the addition of the two additional spans. Figure 9.19 shows the additional custom spans added when you call the licensing service endpoint to retrieve licensing information.
From figure 9.19 you can now see additional tracing and timing information related to your Redis and database lookups. You can break out that the read call to Redis took 1.099 milliseconds. Since the call didn’t find an item in the Redis cache, the SQL call to the Postgres database took 4.784 milliseconds.
We’re at the end of the book, but not the end of our microservices journey. While most of this book has focused on designing, building, and operationalizing Spring-based microservices using the Spring Cloud technology, we haven’t yet touched on how to build and deploy microservices. Creating a build and deployment pipeline might seem like a mundane task, but in reality it’s one of the most important pieces of your microservices architecture.
Why? Remember, one of the key advantages of a microservices architecture is that microservices are small units of code that can be quickly built, modified, and deployed to production independently of one another. The small size of the service means that new features (and critical bug fixes) can be delivered with a high degree of velocity. Velocity is the key word here because velocity implies that little to no friction exists between making a new feature or fixing a bug and getting your service deployed. Lead times for deployment should be minutes, not days.
To accomplish this, the mechanism that you use to build and deploy your code needs to be
Building a robust and generalized build deployment pipeline is a significant amount of work and is often specifically designed toward the runtime environment your services are going to run. It often involves a specialized team of DevOps (developer operations) engineers whose sole job is to generalize the build process so that each team can build their microservices without having to reinvent the entire build process for themselves. Unfortunately, Spring is a development framework and doesn’t offer a significant amount of capabilities for implementing a build and deployment pipeline.
For this chapter, we’re going to see how to implement a build and deployment pipeline using a number of non-Spring tools. You’re going to take the suite of microservices you’ve been building for this book and do the following:
I want to start our discussion with the end goal in mind: a deployed set of services to AWS Elastic Container Service (ECS). Before we get into all the details of how you’re going to implement a build/deployment pipeline, let’s walk through how the EagleEye services are going to look running in Amazon’s cloud. Then we’ll discuss how to manually deploy the EagleEye services to the AWS cloud. Once that’s done, we will automate the entire process.
Throughout all the code examples in this book, you’ve run all of your applications inside a single virtual machine image with each individual service running as a Docker container. You’re going to change that now by separating your database server (PostgreSQL) and caching server (Redis) away from Docker into Amazon’s cloud. All the other services will remain running as Docker containers running inside a single-node Amazon ECS cluster. Figure 10.1 shows the deployment of the EagleEye services to the Amazon cloud.
Let’s walk through figure 10.1 and dive into more detail:
To set up your Amazon infrastructure, you’re going to need the following:
If you don’t have any experience with using Amazon’s Web Services, I’d set up an AWS account and install the tools in the list. I’d also spend time familiarizing yourself with the platform.
If you’re completely new to AWS, I highly recommend you pick up a copy of Michael and Andreas Wittig’s book Amazon Web Services in Action (Manning, 2015). The first chapter of the book (https://www.manning.com/books/amazon-web-services-in-action#downloads) is available for download and includes a well-written tutorial at the end of the chapter on how to sign up and configure your AWS account. Amazon Web Services in Action is a well-written and comprehensive book on AWS. Even though I’ve been working with the AWS environment for years, I still find it a useful resource.
Finally, in this chapter I’ve tried as much as possible to use the free-tier services offered by Amazon. The only place where I couldn’t do this is when setting up the ECS cluster. I used a t2.large server that costs approximately .10 cents per hour to run. Make sure that you shut down your services after you’re done if you don’t want to incur significant costs.
There’s no guarantee that the Amazon resources (Postgres, Redis, and ECS) that I’m using in this chapter will be available if you want to run this code yourself. If you’re going to run the code from this chapter, you need to set up your own GitHub repository (for your application configuration), your own Travis CI account, Docker Hub (for your Docker images), and Amazon account, and then modify your application configuration to point to your account and credentials.
Before we begin this section, you need to set up and configure your Amazon AWS account. Once this is done, your first task is to create the PostgreSQL database that you’re going to use for your EagleEye services. To do this you’re going to log in into the Amazon AWS console (https://aws.amazon.com/console/) and do the following:
The first thing the Amazon database creation wizard will ask you is whether this is a production database or a dev/test database. You’re going to create a dev/test database using the free tier. Figure 10.2 shows this screen.
Next, you’re going to set up basic information about your PostgreSQL database and also set the master user ID and password you’re going to use to log into the database. Figure 10.3 shows this screen.
The last and final step of the wizard is to set up the database security groups, port information, and database backup information. Figure 10.4 shows the contents of this screen.
At this point, your database creation process will begin (it can take several minutes). Once it’s done, you’ll need to configure the Eagle Eye services to use the database. After the database is created (this will take several minutes), you’ll navigate back to the RDS dashboard and see your database created. Figure 10.5 shows this screen.
For this chapter, I created a new application profile called aws-dev for each microservice that needs to access the Amazon-base PostgreSQL database. I added a new Spring Cloud Config server application profile in the Spring Cloud Config GitHub repository (https://github.com/carnellj/config-repo) containing the Amazon database connection information. The property files follow the naming convention (service-name)-aws-dev.yml in each of the property files using the new database (licensing service, organization service, and authentication service).
At this point your database is ready to go (not bad for setting it up in approximately five clicks). Let’s move to the next piece of application infrastructure and see how to create the Redis cluster that your EagleEye licensing service is going to use.
To set up the Redis cluster, you’re going to use the Amazon ElastiCache service. Amazon ElastiCache allows you to build in-memory data caches using Redis or Memcached (https://memcached.org/). For the EagleEye services, you’re going to move the Redis server you were running in Docker to ElastiCache.
To begin, navigate back to the AWS Console’s main page (click the orange cube on the upper left-hand side of the page) and click the ElastiCache link.
From the ElastiCache console, select the Redis link (left-hand side of the screen), and then hit the blue Create button at the top of the screen. This will bring up the ElastiCache/Redis creation wizard.
Figure 10.6 shows the Redis creation screen.
Go ahead and hit the create button once you’ve filled in all your data. Amazon will begin the Redis cluster creation process (this will take several minutes). Amazon will build a single-node Redis server running on the smallest Amazon server instance available. Once you hit the button you’ll see your Redis cluster being created. Once the cluster is created, you can click on the name of the cluster and it will bring you to a detailed screen showing the endpoint used in the cluster. Figure 10.7 shows the details of the Redis clustered after it has been created.
The licensing service is the only one of your services to use Redis, so make sure that if you deploy the code examples in this chapter to your own Amazon instance, you modify the licensing service’s Spring Cloud Config files appropriately.
The last and final step before you deploy the EagleEye services is to set up an Amazon ECS cluster. Setting up an Amazon ECS cluster provisions the Amazon machines that are going to host your Docker containers. To do this you’re going to again go to the Amazon AWS console. From there you’re going to click on the Amazon EC2 Container Service link.
This brings you to the main EC2 Container service page, where you should see a “Getting Started” button.
Click on the “Start” button. This will bring you to the “Select options to Configure” screen shown in figure 10.8.
Uncheck the two checkboxes on the screen and click the cancel button. ECS offers a wizard for setting up an ECS container based on a set of predefined templates. You’re not going to use this wizard. Once you cancel out of the ECS set-up wizard, you should see the “Clusters” tab on the ECS home page. Figure 10.9 shows this screen. Hit the “Create Cluster” button to begin the process of creating an ECS cluster.
Now you’ll see a screen called “Create Cluster” that has three major sections. The first section is going to define the basic cluster information. Here you’re going to enter the
Figure 10.10 shows the screen as I populated it for the test examples in this book.
One of the first tasks you do when you set up an Amazon account is define a key pair for SSHing into any EC2 servers you start. We’re not going to cover setting up a key pair in this chapter, but if you’ve never done this before, I recommend you look at Amazon’s directions regarding this (http://docs.aws.amazon.com/AWSEC2/latest/UserGuide/ec2-key-pairs.html).
Next, you’re going to set up the network configuration for the ECS cluster. Figure 10.11 shows the networking screen and the values you’re configuring.
The first thing to note is selecting the Amazon Virtual Private Cloud (VPC) that the ECS cluster will run. By default, the ECS set-up wizard will offer to set up a new VPC. I’ve selected to run the ECS cluster in my default VPC. The default VPC houses the database server and Redis cluster. In Amazon’s cloud, an Amazon-managed Redis server can only be accessed by servers that are in the same VPC as the Redis server.
Next, you have to select the subnets in the VPC that you want to give access to the ECS cluster. Because each subnet corresponds to an Amazon availability zone, I usually select all subnets in the VPC to make the cluster available.
Finally, you have to select to create a new security group or select an existing Amazon security group that you’ve created to apply to the new ECS cluster. Because you’re running Zuul, you want all traffic to flow through a single port, port 5555. You’re going to configure the new security group being created by the ECS wizard to allow all in-bound traffic from the world (0.0.0.0/0 is the network mask for the entire internet).
The last step that has to be filled out in the form is the creation of an Amazon IAM Role for the ECS container agent that runs on the server. The ECS agent is responsible for communicating with Amazon about the status of the containers running on the server. You’re going to allow the ECS wizard to create a IAM role, called ecsInstanceRole, for you. Figure 10.12 shows this configuration step.
At this point you should see a screen tracking the status of the cluster creation. Once the cluster is created, you should see a blue button on the screen called “View Cluster.” Click on the “View Cluster” button. Figure 10.13 shows the screen that will appear after the “View Cluster” button has been pressed.
At this point, you have all the infrastructure you need to successfully deploy the EagleEye microservices.
Right now, you’re doing everything via the Amazon AWS console. In a real environment, you’d have scripted the creation of all this infrastructure using Amazon’s CloudFormation scripting DSL (domain specific language) or a cloud infrastructure scripting tool like HashiCorp’s Terraform (https://www.terraform.io/). However, that’s an entire topic to itself and far outside the scope of this book. If you’re using Amazon’s cloud, you’re probably already familiar with CloudFormation. If you’re new to Amazon’s cloud, I recommend you take the time to learn it before you get too far down the road of setting up core infrastructure via the Amazon AWS Console.
Again, I want to point the reader back to Amazon Web Services in Action (Manning, 2015) by Michael and Andreas Wittig. They walk through the majority of Amazon Web Services and demonstrate how to use CloudFormation (with examples) to automate the creation of your infrastructure.
At this point you have the infrastructure set up and can now move into the second half of the chapter. In this second part, you’re going to deploy the EagleEye services to your Amazon ECS container. You’re going to do this in two parts. The first part of your work is for the terminally impatient (like me) and will show how to deploy EagleEye manually to your Amazon instance. This will help you understand the mechanics of deploying the service and see the deployed services running in your container. While getting your hands dirty and manually deploying your services is fun, it isn’t sustainable or recommended.
This is where the second part of this section comes into play. You’re going to automate the entire build and deployment process and take the human being out of the picture. This is your targeted end state and really caps the work you’ve been doing in the book by demonstrating how to design, build, and deploy microservices to the cloud.
To manually deploy your EagleEye services, you’re going to switch gears and move away from the Amazon AWS console. To deploy the EagleEye services, you’re going to use the Amazon ECS command-line client (https://github.com/aws/amazon-ecs-cli). After you’ve installed the ECS command-line client, you need to configure the ecs-cli run-time environment to
ecs-cli configure --region us-west-1 \
                  --access-key $AWS_ACCESS_KEY \
                  --secret-key $AWS_SECRET_KEY \
                  --cluster spmia-tmx-dev
The ecs-cli configure command will set the region where your cluster is located, your Amazon access and secret key, and the name of the cluster (spmia-tmx-dev) you’ve deployed to. If you look at the previous command, I’m using environment variables ($AWS_ACCESS_KEY and $AWS_SECRET_KEY) to hold my Amazon access and secret key.
I selected the us-west-1 region for purely demonstrative purposes. Depending on the country you’re located in, you might choose an Amazon region more specific to your part of the world.
Next, let’s see how to do a build. Unlike in other chapters, you have to set the build name because the Maven scripts in this chapter are going to be used in the build-deploy pipeline being set up later on in the chapter. You’re going to set an environment variable called $BUILD_NAME. The $BUILD_NAME environment variable is used to tag the Docker image that’s created by the build script. Change to the root directory of the chapter 10 code you downloaded from GitHub and issue the following two commands:
export BUILD_NAME=TestManualBuild
mvn clean package docker:build
This will execute a Maven build using a parent POM located at the root of the project directory. The parent pom.xml is set up to build all the services you’ll deploy in this chapter. Once the Maven code is done executing, you can deploy the Docker images to the ECS instance you set up earlier in the section 10.1.3. To do the deployment, issue the following command:
ecs-cli compose --file docker/common/docker-compose.yml up
The ECS command line client allows you to deploy containers using a Docker-compose file. By allowing you to reuse your Docker-compose file from your desktop development environment, Amazon has significantly simplified the deployment of your services to Amazon ECS. After the ECS client has run, you can validate that the services are running and discover the IP address of the servers by issuing the following command:
ecs-cli ps
Figure 10.14 shows the output from the ecs-cli ps command.
Note three things from the output in figure 10.14:
At this point you’ve successfully deployed your first set of services to an Amazon ECS client. Now, let’s build on this by looking at how to design a build and deployment pipeline that can automate the process of compiling, packaging, and deploying your services to Amazon.
ECS has limited tools to debug why a container doesn’t start. If you have problems with an ECS deployed service starting or staying up, you’ll need to SSH onto the ECS cluster to look at the Docker logs. To do this you need to add port 22 to the security group that the ECS cluster runs with, and then SSH onto the box using the Amazon key pair you defined at the time the cluster was set (see figure 10.9) as the ec2-user. Once you’re on the server, you can get a list of all the Docker containers running on the server by running the docker ps command. Once you’ve located the container image that you want to debug, you can run a docker logs –f <<container id>> command to tail the logs of the targeted Docker container.
This is a primitive mechanism for debugging an application, but sometimes you only need to log on to a server and see the actual console output to determine what’s going on.
The goal of this chapter is to provide you with the working pieces of a build/deployment pipeline so that you can take these pieces and tailor them to your specific environment.
Let’s start our discussion by looking at the general architecture of your build deployment pipeline and several of the general patterns and themes that it represents. To keep the examples flowing, I’ve done a few things that I wouldn’t normally do in my own environment and I’ll call those pieces out accordingly.
Our discussion on deploying microservices is going to begin with a picture you saw way back in chapter 1. Figure 10.15 is a duplicate of the diagram we saw in chapter 1 and shows the pieces and steps involved in building a microservices build and deployment pipeline.
Figure 10.15 should look somewhat familiar, because it’s based on the general build-deploy pattern used for implementing Continuous Integration (CI):
With the build and deployment pipeline (shown in figure 10.15), a similar process is followed up until the code is ready to be deployed. In the build and deployment shown in figure 10.15, you’re going to tack Continuous Delivery (CD) onto the process:
You’ll see from figure 10.15 that I do several types of testing (unit, integration, and platform) during the build and deployment of a service. Three types of testing are typical in a build and deployment pipeline:
Unit tests—Unit tests are run immediately before the compiliation of the service code, but before it’s deployed to an environment. They’re designed to run in complete isolation, with each unit test being small and narrow in focus. A unit test should have no dependencies on third-party infrastructure databases, services, and so on. Usually a unit test scope will encompass the testing of a single method or function.
Integration tests—Integration tests are run immediately after packaging the service code. These tests are designed to test an entire workflow and stub or mock out major services or components that would need to be called off box. During an integration test, you might be running an in-memory database to hold data, mocking out third-party service calls, and so on. Integration tests test an entire workflow or code path. For integration tests, third-party dependencies are mocked or stubbed so that any calls that would invoke a remote service are mocked or stubbed so that calls never leave the build server.
Platform tests—Platform tests are run right before a service is deployed to an environment. These tests typically test an entire business flow and also call all the third-party dependencies that would normally be called in a production system. Platform tests are running live in a particular environment and don’t involve any mocked-out services. Platform tests are run to determine integration problems with third-party services that would normally not be detected when a third-party service is stubbed out during an integration test.
This build/deploy process is built on four core patterns. These patterns aren’t my creation but have emerged from the collective experience of development teams building microservice and cloud-based applications. These patterns include
With the concept of immutable servers, we should always be guaranteed that a server’s configuration matches exactly with what the machine image for the server says it does. A server should have the option to be killed and restarted from the machine image without any changes in the service or microservices behavior. This killing and resurrection of a new server was termed “Phoenix Server” by Martin Fowler (http://martinfowler.com/bliki/PhoenixServer.html) because when the old server is killed, the new server should rise from the ashes. The Phoenix server pattern has two key benefits.
First, it exposes and drives configuration drift out of your environment. If you’re constantly tearing down and setting up new servers, you’re more likely to expose configuration drift early. This is a tremendous help in ensuring consistency. I’ve has spent way too much of my time and life away from my family on “critical situation” calls because of configuration drift.
Second, the Phoenix server pattern helps to improve resiliency by helping find situations where a server or service isn’t cleanly recoverable after it has been killed and restarted. Remember, in a microservice architecture your services should be stateless and the death of a server should be a minor blip. Randomly killing and restarting servers quickly exposes situations where you have state in your services or infrastructure. It’s better to find these situations and dependencies early in your deployment pipeline, rather than when you’re on the phone with an angry company.
The organization where I work uses Netflix’s Chaos Monkey (https://github.com/-Netflix/SimianArmy/wiki/Chaos-Monkey) to randomly select and kill servers. Chaos Monkey is an invaluable tool for testing the immutability and recoverability of your microservice environment. Chaos Monkey randomly selects server instances in your environment and kills them. The idea with using Chaos Monkey is that you’re looking for services that can’t recover from the loss of a server, and when a new server is started, it will behave in the same fashion as the server that was killed.
From the general architecture laid out in section 10.3, you can see that there are many moving pieces behind a build/deployment pipeline. Because the purpose of this book is to show you things “in action,” we’re going to walk through the specifics of implementing a build/deployment pipeline for the EagleEye services. Figure 10.16 lays out the different technologies you’re going to use to implement your pipeline:
You might find it a little odd that I wrote the platform tests in Python rather than Java. I did this purposefully. Python (like Groovy) is a fantastic scripting language for writing REST-based test cases. I believe in using the right tool for the job. One of the biggest mind shifts I’ve seen for organizations adopting microservices is that the responsibility for picking the language should lie with the development teams. In too many organizations, I’ve seen a dogmatic embrace of standards (“our enterprise standard is Java . . . and all code must be written in Java”). As a result, I’ve seen development teams jump through hoops to write large amounts of Java code when a 10-line Groovy or Python script would do the job.
The second reason I chose Python is that unlike unit and integration tests, platform tests are truly “black box” tests where you’re acting like an actual API consumer running in a real environment. Unit tests exercise the lowest level of code and shouldn’t have any external dependencies when they run. Integration tests come up a level and test the API, but key external dependencies, like calls to other services, database calls, and so on, are mocked or stubbed out. Platform tests should be truly independent tests of the underlying infrastructure.
Dozens of source control engines and build deploy engines (both on-premise and cloud-based) can implement your build and deploy pipeline. For the examples in this book, I purposely chose GitHub as the source control repository and Travis CI as the build engine. The Git source control repository is an extremely popular repository and GitHub is one of the largest cloud-based source control repositories available today.
Travis CI is a build engine that integrates tightly with GitHub (it also supports Subversion and Mercurial). It’s extremely easy to use and is completely driven off a single configuration file (.travis.yml) in your project’s root directory. Its simplicity and opinionated nature make it easy to get a simple build pipeline off the ground
Up to now, all of the code examples in this book could be run solely from your desktop (with the exception of connectivity out to GitHub). For this chapter, if you want to completely follow the code examples, you’ll need to set up your own GitHub, Travis CI, and Docker hub accounts. We’re not going to walk through how to set up these accounts, but the setup of a personal Travis CI account and your GitHub account can all be done right from the Travis CI web page (http://travis-ci.org).
For the purposes of this book (and my sanity), I set up a separate GitHub repository for each chapter in the book. All the source code for the chapter can be built and deployed as a single unit. However, outside this book, I highly recommend that you set up each microservice in your environment with its own repository with its own independent build processes. This way each service can be deployed independently of one another. With the build process, I’m deploying all of the services as a single unit only because I wanted to push the entire environment to the Amazon cloud with a single build script and not manage build scripts for each individual service.
At the heart of every service built in this book has been a Maven pom.xml file that’s used to build the Spring Boot service, package it into an executable JAR, and then build a Docker image that can be used to launch the service. Up until this chapter, the compilation and startup of the services occurred by
The question is, how do you repeat this process in Travis CI? It all begins with a single file called .travis.yml. The .travis.yml is a YAML-based file that describes the actions you want taken when Travis CI executes your build. This file is stored in the root directory of your microservice’s GitHub repository. For chapter 10, this file can be found in spmia-chapter10-code/. travis.yml.
When a commit occurs on a GitHub repository Travis CI is monitoring, it will look for the .travis.yml file and then initiate the build process. Figure 10.17 shows the steps your .travis.yml file will undertake when a commit is made to the GitHub repository used to hold the code for this chapter (https://github.com/carnellj/spmia-chapter10).
Now that we’ve walked through the general steps involved in the .travis.yml file, let’s look at the specifics of your .travis.yml file. Listing 10.1 shows the different pieces of the .travis.yml file.
The code annotations in listing 10.1 are lined up with the numbers in figure 10.17.
We’re now going to walk through each of the steps involved in the build process in more detail.
The first part of the travis.yml file deals with configuring the core runtime configuration of your Travis build. Typically this section of the .travis.yml file will contain Travis-specific functions that will do things like
The next listing shows this specific section of the build file.
The first thing your Travis build script is doing is telling Travis what primary language is going to be used for performing
the build. By specifying the language as java and jdk attributes as java and oraclejdk8, Travis will ensure that the JDK is installed and configured for your project.
The next part of your .travis.yml file, the cache.directories attribute , tells Travis to cache the results of this directory when a build is executed and reuse it across multiple builds. This is
extremely useful when dealing with package managers such as Maven, where it can take a significant amount of time to download
fresh copies of jar dependencies every time a build is kicked off. Without the cache.directories attribute set, the build for this chapter can take up to 10 minutes to download all of the dependent jars.
The next two attributes in listing 10.2 are the sudo attribute and the service attribute. The sudo attribute is used to tell Travis that your build process will need to use sudo as part of the build. The UNIX sudo command is used to temporarily elevate a user to root privileges. Generally, you use sudo when you need to install third-party tools. You do exactly this later in the build when you need to install the Amazon ECS
tools.
The services attribute is used to tell Travis whether you’re going to use certain key services while executing your build. For instance, if your integration tests need a local database available for them to run, Travis allows you start a MySQL or PostgreSQL database right on your build box. In this case, you need Docker running to build your Docker images for each of your EagleEye services and push your images to the Docker hub. You’ve set the services attribute to start Docker when the build is kicked off.
The next attribute, notifications defines the communication channel to use whenever a build succeeds or fails. Right now, you always communicate the build
results by setting the notification channel for the build to email. Travis will notify you via email on both the success and
failure of the build. Travis CI can notify via multiple channels besides email, including Slack, IRC, HipChat, or a custom
web hook.
The branches.only attribute tells Travis what branches Travis should build against. For the examples in this chapter, you’re only going to
perform a build off the master branch of Git. This prevents you from kicking off a build every time you tag a repo or commit to a branch within GitHub.
This is important because GitHub does a callback into Travis every time you tag a repo or create a release. The presence of
the branches.only attribute being set to master prevents Travis from going into an endless build.
The last part of the build configuration is the setting of sensitive environment variables . In your build process, you might communicate with third-party vendors such as Docker, GitHub, and Amazon. Sometimes you’re
communicating via their command line tools and other times you’re using the APIs. Regardless, you often have to present sensitive
credentials. Travis CI gives you the ability to add encrypted environment variables to protect these credentials.
To add an encrypted environment variable, you must encrypt the environment variable using the travis command line tool on your desk in the project directory where you have your source code. To install the Travis command-line tool locally, review the documentation for the tool at https://github.com/travis-ci/travis.rb. For the .travis.yml used in this chapter, I created and encrypted the following environment variables:
Once the travis tool is installed, the following command will add the encrypted environment variable DOCKER_USERNAME to the env.global section of you .travis.yml file:
travis encrypt DOCKER_USERNAME=somerandomname --add env.global
Once this command is run, you should now see in the env.global section of your .travis.yml file a secure attribute tag followed by a long string of text. Figure 10.18 shows what an encrypted environment variable looks like.
Unfortunately, Travis doesn’t label the names of your encrypted environment variables in your .travis.yml file.
Encrypted variables are only good for the single GitHub repository they’re encrypted in and Travis is building against. You can’t cut and paste an encrypted environment variable across multiple .travis.yml files. Your builds will fail to run because the encrypted environment variables won’t decrypt properly.
Even though all our examples use Travis CI as the build tool, all modern build engines allow you to encrypt your credentials and tokens. Please, please, please make sure you encrypt your credentials. Credentials embedded in a source repository are a common security vulnerability. Don’t rely on the belief that your source control repository is secure and therefore the credentials in it are secure.
Wow, the pre-build configuration was huge, but the next section is small. Build engines are often a source of a significant amount of “glue code” scripting to tie together different tools used in the build process. With your Travis script, you need to install two command-line tools:
Each item listed in the before_install section of the .travis.yml file is a UNIX command that will be executed before the build kicks off. The following listing shows the before_install attribute along with the commands that need to be run.
The first thing to do in the build process is install the travis command-line tool on the remote build server:
gem install travis -v 1.8.5 --no-rdoc --no-ri
Later on in the build you’re going to kick off another Travis job via the Travis REST API. You need the travis command line tool to get a token for invoking this REST call.
After you’ve installed the travis tool, you’re going to install the Amazon ecs-cli tool. This is a command-line tool used for deploying, starting, and stopping Docker containers running within Amazon. You install the ecs-cli by first downloading the binary and then changing the permission on the downloaded binary to be executable:
- sudo curl -o /usr/local/bin/ecs-cli https://s3.amazonaws.com/amazon-ecs-cli/ecs-cli-linux-amd64-latest
- sudo chmod +x /usr/local/bin/ecs-cli
The last thing you do in the before_install section of the .travis.yml is set three environment variables in your build. These three environment variables will help drive the behavior of your builds. These environment variables are
The actual values set in these environment variables are
- export BUILD_NAME=chapter10-$TRAVIS_BRANCH-
The first environment variable, BUILD_NAME, generates a unique build name that contains the name of the build, followed by the date and time (down to the seconds field) and then the build number in Travis. This BUILD_NAME will be used to tag your source code in GitHub and your Docker image when it’s pushed to the Docker hub repository.
The second environment variable, CONTAINER_IP, contains the IP address of the Amazon ECS virtual machine that your Docker containers will run on. This CONTAINER_IP will be passed later to another Travis CI job that will execute your platform tests.
I’m not assigning a static IP address to the Amazon ECS server that’s spun. If I tear down the container completely, I’ll be given a new IP. In a real production environment, the servers in your ECS cluster will probably have static (non-changing) IPs assigned to them, and the cluster will have an Amazon Enterprise Load Balancer (ELB) and an Amazon Route 53 DNS name so that the actual IP address of the ECS server would be transparent to the services. However, setting up this much infrastructure is outside the scope of the example I’m trying to demonstrate in this chapter.
The third environment variable, PLATFORM_TEST_NAME, contains the name of the build job being executed. We’ll explore its use later in the chapter.
A common requirement in many financial services and healthcare companies is that they have to prove traceability of the deployed software in production, all the way back through all the lower environments, back to the build job that built the software, and then back to when the code was checked into the source code repository. The immutable server pattern really shines in helping organizations meet this requirement. As you saw in our build example, you tagged the source control repository and the container image that’s going to be deployed with the same build name. That build name is unique and tied into a Travis build number. Because you only promote the container image through each environment and each container image is labeled with the build name, you’ve established traceability of that container image back to the source code associated with it. Because the containers are never changed once they’re tagged, you have a strong audit position to show that the deployed code matches the underlying source code repository. Now, if you wanted to play it extra safe, at the time you labeled the project source code, you could also label the application configuration residing in the Spring Cloud Config repository with the same label generated for the build.
At this point, all the pre-build configuration and dependency installation is complete. To execute your build, you’re going to use the Travis script attribute. Like the before_install attribute, the script attribute takes a list of commands that will be executed. Because these commands are lengthy, I chose to encapsulate each major step in the build into its own shell script and have Travis execute the shell script. The following listing shows the major steps that are going to be undertaken in the build.
script:
  - sh travis_scripts/tag_build.sh
  - sh travis_scripts/build_services.sh
  - sh travis_scripts/deploy_to_docker_hub.sh
  - sh travis_scripts/deploy_amazon_ecs.sh
  - sh travis_scripts/trigger_platform_tests.sh
Let’s walk through each of the major steps execute in the script step.
The travis_scripts/tag_build.sh script takes care of tagging code in the repository with a build name. For the example here, I’m creating a GitHub release via the GitHub REST API. A GitHub release will not only tag the source control repository, but will also allow you to post things like release notes to the GitHub web page along with whether the source code is a pre-release of the code.
Because the GitHub release API is a REST-based call, you’ll use curl in your shell script to do the actual invocation. The following listing shows the code from the travis_scripts/tag_build.sh script.
This script is simple. The first thing you do is build the target URL for the GitHub release API:
export TARGET_URL="https://api.github.com/repos/
In the TARGET_URL you’re passing an HTTP query parameter called access_token. This parameter contains a GitHub personal access token set up to specifically allow your script to take action via the REST API. Your GitHub personal access token is stored in an encrypted environment variable called GITHUB_TOKEN. To generate a personal access token, log in to your GitHub account and navigate to https://github.com/settings/tokens. When you generate a token, make sure you cut and paste it right away. When you leave the GitHub screen it will be gone and you’ll need to regenerate it.
The second step in your script is to set up the JSON body for the REST call:
body="{
  \"tag_name\": \"$BUILD_NAME\",
  \"target_commitish\": \"master\",
  \"name\": \"$BUILD_NAME\",
  \"body\": \"Release of version $BUILD_NAME\",
  \"draft\": true,
  \"prerelease\": true
}"
In the previous code snippet you’re supplying the $BUILD_NAME for a tag_name value and the setting basic release notes using the body field.
Once the JSON body for the call is built, executing the call via the curl command is trivial:
curl –k -X POST \
  -H "Content-Type: application/json"   \
  -d "$body" \
  $TARGET_URL
The next step in the Travis script attribute is to build the individual services and then create Docker container images for each service. You do this via a small script called travis_scripts/build_services.sh. This script will execute the following command:
mvn clean package docker:build
This Maven command executes the parent Maven spmia-chapter10-code/pom.xml file for all of the services in the chapter 10 code repository. The parent pom.xml executes the individual Maven pom.xml for each service. Each individual service builds the service source code, executes any unit and integration tests, and then packages the service into an executable jar.
The last thing that happens in the Maven build is the creation of a Docker container image that’s pushed to the local Docker repository running on your Travis build machine. The creation of the Docker image is carried out using the Spotify Docker plugin (https://github.com/spotify/docker-maven-plugin). If you’re interested in how the Spotify Docker plug-in works within the build process, please refer to appendix A, “Setting up your desktop environment”. The Maven build process and the Docker configuration are explained there.
At this point in the build, the services have been compiled and packaged and a Docker container image has been created on the Travis build machine. You’re now going to push the Docker container image to a central Docker repository via your travis_scripts/deploy_to_docker_hub.sh script. A Docker repository is like a Maven repository for your created Docker images. Docker images can be tagged and uploaded to it, and other projects can download and use the images.
For this code example, you’re going to use the Docker hub (https://hub.docker.com/). The following listing shows the commands used in the travis_scripts/deploy_to_docker_hub.sh script.
echo "Pushing service docker images to docker hub ...."
docker login -u $DOCKER_USERNAME -p $DOCKER_PASSWORD
docker push johncarnell/tmx-authentication-service:$BUILD_NAME
docker push johncarnell/tmx-licensing-service:$BUILD_NAME
docker push johncarnell/tmx-organization-service:$BUILD_NAME
docker push johncarnell/tmx-confsvr:$BUILD_NAME
docker push johncarnell/tmx-eurekasvr:$BUILD_NAME
docker push johncarnell/tmx-zuulsvr:$BUILD_NAME
The flow of this shell script is straightforward. The first thing you have to do is log in to Docker hub using the Docker command line-tools and the user credentials of the Docker Hub account the images are going to be pushed to. Remember, your credentials for Docker Hub are stored as encrypted environment variables:
docker login -u $DOCKER_USERNAME -p $DOCKER_PASSWORD
Once the script has logged in, the code will push each individual microservice's Docker image residing in the local Docker repository running on the Travis build server, to the Docker Hub repository:
docker push johncarnell/tmx-confsvr:$BUILD_NAME
In the previous command you tell the Docker command line tool to push to the Docker hub (which is the default hub that the Docker command line tools use) to the johncarnell account. The image being pushed will be the tmx-confsvr image with the tag name of the value from the $BUILD_NAME environment variable.
At this point, all of the code has been built and tagged and a Docker image has been created. You’re now ready to deploy your services to the Amazon ECS container you created back in section 10.1.3. The work to do this deployment is found in travis_scripts/deploy_to_amazon_ecs.sh. The following listing shows the code from this script.
echo "Launching $BUILD_NAME IN AMAZON ECS"
ecs-cli configure --region us-west-1 \
                  --access-key $AWS_ACCESS_KEY
                  --secret-key $AWS_SECRET_KEY
                  --cluster spmia-tmx-dev
ecs-cli compose --file docker/common/docker-compose.yml up
rm –rf ~/.ecs
In the Amazon console, Amazon only shows the name of the state/city/country the region is in and not the actual region name (us-west-1, us-east-1, and so on). For example, if you were to look in the Amazon console and wanted to see the Northern California region, there would be no indication that the region name is us-west-1. For a list of all the Amazon regions (and endpoints for each service), please refer to http://docs.aws.amazon.com/general/latest/gr/rande.html.
Because a new build virtual machine is kicked off by Travis with every build, you need to configure your build environment’s ecs-cli client with your AWS access and secret key. Once that’s complete, you can then kick off a deploy to your ECS cluster using the ecs-cli compose command and a docker-compose.yml file. Your docker-compose.yml is parameterized to use the build name (contained in the environment variable $BUILD_NAME).
You have one last step to your build process: kicking off a platform test. After every deployment to a new environment, you kick off a set of platform tests that check to make sure all your services are functioning properly. The goal of the platform tests is to call the microservices in the deployed build and ensure that the services are functioning properly.
I’ve separated the platform test job from the main build so that it can be invoked independently of the main build. To do this, I use the Travis CI REST API to programmatically invoke the platform tests. The travis_scripts/trigger_platform_tests.sh script does this work. The following listing shows the code from this script.
The first thing you do in listing 10.8 is use the Travis CI command-line tool to log in to Travis CI and get an OAuth2 token you can use to call other Travis REST APIs. You store this OAUTH2 token in the $RESULTS environment variable.
Next, you build the JSON body for the REST API call. Your downstream Travis CI job kicks off a series of Python scripts that tests your API. This downstream job expects two environment variables to be set. In the JSON body being built in listing 10.8, you’re passing in two environment variables, $BUILD_NAME and $CONTAINER_IP, that will be passed to your testing job:
\"env\": {
 \"global\": [\"BUILD_NAME=$BUILD_NAME\",
              \"CONTAINER_IP=$CONTAINER_IP\"]
}
The last action in your script is to invoke the Travis CI build job that runs your platform test scripts. This is done by using the curl command to call the Travis CI REST endpoint for your test job:
 curl -s -X POST \
  -H "Content-Type: application/json" \
  -H "Accept: application/json" \
  -H "Travis-API-Version: 3" \
  -H "Authorization: token $RESULTS" \
  -d "$body" \
  $TARGET_URL
The platform test scripts are stored in a separate GitHub repository called chapter10-platform-tests (https://github.com/carnellj/chapter10-platform-tests). This repository has three Python scripts that test the Spring Cloud Config server, the Eureka server, and the Zuul server. The Zuul server platform tests also test the licensing and organization services. These tests aren’t comprehensive in the sense that they exercise every aspect of the services, but they do exercise enough of the service to ensure they’re functioning.
We’re not going to walk through the platform tests. The tests are straightforward and a walk-through of the tests would not add a significant amount of value to this chapter.
As this chapter (and the book) closes out, I hope you’ve gained an appreciation for the amount of work that goes into building a build/deployment pipeline. A well-functioning build and deployment pipeline is critical to the deployment of services. The success of your microservice architecture depends on more than just the code involved in the service:
I had two goals when laying out the code examples in this book and choosing the runtime technologies needed to deploy the code. The first goal was make sure that the code examples were consumable and easy to set up. Remember, a microservices application has multiple moving parts, and setting up these parts to run cleanly with minimal effort for the reader can be difficult if there is not some forethought.
The second goal was for each chapter to be completely standalone so that you could pick any chapter in the book and have a complete runtime environment available that encapsulates all the services and software needed to run the code examples in the chapter without dependencies on other chapters.
To this end, you’ll see the following technology and patterns used throughout every chapter in this book:
All provisioning of the Docker images is done with simple shell scripts.
To build the software for all chapters, you’ll need to have the following software installed on your desktop. It’s important to note that these are the versions of software I worked with for the book. The software may work with other versions, but this is what I built the code with:
I’m not going to walk through how to install each of these components. Each of the software packages listed in the bulleted list has simple installation instructions and should be installable with minimal effort. Docker has a GUI client for installation.
All the source code for the book is in my GitHub repository (http://github.com/carnellj). Each chapter in the book has its own source code repository. Here’s a listing of all the GitHub repositories used in the book:
With GitHub, you can download the files as a zip file using the web UI. Every GitHub repository will have a download button on it. Figure A.1 shows where the download button is in the GitHub repository for chapter 1.
If you’re a command-line user, you can install the git client and clone the project. For example, if you wanted to download chapter 1 from GitHub using the git client, you could open a command line and issue the following command:
git clone https://github.com/carnellj/spmia-chapter1.git
This will download all the chapter 1 project files into a directory called spmia-chapter1 in the directory you ran the git command from.
Every chapter in the book has one or more services associated with it. Each service in a chapter has its own project directory. For instance, if you look at chapter 6 (http://github.com/carnellj/spmia-chapter6), you’ll see that there are seven services in it. These services are
Every service directory in a chapter is structured as a Maven-based build project. Inside each project is a src/main directory with the following sub-directories:
Because all chapters in the book follow the same structure and use Maven as their build tool, it becomes extremely simple to build the source code. Every chapter has at the root of the directory a pom.xml that acts as parent pom for all the sub-chapters. If you want to compile the source code and build the Docker images for all the projects within a single chapter, you need to run the following at the root of the chapter:
mvn clean package docker:build
This will execute the Maven pom.xml file in each of the service directories. It will also build the Docker images locally.
If you want to build a single service within the chapter, you can change to that specific service directory and run the mvn clean package docker:build command.
During the build process, all the services in the book are packaged as Docker images. This process is carried out by the Spotify Maven plugin. For an example of this plugin in action, you can look at the chapter 3 licensing service’s pom.xml file (chapter3/licensing-service). The following listing shows the XML fragment that configures this plugin in each service’s pom.xml file.
The XML fragment does three things:
The following listing shows the contents of the Dockerfile from your licensing service.
In the Dockerfile from this listing you’re provisioning your instance using Alpine Linux (https://alpinelinux.org/). Alpine Linux is a small Linux distribution that’s often used to build Docker images. The Alpine Linux image you’re using already has Java JDK installed on it.
When you’re provisioning your Docker image, you’re going to install a command-line utility called nc. The nc command is used to ping a server and see if a specific port is online. You’re going to use it in your run.sh command script to ensure that before you launch your service, all its dependent services (for example, the database and the Spring Cloud Config service) have started. The nc command does this by watching the ports the dependent services listen on. This installation of nc is done via the RUN apk update && apk upgrade && apk add netcat-openbsd, running the services using Docker Compose.
Next, your Dockerfile will make a directory for the licensing service’s executable jar file and then copy the jar file from the local file system to a directory that was created on the Docker image. This is all done via the ADD licensing-service-0.0.1-SNAPSHOT.jar/usr/local/licensingservice/.
The next step in the provisioning process is to install the run.sh script via the ADD command. The run.sh script is a custom script I wrote that launches the target service when the Docker image is started. It uses the nc command to listen for the ports of any key service dependencies that the licensing service needs and then blocks until those dependencies are started.
The following listing shows how the run.sh is used to launch the licensing service.
Once the run.sh command is copied to your licensing service Docker image, the CMD./run.sh Docker command is used to tell Docker to execute the run.sh launch script when the actual image starts.
I’m giving you a high-level overview of how Docker provisions an image. If you want to learn more about Docker in depth, I suggest looking at Jeff Nickoloff’s Docker in Action (Manning, 2016) or Adrian Mouat’s Using Docker (O’Reilly, 2016). Both books are excellent Docker resources.
After the Maven build has been executed, you can now launch all the services for the chapter by using Docker Compose. Docker Compose is installed as part of the Docker installation process. It’s a service orchestration tool that allows you to define services as a group and then launch together as a single unit. Docker Compose includes capabilities for also defining environment variables with each service.
Docker Compose uses a YAML file for defining the services that are going to be launched. Each chapter in this book has a file called “<<chapter>>/docker/common/docker-compose.yml”. This file contains the service definitions used to launch the services in the chapter. Let’s look at the docker-compose.yml file used in chapter 3. The following listing shows the contents of this file.
In the docker-compose.yml from listing A.4, we see three services being defined (configserver, database, and licensing service). Each service has a Docker image defined with it using the image tag. As each service starts, it will expose ports through the port tag and then pass environment variables to the starting Docker container via the environment tag.
Go ahead and start your Docker containers by executing the following command from the root of chapter directory pulled down from GitHub:
docker-compose –f docker/common/docker-compose.yml up
When this command is issued, docker-compose starts all the services defined in the docker-compose.yml file. Each service will print its standard out to the console. Figure A.2 shows the output from the docker-compose.yml file in chapter 3.
Every line written to standard out by a service started using Docker Compose will have the name of the service printed to standard out. When you’re launching a Docker Compose orchestration, finding errors being printed out can be painful. If you want to look at the output for a Docker-based service, start your docker-compose command in detached mode with the –d option (docker-compose -f docker/common/docker-compose.yml up –d). Then you can look at the specific logs for that container by issuing the docker-compose command with the logs option (docker-compose -f docker/common/docker-compose.yml logs -f licensingservice).
All the Docker containers used this in this book are ephemeral—they won’t retain their state when they’re started and stopped. Keep this in mind if you start playing with code and you see your data disappear after your restart your containers. If you want to make your Postgres database persistent between the starting and stopping of containers, I’d point you to the Postgres Docker notes (https://hub.docker.com/_/postgres/).
From reading chapter 7, you might be thinking that OAuth2 doesn’t look too complicated. After all, you have an authentication service that checks a user’s credentials and issues a token back to the user. The token can, in turn, be presented every time the user wants to call a service protected by the OAuth2 server.
Unfortunately, the real world is never simple. With the interconnected nature of the web and cloud-based applications, users have come to expect that they can securely share their data and integrate functionality between different applications owned by different services. This presents a unique challenge from a security perspective because you want to integrate across different applications while not forcing users to share their credentials with each application they want to integrate with.
Fortunately, OAuth2 is a flexible authorization framework that provides multiple mechanisms for applications to authenticate and authorize users without forcing them to share credentials. Unfortunately, it’s also one of the reasons why OAuth2 is considered complicated. These authentication mechanisms are called authentication grants. OAuth2 has four forms of authentication grants that client applications can use to authenticate users, receive an access token, and then validate that token. These grants are
In the following sections I walk through the activities that take place during the execution of each of these OAuth2 grant flows. I also talk about when to use one grant type over another.
An OAuth2 password grant is probably the most straightforward grant type to understand. This grant type is used when both the application and the services explicitly trust one another. For example, the EagleEye web application and the EagleEye web services (the licensing and organization) are both owned by ThoughtMechanix, so there’s a natural trust relationship that exists between them.
To be explicit, when I refer to a “natural trust relationship” I mean that the application and services are completely owned by the same organization. They’re managed under the same policies and procedures.
When a natural trust relationship exists, there’s little concern about exposing an OAuth2 access token to the calling application. For example, the EagleEye web application can use the OAuth2 password grant to capture the user’s credentials and directly authenticate against the EagleEye OAuth2 service. Figure B.1 shows the password grant in action between EagleEye and the downstream services.
In figure B.1 the following actions are taking place:
The client credentials grant is typically used when an application needs to access an OAuth2 protected resource, but no human being is involved in the transaction. With the client credentials grant type, the OAuth2 server only authenticates based on application name and the secret key provided by the owner of the resource. Again, the client credential task is usually used when both applications are owned by the same company. The difference between the password grant and the client credential grant is that a client credential grant authenticates by only using the registered application name and the secret key.
For example, let’s say that once an hour the EagleEye application has a data analytics job that runs. As part of its work, it makes calls out to EagleEye services. However, the EagleEye developers still want that application to authenticate and authorize itself before it can access the data in those services. This is where the client credential grant can be used. Figure B.2 shows this flow.
The authorization code grant is by far the most complicated of the OAuth2 grants, but it’s also the most common flow used because it allows different applications from different vendors to share data and services without having to expose a user’s credentials across multiple applications. It also enforces an extra layer of checking by not letting a calling application immediately get an OAuth2 access token, but rather a “pre-access” authorization code.
The easy way to understand the authorization grant is through an example. Let’s say you have an EagleEye user who also uses Salesforce.com. The EagleEye customer’s IT department has built a Salesforce application that needs data from an EagleEye service (the organization service). Let’s walk through figure B.3 and see how the authorization code grant flow works to allow Salesforce to access data from the EagleEye organization service, without the EagleEye customer ever having to expose their EagleEye credentials to Salesforce.
Wow! I need to come up for air. Application-to-application integration is convoluted. The key to note from this entire process is that even though the user is logged into Salesforce and they’re accessing EagleEye data, at no time were the user’s EagleEye credentials directly exposed to Salesforce. After the initial authorization code was generated and provided by the EagleEye OAuth2 service, the user never had to provide their credentials back to the EagleEye service.
The authorization grant is used when you’re running a web application through a traditional server-side web programming environment like Java or .NET. What happens if your client application is a pure JavaScript application or a mobile application that runs completely in a web browser and doesn’t rely on server-side calls to invoke third-party services?
This is where the last grant type, the implicit grant, comes into play. Figure B.4 shows the general flow of what occurs in the implicit grant.
With an implicit grant, you’re usually working with a pure JavaScript application running completely inside of the browser. In the other flows, the client is communicating with an application server that’s carrying out the user’s requests and the application server is interacting with any downstream services. With an implicit grant type, all the service interaction happens directly from the user’s client (usually a web browser). In figure B.4, the following activities are taking place:
Keep several things in mind regarding the OAuth2 implicit grant:
When an OAuth2 access token is issued, it has a limited amount of time that it’s valid and will eventually expire. When the token expires, the calling application (and user) will need to re-authenticate with the OAuth2 service. However, in most of the Oauth2 grant flows, the OAuth2 server will issue both an access token and a refresh token. A client can present the refresh token to the OAuth2 authentication service and the service will validate the refresh token and then issue a new OAuth2 access token. Let’s look at figure B.5 and walk through the refresh token flow:
[A][B][C][D][E][F][G][H][I][J][L][M][N][O][P][Q][R][S][T][U][V][W][X][Z]
abstract access
access tokens, OAuth2
access_token attribute, 2nd
accounts, creating in Papertrail
Amazon ECS (Elastic Container Service)
creating clusters
manually deploying Eagle Eye services to
starting services in
Amazon ElastiCache Service
Amazon RDS (Relational Database Service)
Amazon Web Services.
See AWS.
annotation, Spring Cloud
antMatcher() method
Apache Avro protocol
Apache Maven, 2nd, 3rd
Apache Thrift
APIs (application program interfaces)
Application class
applications
architecture
of build/deployment pipeline
of configuration management
of microservices
of service discovery
of Spring Cloud Stream
binder
channel
sink
source
attack surface, of microservices
auditing
authenticated users
overview
protecting service by
authentication service
modifying to issue JWT
setting up for EagleEye OAuth2
authenticationManagerBean() method
AuthenticationServerConfigurer class
authorization, 2nd
authorization code grants
authorizedGrantTypes() method
@Autowired annotation, 2nd
AWS (Amazon Web Services)
AWS_ACCESS_KEY variable
AWS_SECRET_KEY variable
@Bean tag
before_install attribute, 2nd
binders
Bitbucket
Bootstrap classes
setting up in Spring Cloud Config
writing
bootstrapping services, managing
branches.only attribute
brittleness, between services
$BUILD_NAME variable
build/deployment patterns, microservices
build/deployment pipeline
architecture of
implementing with GitHub
implementing with Travis CI
in action
buildFallbackLicenseList() method
bulkhead pattern
implementing
overview
CaaS (Container as a Service), 2nd
cache, clearing when message is received
cache.directories attribute
cacheOrganizationObject() method
caching lookups with Redis
configuring licensing service with Spring Data Redis dependencies
constructing database connection to Redis server
defining Spring Data Redis repositories
using Redis and licensing service to store and read organization data
call() method
Callable class
capturing messaging traces
CD (Continuous Delivery)
channels
custom, defining
overview
checkRedisCache() method, 2nd
choreography, of messages
CI (Continuous Integration)
circuit breaker pattern, implementing
customizing timeout
timing out call to organization microservices
circuitBreaker.errorThresholdPercentage property, 2nd
circuitBreaker.requestVolumeThreshold property, 2nd
circuitBreaker.sleepWindowInMilliseconds property, 2nd
classes
bootstrap
HystrixConcurrencyStrategy, define custom
Java callable
client applications, registering with OAuth2 service
client credential grants
client resiliency patterns
bulkhead
circuit breaker
client-side load balancing
fallback
microservices
overview
with Netflix Hystrix, 2nd
fallback processing
fine-tuning
implementing bulkhead pattern
implementing circuit breaker
setting up licensing servers to use
thread context and
with Spring Cloud
fallback processing
implementing bulkhead pattern
setting up licensing servers to use
client resiliency, why it matters
client-side load balancing, 2nd, 3rd, 4th
ClientDetailsServiceConfigurer class
ClientHttpRequestInterceptor
clientType parameter
cloud
defined
microservices and
running on desktop
building Docker images
building projects
compiling projects
downloading projects from GitHub
launching services with Docker Compose
required software
service discovery in
architecture of
using Netflix Eureka
using Spring
cloud caching
cloud-based applications
building
microservices
build/deployment patterns
building with Spring Boot
client resiliency patterns
core development patterns
logging and tracing patterns
overview
routing patterns
security patterns
Spring
microservices and
overview
Spring Boot, building microservices with
cloud-based microservices
Spring Cloud, building with
Netflix Hystrix libraries
Netflix Ribbon libraries
Netflix Zuul service gateway
provisioning implementations
Spring Boot
Spring Cloud Config
Spring Cloud Security
Spring Cloud service discovery
Spring Cloud Sleuth
Spring Cloud Stream
CloudFormation
clusters
in Amazon ECS
Redis
coarse-grained microservices
@Column attribute
commandPoolProperties attribute, 2nd
commandProperties attribute, 2nd, 3rd
commands, Netflix Hystrix
communication protocols
complexity, managing
configuration
building Spring Cloud configuration servers
setting up Spring Cloud Config bootstrap class
using Spring Cloud configuration server with filesystem
controlling with Spring Cloud configuration server
integrating Spring Cloud Config with Spring Boot client
managing complexity
managing configuration
licensing services to use Spring Cloud Config
licensing services with Spring Data Redis
management
architecture
implementing
microservices
Netflix Zuul
of core run-time, in Travis CI
of microservices, managing
of Netflix Hystrix
protecting sensitive information
configuring microservices to use encryption on client side
decrypting property
downloading Oracle JCE jars for encryption
encrypting property
installing Oracle JCE jars for encryption
setting up encryption keys
routes
dynamic reloading
in Netflix Zuul
service to point to OAuth2 authentication service
services, to point to Zipkin
Spring Cloud
syslog connector
Zipkin server
configuration servers
Spring Cloud
building
controlling configuration with
refreshing properties using
using with Git
wiring in data source using
@Configuration tag
configure() method, 2nd, 3rd, 4th, 5th
consistency
Consul, 2nd
Container as a Service.
See CaaS.
Continuous Delivery.
See CD.
Continuous Integration.
See CI.
Controller class
Cookie header parameter
core run-time configuration, in Travis CI
coreSize attribute
correlation IDs
adding to HTTP response with Netflix Zuul
building post-filter receiving
building pre-filter generating
Spring Cloud Sleuth and
using in service calls
custom RestTemplate to ensure correlation ID propogates forward
UserContext to make HTTP headers easily accessible
UserContextFilter to intercept incoming HTTP requests
UserContextInteceptor to ensure correlation ID propogates forward
coupling
loose
tight between services
credential management
CRM (customer relationship management), 2nd
cross-cutting concerns
CRUD (Create, Read, Update, Delete), 2nd
CrudRepository class
custom fields, parsing out of JWT
custom spans, adding
customizing timeout on circuit breaker
D parameters
data source, wiring in using Spring Cloud
data transformations
database, constructing connection to Redis server
debugging
decomposing business problems
/decrypt endpoint
decrypting property
@DefaultProperties annotation
DelegatingUserContextCallable
DelegatingUserContextCallable class
dependencies
server, settting up
Spring Cloud Sleuth
Spring Data Redis
deploying
EagleEye
microservices
architecture of build/deployment pipeline
build/deployment pipeline in action
enabling service to build in Travis CI
implementing build/deployment pipeline
with EagleEye
service assembly
desktops, running cloud on
building Docker images
building projects
compiling projects
downloading projects from GitHub
launching services with Docker Compose
required software
development patterns, microservices
DevOps (developer operations)
DevOps engineer, 2nd
discovery, of services, 2nd
architecture of
automated mapping of routes using
building Spring Eureka service
in cloud
locating services
manual mapping of routes using
registering services with Spring-based Eureka server
using Netflix Eureka
using Spring
using to look up service
DiscoveryClient, looking up service instances with
distributed caching
clearing cache when message is received
defining custom channels
using Redis to cache lookups
configuring licensing service with Spring Data Redis dependencies
constructing database connection to Redis server
defining Spring Data Redis repositories
using Redis and licensing service to store and read organization data
distributed systems, complexity of building
distributed tracing
with Spring Cloud Sleuth
correlation ID and
log aggregation and
with Zipkin, 2nd
adding custom spans
capturing messaging traces
configuring server
configuring services to point to
installing server
integrating Spring Cloud Sleuth dependencies
setting tracing levels
tracing transactions
visualizing complex transactions
DNS (Domain Name Service)
Docker
creating images, in Travis CI
images, building
output, redirecting to Papertrail
Docker Compose, launching services with
Docker Hub, pushing images to
Docker Maven plugin, 2nd
docker ps command
DOCKER_PASSWORD variable
DOCKER_USERNAME variable
docker-compose command
docker-compose.yml
docker.sock
downloading projects from GitHub
durability
dynamic reloading, route configuration
dynamic route filters, building
forwarding route
implementing run() method
skeleton of
dynamic routing
EagleEye
configuring users
creating an Amazon ECS clusters
creating PostgreSQL database using Amazon RDS
creating Redis cluster in Amazon ElastiCache Service
deploying
setting up OAuth2 authentication service
EBS (Elastic Block Storage)
ECS (Elastic Container Service)
ecs-cli command, 2nd
ecs-cli configure command
ecs-cli ps command
ecsInstanceRole
EDA (Event Driven Architecture)
ELB (Enterprise Load Balancer)
@EnableAuthorizationServer annotation
@EnableBinding annotation, 2nd
@EnableCircuitBreaker annotation, 2nd
@EnableDiscoveryClient annotation, 2nd
@EnableEurekaClient annotation
@EnableFeignClients annotation, 2nd
@EnableResourceServer annotation
@EnableZipkinServer annotation
@EnableZipkinStreamServer annotation
@EnableZuulProxy annotation
@EnableZuulServer annotation
/encrypt endpoint
ENCRYPT_KEY environment variable
encrypted variables
encrypting
configuring microservices to use on client side
downloading Oracle JCE jars
installing Oracle JCE jars
property
setting up keys
encryption keys, setting up
endpoints, protecting
authenticating users
configuring EagleEye users
registering client applications with OAuth2 service
setting up EagleEye OAuth2 authentication service
@Entity annotation
environment tag
environment variables
Etcd
Eureka, 2nd
eureka.client.fetchRegistry attribute, 2nd
eureka.client.registerWithEureka attribute, 2nd
eureka.instance.preferIpAddress property
eureka.serviceUrl.defaultZone attribute
event processing
event-driven architecture, with Spring Cloud Stream
architecture
distributed caching
downsides of messaging architecture
using messaging to communicate state changes between services
using synchronous request-response approach to communicate state change
writing message consumer
writing message producer
execution.isolation.thread.timeoutInMilliseconds property
expires_in attribute
extending JWT (JavasScript Web Tokens)
F5 load balancer
FaaS (Functions as a Service)
fallback pattern
fallback strategy, processing
fallbackMethod, 2nd
@FeignClient annotation
fields, parsing out of JWT
filesystem, using with Spring Cloud configuration servers
filterOrder() method
filters
building
generating correlation IDs
in Netflix Zuul
receiving correlation IDs
filterType() method, 2nd
FilterUtils class
fine-grained microservices
flexibility
forwardToSpecialRoute() method
geographic distribution
GET HTTP endpoint
getAbRoutingInfo() method
getCorrelationId() method
getInstances() method
getLicense() method, 2nd
getLicenses() method
getLicensesByOrg() method, 2nd, 3rd
getOrg() method
getOrganization() method, 2nd
getOrganizationId() function
getOrgDbCall
Git, using with Spring Cloud configuration servers
GitHub
downloading projects from
implementing build/deployment pipeline with
GITHUB_TOKEN variable, 2nd
Gradle
grants, in OAuth2
authorization code grants
client credential grants
implicit grants
password grants
Groovy
HAProxy
health, of microservices
helloRemoteServiceCall method
horizontal scalability, 2nd
HTTP headers
HTTP requests
HTTP response
HTTP status codes
HTTPs, using for service communication
HttpSecurity class
hystrix-javanica dependencies
@HystrixCommand annotation, 2nd, 3rd, 4th, 5th, 6th
HystrixConcurrencyStrategy
configure Spring Cloud to use
define custom classes
define Java callable classes to inject usercontext into Hystrix commands
HystrixRuntimeException
IaaS (Infrastructure as a Service), 2nd
@Id annotation
IETF (Internet Engineering Task Force)
ignored-services attribute
images
building in Docker
creating in Travis CI
pushing to Docker Hub
immutable servers, 2nd
implicit grants
inbound port access
inboundOrgChanges
individual services
infection-style protocol
infrastructure
init() method
@Input annotation
installing Zipkin server
integrating
Spring Cloud Config with Spring Boot client
configuring licensing service to use Spring Cloud Config
directly reading properties using @Value annotation
refreshing properties using Spring Cloud configuration server
setting up licensing service Spring Cloud Config server dependencies
using Spring Cloud configuration server with Git
wiring in data source using Spring Cloud configuration server
Spring Cloud Sleuth dependencies with Zipkin
integration tests
intercepting incoming HTTP requests
interface design
invoking services
with Netflix Feign client
with Ribbon-aware Spring RestTemplate
J2EE stack
Java
building microservices with
skeleton projects
Spring Boot controller
writing Bootstrap class
define callable class to inject usercontext into Hystrix commands
java.lang.ThreadLocal
JCE (Java Cryptography Extension)
JedisConnectionFactory
JPA (Java Persistence Annotations)
JSON (JavaScript Object Notation), 2nd
JWT (JavasScript Web Tokens)
consuming in microservices
extending
modifying authentication service to issue
OAuth2 and
parsing custom field out of
jwtAccessTokenConverter() method
JWTOAuth2Config class, 2nd
JWTTokenStoreConfig class, 2nd, 3rd
License class, 2nd
license.withComment() method
LicenseRepository class
LicenseService class
LicenseService.getLicensesByOrder() method
LicenseServiceController class
licensestatic endpoint
licensing services
configuring to use Spring Cloud Config
configuring with Spring Data Redis
server dependencies
setting up to use Netflix Hystrix
setting up to use Spring Cloud
using with Redis to store and read organization data
writing message consumer in
licensing, adding Spring Cloud Sleuth to
licensingGroup
LinkedBlockingQueue
locating services
locking unneeded network ports
log aggregation, Spring Cloud Sleuth and
adding correlation ID to HTTP response with Netflix Zuul
configuring syslog connector
creating Papertrail account
implementing Papertrail
implementing Spring Cloud Sleuth
redirecting Docker output to Papertrail
searching for Spring Cloud Sleuth trace IDs in Papertrail
log correlation
loggerSink() method
logging
logging and tracing patterns, microservices
logging driver, Docker
lookups, caching with Redis
configuring licensing service with Spring Data Redis dependencies
constructing database connection to Redis server
defining Spring Data Redis repositories
using Redis and licensing service to store and read organization data
loose coupling
main() method, 2nd
mapping routes
automated using service discovery
manual using service discovery
manual using static URLs
Maven BOM (Bill of Materials)
maxQueueSize attribute
maxQueueSize property, 2nd
MDA (Message Driven Architecture)
Mercurial
message handling, semantics of
message services
MessageChannel class
messages
choreography of
clearing cache when received
visibility of
writing consumer
in licensing service
message services in action
writing producer
in organization service
message services in action
messaging architecture, disadvantages of
messaging traces, capturing
messaging, communicating state changes between services with
durability
flexibility
loose coupling
scalability
metric collection
metrics.rollingStats.numBuckets property
metrics.rollingStats.timeInMilliseconds property
metricsRollingStats.numBuckets property
metricsRollingStats.timeInMilliseconds property
microservices
accessing with services gateway
build/deployment patterns
building in Travis CI
building with Spring Boot
client resiliency patterns
cloud and
communicating health of
configuring to use encryption on client side
consuming JWT in
core development patterns
deploying
architecture of build/deployment pipeline
build/deployment pipeline in action
enabling service to build in Travis CI
implementing build/deployment pipeline
with EagleEye
Java, building with
skeleton projects
Spring Boot controller
writing Bootstrap class
limiting attack surface by locking down unneeded network ports
logging and tracing patterns
managing configuration of
overview
protecting single endpoint
routing patterns
securing
JWT and OAuth2
organization service using OAuth2
with OAuth2
security patterns
Spring Boot, building with, 2nd
designing microservice architecture
for runtime
skeleton projects
Spring Boot controller
writing Bootstrap class
timing out call to
when not to use
complexity of building distributed systems
consistency
data transformations
server sprawl
types of applications
mvn spring-boot:run command
NAS (Network Area Storage)
nc command
Netflix Eureka
building service using Spring Boot
configuring Netflix Zuul to communicate with
registering services with Spring-based server
service discovery using
Netflix Feign
Netflix Hystrix
and Spring Cloud
client resiliency patterns with
fallback processing
fine-tuning
implementing bulkhead pattern
implementing circuit breaker
setting up licensing servers to use
thread context and
commands
configuration of
thread context and
HystrixConcurrencyStrategy
ThreadLocal
Netflix Ribbon, 2nd
Netflix Zuul
adding correlation ID to HTTP response with
building pre-filter generating correlation IDs
configuring routes in
automated mapping routes via service discovery
dynamically reload route configuration
manual mapping of routes using static URLs
mapping routes manually using service discovery
service timeouts and
configuring to communicate with Netflix Eureka
filters
service routing with, 2nd
building dynamic route filter
building post-filter receiving correlation IDs
services gateways
setting up Spring Boot project
using Spring Cloud annotation for services
network ports, locking to limit microservices attack surface
notifications attribute
OAuth2
adding jars to individual services
grant types
authorization code
client credential
implicit
password
JWT and
consuming JWT in microservices
extending JWT
modifying authentication service to issue JWT
parsing custom field out of JWT
propagating access tokens
protecting organization service with
adding OAuth2 jars to individual services
adding Spring Security to individual services
configuring service to point to OAuth2 authentication service
defining what can access services
defining who can access services
propagating OAuth2 access tokens
protecting single endpoint with
authenticating users
configuring EagleEye users
registering client applications with OAuth2 service
setting up EagleEye authentication service
refreshing tokens
registering client applications with service
securing microservices with
setting up EagleEye authentication service
OAuth2Config class, 2nd, 3rd
ODS (operational data store)
Oracle JCE (Java Cryptography Extension)
downloading jars for encryption
installing jars for encryption
organization data
organization ID
organization services
inflexible in adding new consumers to changes in
protecting
writing message producer in
OrganizationChangeHandler class
OrganizationChangeModel class
organizationId parameter
OrganizationRedisRepository interface
OrganizationRedisRepositoryImpl
organizationservice
orgChangeTopic, 2nd
outbound port access
output, redirecting to Papertrail
output() method
PaaS (Platform as a Service), 2nd
packaging service assembly
Papertrail
creating account
implementing
redirecting Docker output to
searching for Spring Cloud Sleuth trace IDs in
parsing custom fields out of JWT
password grants
@PathVariable annotation, 2nd
patterns
bulkhead, 2nd
circuit breaker, 2nd, 3rd
client resiliency
bulkhead
circuit breaker
client-side load balancing
fallback
overview
with Netflix Hystrix, 2nd
with Spring Cloud, 2nd, 3rd
client-side load balancing
fallback
PCI (Payment Card Industry), 2nd
peer-to-peer model
PEP (policy enforcement point), 2nd
Phoenix servers, 2nd
physical server
pipelines, build/deployment
architecture of
implementing with GitHub
implementing with Travis CI
in action
Platform as a Service.
See PaaS.
platform tests, 2nd
PLATFORM_TEST_NAME variable
port tag
post-filter, building to receive correlation IDs
Postgres database, 2nd, 3rd, 4th, 5th
PostgreSQL database, creating with Amazon RDS
POSTMAN
pre-build tools, in Travis CI
pre-filter, for generating correlation IDs
preferIpAddress attribute
private APIs, zoning services into
propagating OAuth2 access tokens
propagation
properties
decrypting
directly reading using @Value annotation
encrypting
refreshing using Spring Cloud configuration servers
propogating correlation IDs
with RestTemplate
withUserContextInteceptor
protected resource
protecting
endpoints
authenticating users
configuring EagleEye users
registering client applications with OAuth2 service
setting up EagleEye OAuth2 authentication service
services
by authenticated users
via specific role
protecting organization service, with OAuth2
provisioning
public APIs, zoning services into
publishOrgChange() method
queueSizeRejectionThreshold attribute
RabbitMQ
reading properties using @Value annotation
readLicensingDataFromRedis
redirecting Docker output to Papertrail
Redis
constructing database connection to server
creating clusters in Amazon ElastiCache Service
to cache lookups
configuring licensing service with Spring Data Redis dependencies
constructing database connection to Redis server
defining Spring Data Redis repositories
using Redis and licensing service to store and read organization data
using with licensing service to store and read organization data
RedisTemplate
/refresh endpoint
refresh_token attribute, 2nd
refreshing
properties using Spring Cloud configuration servers
tokens
@RefreshScope annotation
registering
client applications, 2nd
services, with Spring-based Eureka server
registration, of services
reloading route configuration
repositories, Spring Data Redis
@RequestMapping annotation, 2nd
resource owner
ResponseBody class
ResponseFilter
REST endpoint
REST philosophy
REST-oriented (Representational State Transfer)
@RestController annotation
RestTemplate
Ribbon-aware
to ensure correlation ID propagates forward
restTemplate.exchange() method
$RESULTS variable
retrieveOrgInfo() method
Ribbon project
route filters, building dynamic
forwarding route
implementing run() method
skeleton of
routes
configuring in Netflix Zuul
automated mapping routes via service discovery
dynamically reload route configuration
manual mapping of routes using static URLs
mapping routes manually using service discovery
service timeouts and
forwarding
mapping
automated using service discovery
manual using service discovery
manual using static URLs
routing patterns, microservices
run-time configuration, CI
run() method, 2nd
runtime, building microservices for
communicating microservice health
service assembly
service bootstrapping
service discovery
service registration
SaaS (Software as a Service)
Sampler class
scalability
Scope attribute
scopes() method
searching for Spring Cloud Sleuth trace IDs
searchLocations attribute
secret() method
Secure Sockets Layer.
See SSL.
securing microservices, 2nd
accessing microservices with services gateway
JWT and OAuth2
limiting attack surface of microservices
protecting organization service using OAuth2
protecting single endpoint with OAuth2
protecting single endpoint with Spring
using HTTPs for service communication
using SSL for service communication
with OAuth2
zoning services into public API and private API
security patterns, microservices
security.oauth2.resource.userInfoUri property
semantics, of message handling
SEMAPHORE-based isolation
send() method
sensitive information, protecting
configuring microservices to use encryption on client side
decrypting property
downloading Oracle JCE jars for encryption
encrypting property
installing Oracle JCE jars for encryption
setting up encryption keys
server
dependencies
Zipkin
configuring
installing
server sprawl
server.port attribute
service assembly
deploying
packaging
service bootstrapping, managing configuration of microservices
service calls, using correlation IDs in
custom RestTemplate to ensure correlation ID propogates forward
UserContext to make HTTP headers easily accessible
UserContextFilter to intercept incoming HTTP requests
UserContextInteceptor to ensure correlation ID propogates forward
service discovery
architecture of
automated mapping of routes using
building Spring Eureka service
in cloud
architecture of
using Netflix Eureka
using Spring
locating services
manual mapping of routes using
registering services with Spring-based Eureka server
using Netflix Eureka
using Spring
using to look up service
invoking services with Netflix Feign client
invoking services with Ribbon-aware Spring RestTemplate
looking up service instances with Spring DiscoveryClient
service granularity, 2nd
service interfaces
service monitoring
service registration
service routing
with Netflix Zuul, 2nd
building dynamic route filter
building post-filter receiving correlation IDs
building pre-filter generating correlation IDs
configuring routes
configuring to communicate with Netflix Eureka
filters
services gateways
setting up Spring Boot project
using Spring Cloud annotation for services
with Spring Cloud, 2nd
building dynamic route filter
building post-filter receiving correlation IDs
services gateways
using annotation for Netflix Zuul services
service startups
service timeouts, 2nd
ServiceInstance class
servicename.ribbon.ReadTimeout property
services
brittleness between
communicating state changes between with messaging
durability
flexibility
loose coupling
scalability
configuring to point to Zipkin
defining what has access to
protecting service by authenticated users
protecting service via specific role
defining who has access to, 2nd
protecting service by authenticated users
protecting service via specific role
invoking
with Netflix Feign client
with Ribbon-aware Spring RestTemplate
launching with Docker Compose
locating
looking up using service discovery
invoking services with Netflix Feign client
invoking services with Ribbon-aware Spring RestTemplate
looking up service instances with Spring DiscoveryClient
protecting
by authenticated users
via specific role
registering with Spring-based Eureka server
starting in Amazon ECS
tight coupling between
zoning into public API and private API
services gateways
accessing microservices with
overview
setContext() method
setCorrelationId() method
shouldFilter() method, 2nd
Simple Queueing Service.
See SQS.
SimpleHostRoutingFilter class
Single Sign On.
See SSO.
sinks
skeleton projects
SOAP (Simple Object Access Protocol)
Software as a Service.
See SaaS.
software engineer
Source class
source control code, tagging in Travis CI
sources
span ID
spans, custom
SpecialRoutes
SpecialRoutesFilter, 2nd, 3rd
SPIA (Single Page Internet Applications)
Spring
microservices and
overview
protecting single endpoint with
authenticating users
configuring EagleEye users
registering client applications with OAuth2 service
setting up EagleEye OAuth2 authentication service
registering services with Netflix Eureka server
service discovery using
Spring Actuator module
Spring Boot
building microservices with, 2nd, 3rd
designing architecture
for runtime
skeleton projects
Spring Boot controller
writing Bootstrap class
building Netflix Eureka service with
client
controller
setting up Netflix Zuul project
when not to use microservices
complexity of building distributed systems
consistency
data transformations
server sprawl
types of applications
Spring Cloud
and Netflix Hystrix
building microservices with
Netflix Hystrix libraries
Netflix Ribbon libraries
Netflix Zuul service gateway
provisioning implementations
Spring Boot
Spring Cloud Config
Spring Cloud Security
Spring Cloud service discovery
Spring Cloud Sleuth
Spring Cloud Stream
client resiliency patterns with
fallback processing
implementing bulkhead pattern
setting up licensing servers to use
configuration servers
building
controlling configuration with
refreshing properties using
using with filesystem
using with Git
wiring in data source using
configuring to use custom HystrixConcurrencyStrategy
service discovery
service routing with, 2nd
building dynamic route filter
building post-filter receiving correlation IDs
services gateways
using annotation for Netflix Zuul services
Spring Cloud Config
configuring licensing service to use
integrating with Spring Boot client
directly reading properties using @Value annotation
refreshing properties using Spring Cloud configuration server
using Spring Cloud configuration server with Git
wiring in data source using Spring Cloud configuration server
setting up bootstrap classes
setting up licensing service server dependencies
Spring Cloud Security
Spring Cloud Sleuth
adding to licensing
adding to organization
anatomy of trace
correlation ID and
dependencies
distributed tracing with
implementing
log aggregation and
adding correlation ID to HTTP response with Zuul
configuring syslog connector
creating Papertrail account
implementing Papertrail
implementing Spring Cloud Sleuth
redirecting Docker output to Papertrail
trace IDs
Spring Cloud Stream
architecture of
binder
channel
sink
source
event-driven architecture with
distributed caching
downsides of messaging architecture
using messaging to communicate state changes between services
using synchronous request-response approach to communicate state change
writing message consumer
writing message producer
Spring Data Redis
defining repositories
dependencies
Spring Security, adding to individual services
spring-cloud-security dependency
spring-cloud-sleuth-zipkin dependency
spring-cloud-starter-eureka library
spring-cloud-starter-sleuth dependency
spring-security-jwt dependency
spring-security-oauth2 dependency
spring.application.name property, 2nd
spring.cloud.config.uri property
spring.cloud.stream.bindings property
spring.cloud.stream.bindings.input.group property
spring.datasource.password
spring.profiles.active property
spring.stream.bindings.kafka property
spring.stream.bindings.output property
spring.zipkin.baseUrl property
@SpringBootApplication annotation
SQS (Simple Queueing Service)
SSL (Secure Sockets Layer), 2nd
SSO (Single Sign On)
state changes
communicating between services with messaging
durability
flexibility
loose coupling
scalability
communicating with synchronous request-response approach
brittleness between services
inflexible in adding new consumers to changes in the organization service
tight coupling between services
static routing
static URLs, manual mapping of routes using
@StreamListener annotation, 2nd
SubscribableChannel class
Subversion
sudo attribute
synchronous request-response approach
brittleness between services
inflexible in adding new consumers to changes in the organization service
tight coupling between services
SynchronousQueue
syslog, configuring connector
@Table annotation
tag_name value
tagging source control code
technology-neutral protocol
ThoughtMechanix
thread context, Netflix Hystrix and
HystrixConcurrencyStrategy
ThreadLocal
THREAD isolation
ThreadLocal, Netflix Hystrix and
ThreadLocalAwareStrategy.java
ThreadLocalConfiguration
threadPoolKey property
threadPoolProperties attribute, 2nd
Thrift
timeout, customizing on circuit breaker
tmx-correlation-id header, 2nd
token_type attribute
tokens, refreshing
tokenServices() method
tools, installation in Travis CI
trace ID
traceability
Tracer class, 2nd
tracing
setting levels
transactions with Zipkin
TrackingFilter class, 2nd, 3rd
transactions
complex, visualizing
tracing with Zipkin
Travis CI
enabling service to build in
building microservices
core build run-time configuration
creating Docker images
executing build
invoking platform tests
pre-build tool installations
pushing images to Docker Hub
starting services in Amazon ECS
tagging source control code
implementing build/deployment pipeline with
travis.yml file
Twelve-Factor Application manifesto
UDDI (Universal Description, Discovery, and Integration) repository
unit tests
URLs (Uniform Resource Locator)
UserContext, 2nd
usercontext
UserContext.AUTH_TOKEN
UserContextFilter, 2nd
UserContextFilter class
UserContextHolder class
UserContextInteceptor
UserContextInterceptor class, 2nd, 3rd
userDetailsServiceBean() method
users
authenticated, protecting service by
authenticating
of EagleEye, configuring
useSpecialRoute() method
utils package
@Value annotation
versioning scheme
virtual containers
virtual machine images
visibility, of messages
visualizing complex transactions
VPC (Virtual Private Cloud)
WebSecurityConfigurerAdapter
WebSecurityConfigurerAdapter class
WebSphere
wiring data source
withClient() method
wrapCallable() method
writing Bootstrap classes
XML (Extensible Markup Language)
Zipkin
configuring services to point to
distributed tracing with, 2nd
adding custom spans
capturing messaging traces
configuring server
configuring services to point to
installing server
integrating Spring Cloud Sleuth dependencies
setting tracing levels
tracing transactions
visualizing complex transactions
server
configuring
installing
tracing transactions with
ZooKeeper
ZuulFilter class, 2nd
ZuulRequestHeaders
zuulservice
Chapter 1. Welcome to the cloud, Spring
Figure 1.9. Service discovery and routing are key parts of any large-scale microservice application.
Chapter 2. Building microservices with Spring Boot
Figure 2.1. Interview the EagleEye users, and understand how they do their day-to-day work.
Figure 2.2. A simplified EagleEye data model
Figure 2.4. The licensing service starting successfully
Figure 2.5. Your licensing service being called with POSTMAN
Figure 2.6. When a microservice starts up, it goes through multiple steps in its lifecycle.
Figure 2.9. A service discovery agent abstracts away the physical location of a service.
Figure 2.10. The service discovery agent uses the exposes health URL to check microservice health.
Chapter 3. Controlling your configuration with Spring Cloud configuration server
Figure 3.1. The application configuration data is read during the service bootstrapping phase.
Figure 3.2. Configuration management conceptual architecture
Figure 3.4. Retrieving default configuration information for the licensing service
Figure 3.5. Retrieving configuration information for the licensing service using the dev profile
Figure 3.6. Retrieving configuration information using the dev profile
Figure 3.8. Using the /encrypt endpoint you can encrypt values.
Chapter 4. On service discovery
Figure 4.1. A traditional service location resolution model using DNS and a load balancer
Figure 4.6. Calling the Eureka REST API with the results being JSON
Chapter 5. When bad things happen: client resiliency patterns with Spring Cloud and Netflix Hystrix
Figure 5.5. A HystrixRuntimeException is thrown when a remote call takes too long.
Figure 5.6. Your service invocation using a Hystrix fallback
Figure 5.7. Default Hystrix thread pool shared across multiple resource types
Figure 5.8. Hystrix command tied to segregated thread pools
Figure 5.10. Adding a correlation ID to the licensing service call’s HTTP header
Chapter 6. Service routing with Spring Cloud and Zuul
Figure 6.4. Each service that’s mapped in Eureka will now be mapped as a Zuul route.
Figure 6.5. The results of the Zuul /routes call with a manual mapping of the organization service
Figure 6.6. Only one organization service is now defined in Zuul.
Figure 6.7. Using a prefix, Zuul will map a /api prefix to every service it manages.
Figure 6.8. Your routes in Zuul now have an /api prefix.
Figure 6.9. You’ve now mapped a static route to your licensing service.
Figure 6.10. You now see that the /api/licensestatic now maps to a service ID called licensestatic
Figure 6.15. The flow of a call to the organization service through the SpecialRoutesFilter
Chapter 7. Securing your microservices
Figure 7.1. OAuth2 allows a user to authenticate without constantly having to present credentials.
Figure 7.2. Setting up basic authentication using the application key and secret
Figure 7.4. Payload returned after a successful client credential validation
Figure 7.5. Looking up user information based on the issued OAuth2 token
Figure 7.6. Trying to call the organization service will result in a failed call.
Figure 7.7. Passing in the OAuth2 access token on the call to the organization service
Figure 7.8. The OAuth2 token has to be carried throughout the entire call chain.
Figure 7.9. The access and refresh tokens from your authentication call are now JWT tokens.
Figure 7.10. Using http://jswebtoken.io allows you to decode the contents.
Figure 7.11. An example of extending the JWT token with a organizationId
Figure 7.12. The Zuul server parses out the organization ID from the JWT token as it passes through.
Figure 7.13. A microservice security architecture is more than implementing OAuth2.
Chapter 8. Event-driven architecture with Spring Cloud Stream
Figure 8.4. When organization service data changes it will publish a message to Kafka.
Figure 8.5. When a message comes into the Kafka orgChangeTopic, the licensing service will respond.
Figure 8.7. Updating the contact phone number using the organization service
Chapter 9. Distributed tracing with Spring Cloud Sleuth and Zipkin
Figure 9.5. To begin, create an account on Papertrail.
Figure 9.6. Next choose how you’re going to send log data to Papertrail.
Figure 9.7. Papertrail uses Syslog as one of the mechanisms for sending data to it.
Figure 9.9. The trace ID allows you to filter all log entries related to that single transaction.
Figure 9.17. You’re looking for the licensing service invocation where a Kafka message is received.
Figure 9.18. Using Zipkin you can see the Kafka message being published by the organization service.
Figure 9.19. With the custom spans defined, they’ll now show up in the transaction trace.
Chapter 10. Deploying your microservices
Figure 10.2. Selecting whether the database is going to be a production database or a test database
Figure 10.3. Setting up the basic database configuration
Figure 10.4. Setting up the security group, port, and backup options for the RDS database
Figure 10.5. Your created Amazon RDS/PostgreSQL database
Figure 10.8. ECS offers a wizard to bootstrap a new service container. You’re not going to use it.
Figure 10.9. Starting the process of creating an ECS cluster
Figure 10.10. In the “Create Cluster” screen size the EC2 instances used to host the Docker cluster.
Figure 10.12. Configuring the Container IAM role
Figure 10.13. The ECS cluster up and running
Figure 10.14. Checking the status of the deployed services
Figure 10.16. Technologies used in the EagleEye build
Figure 10.18. Encrypted Travis environment variables are placed directly in the .travis.yml file.
Appendix A. Running a cloud on your desktop
Figure A.1. The GitHub UI allows you to download a project as a zip file.
Figure A.2. All output from the started Docker containers is written to standard out.
Appendix B. OAuth2 grant types
Chapter 3. Controlling your configuration with Spring Cloud configuration server
Table 3.1. Open source projects for implementing a configuration management system
Chapter 5. When bad things happen: client resiliency patterns with Spring Cloud and Netflix Hystrix
Table 5.1. Configuration Values for @HystrixCommand Annotations
Chapter 9. Distributed tracing with Spring Cloud Sleuth and Zipkin
Table 9.1. Options for Log Aggregation Solutions for Use with Spring Boot
Chapter 1. Welcome to the cloud, Spring
Listing 1.1. Hello World with Spring Boot: a simple Spring microservice
Chapter 2. Building microservices with Spring Boot
Listing 2.1. Maven pom file for the licensing service
Listing 2.2. Introducing the @SpringBootApplication annotation
Listing 2.3. Marking the LicenseServiceController as a Spring RestController
Chapter 3. Controlling your configuration with Spring Cloud configuration server
Listing 3.1. Setting up the pom.xml for the Spring Cloud configuration server
Listing 3.2. The bootstrap class for your Spring Cloud Config server
Listing 3.3. Spring Cloud configuration’s application.yml file
Listing 3.4. Additional Maven dependencies needed by the licensing service
Listing 3.5. Configuring the licensing services bootstrap.yml
Listing 3.6. The JPA model code for a single license record
Listing 3.7. LicenseRepository interface defines the query methods
Listing 3.8. LicenseService class used to execute database commands
Listing 3.9. ServiceConfig used to centralize application properties
Chapter 4. On service discovery
Listing 4.1. Adding dependencies to your pom.xml
Listing 4.2. Setting up your Eureka configuration in the application.yml file
Listing 4.3. Annotating the bootstrap class to enable the Eureka server
Listing 4.4. Modifying your organization service’s application.yml to talk to Eureka
Listing 4.5. Calling the licensing service with different REST Clients
Listing 4.6. getLicense() function will use multiple methods to perform a REST call
Listing 4.7. Setting up the bootstrap class to use the Eureka Discovery Client
Listing 4.8. Using the DiscoveryClient to look up information
Listing 4.9. Annotating and defining a RestTemplate construction method
Listing 4.10. Using a Ribbon-backed RestTemplate to call a service
Listing 4.11. Enabling the Spring Cloud/Netflix Feign client in the licensing service
Listing 4.12. Defining a Feign interface for calling the organization service
Chapter 5. When bad things happen: client resiliency patterns with Spring Cloud and Netflix Hystrix
Listing 5.1. The @EnableCircuitBreaker annotation used to activate Hystrix in a service
Listing 5.2. Wrappering a remote resource call with a circuit breaker
Listing 5.3. Randomly timing out a call to the licensing service database
Listing 5.4. Customizing the time out on a circuit breaker call
Listing 5.5. Implementing a fallback in Hystrix
Listing 5.6. Creating a bulkhead around the getLicensesByOrg() method
Listing 5.7. Configuring the behavior of a circuit breaker
Listing 5.8. The UserContextFilter parsing the HTTP header and retrieving data
Listing 5.9. All UserContext data is managed by UserContextHolder
Listing 5.10. Defining your own Hystrix concurrency strategy
Listing 5.11. Propagating the UserContext with DelegatingUserContextCallable.java
Listing 5.12. Hooking custom HystrixConcurrencyStrategy class into Spring Cloud
Chapter 6. Service routing with Spring Cloud and Zuul
Listing 6.1. Setting up the Zuul Server bootstrap class
Listing 6.2. Configuring the Zuul server to talk to Eureka
Listing 6.3. Setting up custom routes with a prefix
Listing 6.4. Mapping the licensing service to a static route
Listing 6.5. Mapping licensing service statically to multiple routes
Listing 6.6. Zuul pre-filter for generating correlation IDs
Listing 6.7. Retrieving the tmx-correlation-id from the HTTP headers
Listing 6.8. Mapping the correlation ID to the UserContext class
Listing 6.9. Storing the HTTP header values inside the UserContext class
Listing 6.10. The UserContextHolder stores the UserContext in a ThreadLocal
Listing 6.11. All outgoing microservice calls have the correlation ID injected into them
Listing 6.12. Adding the UserContextInterceptor to the RestTemplate class
Listing 6.13. Injecting the correlation ID into the HTTP response
Listing 6.14. The skeleton of your route filter
Listing 6.15. The run() method for the SpecialRoutesFilter is where the work begins
Listing 6.16. Invoking the SpecialRouteservice to see if a routing record exists
Listing 6.17. Determining whether to use the alternative service route
Listing 6.18. The forwardToSpecialRoute invokes the alternative service
Chapter 7. Securing your microservices
Listing 7.1. The authentication-service bootstrap class
Listing 7.2. OAuth2Config service defines what applications can use your service
Listing 7.3. Defining the User ID, password and roles for your application
Listing 7.4. Configuring the bootstrap class to be a protected resource
Listing 7.5. Restricting access to only authenticated users
Listing 7.6. Restricting deletes to the ADMIN role only
Listing 7.7. Using the OAuth2RestTemplate to propagate the OAuth2 access token
Listing 7.8. Setting up the JWT token store
Listing 7.9. Hooking JWT into your authentication service via the JWTOAuth2Config class
Listing 7.10. Creating a custom RestTemplate class to inject the JWT token
Listing 7.11. The UserContextInterceptor will inject the JWT token into your REST calls
Listing 7.12. Using a JWT token enhancer class to add a custom field
Listing 7.13. Hooking in your TokenEnhancer
Listing 7.14. Parsing the organizationId out of your JWT Token
Chapter 8. Event-driven architecture with Spring Cloud Stream
Listing 8.1. The annotated Application.java class
Listing 8.2. Publishing a message to the message broker
Listing 8.3. The Spring Cloud Stream configuration for publishing a message
Listing 8.4. Publishing a message in your organization service
Listing 8.5. Consuming a message using Spring Cloud Stream
Listing 8.6. Mapping the licensing service to a message topic in Kafka
Listing 8.7. Adding the Spring Redis Dependencies
Listing 8.8. Establishing how your licensing service will communicate with Redis
Listing 8.9. OrganizationRedisRepository defines methods used to call Redis
Listing 8.10. The OrganizationRedisRepositoryImpl implementation
Listing 8.11. OrganizationRestTemplateClient class will implement cache logic
Listing 8.12. Defining a custom input channel for the licensing service
Listing 8.13. Modifying the licensing service to use your custom input channel
Listing 8.14. Using the new custom channel in the OrganizationChangeHandler
Listing 8.15. Processing an organization change in the licensing service
Chapter 9. Distributed tracing with Spring Cloud Sleuth and Zipkin
Listing 9.1. Adding Spring Cloud Sleuth to Zuul
Listing 9.2. Adding the Spring Cloud Sleuth trace ID via a Zuul POST filter
Listing 9.3. Client-side Spring Cloud Sleuth and Zipkin dependences
Listing 9.4. JAR dependencies needed for Zipkin service
Listing 9.5. Building your Zipkin servers bootstrap class
Listing 9.6. Instrumenting the call to read licensing data from Redis
Chapter 10. Deploying your microservices
Listing 10.1. Anatomy of the .travis.yml build
Listing 10.2. Configuring the core run-time for your build
Listing 10.3. Pre-build installation steps
Listing 10.4. Executing the build
Listing 10.5. Tagging the chapter 10 code repository with the GitHub release API
Listing 10.6. Pushing created Docker images to Docker Hub
Listing 10.7. Deploying Docker Images to EC2
Listing 10.8. Kicking off the platform tests using Travis CI REST API
Appendix A. Running a cloud on your desktop
Listing A.1. Spotify Docker Maven plugin used to create Dockerimage
Listing A.2. Dockerfile prepares Docker image
Listing A.3. run.sh script used to launch the licensing service
Listing A.4. The docker-compose.yml file defines the services that are to be launched