The debugger is a very powerful instrument at your disposal. It allows executing programs step by step and monitoring their state, including register values and memory contents. In this book we are using the debugger called gdb. This appendix is an introduction aimed to ease your first steps with it.
Debugging is a process of finding bugs and studying program behavior. In order to do that, we usually perform single steps observing a part of the program’s state that is of interest to us. We can also run the program until a certain condition is met or a position in code is reached. Such position in the code is called breakpoint.
Let us study a sample program shown in Listing 18-1. We have already seen it in Chapter 2. This code prints the rax register contents into stdout.
Listing 18-1. print_rax_2.asm
section .datacodes:db '0123456789ABCDEF'section .textglobal _start_start:mov rax, 0x1122334455667788mov rdi, 1mov rdx, 1mov rcx, 64.loop:push raxsub rcx, 4sar rax, cland rax, 0xflea rsi, [codes + rax]mov rax, 1push rcxsyscallpop rcxpop raxtest rcx, rcxjnz .loopmov rax, 60 ; invoke 'close' system callxor rdi, rdisyscall
We are going to compile an executable file print_ rax from it and launch gdb.
> nasm -o print_rax.o -f elf64 print_rax.asm> ld -o print_rax print_rax.o> gdb print_rax...(gdb)
gdb has its own command system and the interaction with it happens through these commands. So whenever gdb is launched and you see its command prompt (gdb), you can type commands and it will interact accordingly.
You can load an executable file by issuing file command and then typing the filename, or by passing it as an argument.
(gdb) file print_raxReading symbols from print_rax...(no debugging symbols found)...done.
The <tab> key functions in the gdb command prompt perform autocompletion hints. Many commands also have shorthands.
The two most important commands are
quit to quit gdb.
help cmd to show help for the command cmd.
The ˜/.gdbinit file stores commands that will be automatically executed when gdb starts. Such a file can be created in the current directory as well, but for security reasons this feature is disabled by default.
Note
To enable loading the .gdbinit file from any directory, add the following line to the ˜/.gdbinit file in your home directory:
set auto-load safe-path /By default, gdb uses AT&T assembly syntax . In our book we stick to Intel syntax; to change gdb’s default preferences regarding assembly syntax, add the following line to ˜/.gdbinit file:
set disassembly-flavor intelOther useful commands include the following:
run starts program execution.
break x creates a breakpoint near the label x. When performing run or continue we will stop at the first breakpoint hit, allowing us to examine the program state.
break *address to place a breakpoint at a specified address.
continue to continue running program
stepi or si to step by one instruction;
ni or nexti will execute one instruction as well, but will not enter functions if the instruction was call. Instead it will let the called function terminate and break at the next instruction.
Let us do the following actions:
(gdb) break _startBreakpoint 1 at 0x4000b0(gdb) startFunction "main" not defined.Make breakpoint pending on future shared library load? (y or [n]) nStarting program: /home/stud/test/print_raxBreakpoint 1, 0x00000000004000b0 in _start ()
We stopped at the breakpoint that we have placed at the _start label. Let us switch into pseudo graphical mode using commands:
layout asmlayout regs
The result is shown in Figure 18-1. The layout is composed of three windows:
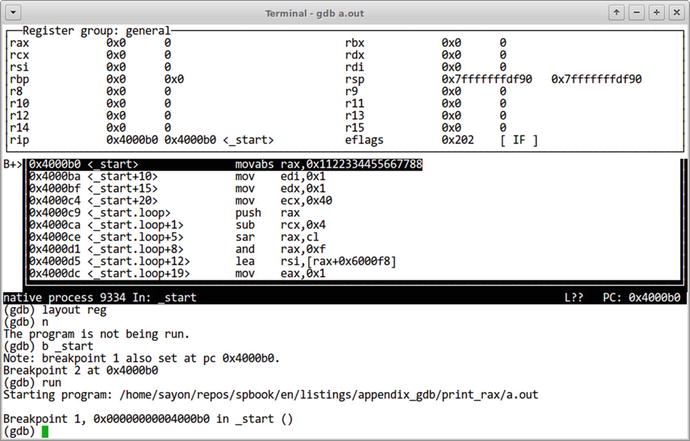
Figure 18-1. gdb user interface : asm + regs layout
The top part shows registers and their current values.
The middle part shows the disassembly code.
The bottom part is an interactive prompt.
One of these windows is focused at the time. Ctrl-X and Ctrl-O let you switch between them.
Arrow keys can be used to scroll up and down the current window.
print /FMT <val> allows to look up register contents or memory values. Register names are prefixed with dollar signs, for example: $rax.
x /FMT <address> is another very useful command to check memory contents. Unlike print, it expects an indirection level, so, it accepts a pointer.
FMT (used by print and x commands) is an encoded format description. It allows us to explicitly choose the data type to interpret the memory contents correctly.
FMT consists of a format letter and a size letter. The most useful format letters are
x (hexadecimal)
a (address)
i (instruction, tries to perform disassembly)
c (char)
s (null-terminated string)
The most useful size letters are b (byte) and g (giant, 8 bytes).
To take an address of a variable, use the & symbol. The examples will show when it is handy.
Following are some examples based on the program shown in Listing 18-1:
Displaying rax contents:
(gdb) print $rax$1 = 1234605616436508552Displaying codes’s first character:
(gdb) print /c codes$2 = '0'Disassembling an instruction at address _start:
(gdb) x /i &_start0x4000b0 <_start>: movabs rax,0x1122334455667788Disassembling current instruction:
(gdb) x /i $rip=> 0x4000e9 <_start.loop+32>: jne 0x4000c9 <_start.loop>Checking the contents of codes. The /FMT part of x command can start with the elements count. In our case, /12cb stands for “12 characters one byte each.”
(gdb) x /12cb &codes0x6000f8 <codes>: 48 '0' 49 '1' 50 '2' 51 '3' 52 '4' 53 '5' 54 '6'55 '7'0x600100: 56 '8' 57 '9' 65 'A' 66 'B'Examine the top 8 bytes of the stack:
(gdb) x /x $rsp0x7fffffffdf90: 0x01Examine the second qword stored in the stack:
(gdb) x/x $rsp+80x7fffffffdf98: 0xc1
Question 424
Study the output of help x command.
To use gdb with C programs productively, remember to always use the -ggdb compiler option . It generates additional information that gdb can use, such as .line section or symbols for local variables.
An appropriate layout to work with C code is src; type layout src to switch to it. Figure 18-2 depicts this layout.
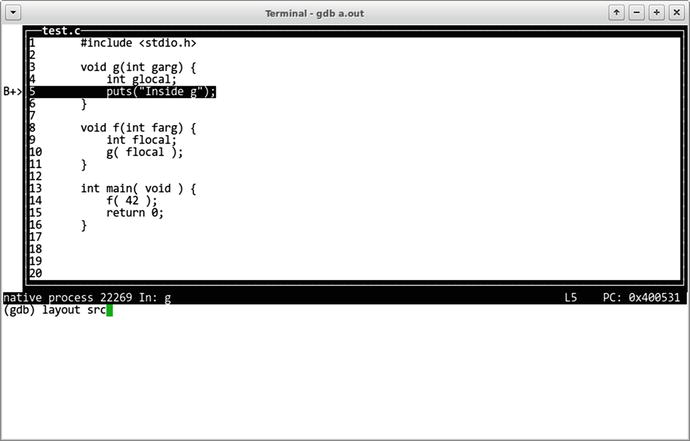
Figure 18-2. gdb user interface: src layout
Another useful option consists of studying and navigating a call stack. Each time any function is called, it uses a part of a stack to store its local variables. To demonstrate navigation we are going to use a simple program shown in Listing 18-2.
Listing 18-2. call_stack.c
#include <stdio.h>void g(int garg) {int glocal = 99;puts("Inside g");}void f(int farg) {int flocal = 44;g( flocal );}int main( void ) {f( 42 );return 0;}
We are going to compile the program and launch gdb on it as follows:
> gcc -ggdb call_stack.c -o call_stack> gdb call_stack
Then we place a breakpoint at the function g and run the program as follows:
(gdb) break gBreakpoint 1 at 0x400531: file call_stack.c, line 5.(gdb) runStarting program: .../call_stackBreakpoint 1, g (garg=0) at call_stack.c:55 puts("Inside g");
We are free to issue layout src if we wish.
The program will run and stop at line 4 where the function g starts. We can explore local variables or arguments using the print command. gdb will deduce the correct types for us most of the time.
(gdb) print garg$1 = 44
We want to see which functions are currently launched. The backtrace command is the way to do it.
(gdb) backtrace#0 g (garg=44) at call_stack.c:4#1 0x0000000000400561 in f (farg=42) at call_stack.c:10#2 0x0000000000400572 in main () at call_stack.c:14
There are three stack frames that gdb is aware of, and we can switch between them using the frame <idx> command.
Our state right now is depicted in Figure 18-3. We are sure that the function f has launched function g as the backtrace says, so that instance of f should have a local variable flocal. We want to know its value. If we try to print it right away, gdb complains that such variable does not exist. However, if we select the appropriate stack frame using the frame 1 command first, we will gain access to all its local variables. Figure 18-4 depicts this change.
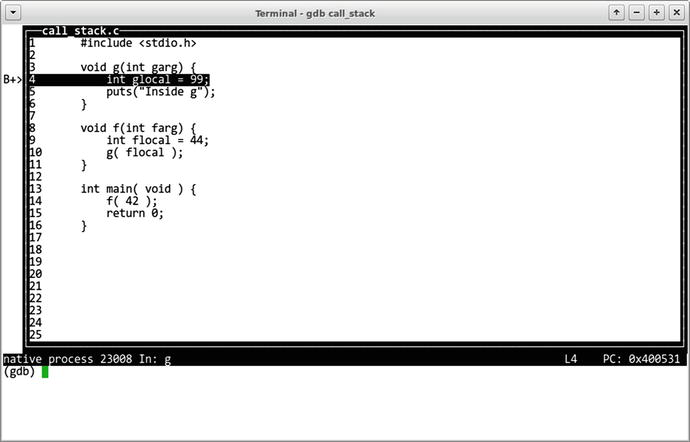
Figure 18-3. Inside function g
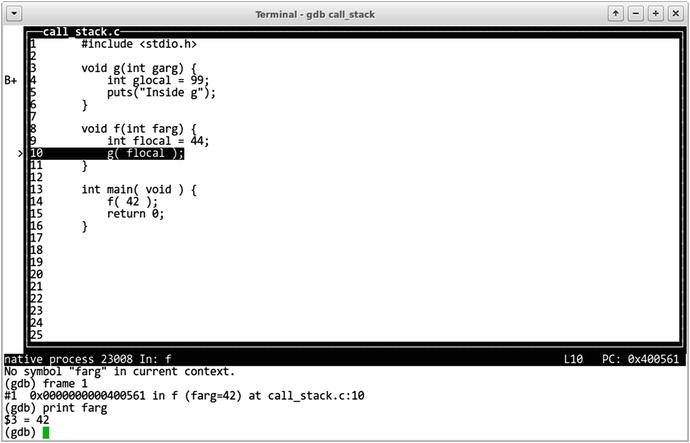
Figure 18-4. Inside function f
(gdb) print fargNo symbol "farg" in current context.
(gdb) frame 1#1 0x0000000000400561 in f (farg=42) at call_stack.c:10(gdb) print farg$3 = 42
Question 425
What does info locals do?
Other than that, gdb supports evaluating expressions with common arithmetic operations, launching functions, writing automation scripts in Python and much more.
For further reading, consult [1].