Table of Contents for
Reversing: Secrets of Reverse Engineering
 Reversing: Secrets of Reverse Engineering
Published by
John Wiley & Sons, 2005
Reversing: Secrets of Reverse Engineering
Published by
John Wiley & Sons, 2005
- Copyright
- Credits
- Foreword
- Acknowledgments
- Introduction
- I. Reversing 101
- 1. Foundations
- 2. Low-Level Software
- 3. Windows Fundamentals
- 4. Reversing Tools
- II. Applied Reversing
- 5. Beyond the Documentation
- 6. Deciphering File Formats
- 7. Auditing Program Binaries
- 8. Reversing Malware
- III. Cracking
- 9. Piracy and Copy Protection
- 10. Antireversing Techniques
- 11. Breaking Protections
- IV. Beyond Disassembly
- 12. Reversing .NET
- 13. Decompilation
- A. Deciphering Code Structures
- B. Understanding Compiled Arithmetic
- C. Deciphering Program Data
- D. Citations
Reversing is impossible without the right tools. There are hundreds of different software tools available out there that can be used for reversing, some freeware and others costing thousands of dollars. Understanding the differences between these tools and choosing the right ones is critical.
There are no all-in-one reversing tools available (at least not at the time of writing). This means that you need to create your own little toolkit that will include every type of tool that you might possibly need. This chapter describes the different types of tools that are available and makes recommendations for the best products in each category. Some of these products are provided free-of-charge by their developers, while others are quite expensive.
We will be looking at a variety of different types of tools, starting with basic reversing tools such as disassemblers and low-level debuggers, and proceeding to decompilers and a variety of system-monitoring tools. Finally, we will discuss some executable patching and dumping tools that can often be helpful in the reversing process
It is up to you to decide whether your reversing projects justify spending several hundreds of U.S. dollars on software. Generally, I'd say that it's possible to start reversing without spending a dime on software, but some of these commercial products will certainly make your life easier.
There are many different approaches for reversing and choosing the right one depends on the target program, the platform on which it runs and on which it was developed, and what kind of information you're looking to extract. Generally speaking, there are two fundamental reversing methodologies: offline analysis and live analysis.
Offline analysis of code means that you take a binary executable and use a disassembler or a decompiler to convert it into a human-readable form. Reversing is then performed by manually reading and analyzing parts of that output. Offline code analysis is a powerful approach because it provides a good outline of the program and makes it easy to search for specific functions that are of interest.
The downside of offline code analysis is usually that a better understanding of the code is required (compared to live analysis) because you can't see the data that the program deals with and how it flows. You must guess what type of data the code deals with and how it flows based on the code. Offline analysis is typically a more advanced approach to reversing.
There are some cases (particularly cracking-related) where offline code analysis is not possible. This typically happens when programs are "packed," so that the code is encrypted or compressed and is only unpacked in runtime. In such cases only live code analysis is possible.
Live Analysis involves the same conversion of code into a human-readable form, but here you don't just statically read the converted code but instead run it in a debugger and observe its behavior on a live system. This provides far more information because you can observe the program's internal data and how it affects the flow of the code. You can see what individual variables contain and what happens when the program reads or modifies that data. Generally, I'd say that live analysis is the better approach for beginners because it provides a lot more data to work with. For tools that can be used for live code analysis, please refer to the section on debuggers, later in this chapter.
The disassembler is one of the most important reversing tools. Basically, a disassembler decodes binary machine code (which is just a stream of numbers) into a readable assembly language text. This process is somewhat similar to what takes place within a CPU while a program is running. The difference is that instead of actually performing the tasks specified by the code (as is done by a processor), the disassembler merely decodes each instruction and creates a textual representation for it.
Needless to say, the specific instruction encoding format and the resulting textual representation are entirely platform-specific. Each platform supports a different instruction set and has a different set of registers. Therefore a disassembler is also platform-specific (though there are disassemblers that contain specific support for more than one platform).
Figure 4.1 demonstrates how a disassembler converts a sequence of IA-32 opcode bytes into human-readable assembly language. The process typically starts with the disassembler looking up the opcode in a translation table that contains the textual name of each instructions (in this case the opcode is 8B and the instruction is MOV) along with their formats. IA-32 instructions are like functions, meaning that each instruction takes a different set of "parameters" (usually called operands). The disassembler then proceeds to analyze exactly which operands are used in this particular instruction.
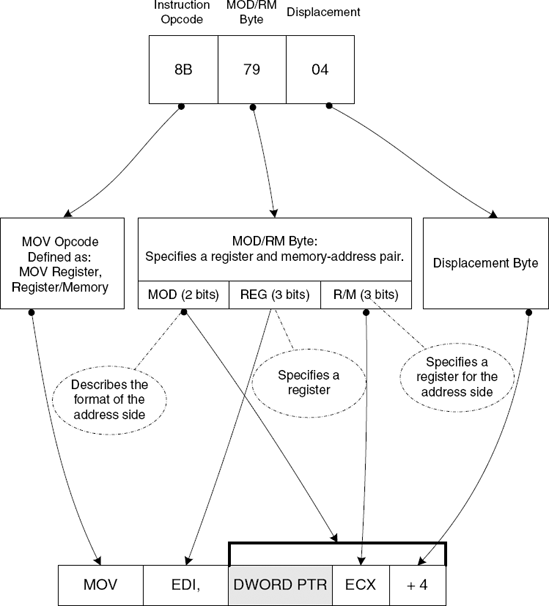
Figure 4.1. Translating an IA-32 instruction from machine code into human-readable assembly language.
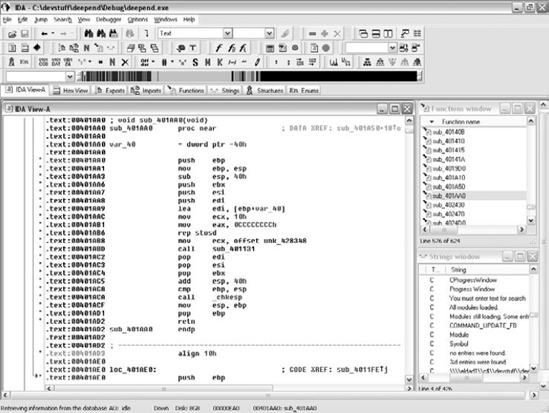
IDA (Interactive Disassembler) by DataRescue (www.datarescue.com) is an extremely powerful disassembler that supports a variety of processor architectures, including IA-32, IA-64 (Itanium), AMD64, and many others. IDA also supports a variety of executable file formats, such as PE (Portable Executable, used in Windows), ELF (Executable and Linking Format, used in Linux), and even XBE, which is used on Microsoft's Xbox. IDA is not cheap at $399 for the Standard edition (the Advanced edition is currently $795 and includes support for a larger number of processor architectures), but it's definitely worth it if you're going to be doing a significant amount of reversing on large programs. At the time of writing, DataRescue was offering a free time-limited trial version of IDA. If you're serious about reversing, I'd highly recommend that you give IDA a try—it is one of the best tools available. Figure 4.2 shows a typical IDA Pro screen.
Feature wise, here's the ground rule: Any feature you can think of that is possible to implement is probably already implemented in IDA. IDA is a remarkably flexible product, providing highly detailed disassembly, along with a plethora of side features that assist you with your reversing tasks.
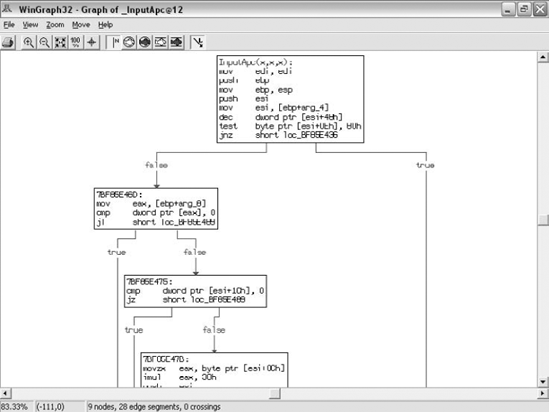
IDA is capable of producing powerful flowcharts for a given function. These are essentially logical graphs that show chunks of disassembled code and provide a visual representation of how each conditional jump in the code affects the function's flow. Each box represents a code snippet or a stage in the function's flow. The boxes are connected by arrows that show the flow of the code based on whether the conditional jump is satisfied or not. Figure 4.3 shows an IDA-generated function flowchart.
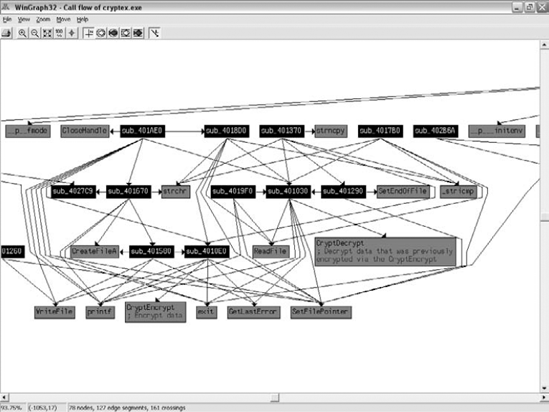
IDA can produce interfunction charts that show you which functions call into a certain API or internal function. Figure 4.4 shows a call graph that visually illustrates the flow of code within a part of the loaded program (the complete graph was just too large to fit into the page). The graph shows internal subroutines and illustrates the links between every one of those subroutines. The arrows coming out of each subroutine represents function calls made from that subroutine. Arrows that point to a subroutine show you who in the program calls that subroutine. The graph also illustrates the use of external APIs in the same manner—some of the boxes are lighter colored and have API names on them, and you can use the connecting arrows to determine who in the program is calling those APIs. You even get a brief textual description of some of the APIs!
IDA also has a variety of little features that make it very convenient to use, such as the highlighting of all instances of the currently selected operand. For example, if you click the word EAX in an instruction, all references to EAX in the current page of disassembled code will be highlighted. This makes it much easier to read disassembled listings and gain an understanding of how data flows within the code.
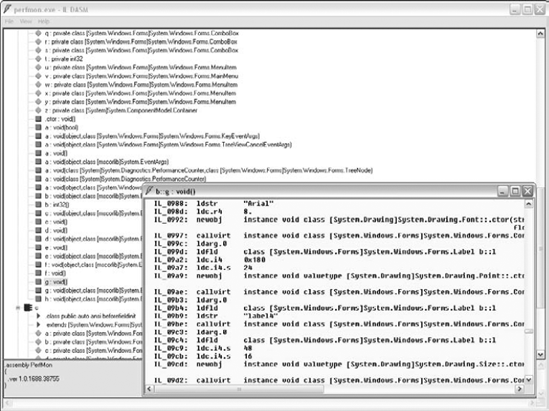
ILDasm is a disassembler for the Microsoft Intermediate Language (MSIL), which is the low-level assembly language–like language used in .NET programs. It is listed here because this book also discusses .NET reversing, and ILDasm is a fundamental tool for .NET reversing.
Figure 4.5 shows a common ILDasm view. On the left is ILDasm's view of the current program's classes and their internal members. On the right is a disassembled listing for one of the functions. Of course the assembly language is different from the IA-32 assembly language that's been described so far—it is MSIL. This language will be described in detail in Chapter 12. One thing to notice is the rather cryptic function and class names shown by ILDasm. That's because the program being disassembled has been obfuscated by PreEmptive Solutions' DotFuscator.
Debuggers exist primarily to assist software developers with locating and correcting errors in their programs, but they can also be used as powerful reversing tools. Most native code debuggers have some kind of support for stepping through assembly language code when no source code is available. Debuggers that support this mode of operation make excellent reversing tools, and there are several debuggers that were designed from the ground up with assembly language–level debugging in mind.
The idea is that the debugger provides a disassembled view of the currently running function and allows the user to step through the disassembled code and see what the program does at every line. While the code is being stepped through, the debugger usually shows the state of the CPU's registers and a memory dump, usually showing the currently active stack area. The following are the key debugger features that are required for reversers.
Powerful Disassembler A powerful disassembler is a mandatory feature in a good reversing debugger, for obvious reasons. Being able to view the code clearly, with cross-references that reveal which branch goes where and where a certain instruction is called from, is critical. It's also important to be able to manually control the data/code recognition heuristics, in case they incorrectly identify code as data or vice versa (for code/data ambiguities in disassemblers refer to the section on disassemblers in this chapter).
Software and Hardware Breakpoints Breakpoints are a basic debugging feature, and no debugger can exist without them, but it's important to be able to install both software and hardware breakpoints. Software breakpoints are instructions added into the program's code by the debugger at runtime. These instructions make the processor pause program execution and transfer control to the debugger when they are reached during execution. Hardware breakpoints are a special CPU feature that allow the processor to pause execution when a certain memory address is accessed, and transfer control to the debugger. This is an especially powerful feature for reversers because it can greatly simplify the process of mapping and deciphering data structures in a program. All a reverser must do is locate a data structure of interest and place hardware breakpoints on specific areas of interest in that data structure. The hardware breakpoints can be used to expose the relevant code areas in the program that are responsible for manipulating the data structure in question.
View of Registers and Memory A good reversing debugger must provide a good visualization of the important CPU registers and of system memory. It is also helpful to have a constantly updated view of the stack that includes both the debugger's interpretation of what's in it and a raw view of its contents.
Process Information It is very helpful to have detailed process information while debugging. There is an endless list of features that could fall into this category, but the most basic ones are a list of the currently loaded executable modules and the currently running threads, along with a stack dump and register dump for each thread.
Debuggers that contain powerful disassemblers are not common, but the ones that do are usually the best reversing tools you'll find because they provide the best of both worlds. You get both a highly readable and detailed representation of the code, and you can conveniently step through it and see what the code does at every step, what kind of data it receives as input, and what kind of data it produces as output.
In modern operating systems debuggers can be roughly divided into two very different flavors: user-mode debuggers and kernel-mode debuggers. User-mode debuggers are the more conventional debuggers that are typically used by software developers. As the name implies, user-mode debuggers run as normal applications, in user mode, and they can only be used for debugging regular user-mode applications. Kernel-mode debuggers are far more powerful. They allow unlimited control of the target system and provide a full view of everything happening on the system, regardless of whether it is happening inside application code or inside operating system code.
The following sections describe the pros and cons of user-mode and kernel-mode debuggers and provide an overview on the most popular tools in each category.
If you've ever used a debugger, it was most likely a user-mode debugger. User-mode debuggers are conventional applications that attach to another process (the debugee) and can take full control of it. User-mode debuggers have the advantage of being very easy to set up and use, because they are just another program that's running on the system (unlike kernel-mode debuggers).
The downside is that user-mode debuggers can only view a single process and can only view user mode code within that process. Being limited to a single process means that you have to know exactly which process you'd like to reverse. This may sound trivial, but sometimes it isn't. For example, sometimes you'll run into programs that have several processes that are somehow interconnected. In such cases, you may not know which process actually runs the code you're interested in.
Being restricted to viewing user-mode code is not usually a problem unless the product you're debugging has its own kernel-mode components (such as device drivers). When a program is implemented purely in user mode there's usually no real need to step into operating system code that runs in the kernel.
Beyond these limitations, some user-mode debuggers are also unable to debug a program before execution reaches the main executable's entry point (this is typically the .exe file's WinMain callback). This can be a problem in some cases because the system runs a significant amount of user-mode code before that, including calls to the DllMain callback of each DLL that is statically linked to the executable.
The following sections present some user-mode debuggers that are well suited for reversing.
For reversers, OllyDbg, written by Oleh Yuschuk, is probably the best user-mode debugger out there (though the selection is admittedly quite small). The beauty of Olly is that it appears to have been designed from the ground up as a reversing tool, and as such it has a very powerful built-in disassembler. I've seen quite a few beginners attempting their first steps in reversing with complex tools such as Numega SoftICE. The fact is that unless you're going to be reversing kernel-mode code, or observing the system globally across multiple processes, there's usually no need for kernel-mode debugging—OllyDbg is more than enough.
OllyDbg's greatest strength is in its disassembler, which provides powerful code-analysis features. OllyDbg's code analyzer can identify loops, switch blocks, and other key code structures. It shows parameter names for all known functions and APIs, and supports searching for cross-references between code and data—in all possible directions. In fact, it would be fair to say that Olly has the best disassembly capabilities of all debuggers I have worked with (except for the IDA Pro debugger), including the big guns that run in kernel mode.
Besides powerful disassembly features, OllyDbg supports a wide variety of views, including listing imports and exports in modules, showing the list of windows and other objects that are owned by the debugee, showing the current chain of exception handlers, using import libraries (.lib files) for properly naming functions that originated in such libraries, and others.
OllyDbg also includes a built-in assembling and patching engine, which makes it a cracker's favorite. It is possible to type in assembly language code over any area in a program and then commit the changes back into the executable if you so require. Alternatively, OllyDbg can also store the list of patches performed on a specific program and apply some or all of those patches while the program is being debugged—when they are required.
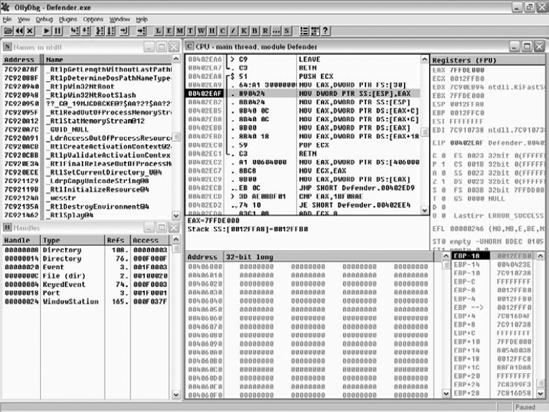
Figure 4.6 shows a typical OllyDbg screen. Notice the list of NTDLL names on the left—OllyDbg not only shows imports and exports but also internal names (if symbols are available). The bottom-left view shows a list of currently open handles in the process.
OllyDbg is an excellent reversing tool, especially considering that it is free software—it doesn't cost a dime. For the latest version of OllyDbg go to http://home.t-online.de/home/Ollydbg.
WinDbg is a free debugger provided by Microsoft as part of the Debugging Tools for Windows package (available free of charge at www.microsoft.com/whdc/devtools/debugging/default.mspx). While some of its features can be controlled from the GUI, WinDbg uses a somewhat inconvenient command-line interface as its primary user interface. WinDbg's disassembler is quite limited, and has some annoying anomalies (such as the inability to scroll backward in the disassembly window).
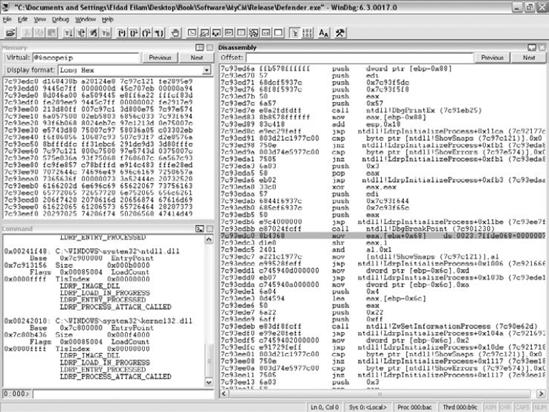
Unsurprisingly, one place where WinDbg is unbeatable and far surpasses OllyDbg is in its integration with the operating system. WinDbg has powerful extensions that can provide a wealth of information on a variety of internal system data structures. This includes dumping currently active user-mode heaps, security tokens, the PEB (Process Environment Block) and the TEB (Thread Environment Block), the current state of the system loader (the component responsible for loading and initializing program executables), and so on. Beyond the extensions, WinDbg also supports stepping through the earliest phases of process initialization, even before statically linked DLLs are initialized. This is different from OllyDbg, where debugging starts at the primary executable's WinMain (this is the .exe file launched by the user), after all statically linked DLLs are initialized. Figure 4.7 shows a screenshot from WinDbg. Notice how the code being debugged is a part of the NTDLL loader code that initializes DLLs while the process is coming up—not every user-mode debugger can do that.
WinDbg has been improved dramatically in the past couple of years, and new releases that include new features and bug fixes have been appearing regularly. Still, for reversing applications that aren't heavily integrated with the operating systems, OllyDbg has significant advantages. Olly has a far better user interface, has a better disassembler, and provides powerful code analysis capabilities that really make reversing a lot easier. Costwise they are both provided free of charge, so that's not a factor, but unless you are specifically interested in debugging DLL initialization code, or are in need of the special debugger extension features that WinDbg offers, I'd recommend that you stick with OllyDbg.
Besides it being a powerful disassembler, IDA Pro is also a capable user-mode debugger, which successfully combines IDA's powerful disassembler with solid debugging capabilities. I personally wouldn't purchase IDA just for its debugging capabilities, but having a debugger and a highly capable disassembler in one program definitely makes IDA the Swiss Army Knife of the reverse engineering community.
PEBrowse Professional Interactive is an enhanced version of the PEBrowse Professional PE Dumping software (discussed in the "Executable Dumping Tools" section later in this chapter) that also includes a decent debugger. PEBrowse offers multiple informative views on the process such as a detailed view of the currently active memory heaps and the allocated blocks within them.
Beyond its native code disassembly and debugging capabilities, PEBrowse is also a decent intermediate language (IL) debugger and disassembler for .NET programs. PEBrowse Professional Interactive is available for download free of charge at www.smidgeonsoft.com.
Kernel-mode debugging is what you use when you need to get a view of the system as a whole and not on a specific process. Unlike a user-mode debugger, a kernel-mode debugger is not a program that runs on top of the operating system, but is a component that sits alongside the system's kernel and allows for stopping and observing the entire system at any given moment. Kernel-mode debuggers typically also allow user-mode debugging, but this can sometimes be a bit problematic because the debugger must be aware of the changing memory address space between the running processes.
Kernel-mode debuggers are usually aimed at kernel-level developers such as device driver developers and developers of various operating system extensions, but they can be useful for other purposes as well. For reversers, kernel-mode debuggers are often incredibly helpful because they provide a full view of the system and of all running processes. In fact, many reversers use kernel debuggers exclusively, regardless of whether they are reversing kernel-mode or user-mode code. Of course, a kernel-mode debugger is mandatory when it is kernel-mode code that is being reversed.
One powerful application of kernel-mode debuggers is the ability to place low-level breakpoints. When you're trying to determine where in a program a certain operation is performed, a common approach is to set a breakpoint on an operating system API that would typically be called in order to perform that operation. For instance, when a program moves a window and you'd like to locate the program code responsible for moving it, you could place a breakpoint on the system API that moves windows. The problem is that there are quite a few APIs that could be used for moving windows, and you might not even know exactly which process is responsible for moving the window. Kernel debuggers offer an excellent solution: set a breakpoint on the low-level code in the operating system that is responsible for moving windows around. Whichever API is used by the program to move the window, it is bound to end up in that low-level operating system code.
Unfortunately, kernel-mode debuggers are often difficult to set up and usually require a dedicated system, because they destabilize the operating system to which they are attached. Also, because kernel debuggers suspend the entire system and not just a single process, the system is always frozen while they are open, and no threads are running. Because of these limitations I would recommend that you not install a kernel-mode debugger unless you've specifically confirmed that none of the available user-mode debuggers fit your needs. For typical user-mode reversing scenarios, a kernel-mode debugger is really an overkill.
WinDbg is primarily a kernel-mode debugger. The way this works is that the same program used for user-mode debugging also has a kernel-debugging mode. Unlike the user-mode debugging functionality, WinDbg's kernel-mode debugging is performed remotely, on a separate system from the one running the WinDbg GUI. The target system is booted with the /DEBUG switch (set in the boot.ini configuration file) which enables a special debugging code inside the Windows kernel. The debugee and the controlling system that runs WinDbg are connected using either a serial null-modem cable, or a high-speed FireWire (IEEE 1394) connection.
The same kernel-mode debugging facilities that WinDbg offers are also accessible through KD, a console mode program that connects to the debugee in the exact same way. KD provides identical functionality to WinDbg, minus the GUI.
Functionally, WinDbg is quite flexible. It has good support for retrieving symbolic information from symbol files (including retrieving symbols from a centralized symbol server on demand), and as in the user-mode debugger, the debugger extensions make it quite powerful. The user interface is very limited, and for the most part it is still essentially a command-line tool (because so many features are only accessible using the command line), but for most applications it is reasonably convenient to use.
WinDbg is quite limited when it comes to user-mode debugging—placing user-mode breakpoints almost always causes problems. The severity of this problem depends on which version of the operating system is being debugged. Older operating systems such as Windows NT 4.0 were much worse than newer ones such as Windows Server 2003 in this regard.
One disadvantage of using a null-modem cable for debugging is performance. The maximum supported speed is 115,200 bits per second, which is really not that fast, so when significant amounts of information must be transferred between the host and the target, it can create noticeable delays. The solution is to either use a FireWire cable (only supported on Windows XP and later), or to run the debugee on a virtual machine (discussed below in the "Kernel Debugging on Virtual Machines" section).
As I've already mentioned with regards to the user-mode debugging features of WinDbg, it is provided by Microsoft free of charge, and can be downloaded at www.microsoft.com/whdc/devtools/debugging/default.mspx.
Figure 4.8 shows what WinDbg looks like when it is used for kernel-mode debugging. Notice that the disassembly window on the right is disassembling kernel-mode code from the nt module (this is NTOSKRNL.EXE, the Windows kernel).
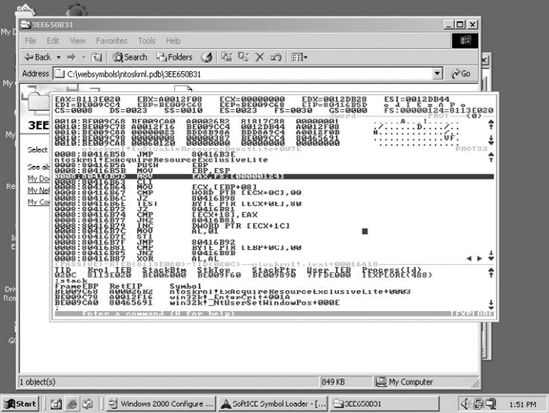
All things being equal, SoftICE is probably the most popular reversing debugger out there. Originally, SoftICE was developed as a device-driver development tool for Windows, but it is used by quite a few reversers. The unique quality of SoftICE that really sets it apart from WinDbg is that it allows for local kernel-debugging. You can theoretically have just one system and still perform kernel-debugging, but I wouldn't recommend it.
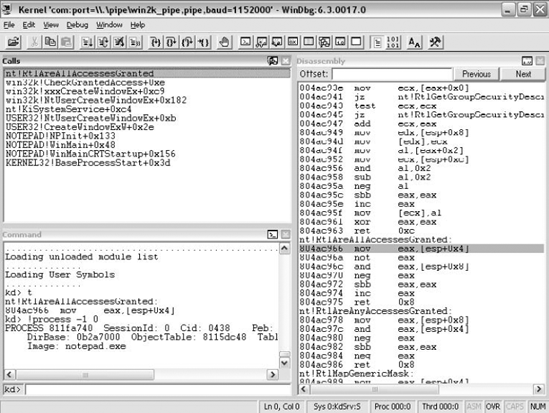
Figure 4.8. A screenshot from WinDbg when it is attached to a system for performing kernel-mode debugging.
SoftICE is used by hitting a hotkey on the debugee (the hotkey can be hit at anytime, regardless of what the debugee is doing), which freezes the system and opens the SoftICE screen. Once inside the SoftICE screen, users can see whatever the system was doing when the hotkey was hit, step through kernel-mode (or user-mode) code, or set breakpoints on any code in the system. SoftICE supports the loading of symbol files through a dedicated Symbol Loader program (symbols can be loaded from a local file or from a symbol server).
SoftICE offers dozens of system information commands that dump a variety of system data structures such as processes and threads, virtual memory information, handles and objects, and plenty more. SoftICE is also compatible with WinDbg extensions and can translate extensions DLLs and make their commands available within the SoftICE environment.
SoftICE is an interesting technology, and many people don't really understand how it works, so let's run a brief overview. Fundamentally, SoftICE is a Windows kernel-mode driver. When SoftICE is loaded, it hooks the system's keyboard driver, and essentially monitors keystrokes on the system. When it detects that the SoftICE hotkey has been hit (the default is Ctrl+D), it manually freezes the system's current state and takes control over it. It starts by drawing a window over whatever is currently displayed on the screen. It is important to realize that this window is not in any way connected to Windows, because Windows is completely frozen at this point. SoftICE internally manages this window and any other user-interface elements required while it is running. When SoftICE is opened, it disables all interrupts, so that thread scheduling is paused, and it takes control of all processors in multiprocessor systems. This effectively freezes the system so that no code can run other than SoftICE itself.
It goes without saying that this approach of running the debugger locally on the target system has certain disadvantages. Even though the Numega developers have invested significant effort into making SoftICE as transparent as possible to the target system, it still sometimes affects it in ways that WinDbg wouldn't. First of all, the system is always slightly less stable when SoftICE is running. In my years of using it, I've seen dozens of SoftICE related blue screens. On the other hand, SoftICE is fast. Regardless of connection speeds, WinDbg appears to always be somewhat sluggish; SoftICE on the other hand always feels much more "immediate." It instantly responds to user input. Another significant advantage of SoftICE over WinDbg is in user-mode debugging. SoftICE is much better at user-mode debugging than WinDbg, and placing user-mode breakpoints in SoftICE is much more reliable than in WinDbg.
Other than stability issues, there are also functional disadvantages to the local debugging approach. The best example is the code that SoftICE uses for showing its window—any code that accesses the screen is difficult to step through in SoftICE because it tries to draw to the screen, while SoftICE is showing its debugging window.
Note
Many people wonder about SoftICE's name, and it is actually quite interesting. ICE stands for in circuit emulator, which is a popular tool for performing extremely low-level debugging. The idea is to replace the system's CPU with an emulator that acts just like the real CPU and is capable of running software, except that it can be debugged at the hardware level. This means that the processor can be stopped and that its state can be observed at any time. SoftICE stands for a Software ICE, which implies that SoftICE is like a software implementation of an in circuit emulator.
Figure 4.9 shows what SoftICE looks like when it is opened. The original Windows screen stays in the background, and the SoftICE window is opened in the center of the screen. It is easy to notice that the SoftICE window has no border and is completely detached from the Windows windowing system.
Because kernel debugging freezes and potentially destabilizes the operating system on which it is performed, it is highly advisable to use a dedicated system for kernel debugging, and to never use a kernel debugger on your primary computer. This can be problematic for people who can't afford extra PCs or for frequent travelers who need to be able to perform kernel debugging on the road.
The solution is to use a single computer with a virtual machine. Virtual machines are programs that essentially emulate a full-blown PC's hardware through software. The guest system's display is shown inside a window on the host system, and the contents of its hard drives are stored in a file on the host's hard drive.
Virtual machines are perfect for kernel debugging because they allow for the creation of isolated systems that can be kernel debugged at any time, and even concurrently (assuming the host has enough memory to support them), without having any effect on the stability of the host.
Virtual machines also offer a variety of additional features that make them attractive for users requiring kernel debugging. Having the system's hard drive in a single file on the host really simplifies management and backups. For instance, it is possible to store one state of the system and then make some configuration changes—going back to the original configuration is just a matter of copying the original file back, much easier than with a nonvirtual system. Additionally, some virtual machine products support nonpersistent drives that discard anything written to the hard drive when the system is shut down or restarted. This feature is perfect for dealing with malicious software that might try to corrupt the disk or infect additional files because any changes made while the system is running are discarded when the system is shut down.
Unsurprisingly, virtual machines require significant resources from the host. The host must have enough memory to contain the host operating system, any applications running on top of it, and the memory allocated for the guest systems currently running. The amount of memory allocated to each guest system is typically user-configurable. Regarding the CPU, some virtual machines actually emulate the processor, which allows for emulating any system on any platform, but that incurs a significant performance penalty. The more practical application for virtual machines is to run guest operating systems that are compatible with the host's processor, and to try to let the guest system run directly on the host's processor as much as possible. This appears to be the only way to get decent performance out of the guest systems, but the problem is that the guest can't just be allowed to run on the host directly because that would interfere with the host operating system. Instead, modern virtual machines allow "checked" sequences of guest code to run directly on the host processor and intervene whenever it's necessary to ensure that the guest and host are properly isolated from one another.
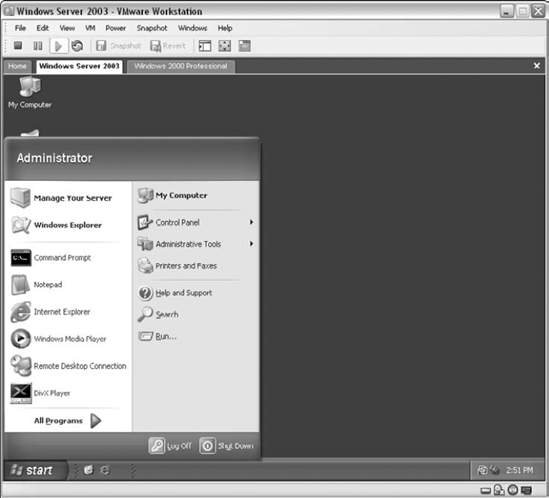
Virtual machine technologies for PCs have really matured in recent years and can now offer a fast, stable solution for people who require more than one computer but that don't need the processing power of multiple computers. The two primary virtual machine technologies currently available are Virtual PC from Microsoft Corporation and VMWare Workstation from VMWare Inc. Functionally the two products are very similar, both being able to run Windows and non-Windows operating systems. One difference is that VMWare also runs on non-Windows hosts such as Linux, allowing Linux systems to run versions of Windows (or other Linux installations) inside a virtual machine. Both products have full support for performing kernel-debugging using either WinDbg or NuMega SoftICE. Figure 4.10 shows a VMWare Workstation window with a Windows Server 2003 system running inside it.
Decompilers are a reverser's dream tool—they attempt to produce a high-level language source-code-like representation from a program binary. Of course, it is never possible to restore the original code in its exact form because the compilation process always removes some information from the program. The amount of information that is retained in a program's binary executable depends on the high-level language, the low-level language to which the program is being translated by the compiler, and on the specific compiler used. For example, .NET programs written in one of the .NET-compatible programming languages and compiled to MSIL can typically be decompiled with decent results (assuming that no obfuscation is applied to the program). For details on specific decompilers for the .NET platform, please see Chapter 12.
For native IA-32 code, the situation is a bit more complicated. IA-32 binaries contain far less high-level information, and recovering a decent high-level representation from them is not currently possible. There are several native code decompilers currently in development, though none of them has been able to demonstrate accurate high-level output so far. Hopefully, this situation will improve in the coming years. Chapter 13 discusses decompilers (with a focus on native decompilation) and provides an insight into their architecture.
System monitoring is an important part of the reversing process. In some cases you can actually get your questions answered using system-monitoring tools and without ever actually looking at code. System-monitoring tools is a general category of tools that observe the various channels of I/O that exist between applications and the operating system. These are tools such as file access monitors that display every file operation (such as file creation, reading or writing to a file, and so on) made from every application on the system. This is done by hooking certain low-level components in the operating system and monitoring any relevant calls made from applications.
There are quite a few different kinds of system-monitoring tools, and endless numbers of such tools available for Windows. My favorite tools are those offered on the www.sysinternals.com Web site, written by Mark Russinovich (coauthor of the authoritative text on Windows internals [Russinovich]) and Bryce Cogswell. This Web site offers quite a few free system-monitoring tools that monitor a variety of aspects of the system and at several different levels. For example, they offer two tools for monitoring hard drive traffic: one at the file system level and another at the physical storage device level. Here is a brief overview of their most interesting tools.
FileMon This tool monitors all file-system-level traffic between programs and the operating system, and can be used for viewing the file I/O generated by every process running on the system. With this tool we can see every file or directory that is opened, and every file read/write operation performed from any process in the system.
TCPView This tool monitors all active TCP and UDP network connections on every process. Notice that it doesn't show the actual traffic, only a list of which connections are opened from which process, along with the connection type (TCP or UDP), port number and the address of the system at the other end.
TDIMon TDIMon is similar to TCPView, with the difference that it monitors network traffic at a different level. TDIMon provides information on any socket-level operation performed from any process in the system, including the sending and receiving of packets, and so on.
RegMon RegMon is a registry activity monitor that reports all registry access from every program. This is highly useful for locating registry keys and configuration data maintained by specific programs.
PortMon PortMon is a physical port monitor that monitors all serial and parallel I/O traffic on the system. Like their other tools, PortMon reports traffic separately for each process on the system.
WinObj This tool presents a hierarchical view of the named objects in the system (for information on named objects refer to Chapter 3), and can be quite useful for identifying various named synchronization objects, and for viewing system global objects such as physical devices, and so on.
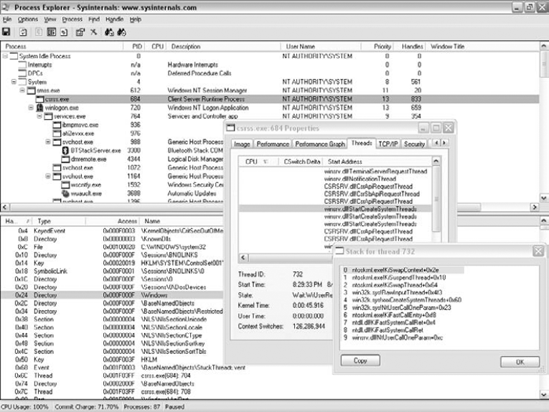
Process Explorer Process Explorer is like a turbo-charged version of the built-in Windows Task Manager, and was actually designed to replace it. Process Explorer can show processes, DLLs loaded within their address spaces, handles to objects within each process, detailed information on open network connections, CPU and memory usage graphs, and the list just goes on and on. Process Explorer is also able to show some level of code-related details such as the user and kernel stacks of each thread in every process, complete with symbolic information if it is available. Figure 4.11 shows some of the information that Process Explorer can display.
Patching is not strictly a reversing-related activity. Patching is the process of modifying code in a binary executable to somehow alter its behavior. Patching is related to reversing because in order to know where to patch, one must understand the program being patched. Patching almost always comes after a reversing session in which the program is analyzed and the code position that needs to be modified is located.
Patching is typically performed by crackers when the time arrives to "fix" the protected program. In the context of this book, you'll be using patching tools to crack several sample crackme programs.
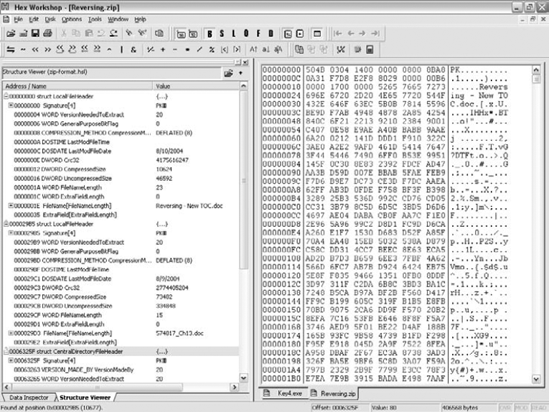
Hex Workshop by BreakPoint Software, Inc. is a decent hex-dumping and patching tool for files and even for entire disks. It allows for viewing data in different formats and for modifying it as you please. Unfortunately, Hex Workshop doesn't support disassembly or assembly of instructions, so if you need to modify an instruction in a program I'd generally recommend using OllyDbg, where patching can be performed at the assembly language level.
Besides being a patching tool, Hex Workshop is also an excellent program for data reverse engineering, because it supports translating data into organized data structures. Unfortunately, Hex Workshop is not free; it can be purchased at www.bpsoft.com.
The screenshot in Figure 4.12 shows a typical Hex Workshop screen. On the right you can see the raw dumped data, both in a hexadecimal and in a textual view. On the left you can see Hex Workshop's structure viewer. The structure viewer takes a data structure definition and uses it to display formatted data from the current file. The user can select where in the file this structured data resides.
The following are miscellaneous tools that don't fall under any of the previous categories.
Executable dumping is an important step in reversing, because understanding the contents of the executable you are trying to reverse is important for gaining an understanding of what the program does and which other components it interacts with. There are numerous executable-dumping tools available, and in order to be able to make use of their output, you'll probably need to become comfortable with the PE header structure, which is discussed in detail in Chapter 3. The following sections discuss the ones that I personally consider to be highly recommended.
DUMPBIN is Microsoft's console-mode tool for dumping a variety of aspects of Portable Executable files. Besides being able to show the main headers and section lists, DUMPBIN can dump a module's import and export directories, relocation tables, symbol information, and a lot more. Listing 4.1 shows a typical DUMPBIN output.
Example 4.1. A typical DUMPBIN output for USER32.DLL (launched with the /HEADERS option).
Microsoft (R) COFF/PE Dumper Version 7.10.3077
Copyright (C) Microsoft Corporation. All rights reserved.

Dump of file user32.dll

PE signature found

File Type: DLL

FILE HEADER VALUES
             14C machine (x86)
               4 number of sections
        411096B8 time date stamp Wed Aug 04 10:56:40 2004
0 file pointer to symbol table
0 number of symbols
E0 size of optional header
210E characteristics
Executable
Line numbers stripped
Symbols stripped
32 bit word machine
DLL
OPTIONAL HEADER VALUES
10B magic # (PE32)
7.10 linker version
5EE00 size of code
2E200 size of initialized data
0 size of uninitialized data
10EB9 entry point (77D50EB9)
1000 base of code
5B000 base of data
77D40000 image base (77D40000 to 77DCFFFF)
1000 section alignment
200 file alignment
5.01 operating system version
5.01 image version
4.00 subsystem version
0 Win32 version
90000 size of image
400 size of headers
9CA60 checksum
2 subsystem (Windows GUI)
0 DLL characteristics
40000 size of stack reserve
1000 size of stack commit
100000 size of heap reserve
1000 size of heap commit
0 loader flags
10 number of directories
38B8 [ 4BA9] RVA [size] of Export Directory
5E168 [ 50] RVA [size] of Import Directory
62000 [ 2A098] RVA [size] of Resource Directory
0 [ 0] RVA [size] of Exception Directory
0 [ 0] RVA [size] of Certificates Directory
8D000 [ 2DB4] RVA [size] of Base Relocation Directory
5FD48 [ 38] RVA [size] of Debug Directory0 [ 0] RVA [size] of Architecture Directory
0 [ 0] RVA [size] of Global Pointer Directory
0 [ 0] RVA [size] of Thread Storage Directory
3ED30 [ 48] RVA [size] of Load Configuration Directory
270 [ 4C] RVA [size] of Bound Import Directory
1000 [ 4E4] RVA [size] of Import Address Table Directory
5DE70 [ A0] RVA [size] of Delay Import Directory
0 [ 0] RVA [size] of COM Descriptor Directory
0 [ 0] RVA [size] of Reserved Directory
SECTION HEADER #1
.text name
5EDA7 virtual size
1000 virtual address (77D41000 to 77D9FDA6)
5EE00 size of raw data
400 file pointer to raw data (00000400 to 0005F1FF)
0 file pointer to relocation table
0 file pointer to line numbers
0 number of relocations
0 number of line numbers
60000020 flags
Code
Execute Read
Debug Directories
Time Type Size RVA Pointer
-------- ------ -------- -------- --------
41107EEC cv 23 0005FD84 5F184 Format: RSDS,
{036A117A-6A5C-43DE-835A-E71302E90504}, 2, user32.pdb
41107EEC ( A) 4 0005FD80 5F180 BB030D70
SECTION HEADER #2
.data name
1160 virtual size
60000 virtual address (77DA0000 to 77DA115F)
C00 size of raw data
5F200 file pointer to raw data (0005F200 to 0005FDFF)
0 file pointer to relocation table
0 file pointer to line numbers
0 number of relocations
0 number of line numbersC0000040 flags
Initialized Data
Read Write
SECTION HEADER #3
.rsrc name
2A098 virtual size
62000 virtual address (77DA2000 to 77DCC097)
2A200 size of raw data
5FE00 file pointer to raw data (0005FE00 to 00089FFF)
0 file pointer to relocation table
0 file pointer to line numbers
0 number of relocations
0 number of line numbers
40000040 flags
Initialized Data
Read Only
SECTION HEADER #4
.reloc name
2DB4 virtual size
8D000 virtual address (77DCD000 to 77DCFDB3)
2E00 size of raw data
8A000 file pointer to raw data (0008A000 to 0008CDFF)
0 file pointer to relocation table
0 file pointer to line numbers
0 number of relocations
0 number of line numbers
42000040 flags
Initialized Data
Discardable
Read Only
Summary
2000 .data
3000 .reloc
2B000 .rsrc
5F000 .textDUMPBIN is distributed along with the various Microsoft software development tools such as Visual Studio .NET.
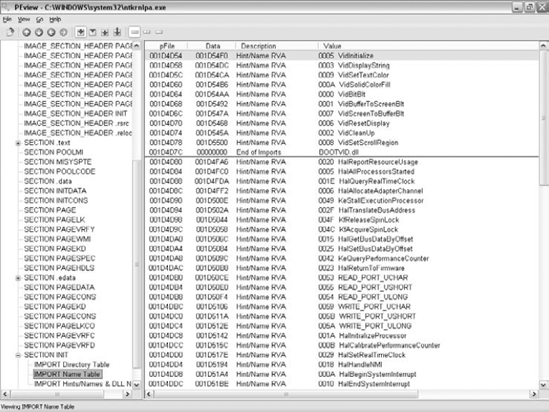
PEView is a powerful freeware GUI executable-dumping tool. It allows for a good GUI visualization of all important PE data structures, and also provides a raw view that shows the raw bytes of a chosen area in a file. Figure 4.13 shows a typical PEview screen. PEView can be downloaded free of charge at www.magma.ca/~wjr.
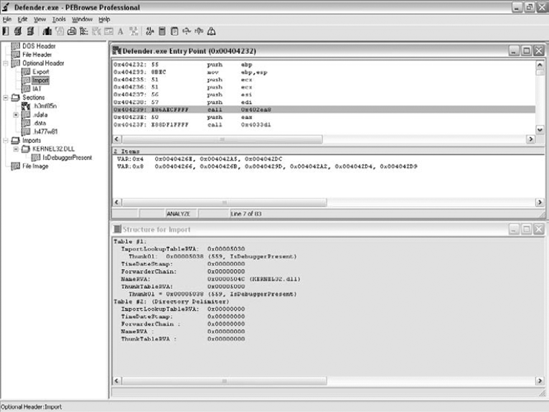
PEBrowse Professional is an excellent PE-dumping tool that can also be used as a disassembler (the name may sound familiar from our earlier discussion on debuggers—this not the same product, PEBrowse Professional doesn't provide any live debugging capabilities). PEBrowse Professional is capable of dumping all PE-related headers both as raw data and as structured header information. In addition to its PE dumping abilities, PEBrowse also includes a solid disassembler and a function tree view on the executable. Figure 4.14 shows PEBrowse Professional's view of an executable that includes disassembled code and a function tree window.
In this chapter I have covered the most basic tools that should be in every reverser's toolkit. You have looked at disassemblers, debuggers, system-monitoring tools, and several other miscellaneous classes of reversing tools that are needed in certain conditions. Armed with this knowledge, you are ready to proceed to Chapter 5 to make your first attempt at a real reversing session.