
Since time immemorial, man has been fascinated by the weather, asking questions such as “Will it rain for our crops? Will it snow, so we can go skiing? Will a tornado carry our house to a fictitious country populated by supernatural women and flight-capable primates? We get some kind of weather every day—what’s it going to be today?”
Forecasting the weather has not always been a scientific pursuit. People would pray to the rain gods for rain and to the sun gods for sunshine. If prayer didn’t work, they would often visit a prophet or a seer who professed the ability to look into the future and predict the path of a coming low-pressure system (though not in those particular words, of course).

The weather stone (Image ©2010 Tom Knapp)
For all of these advances, a weather station was needed—a small, localized way of keeping up on current conditions. Even small weather stations normally give wind speed and direction, temperature, humidity, and relative barometric pressure. Each of these readings, when viewed in combination over the course of a day or two, can help you predict the weather for the immediate future.
Of course, the Raspberry Pi is perfect for creating this weather-station application. A lot of computational power is not required, but the ability to easily interact with a small network of sensors is. Some are connected to the Pi via I2C (inter-integrated circuit), some are connected via pulse-width modulation (PWM), and some are simply connected to the GPIO pins. By polling each sensor one by one in a round-robin style, we can gain an accurate picture of what the weather is doing at any given moment.
Let’s start by gathering the parts required to build our weather station.
A Shopping List of Parts
Raspberry Pi and power adapter
Digital compass/magnetometer ( https://www.sparkfun.com/products/10530 )
Optical shaft encoder ( http://www.vexrobotics.com/276-2156.html )
Barometric pressure sensor ( https://www.adafruit.com/products/1603 )
Digital thermometer ( https://www.adafruit.com/products/1638 )
Small breadboard ( https://www.sparkfun.com/products/9567 )
Square shaft from hardware store
Pinwheel or similar fan-like device
Lazy Susan bearing
Thin wooden plate
PVC pipe with cap, about 12 inches long, 1–2 inches in diameter
Miscellaneous jumper wires, glue, screws
Using the I2C Protocol
This project takes advantage of the I2C protocol for communicating with the humidity and pressure sensors that you’ll add to the Pi. While it’s a relatively simple protocol, it can get a little confusing, so it’s best to review it quickly before we start building the station.
I2C enables a large number of devices to communicate on one circuit using only three wires: a data line, a clock line, and a ground wire. Each device is called a node, and there is usually one master node and many slaves. Each slave node has a 7-bit address, such as 0x77 or 0x43. When the master node needs to communicate with a particular slave, it begins by transmitting a “start” bit, followed by the slave’s address, on the data line. That slave responds with an acknowledgment, while all other slaves ignore the rest of the message and go back to waiting for the next address pulse to be transmitted. The master and slave then communicate with each other, often switching between transmitting and receiving modes until all information has been transmitted.
I2C has been referred to as “the serial protocol on steroids,” and it is most often used in applications where speed does not matter and the cost of parts needs to remain low. The Raspberry Pi has two pins, #3 and #5, that are preconfigured to be the I2C protocol’s SDA (data) and SCL (clock) lines, respectively, so it can easily communicate with I2C devices. Two of the devices we’ll be using (the barometer/altimeter and the magnetometer) are I2C devices.
The Pi also has an I2C utility that makes it possible to see the devices that are currently connected. To install it, type
If you’re using a recent version of Raspbian, such as Wheezy or Stretch, these should be installed already, in which case you’ll just get a note telling you that they’re already the newest version.
Now, you can run the I2C utility tool called i2cdetect to make sure everything is working and see what devices are connected. Type
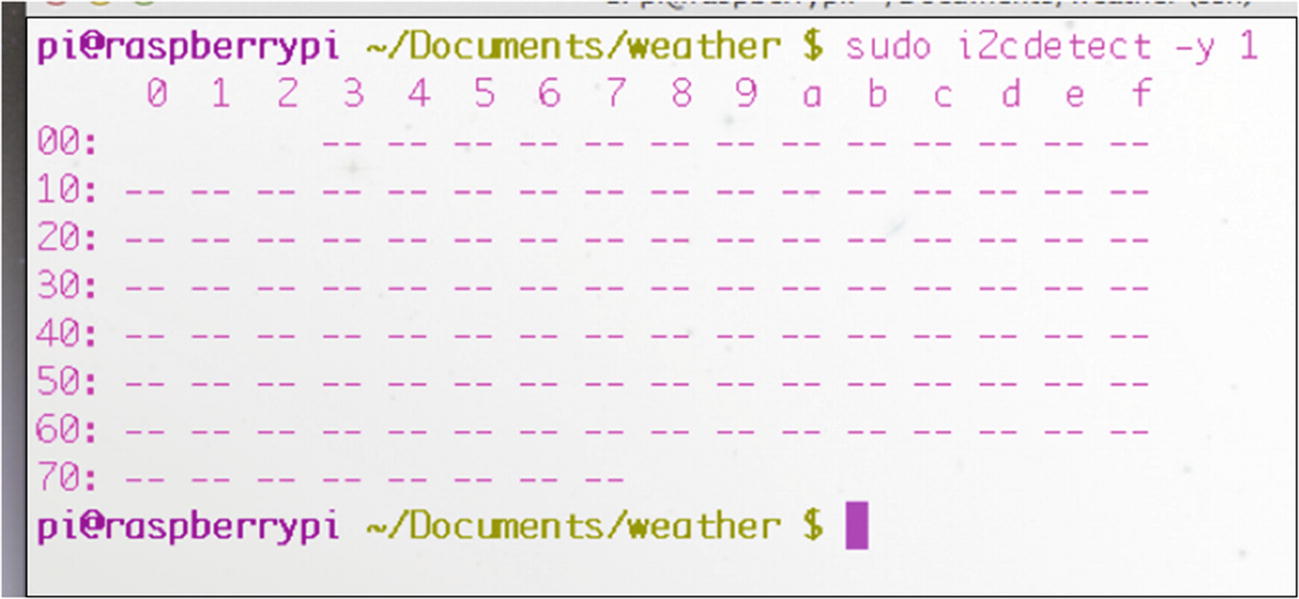
The i2cdetect tool
In this case, no devices are present, which makes sense because we haven’t plugged any in yet. But you now know that your tools are running correctly.
Using an Anemometer
An important part of any weather station is the anemometer—the device that measures wind speed—because wind speed is an important factor in any weather forecasting. If it’s a cold day (below 32°F or 0°C, for instance), the wind speed plays an important role in how cold it feels (the wind chill). According to the National Weather Service’s wind-chill chart, a 15 MPH wind at 15°F makes it feel like 0°F, and a 20 MPH wind at 0°F makes it feel like 24 degrees below zero. Wind speed is important in this case in determining whether your extremities are going to freeze first or fall off first (both equally unappealing, if you ask me).
On the other hand, if it’s not particularly cold out, the wind speed plays a part in how fast the next weather phenomenon is coming at you. At 2 MPH, that sunny day is going to take another few days to reach you; at 50 MPH, you have only minutes before the cyclone destroys your house.
An anemometer can be a fairly complicated device, with bearings and shafts and switches and so forth; ours, on the other hand, is relatively simple.
Building the Anemometer
We’ll be using a rotary-shaft encoder, a rotating shaft, and some fins to measure the speed of the wind.
The rotary-shaft encoder we’re using from Vex robotics consists of a plastic disk with slits spaced evenly around its circumference. When power is applied, a small light shines through the slits in the disc and onto a photosensitive receptor on the other side. By counting the number of times the light is blocked by the disk (or, alternatively, the number of times the light shines through a slit) in a given span of time, it is possible to determine how fast the disc is spinning. It is also possible to determine how many times the disc has rotated, and this is, in fact, how rotary encoders are often used. If a rotary encoder is hooked to a robot’s axle, it’s a very good way of measuring how far the wheels connected to that axle have traveled, for instance. If the disc has 90 slits (as ours does), we know that one full rotation of the axle (one full wheel rotation) is 90 flashes of light onto the encoder’s photo receptor. Thus, we can tell the robot, “Go forward 30 slits,” and the wheel will advance exactly one-third of its circumference forward. If we know the circumference of the disc/wheel is 3 feet, we know the robot has just advanced 1 foot.
This may seem like a lot of unnecessary math, but it’s important for you to understand how the encoder operates. Once we attach the fins to the rotating shaft, we could (theoretically) figure out wind speed based on the circumference of the fins and the speed of the shaft. However, my experience is that it’s actually much easier to just experiment with known wind speeds and incorporate those speeds into our program, so that’s what we’ll do. To do that, you’ll need a partner—somebody who can drive you around at predetermined, sane speeds while you take wind-speed measurements. That means speeds of around 5–20 MPH, not 80.
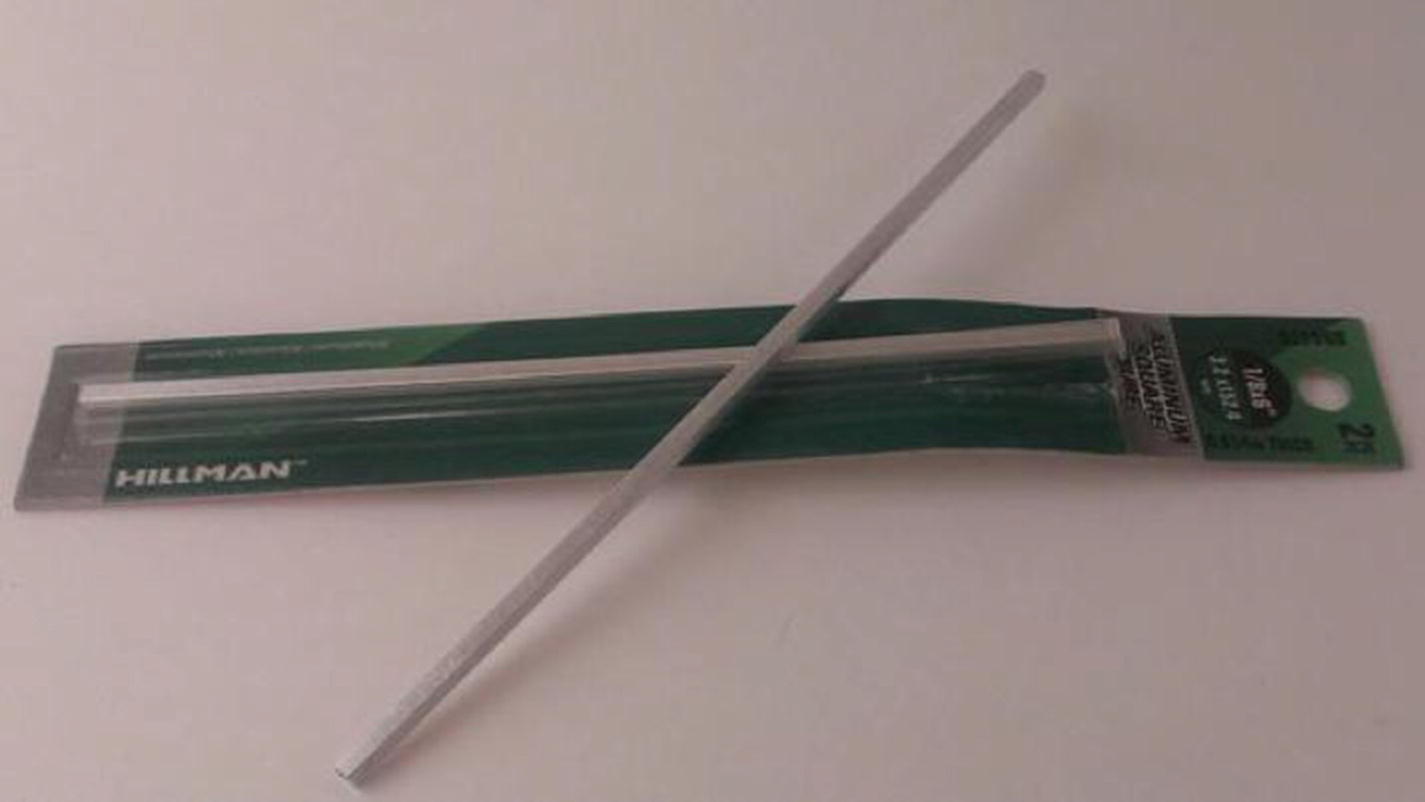
Square shaft
Note
As of this writing, a 1/8-inch shaft fits perfectly in the rotary encoder’s hole.
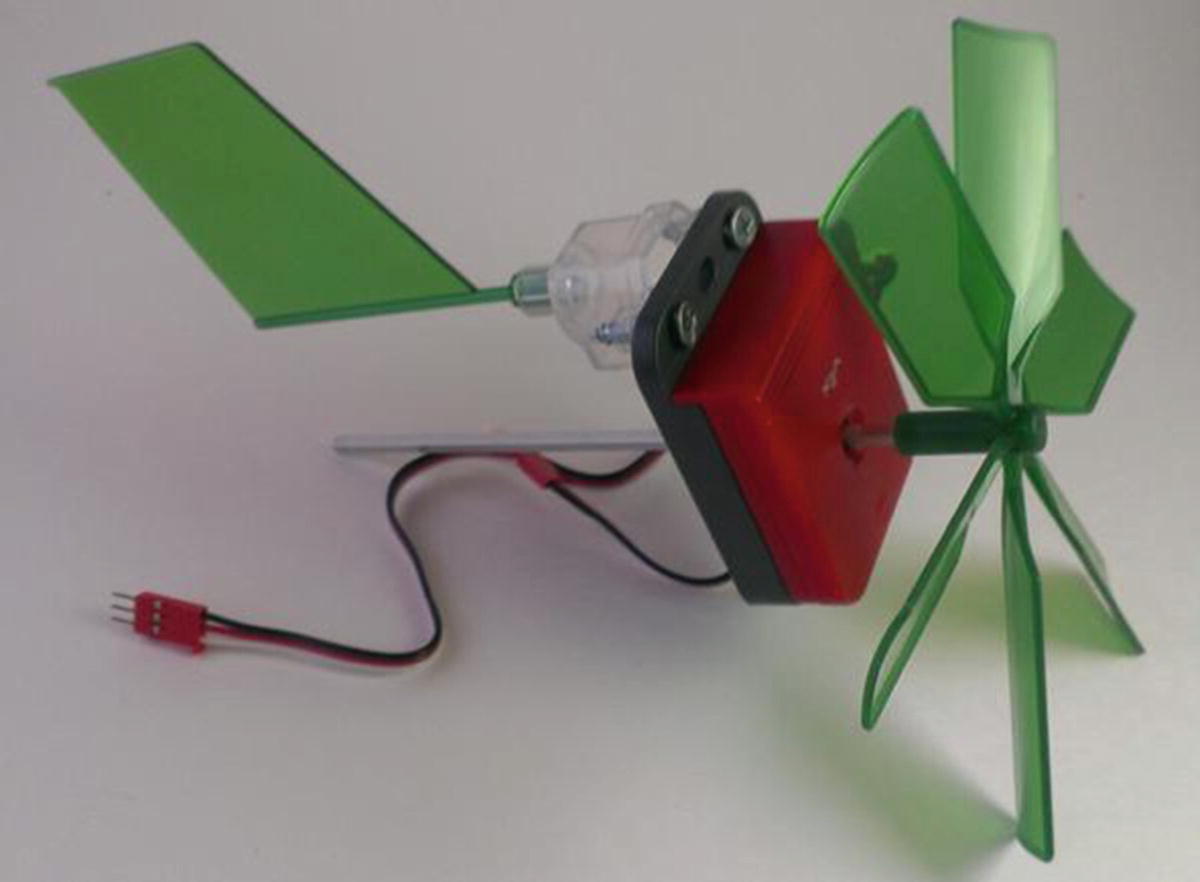
Encoder with wind vanes attached
The entire mechanism needs to rotate; that is, it needs to be connected to a device that can spin on an axis, like a weather vane, so we can determine the wind’s direction. This is where the Lazy Susan bearing set comes into play.
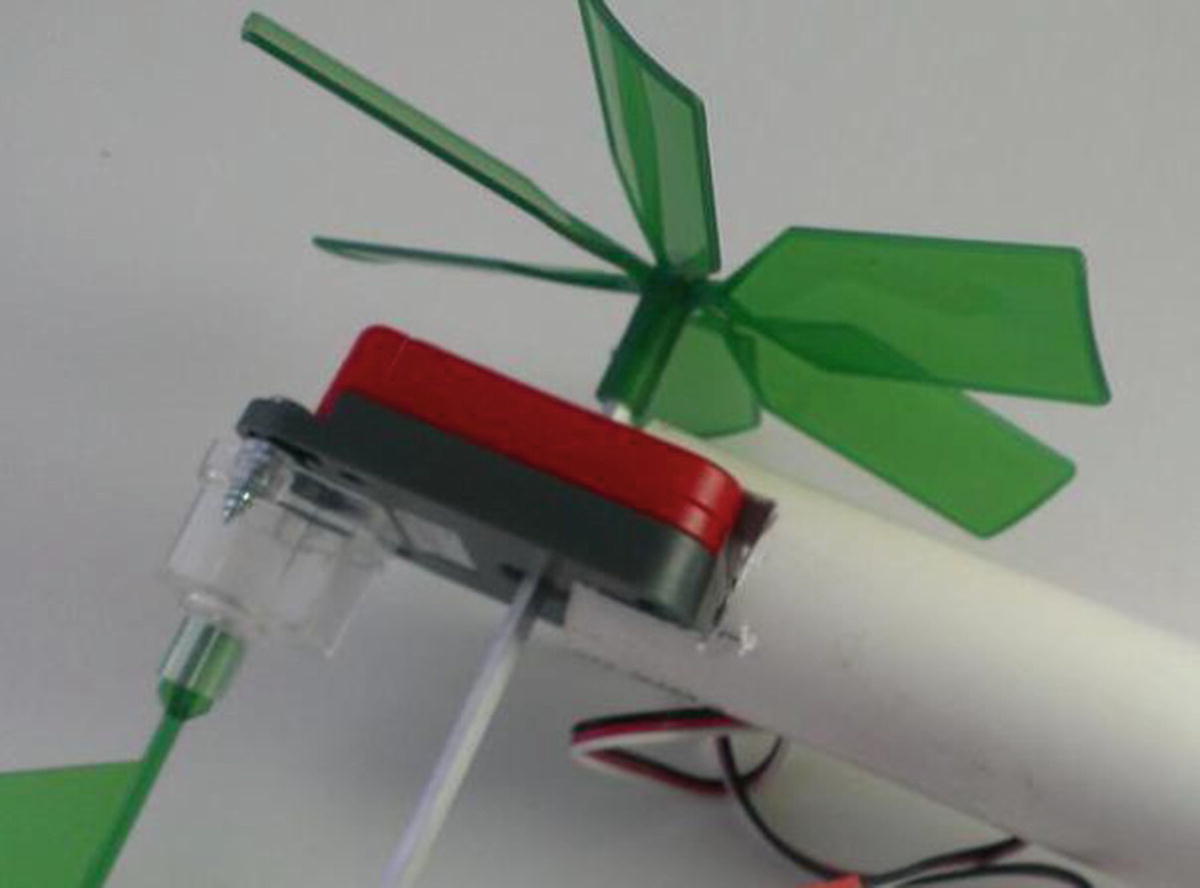
Encoder in slot in PVC pipe
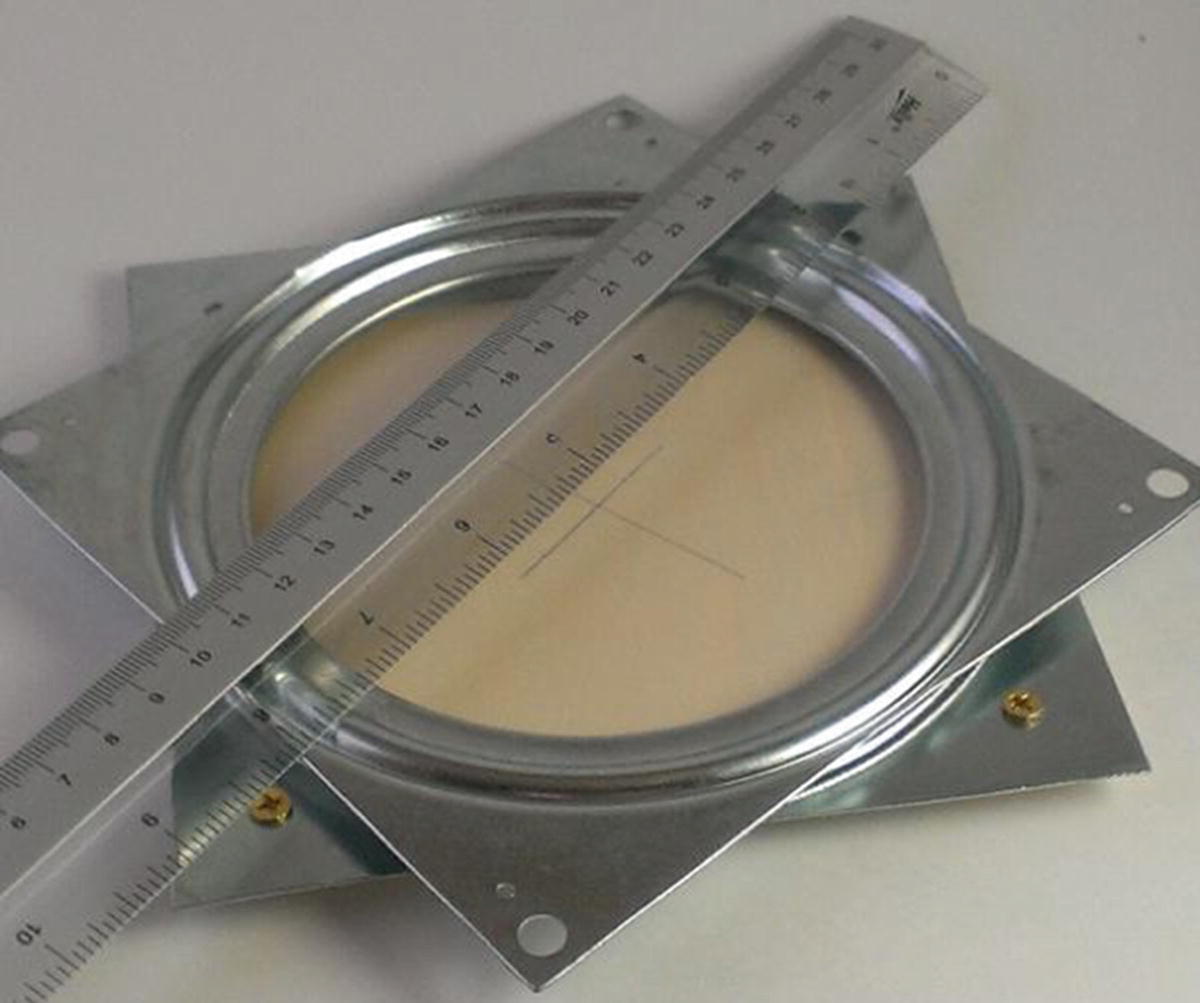
Determining the platform center
Anenometer assembly
Connecting the Anemometer to the Pi
Now, we need to hook up the anemometer to the Pi and measure rotation speeds. Connect the red wire of the encoder to the Pi’s power pin (#2), the black wire to GND (#6), and the white wire to a GPIO pin of your choice. Let’s use pin #8 for illustrative purposes.
As mentioned earlier, this encoder works by sending a HIGH signal every time a slit in the disc passes a certain point. We know that there are 90 slits in the disc, so every 90 HIGH signals equals one rotation of the shaft. All we need to do is keep track of the HIGHs and how long it takes to get 90 of them, and we’ll have rotation speed over time. If we track the time in seconds (as we will when using the time library), we’ll have revolutions per second. So, the code to read our encoder should be something like this:
Everything interesting here happens in the while loop. Since we’ve begun by setting the prev_input to 0, a 1 (HIGH) as an input means that the disc is turning. In that case, we increment total, set prev_input to input, and continue the loop after checking to see if we’ve reached 90 HIGHs yet. If we have, that means we’ve gone exactly one revolution, so we can calculate and print revolutions per second (RPS) and reset total and current. To test this encoder code, connect the wires to your Pi, run the script, and manually spin the encoder wheel. You should see 90 iterations of the word “turning” and then a line with RPS displayed.
Correlating Revolutions per Second with Wind Speed
If the encoder is working as it should, the only step left is to correlate revolutions per second with wind speed, and the easiest way to do that is with a friend and a car. With your anemometer held out the window and your Pi connected to your laptop via an ad-hoc network (see the sidebar), have your friend drive for a few minutes at 5 MPH while you run the encoder script; repeat the process at 10, 15, and 20 MPH until you have enough data to correlate wind speed with RPS.
MPH Correlated to RPS Reading Using an Anemometer
MPH | RPS |
|---|---|
5 | 5.8 |
10 | 9.23 |
15 | 10.8 |
20 | 11.7 |
The correlation of MPH to RPS is obviously a logarithmic relationship, which means we can use a little algebra (eek!) to calculate wind speed based on revolutions per second.
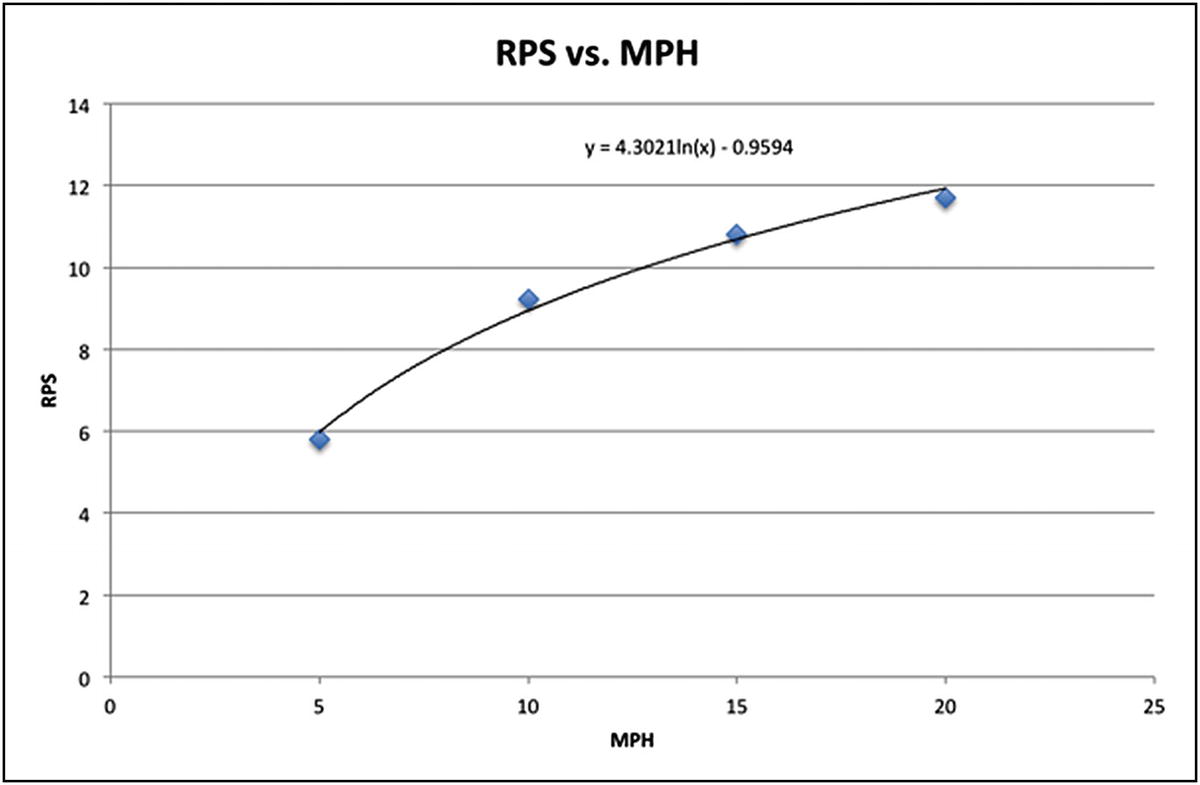
RPS versus MPH
wind speed = e((y+0.95)/4.3)
We’ll be able to substitute that calculation into our final program, as you’ll soon see.
Hooking Pi To Laptop Via ad-hoc Network
If you’re like me, most of the work I do with my Pi is headless—I SSH (Secure Shell) into it or run a VNC (Virtual Network Computing0) server if I need to see the desktop, but I ordinarily don’t have a monitor, mouse, or keyboard connected to it. This works well if you’re connected to your home network, for instance, but what if there’s no network around? Luckily, setting up a wired ad-hoc network between your Pi and a laptop is pretty simple. An ad-hoc is simply a network connection between the Pi and another computer, such as your laptop, with no router or hub in between.
The easiest way to set this up is to take note of your Pi’s static IP address and adjust your laptop’s Ethernet port to communicate with that address. Let’s say your Pi has the address 192.168.2.42. Use a short Ethernet cable to connect your Pi directly to your laptop’s Ethernet port. Now, go into your laptop’s network settings. Chances are your computer is set up to receive an address automatically from the router via DHCP (Dynamic Host Control Protocol). Change that method to Manual and give your computer’s network port an address that coincides with the Pi’s subnet. In our example, a good address would be 192.168.2.10. If there are spots for it, fill in the subnet mask (255.255.255.0 will work in this instance) and the default gateway (192.168.2.1 in this case). If necessary, reboot your computer or restart your network manager.
You should now be able to log in to your directly-connected Pi via a standard terminal connection:
and you can work exactly as you would on your home network.
Connecting the Digital Compass
The digital compass we’ll use in this project has one purpose: to let us know which direction the wind is blowing. The one we’re using, the HMC5883L, uses the I2C protocol, so make sure you’re familiar with the information in the section “Using the I2C Protocol” earlier in this chapter before you continue.
Start by soldering the male headers that came with it to the HMC breakout board. The orientation is up to you; if you plan to make it standalone, you may want the headers facing up so that they’re easy to access. If, on the other hand, you’re planning on plugging the chip into a breadboard, by all means solder them facing down so that you can easily plug the whole unit into your board.

Viewing the compass’ I2C address
If it doesn’t appear, double-check your connections. (The other address you see listed in Figure 6-9, 0x60, is another I2C device I had plugged into my Pi.) When it shows up, start a new Python script to read from the device. We’ll use the smbus library’s I2C tools to read from and write to the sensor. First, start a directory on your Pi to keep all of your weather-station code together by typing
Now that you’ve created a weather directory in your home folder and have navigated inside it, type the following code into your new Python script:
After importing the correct libraries, this script sets up functions to read from and write to the sensor’s address using the smbus library. The functions read_byte(), read_word(), read_word_2c(), and write_byte() are all used to read and write values (either single bytes or 8-bit values) to the sensor’s I2C address. The three write_byte() lines write the values 112, 32, and 0 to the sensor to configure it for reading. These values are normally listed in the data sheet that comes with an I2C sensor.
Note
You may have noticed that very often when you purchase a breakout board from either Adafruit or Sparkfun those companies have example code available for that sensor. Check the “Documentation” link on each site whenever you purchase a part from them. As any programmer will tell you: if the work has been done already, there is no need to reinvent the wheel. Nor is there shame in using pre-existing code if it solves your problem for you. As you advance in your programming skills, it may not be long before you are contributing code to the maker community that solves somebody else’s problem!
The script then reads the current values of the x- and y-axis readings of the compass and calculates the sensor’s bearing with the math library’s atan2() (inverse tangent) function, first converting it to degrees with the library’s degrees() function. The x_offset and y_offset values, however, are subject to change, depending on your current geographic location, and the best way to determine those values is to simply run the script.
Run the script, preferably with a working compass nearby, and compare the readings you get to the compass readings. (The side of the board with the soldered headers is the direction in which the board is “pointed.”) You may have to tweak the offsets bit by bit to get the bearing to register correctly. Once it’s configured, you have a way to measure the wind’s direction; we’ll mount the compass to the anemometer’s rotating shaft so that we can read the direction when we assemble the final weather station.
Connecting the Temperature/Humidity Sensor
The temperature and humidity sensor we’re using, the Sensirion SHT15, is one of the pricier parts in this build. However, it’s also very easy to work with, because there’s no I2C protocol involved. You’ll first need to solder the included headers to it. Like the compass, the orientation of the headers is up to you. I tend to solder headers on with the board facing up, so I can see what each pin is as I plug the jumper wires into it. Of course, if I’m going to plug the unit into a breadboard, it means that I can’t read the pins, but that’s the tradeoff.
- 1.
Connect the VCC pin to the Pi’s 5V pin (#2).
- 2.
Connect the GND pin to the Pi’s pin #6.
- 3.
Connect the CLK pin to pin #7.
- 4.
Connect the DATA pin to pin #11.
Note
With the pins labeled DATA and CLK, it’d be an understandable mistake to think this board runs on the I2C protocol, but it doesn’t. The pins are just labeled that way.
To work with this sensor, you’ll have to install the rpiSht1x Python library by Luca Nobili. Inside your weather directory (or wherever you’re working on your weather station code), download the rpiSht1x library by typing
Note
You’ll need to use the --no-check-certificate flag because I’ve shortened the link by using the link-shortening service bitly.com to make it easier for you to type. Ordinarily, when you download a file using wget, it just saves to your current directory, but renaming the link using bitly.com can lead to strange behavior when downloading. This flag corrects that problem.
When it’s done downloading (which shouldn’t take long, considering it’s only an 8KB download), you’ll need to rename it so that you can expand it. Rename the downloaded file by typing
and then expand the result by typing
Then cd into the resulting directory (cd rpiSht1x-1.2) and run
You now have the library available to you, so let’s try it out. With your SHT15 still connected as defined earlier, type the following code:
Save this code as sht.py and run it with sudo python sht.py. The script uses the functions defined in the Adafruit script—read_temperature_C(), read_humidity(), and calculate_dew_point()—to get the current values from the sensor, which we’ve connected to pins 7 and 11. Then, it performs a quick conversion for those of us not using the metric system and displays the results.
You should get a line with your current conditions:
As you can see, it’s a pretty self-explanatory library. Many of these libraries started their lives written for the Arduino to communicate with them, and thankfully they’ve since been ported to run on the Pi. (See the earlier side note regarding using existing code.)
Connecting the Barometer
Perhaps one of the most interesting parts of the weather station is the BMP180 barometer chip, if only because changing air pressure is one of the best indicators of what the weather is going to do next. In general, falling air pressure indicates a storm on the way, and rising air pressure indicates good weather ahead. That is an oversimplification, of course.
The BMP180 chip runs on the I2C protocol, so you’ll have to wire it up to your Pi’s SDA and SCL pins (pins #3 and #5) like you did with the compass. After soldering your headers to the board, connect VCC and GND to pins #1 and #6, and then SDA and SCL to pins #3 and #5, respectively.
Note
You’re connecting the chip’s power to the Pi’s 3.3V, not the 5V. You want the chip to run on 3.3V logic so that it doesn’t have a chance to damage the Pi’s delicate 3.3V inputs.
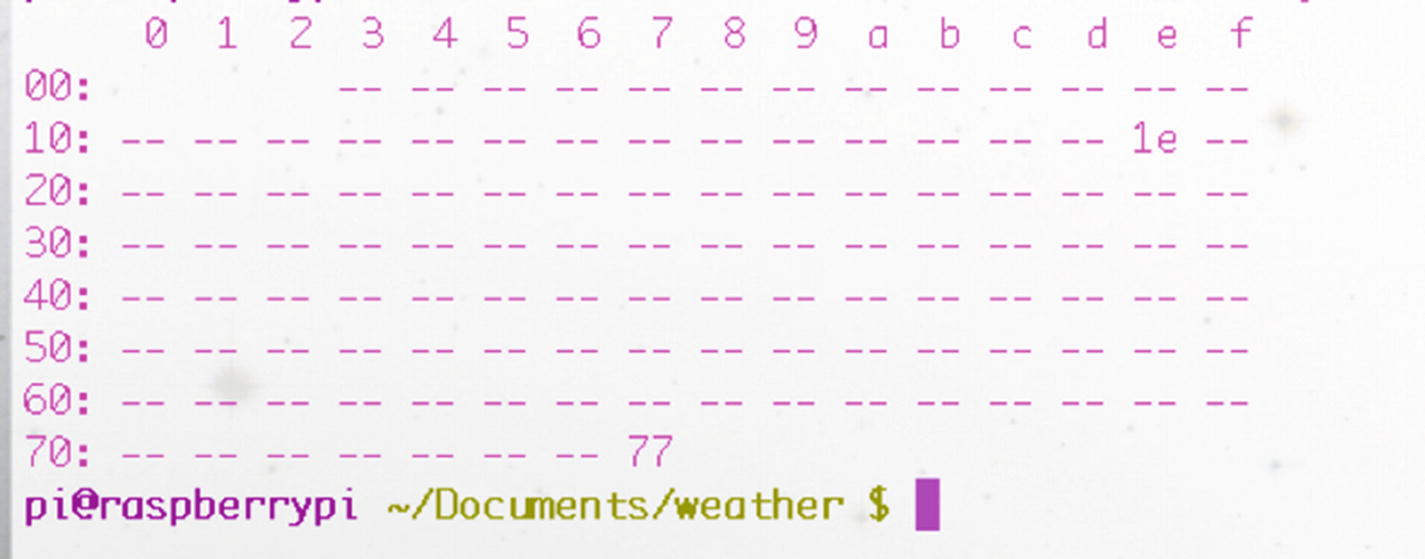
i2cdetect showing the 0x77 and 0x1e addresses in use
Note
The 0x1e device in the screenshot in Figure 6-10 is the connected compass we’re using.
Again, this device needs some external libraries to work. In this case, we’ll be using Adafruit’s excellent BMP085 libraries.
Note
The BMP180 chip’s original version was the BMP085. Although it has since been replaced, the schematic and pinout of the chips is the same, so all libraries written for the BMP085 also work for the BMP180.
To grab the necessary library, in your terminal type
As we did before, we’ll need to rename the downloaded file so that we can use it. In this case, the file we downloaded is named NJZOTr. Rename it by typing
There’s nothing to install here, so we can jump right into using the library to communicate with the chip. In a new Python script in the same directory, enter the following:

Output of BMP180 pressure sensor
You can now read from all of your sensors, so it’s time to put everything together!
Connecting the Bits
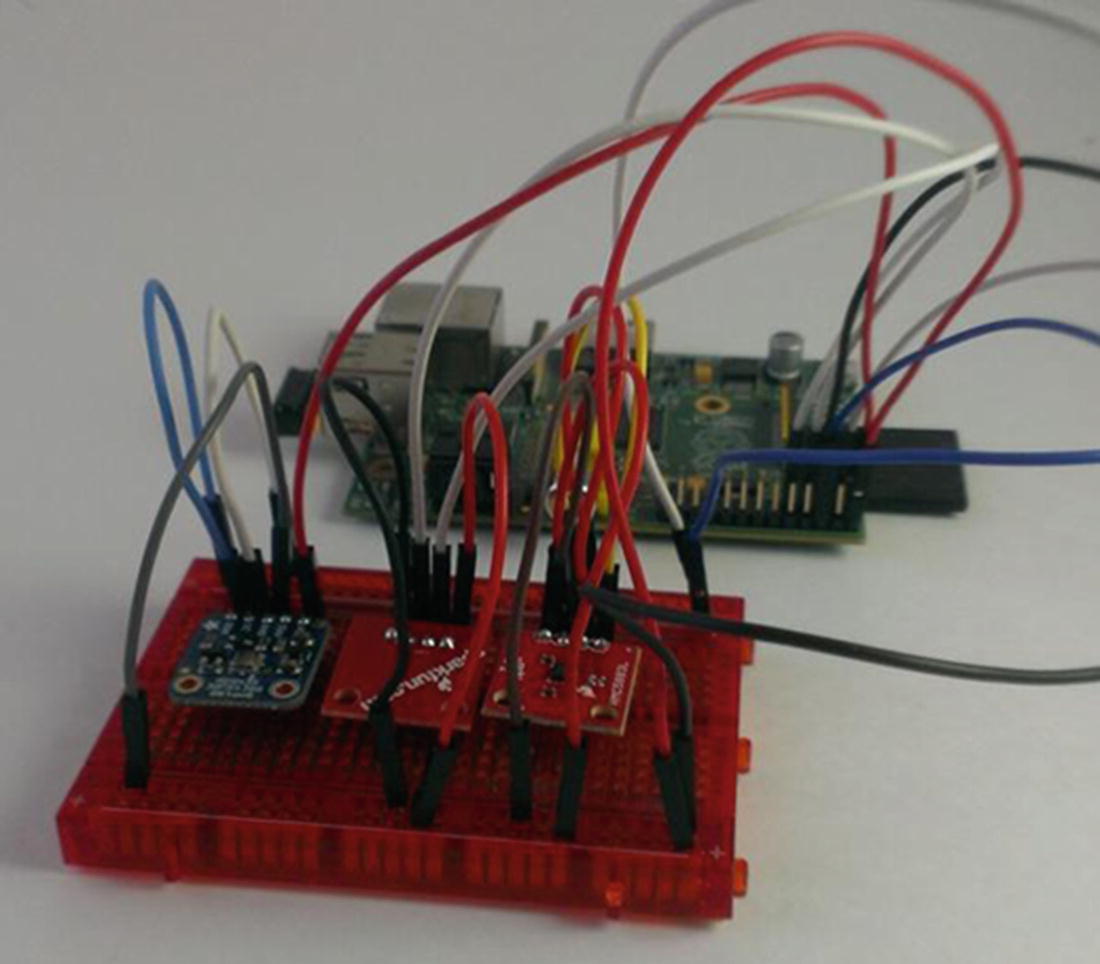
Breadboarded chips
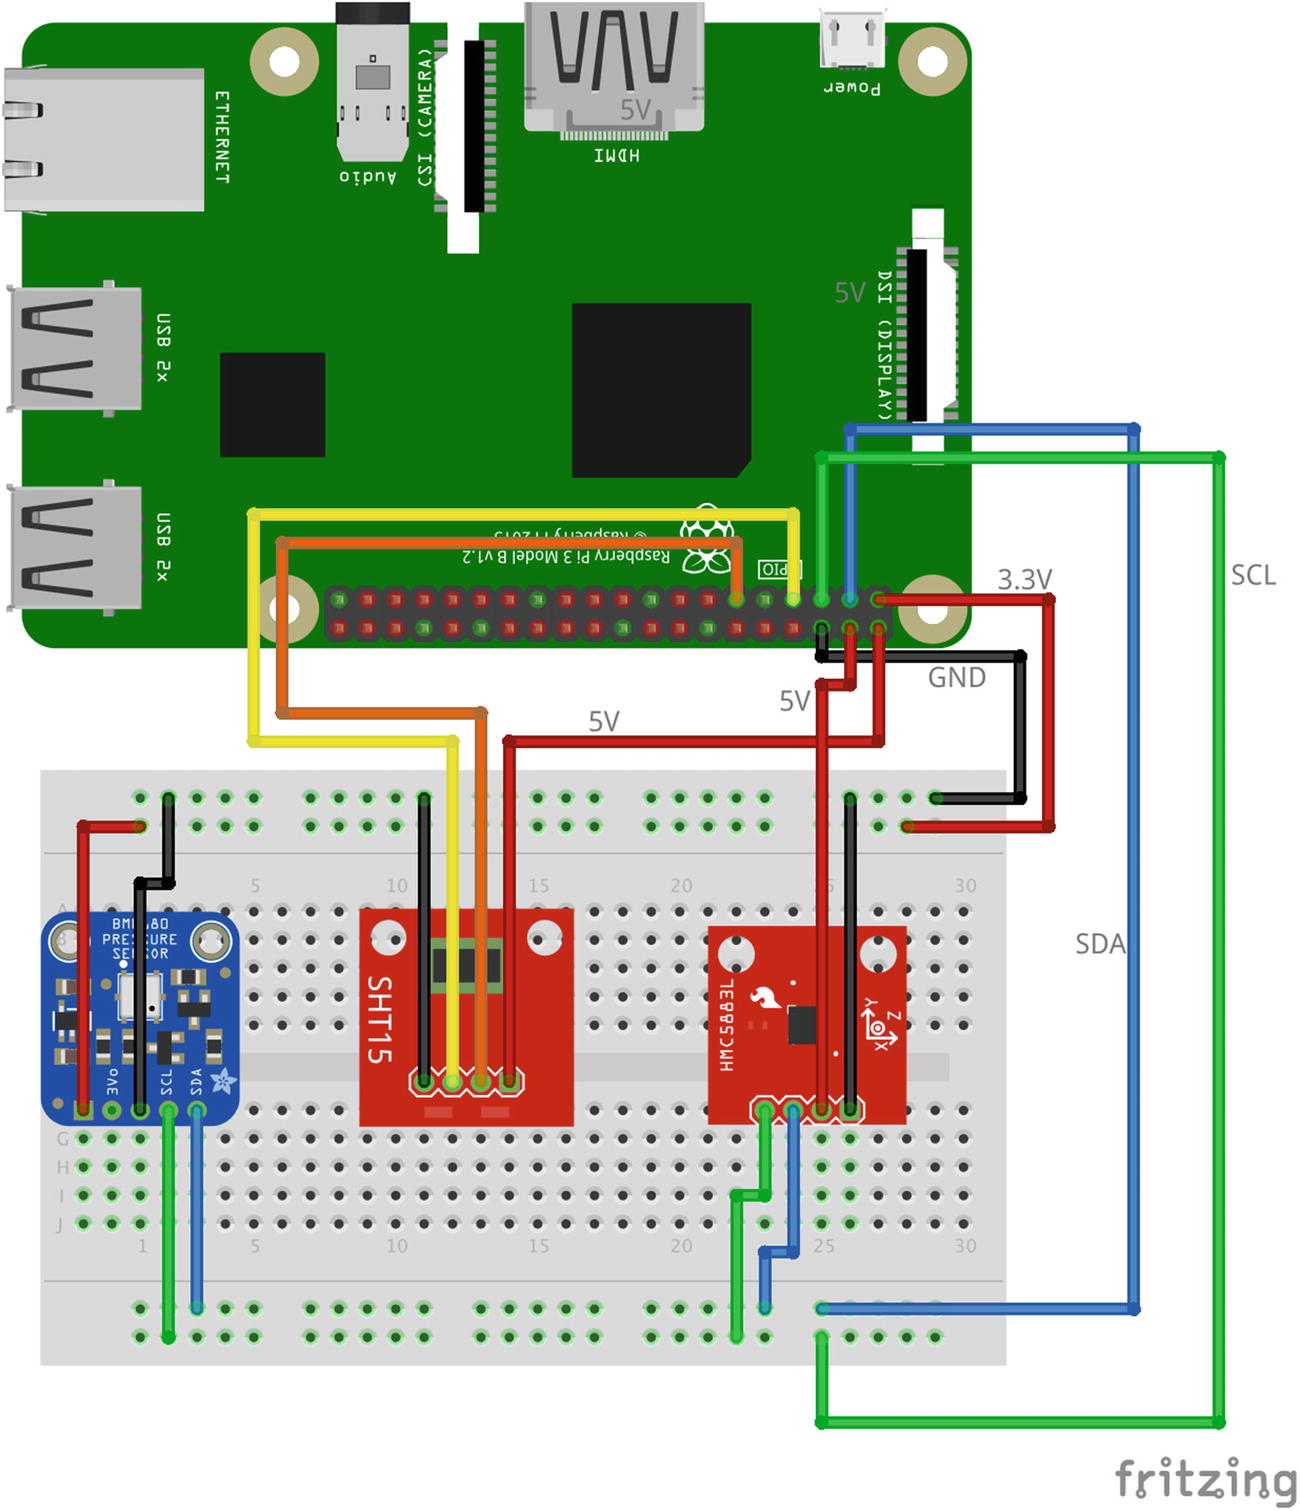
Wiring diagram
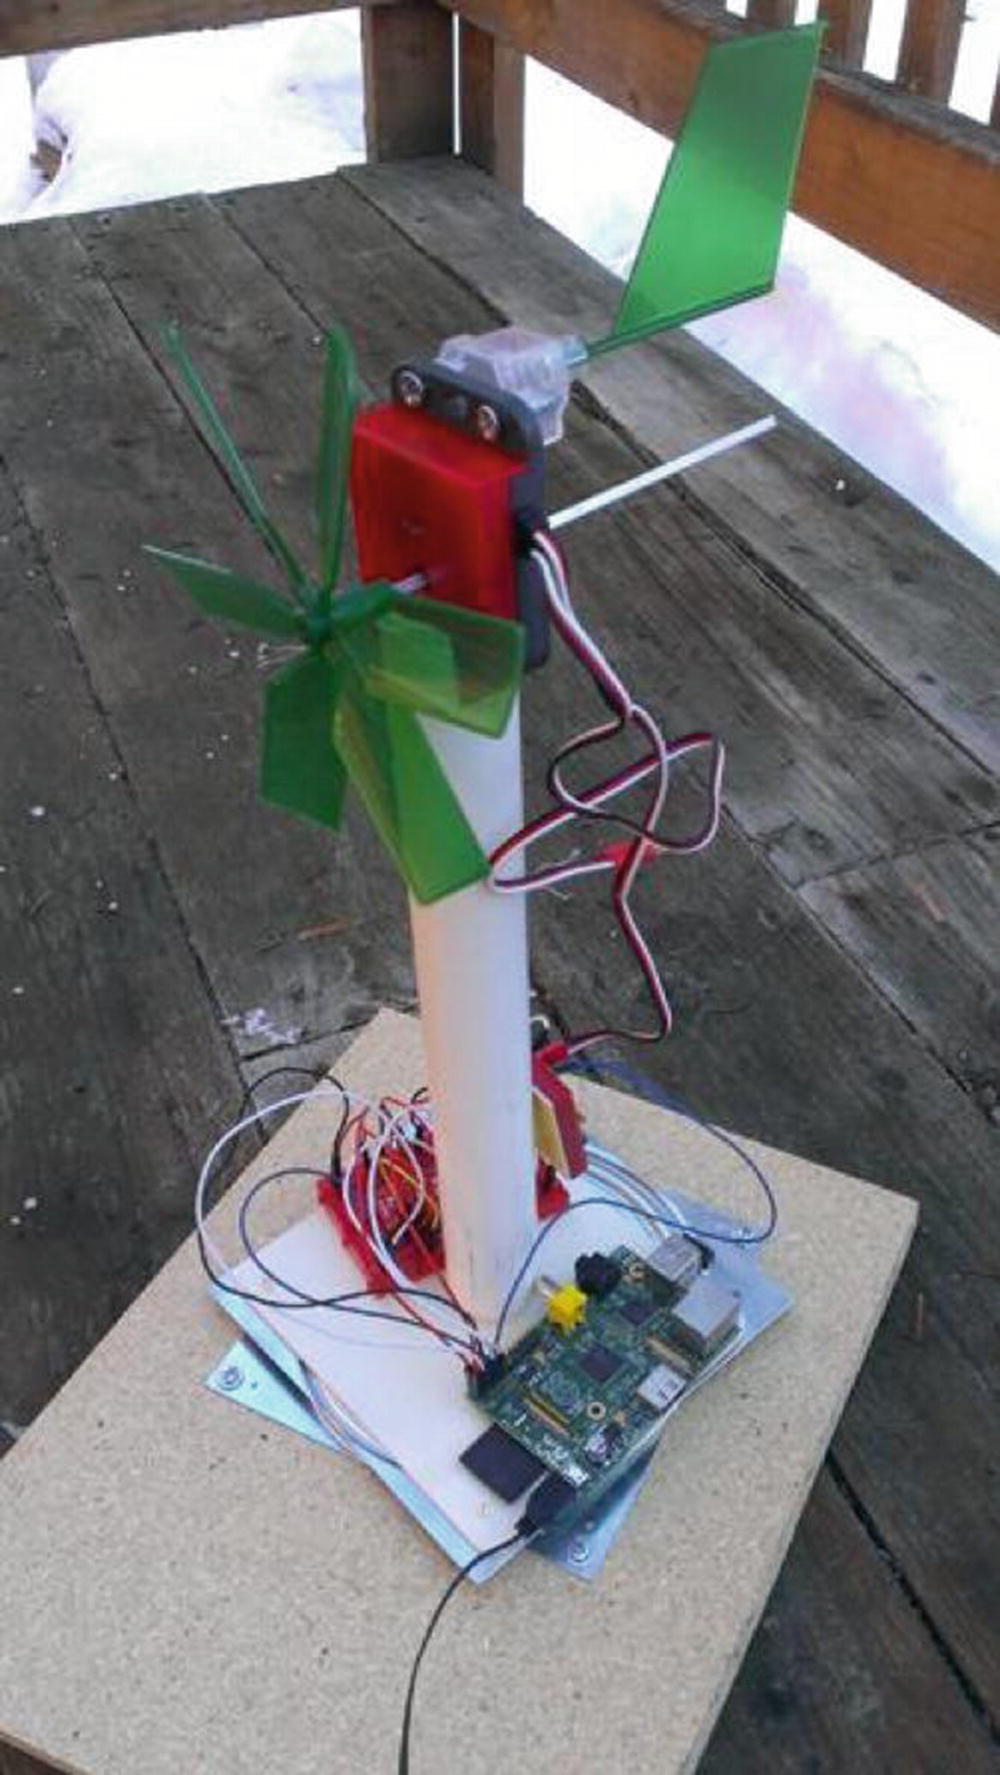
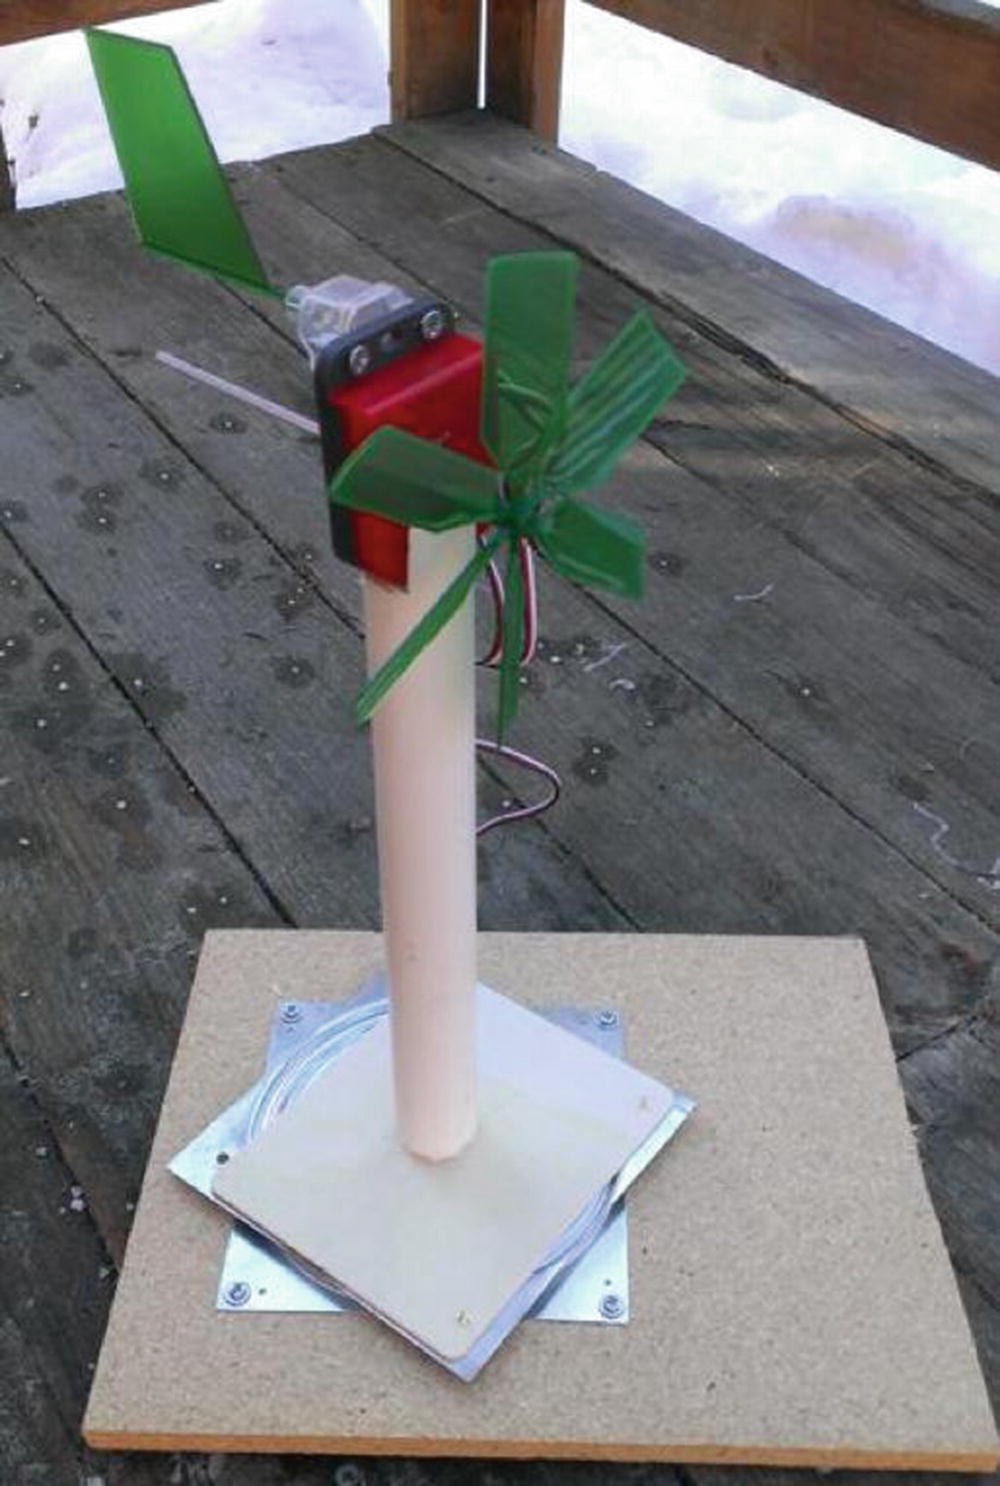
Completed weather station
We’ll write the code so that the Pi queries each sensor every 30 seconds and displays the results to the screen. See the final code in the next section.
The Final Code
The final code is available as weather.py from Apress.com.
Summary
In this chapter, you built a weather station from scratch and installed the necessary sensors to keep tabs on the weather happenings, including barometric pressure, temperature, humidity, wind speed, and even wind direction. You’ve learned more about the I2C interface and should now have a good grasp of how to use Python functions to repeat tasks at a given interval. You’ve also done a lot of fabrication; now you can take a break because the next project, the media server, requires no construction whatsoever!