Table of Contents for
Reverse Engineering Code with IDA Pro
 Reverse Engineering Code with IDA Pro
Published by
Syngress, 2011
Reverse Engineering Code with IDA Pro
Published by
Syngress, 2011
- Copyright
- Visit us at www.syngress.com
- About IOActive
- Contributing Authors
- 1. Introduction
- 2. Assembly and Reverse Engineering Basics
- 3. Portable Executable and Executable and Linking Formats
- 4. Walkthroughs One and Two
- 5. Debugging
- 6. Anti-Reversing
- 7. Walkthrough Four
- 8. Advanced Walkthrough
- 9. IDA Scripting and Plug-ins
It’s not uncommon to be presented with an executable where the protocol is either partially unknown or completely unknown. As a reverse engineer, it’s your job to either figure out the protocol for compatibility or to check a program for any hidden features that may cause security problems. In this chapter we’ll cover tracking a protocol through a binary and recovering its message structure.
Most protocols are streams of discrete messages meant to be interpreted individually. There are exceptions to this rule. HTTP, for instance, dumps off a mostly unstructured request and then gives an unstructured reply. FTP uses a text-based control channel and establishes a separate TCP session for each file transferred. These are in the minority of protocols you’ll have to reverse.
If a reverse engineer doesn’t have access to either of the executables, the protocol can be reversed from only the raw bytes on the wire. If a reverse engineer only has access to the binary without the ability to run it, the protocol can eventually be extracted from the executables. In most cases, the engineer will have access to both the binaries and a working implementation. A hybrid approach is the fastest way to solve the problem. The bytes on the wire give the reverse engineer a quick picture of how the protocol is structured, but, in the end, any features not exercised by the client or server will have to be extracted from the binary. If the reverse engineer has the time, the binary always gives the most accurate view.
Every protocol needs to know where one message ends and the following message begins. This is commonly referred to as framing. Most protocols can survive getting out of synchronization with the other end of the connection. If the sender thought a message was 30 bytes long and the receiver interpreted the message as 20 bytes long, the receiver might try to interpret the remaining 10 bytes as a new message, resulting in a corrupt message and the connection being dropped.
TCP/IP doesn’t guarantee a message will remain together as it makes its way across the Internet. The message may be broken up into smaller pieces along the way. The mechanics are unimportant to the programmer. What is important is that a single call to a read( ) function may return a whole message or some piece of the message. It might also include more than one message. It’s up to the application to make sure it has read a full message into the buffer before continuing. I’d like to be able to say that most programs do this well. Unfortunately, most programs you’ll encounter in the wild do a very poor job of reassembling and then parsing the messages.
Most small or quickly written programs will assume that messages are transmitted whole across the Internet. Their basic block diagram looks something like Figure 7.1.
If a message is broken up en route, the program will either crash while parsing the message or reject the message as incomplete, depending on how the function was implemented. Programs written this way still work surprisingly well. When a message is fragmented, the message is returned to the program broken across two reads from the socket. Both the messages are discarded as invalid, but the next message (if it wasn’t also broken up) will be received and processed correctly by the system.
A popular instant messenger client is among the programs that implement this kind of loop. Spotting these programs is easy. Simply bring up a proxy between the client and the server and break the messages up in small pieces. If the messages are ignored, you have a program that assumes the messages will be delivered as a unit.
Larger commercial programs often buffer reads into a read buffer and then shift the read buffer down as full messages are received. Their basic block diagram looks like Figure 7.2.
This is a perfectly correct loop and easy to trace through the system. The receive buffer tends to be allocated as a global or on the heap, and if it’s properly implemented works in all cases.
Protocols are self-similar, meaning that since operations are repeated over the life of the session, the bytes transferred over the wire also repeat. Nearly every protocol has a common protocol header. That header will appear in every message on the wire. At a minimum, the header will contain a length and a message type. The parser needs to know how big the current message is and how to parse it. The following list shows some of the fields often found in the base protocol header.
Magic Number
Sequence Number
Timestamp
Data or Section Lengths
Session ID
Number of Submessages
Error Code
Random Nonce
When starting to make sense of a protocol, it helps to have examples of the various packets in front of you for reference. I always print out the hex dumps so I can annotate them as I go. Below are the first few packets from the example used in this section. I’ve highlighted the packets going from the client to server in bold and the packets going from the server to the client in italic.
DE AD BE EF 00 18 01 00 76 B7 0B 5A 42 DD 54 B9 6B E8 1E 47 44 D9 67 C3 |
DE AD BE EF 00 18 02 00 C1 06 45 18 90 51 5D 71 44 46 D7 21 B6 4C 01 73 |
DE AD BE EF 00 18 01 00 45 EB 2E 08 42 68 22 72 60 E9 1B 32 16 FA 45 EB |
DE AD BE EF 00 18 02 00 2E 08 42 68 22 72 60 E9 1B 32 16 FA 40 AB 55 AD |
DE AD BE EF 00 18 01 00 64 D4 7F 88 7E E1 5A AA 21 46 49 3D E3 22 7E 1E |
DE AD BE EF 00 18 02 00 79 18 D2 6C D7 3D C9 61 60 7B 02 00 DC 4F 40 59 |
DE AD BE EF 02 08 03 01 AF 59 3E 31 ED 45 FD 02 E3 26 A1 1B 08 12 19 05 16 82 59 26 3B 90 77 |
DE AD BE EF 02 08 03 00 77 0D 33 A4 03 19 4D F1 62 F5 1F B2 20 CB 37 82 25 87 46 0E 6E 8A 56 |
DE AD BE EF 02 08 04 00 77 0D 33 A4 03 19 4D F1 62 F5 1F B2 20 CB 37 82 25 87 46 0E 6E 8A 56 |
DE AD BE EF 02 08 04 00 AF 59 3E 31 ED 45 FD 02 E3 26 A1 1B 08 12 19 05 16 82 59 26 3B 90 77 |
DE AD BE EF 00 08 01 02 00 00 00 00 |
At this point, we have no idea how many different types of messages are in this dump and we have no idea how long the base header is. Looking at it column by column, we can start making some guesses. The first four bytes have the same value in every packet. Since they spell DEADBEEF, we can safely assume that they’re a magic number at the beginning of the protocol. The shortest packet in this dump is 12 bytes long. It’s safe to say that the base header is smaller than the smallest message observed. That leaves us with the start of a structure that looks like this:
struct base_header{
       int MagicNumber;   /*Always 0xDEADBEEF*/
       char unknown1;     /*00,02*/
       char unknown2;     /*08, 18*/
       char unknown3;     /*01, 02, 03, 04*/
       char unknown4;     /*00,01,02*/
       char unknown5;     /*Lots of possibilities*/
       char unknown6;     /*Lots of possibilities*/
       char unknown7;     /*Lots of possibilities*/
       char unknown8;     /*Lots of possibilities*/
}
The packets have to be read off the network and into the program. There are a limited number of API calls that accomplish the task. The program can directly make the system calls itself, but that’s only encountered in malware. The place(s) where the packet is read off the wire is always a good place to start your analysis. The following is a list of common API calls capable of reading traffic off a network socket.
read/write
recv/send
recvfrom,/sendto
WSARecv/WSASend
WSARecvFrom/WSASendTo
ioctl
ioctlsocket
WSARecvDisconnect/WSASendDisconnect
WSARecvEx/WSASendEx
recvmsg/sendmsg
WSARecvMsg/WSASendMsg
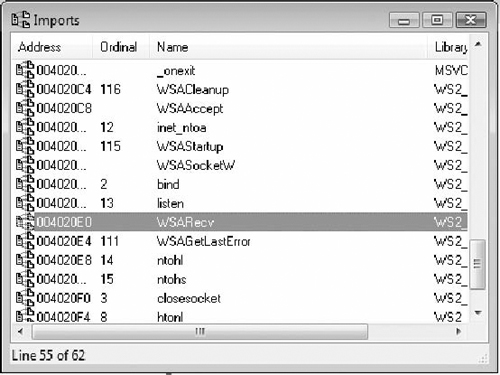
The import table of the executable only has a reference to WSARecv so that serves as in ideal starting point for the analysis of the protocol (see Figure 7.3). The WSARecv call reads the data into a buffer on the stack. It can read up to 0x4000 bytes in one read as shown in Figure 7.4.
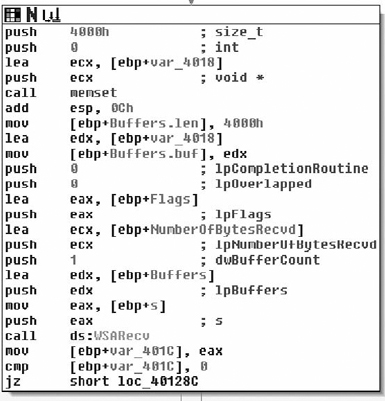
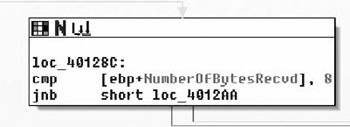
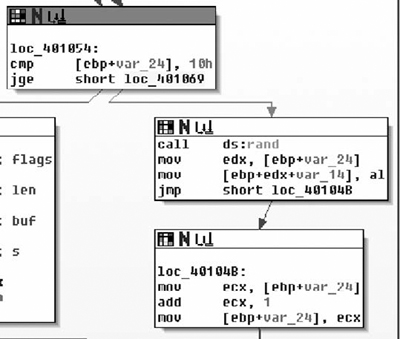
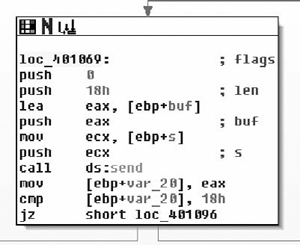
Right after reading into a buffer on the stack, the program immediately checks to see if the number of bytes read is less than eight. If it’s fewer than eight bytes, it jumps to the exit function, as shown in Figure 7.5.
It then checks the first four bytes to see if they’re DEADBEEF. That matches the magic number from the dump (the first four bytes) nicely. The bytes read off the wire are passed through ntohl( ) before they’re compared. This means the wire protocol is big-endian. It will also help to determine the size of fields. The program will need to byte-swap all two- and four-byte fields before processing them, as shown in Figure 7.6.
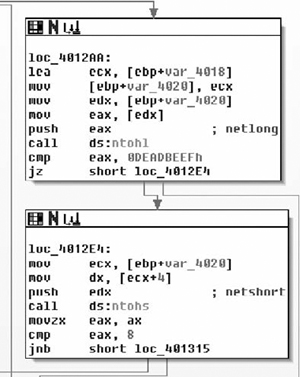
If it passes the DEADBEEF test, it takes the next two bytes and checks to see if they’re less than eight. Packets with a small number are discarded. We now know that the two bytes following the magic number are a unit and they always have to be greater than eight. With the information obtained from these two basic blocks, the structure diagram can be updated. The number corresponds with the length of the packet, so for now I’ll label the two-byte field as the length field.
struct base_header{
int MagicNumber; /*Always 0xDEADBEEF*/
unsigned short Len; /*0018,0208*/ /*Greater than 8*/
char unknown3; /*01, 02, 03, 04*/
char unknown4; /*00,01,02*/
char unknown5; /*Lots of possibilities*/
char unknown6; /*Lots of possibilities*/
char unknown7; /*Lots of possibilities*/
char unknown8; /*Lots of possibilities*/
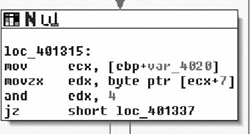
}After the length check, the processing function pulls a single byte at offset 7 into a register and uses the and instruction against the result. Whenever a field pulled out of the protocol is passed to bitwise and or or operators, and the operand is a constant, it’s a good bet that the target is a bitfield of some sort. In this case, if the third bit is set, the process stops processing the packet. It’s safe to say that byte 7 is a bitfield and the constant 0x04 is invalid, as shown in Figure 7.7.
The updated struct looks something like:
struct  base_header{
        int MagicNumber;       /*Always 0xDEADBEEF*/
        unsigned short Len;    /*0018,0208*/ /*Greater than 8*/
        char unknown3;         /*01, 02, 03, 04*/
#define FLAG_NONE              0x00
#define FLAG_INVALID           0x04
        char Flags;            /*00,01,02*/
        char unknown5;         /*Lots of possibilities*/
        char unknown6;         /*Lots of possibilities*/
        char unknown7;         /*Lots of possibilities*/
        char unknown8;         /*Lots of possibilities*/
}
From the packet dump, we saw that two other flags were set. In most flags an empty bitfield means “do nothing,” so as a placeholder, zero is defined as FLAG_NONE. That leaves at least 0x01 and 0x02 as valid flags in the protocol.
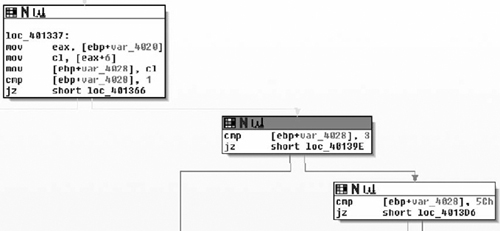
Next up, the binary takes byte 6 and stores it into a stack variable. It compares the stack variable to three possible values: 0x01, 0x03, and 0x5C. In the dump, we’ve seen 0x01 through 0x04, but only 0x01 and 0x03 are packets destined for the server. It would seem that 0x02 and 0x04 are client→server constants while 0x01, 0x03, and 0x5C are server→client constants. All other values aren’t processed, as shown in Figure 7.8.
Depending on the value of unknown3, the binary will call one of three functions. The prototype for each of the called functions is the same. The first parameter is a pointer to the raw packet we sent on the wire. The second is the number of bytes read from the network, and the third is the socket handle the packet was read from, as shown in Figure 7.9.
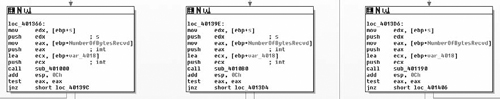
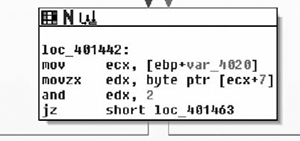
Later in the tutorial, we’ll reverse each of the three functions. For now, we’ll finish out the logic of the current function. The final two comparisons are both against the flag field. The binary uses a bitwise and to check for the 0x01 bit. If the bit is set, the thread goes to sleep for 1000 ms, as shown in Figure 7.10.
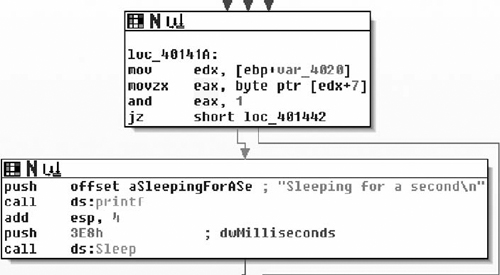
The last check before the end of the processing loop is another bitwise and checking for the 0x02 bit in the bitfield. If the bit is set, the processing loop exits, as shown in Figure 7.11.
That completes the main parsing loop of the example server. Since we didn’t do anything with the other bytes in the struct, it can be safely assumed that they aren’t part of the base header in the protocol and those bytes belong to some deeper part of the protocol. The final structure appears in the code below.
struct  base_header{
        int MagicNumber;        /*Always 0xDEADBEEF*/
        unsigned short Len;     /*0018,0208*/ /*Greater than 8*/
#define PACKET_SERVER_01        0x01
#define PACKET_CLIENT_02        0x02
#define PACKET_SERVER_03        0x03
#define PACKET_CLIENT_04        0x04
#define PACKET_SERVER_5C        0x5C
        char PacketType;        /*01, 02, 03, 04*/
#define FLAG_NONE               0x00
#define FLAG_SLEEP              0x01
#define FLAG_PROCESS_AND_EXIT   0x02
#define FLAG_INVALID            0x04
        char Flags;             /*00,01,02*/
}
For this simple protocol, all we’re left with is to figure out what each of the three message types are for. The server processes messages of type 0x01, 0x03, and 0x5C. The 0x01 message is as good a place to start as any other, since we’re trying to reverse the entire protocol.
The function at 0x00401000 handles messages of type 0x01. Three parameters are passed to it: a pointer to the stack buffer containing the full message, the number of bytes read, and the socket it was read from, as shown in Figure 7.12.
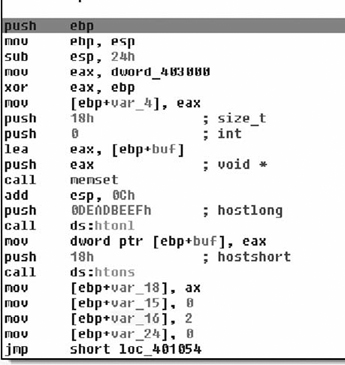
The first thing you should notice is that the function never touches the buffer or the length fields passed into it. It jumps straight to constructing another message in a local stack buffer. It first zeros the buffer with memset, then byte-swaps the magic number (DEADBEEF) and stores it in the buffer. Then it byte-swaps and stores a 0x18 in the length field, a 0x02 in the type field, and a zero in the flags field. Then it fills the next 0x10 bytes with random values, as shown in Figure 7.13.
Finally it writes it out to the socket, as shown in Figure 7.14.
Basically, this generates a predetermined packet and returns it to the caller. The contents of the message received aren’t taken into account. We now know the bytes after the header in the calling packet are ignored and the bytes following the 0x02 message are just random values.
struct base_header{
int MagicNumber; /*Always 0xDEADBEEF*/
unsigned short Len; /*0018,0208*/ /*Greater than 8*/
#define PACKET_GETRANDOM 0x01
#define PACKET_RANDOM 0x02
#define PACKET_SERVER_03 0x03
#define PACKET_CLIENT_04 0x04
#define PACKET_SERVER_5C 0x5C
char PacketType; /*01, 02, 03, 04*/
#define FLAG_NONE 0x00
#define FLAG_SLEEP 0x01
#define FLAG_PROCESS_AND_EXIT 0x02
#define FLAG_INVALID 0x04
char Flags; /*00,01,02*/
}
struct packet_get_random{
struct base_header BaseHeader;
char Ignored[16];
}
struct packet_random{
struct base_header BaseHeader;
char RandomValues[16];
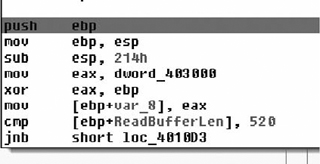
}The next message is processed by the function at 0x004010B0. It’s passed the same three parameters as the packet above: a pointer to the message buffer, the message buffer length, and the socket the message was read from.
The first thing it does is to make sure the message length is at least 520 bytes, as shown in Figure 7.15.
The entire processing of this packet is done in a single basic block, as shown in Figure 7.16.
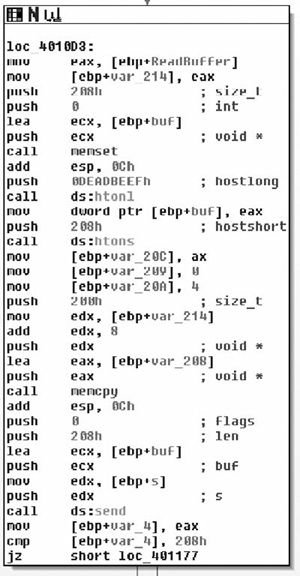
The basic block zeros a stack buffer with memset. Then it byte-swaps the magic number (DEADBEEF) and stores it in the first four bytes of the buffer. It sets the byte-swapped length to 0x208, the type to 4 and the flags to zero. Then it copies 512 bytes from the incoming packet and puts it in the outgoing packet.
struct  base_header{
        int MagicNumber;           /*Always 0xDEADBEEF*/
        unsigned short Len;        /*0018,0208*/ /*Greater than 8*/
#define PACKET_GETRANDOM           0x01
#define PACKET_RANDOM              0x02
#define PACKET_ECHO                0x03
#define PACKET_ECHOREPLY           0x04
#define PACKET_SERVER_5C           0x5C
        char PacketType;           /*01, 02, 03, 04, 0x5C*/
#define FLAG_NONE                  0x00
#define FLAG_SLEEP                 0x01
#define FLAG_PROCESS_AND_EXIT      0x02
#define FLAG_INVALID               0x04
        char Flags;                /*00,01,02*/
}
/*must  be 520 bytes long or longer*/
struct  packet_get_echo{
        struct base_header BaseHeader;
        char RandomData[512];
}
struct  packet_echoreply{
        struct base_header BaseHeader;
        char EchoData[512];
}
The last message (type 0x5C) is handled by the function at 0x00401190. It’s passed the same three parameters as the other message handlers: a pointer to the message, the message length, and the socket the message came in on. The message is handled in a single basic block, as shown in Figure 7.17.
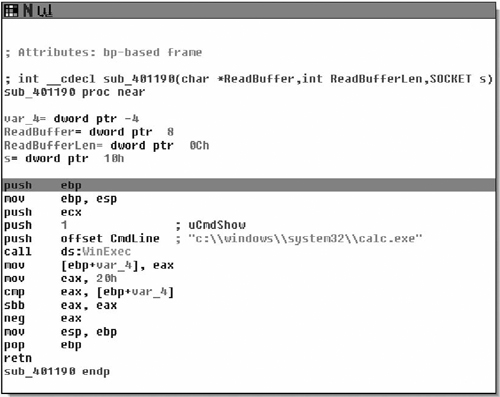
It looks like this message spawns a calculator. The final protocol description is given below.
struct  base_header{
        int MagicNumber;         /*Always 0xDEADBEEF*/
        unsigned short Len;      /*0018,0208*/ /*Greater than 8*/
#define PACKET_GETRANDOM         0x01
#define PACKET_RANDOM            0x02
#define PACKET_ECHO              0x03
#define PACKET_ECHOREPLY         0x04
#define PACKET_CALC              0x5C
        char PacketType;         /*01, 02, 03, 04, 0x5C*/
#define FLAG_NONE                0x00
#define FLAG_SLEEP               0x01
#define FLAG_PROCESS_AND_EXIT    0x02
#define FLAG_INVALID             0x04
        char Flags;              /*00,01,02*/
}
struct  packet_get_random{
        struct base_header BaseHeader;
        char Ignored[16];
}
struct  packet_random{
        struct base_header BaseHeader;
        char RandomValues[16];
}
/*must  be 520 bytes long or longer*/
struct  packet_get_echo{
        struct base_header BaseHeader;
        char RandomData[512];
}
struct  packet_echoreply{
        struct base_header BaseHeader;
        char EchoData[512];
}
struct  packet_calc{
        struct base_header BaseHeader;
}
The protocol description above should be enough to implement a client. We’re now also sure that this is all of the functionality of the server—there are no hidden uses the server can be put to.
The example used in the first part of this section is a simple one. There are only a few functions and all of them directly deal with the protocol. Reverse engineering the entire program is feasible for the example, but it’s rare that a reverse engineer will have the luxury of reversing an entire program. It’s easy to find the functions to tear apart when a program’s call tree looks like Figure 7.18.
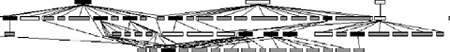
It’s much more difficult when the call tree looks like Figure 7.19.
The first question the reverse engineer must answer is which of the functions in this monstrous graph are used in processing messages and which ones are ignored. The most common method of picking which functions to reverse engineer is referred to as hit marking.
The basic concept behind hit marking is to record the path through the decision tree that each message takes. A breakpoint is set at the beginning of each function or basic block. When a breakpoint is reached, the program notes that the function was accessed and lets the program continue on to the next function. After the message has been fully processed, the list of breakpoints that were hit is sorted and duplicates are removed. This list is referred to as a hit list. By analyzing just the functions on the hit list, the reverse engineer should have an understanding of the structures that make up that particular message.
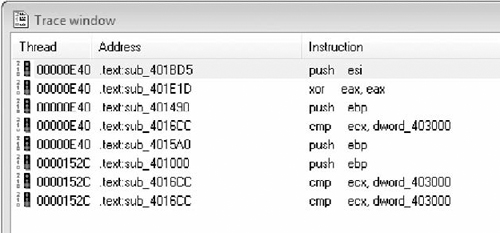
Figure 7.20 shows a short trace from IDA before duplicates are removed.
Unfortunately, IDA doesn’t have a good mechanism for building hit lists. A number of third-party plug-ins and applications can be purchased to make the process more useful and less painful, but we’re going to stick to pure IDA. The rest of this chapter will walk through developing a hit list.
The first thing you’ll need to build a hit list is a list of all the functions in the program. If you happen to have a way of removing functions that you know you’re not interested in, then by all means remove them. To obtain a list of functions, open your binary in IDA and open the function window (shift-f3). Right click and select copy (or hit ctrl-ins). IDA will copy the list of functions to the clipboard. Paste the list of functions into your favorite editor. You’ll get a list something like:
_IID_ISAXErrorHandler       .text 01001308 00000010 R . . . . . .
_IID_IXMLDOMDocument2       .text 01001318 00000019 R . . . . T .
_IID_ISchemaElement         .text 01001338 00000009 R . . . . . .
_IID_ISchemaAttribute       .text 01001348 00000009 R . . . . . .
_IID_ISchemaModelGroup      .text 01001358 0000000D R . . . . . .
_IID_ISchemaComplexType     .text 01001368 0000000D R . . . . . .
_IID_ISchemaType            .text 01001378 0000000D R . . . . . .
_IID_ISchemaItem            .text 01001388 00000009 R . . . . . .
_IID_ISAXAttributes         .text 010013A8 00000010 R . . . . . .
Use your text edit to remove everything but the function addresses. It should look something like:
01001308
01001318
01001338
01001348
01001358
01001368
01001378
01001388
010013A8
The IDA debugger has a built-in mechanism for tracing. It can be accessed from the Debug|tracing window or you can right-click on any instruction and add an execution trace. Theoretically, you could manually run through your entire function list and manually add a trace to each breakpoint. Four days later, your boss will probably fire you.
To efficiently add tracepoints to each function, we need to write a quick IDA plug-in. IDA plug-ins can be written in C, ruby, or python. Programming language holy wars aren’t a good thing, so I’m going to sidestep the issue and just write the plug-in in python because I wanted to (not because python is better). You can get the python plug-in from www.d-dome.net/idapython/. Just follow the instructions to install it.
What we want the plug-in to do is to automate setting all those hundreds of tracepoints. As a simple example, you can set a breakpoint at 0x004011E8 with just a few lines of python. Create a file with the following content:
#Set a breakpoint at 0x004011E8
from idautils import *
ea=ScreenEA()
ea=0x004011E8
add_bpt(ea, 1, 4)
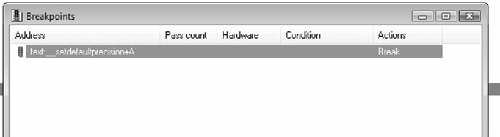
Now run the file by hitting alt-9 and selecting it from the dialog box. (The file has to end in .py if you’re using the python bindings.) A breakpoint should now be set at 0x004011E8. You can check to see if it worked by looking at the breakpoints window in Figure 7.21. The hotkey for the breakpoints window is ctrl-alt-B.
The new breakpoint is set to break. What we want is for it to create a log entry every time the breakpoint is hit. In IDA terminology, that’s a trace instead of a break. Actually, tracing and breaking aren’t mutually exclusive. You can set it to stop execution (break) when it hits the breakpoint and log the event (trace) at the same time. Since we’re just looking for which functions are executed when processing a particular message, we want all the breakpoints set to trace. We have to remove the break flag and add the trace flag from the structure. The following code adds a breakpoint at 0x004011E8 and sets it to trace.
from idautils import *
ea=ScreenEA()
ea=0x004011E8
add_bpt(ea, 1, 4)
bp=bpt_t()
get_bpt(ea, bp)
bp.flags^=BPT_BRK
bp.flags|=BPT_TRACE
Now that we can set a tracepoint anywhere in IDA, with the list of function addresses from before, it’s a simple task to add a loop and set a tracepoint at the beginning of each function.
from idautils import *
funclist=[0x004011F2, 0x00401200, 0x00401206]   /*add all the other
addresses here*/
ea=ScreenEA()
for i in funclist:
      ea=i
      add_bpt(ea, 1, 4)
      bp=bpt_t()
      get_bpt(ea, bp)
      bp.flags^=BPT_BRK
      bp.flags|=BPT_TRACE
For those cases where it’s necessary to mark absolutely every function as a tracepoint, the IDA plug-in can be automated to find every function reference instead of doing it manually. In practice, you’ll probably have a number of functions you want to eliminate off the bat, so the example above will be used more than the fully automated one. Just for completeness, here’s a python snippet that automates setting a tracepoint at every function.
from idautils import *
# Loop through all the functions and add a breakpoint
for i in range(get_func_qty()):
    f=getn_func(i)
    print "Function %s at 0x%x" % (GetFunctionName(f.startEA), f.startEA)
    add_bpt(f.startEA, 1, 4)
#change all the breakpoints to trace-only
for i in range(get_bpt_qty()):
    b=bpt_t()
    getn_bpt(i, b)
    b.flags^=BPT_BRK
    b.flags|=BPT_TRACE
    update_bpt(b)
Now that there’s a tracepoint set at the beginning of each function, simply run the client program to generate a hit list.
Small examples don’t really get the point across, so a larger program is in order. I’m going to use Pidgin as an example (www.pidgin.im). Pidgin is a popular open-source chat program that supports most of the popular protocols. Since it’s open source, you can compare the disassembly against the binary if you get lost.
In this example, I’m going to generate a hit list against Pidgin v2.1.1 for Windows. Pidgin implements each protocol as a plug-in. I just picked the Yahoo! Instant Messenger plug-in at random. The protocol logic is implemented in libyahoo.dll. The call graph of the DLL is large and complex. Graphing it in IDA gives a blob that can’t be interpreted by humans, like the graph in Figure 7.22. (Or at least by humans that ever leave the house.)
In this example, I’m going to mark every function as a tracepoint with the script in the previous section. There are 549 functions in the DLL. For the first pass, I’m only interested in the functions used during initialization and login. The hit list should narrow the scope down considerably from the 549 functions to something more manageable.
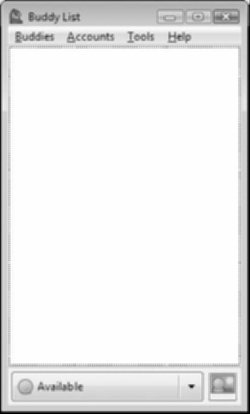
First, create an account on Yahoo! and log onto it with Pidgin to make sure everything is up and working. Next open libyahoo.dll in IDA and set the Debugger→Process Options to run Pidgin when the debugger is launched. Finally, invoke the script from the previous section with alt-9 to mark every function as a tracepoint. Tell IDA to run and go get a cup of coffee. Running the executable under IDA’s debugger takes considerably longer than running the executable without the debugger. When the bar at the bottom of the window says Available, Pidgin has finished logging in, as shown in Figure 7.23.
Now we can take a look at the trace window and determine which functions were involved in connecting to Yahoo!. At most we’ll have to reverse engineer this set of functions to figure out the login portion of the protocol so it gives us a good upper bound on the amount of work ahead of us.
The trace window (Debugger|Tracing|Trace Window) lists the functions in the order they were called. The breakpoint list (Debugger|Breakpoints|Breakpoint List) is closer to a true hit list. It lists each breakpoint and a count of the number of times that breakpoint was invoked, as shown in Figure 7.24.
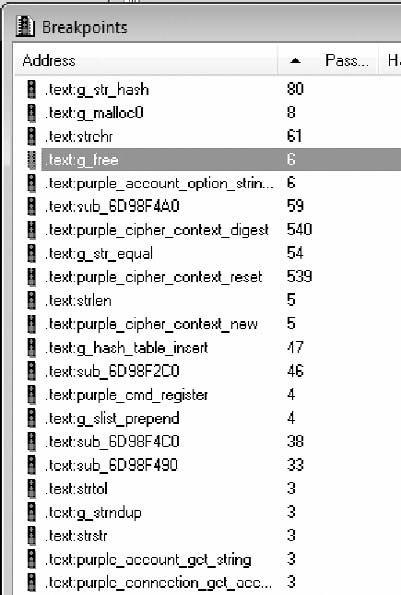
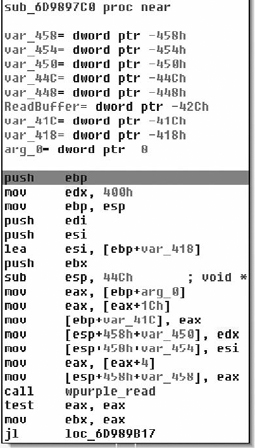
If we eliminate all the functions that didn’t get called at least once, we’re down to 133 functions. That cuts our search space down to 24% of the original. Many of the functions in the list are wrapper functions that simply call another function in the list. I like to start with the functions that are called often, but not hundreds of times. Just glancing at each of the functions, you should fairly quickly come to the function shown in Figure 7.25.
It’s always good to have dumps of the protocol in front of you for comparison. This is the first message my client sent to the server in hex.
59 4D 53 47 00 0F 00 00 13 00 57 00 00 00 00 00 00 00 00 31 C0 80 69 64 61 70 6C
75 67 69 6E 31 32 33 34 35 C0 80
The call to wpurple_read makes this function a good candidate to start reverse engineering. The function copies the data into another buffer, makes sure it’s longer than four bytes, and then drops into the main processing blocks. The first protocol processing block is shown in Figure 7.26.
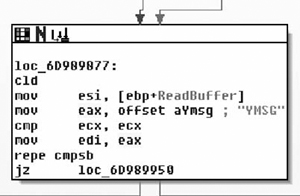
It compares the first four bytes of the read buffer to the string “YMSG” and exits if it doesn’t match. The YMSG must be used as a magic number, as shown in Figure 7.27.
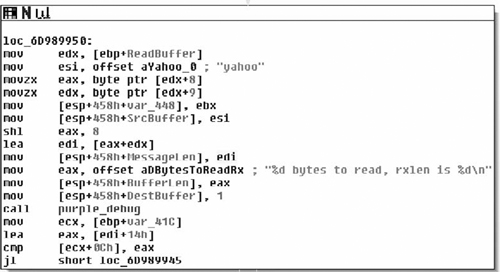
The next check looks like a length field. It pulls bytes 8 and 9 out of the packet, shifts byte 8 to the left, and adds them together. So we can guess that the length field is a big-endian short. That leaves our structure something like:
struct login_packet{
       char Magic[4];         /*Always YMSG*/
       char unknown1;
       char unknown2;
       char unknown3;
       char unknown4;
       unsigned short Len;    /*Big Endian*/
}
The process and number of function calls involved is greater in the Yahoo! Instant Messenger protocol than in the example protocol used earlier in the chapter, but extracting the protocol from the binary is the same. Input comes from a read and then is processed through a set of function calls. With a little work, you should be able to reverse the rest of the protocol.