As I said earlier, this program really isn’t malware per se but rather ad-ware (it’s at least somewhat safer that way), but it is a real program that you can expect to find in the wild, especially if you work on an incident response team or similar. Furthermore, many people would include usage of tools like regmon, filemon and so on, and these applications have valid use especially in the business world where it’s always a race against time. However, that’s not reverse engineering, we’re engineers not fortune tellers and if given the time there is really no reason to have to do this, you know what the program is doing while it does it, so there should rarely be a technical reason to have to use these tools, unless you’re not actually reversing the binary. The other reason for this is that doing things like that is borderline dangerous, you let the program have control and you really can’t know what it did, there is nothing that says you need to touch the filesystem, or registry, or standard API. Ultimately, if given the right application these methods will fail, plus this is a reverse engineering book. That said, you should probably know how to use these tools as there will be any number of times where the time allocated by management just won’t allow you to do the job correctly-time is money. Without further ado though, let’s just right into the application and start looking at it. You can download this code from www.syngress.com/solutions. The password to open the file (courtesy of Dan Kaminsky) is ‘!DANGER!-INFECTEDMALWARE!DANGER!’.
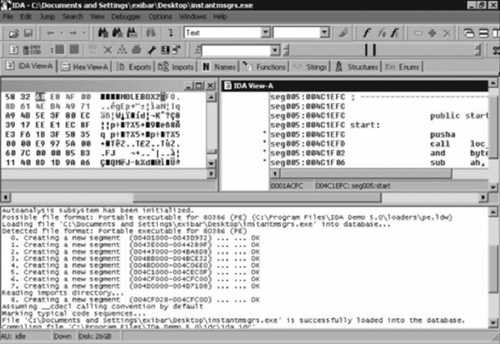
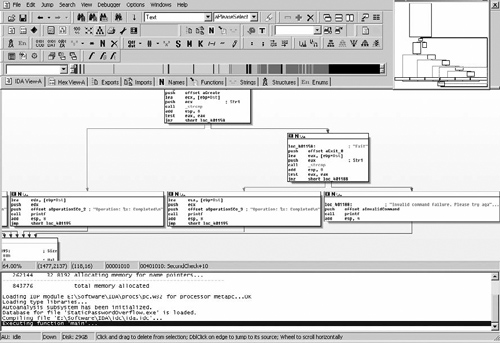
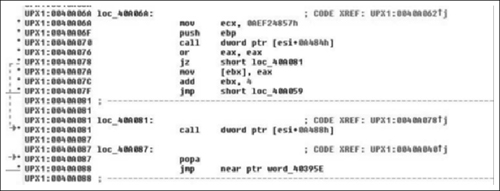
Now as we examine the beginning of this code, it’s pretty obvious that this is a non-standard entry, this is usually a sign of self-modifying code in some form or fashion, often its evidence of a packer. We have at least three tell-tale hints in this section. The first and most obvious is the name of the section we’re in is UPX1, which is standard for a program packed with UPX. The next is the hexadecimal data preceding our entry point. This is pretty typical for both packed and encrypted code/strings/et cetera, and finally the last sign—and this one takes a little bit (but not a lot) of experience, is the pusha instruction. UPX is trivial to bypass as it saves all the registers with a pusha, then restores them with a popa followed by an unconditional jump. Thus it’s just a matter of breaking at the popa/jmp and then continuing from there or dumping the data to disk. We really should confirm that what we expect is what’s actually going on. We can do this by examining the code and/or single-stepping through it, and then confirming that the popa/jmp combination is actually present. You would normally do the first by examining control flow; dynamically if necessary. We’re not going to do that here because there is really no point in including 15 pages of me single stepping through UPX unpacking an application to confirm that control doesn’t jump off into someplace weird. I wouldn’t recommend doing that in general, and overall I would highly advise doing analysis in VMware or something similar.
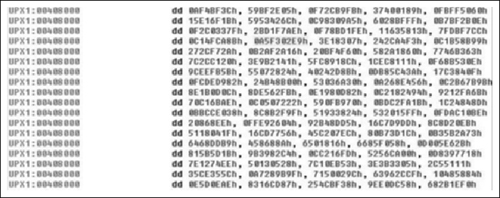
As we can see in Figure 8.1, what we expected is there exactly- at loc_40A081. We have the popa/jmp instruction. Typically, in order to use IDA’s unpacker plug-in we would need the Original Entry Point (OEP). However, because UPX wasn’t exactly made to be obfuscated/used for malicious software, the OEP is obvious and is word_40395E, let’s just take a quick look at that address and just make sure this is an address that makes sense. (See Figure 8.2).
Looking at this address, it points into an offset into the long sequence of hexadecimal characters, which is exactly what we expect as the entry point doesn’t typically point to the very beginning of the original file. So having a reasonable assurance that what we’re looking at actually is UPX, let’s see if we can get it unpacked. All recent versions of IDA (since 4.8) include a plug-in that is supposed to perform universal unpacking. We’re going to briefly walk through that just in case you’re not familiar with it. However, just like the previous chapter we’re not going to get into unpacking too much.
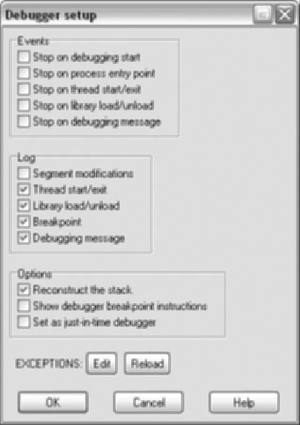
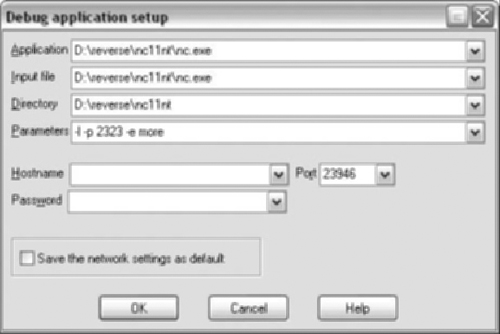
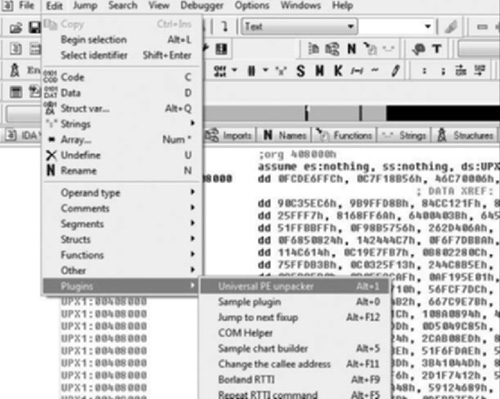
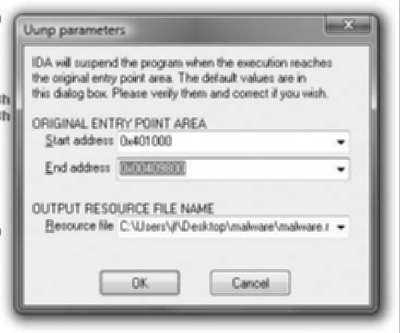
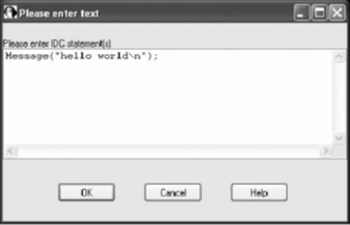
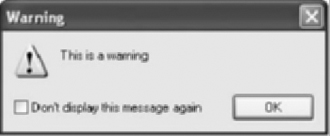
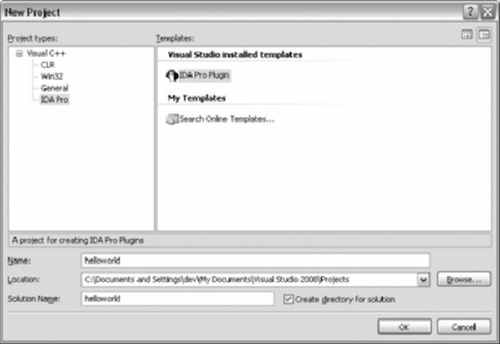
From inside of IDA, getting to the plug-in is pretty simple, it can be found under Edit > Plugins > Universal PE unpacker or you can simply hit Alt+1 (see Figure 8.3). From there, a warning letting you know that if you’re not careful you could own yourself is displayed, and the dialog seen in Figure 8.4 appears.
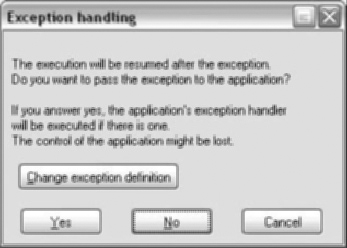
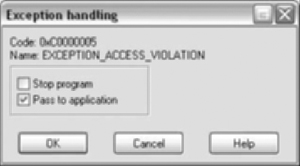
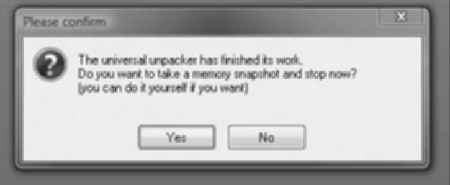
As you can see, knowing the exact OEP is not entirely necessary. Basically, this technology is not very advanced in the sense that the debugger doesn’t know what it’s doing. All it does is watch for execution in the range including/between Start Address and End Address. In this case, I modified the default End address parameter to reflect our binary and then clicked OK. When IDA detects that the necessary conditions have been met, it prompts you with the dialog shown in Figure 8.5.
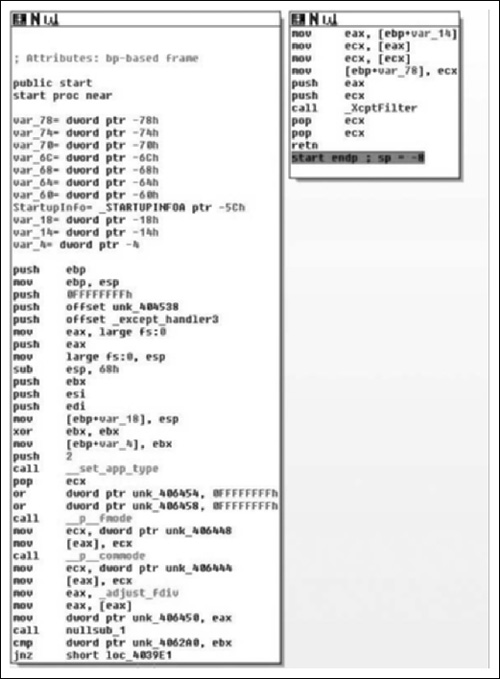
Once OK is clicked, IDA terminates the debugger and does a lot of stuff in the background for you. For example it rebuilds the imports, reanalyzes code flow, et cetera. Once all of that is complete we’re looking at the unpacked version of the code, which is a bit closer to what we expect to see (Figure 8.6).
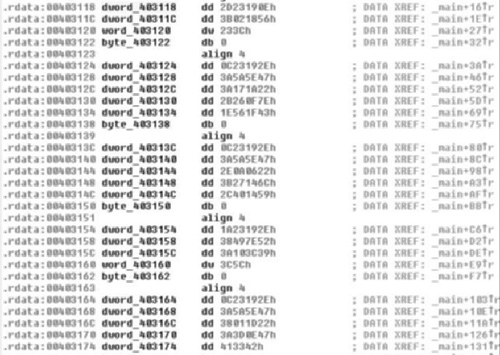
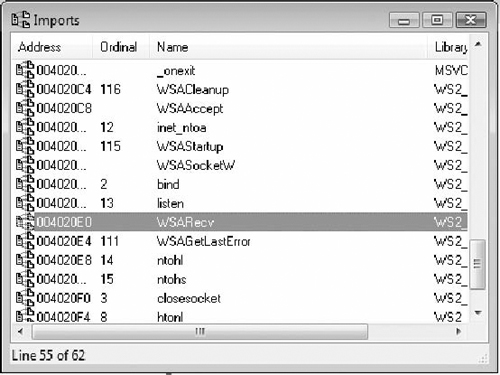
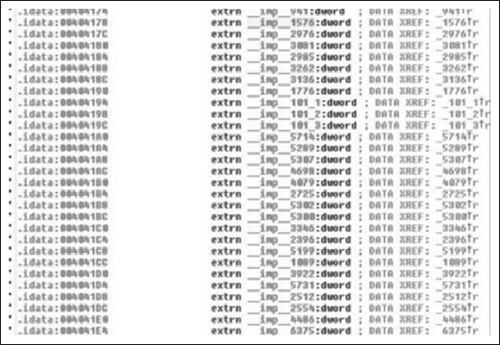
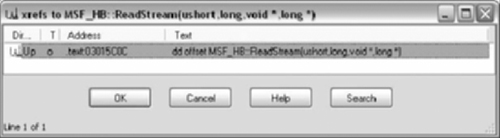
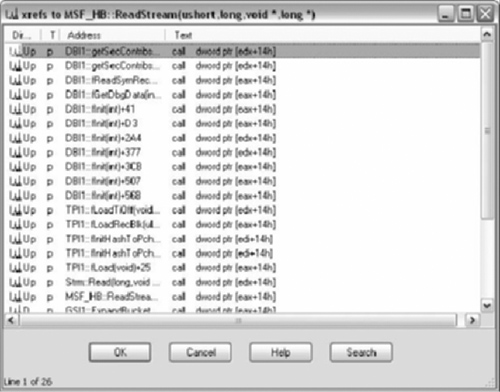
Examining the code, we see a typical routine entry, however if you note references to routines like nullsub_1, and if you were to dig a bit deeper you’d find references like those shown in Figure 8.7.
As you can see, IDA has not reanalyzed all of the imported functions. This happened because the FLIRT signatures that IDA typically runs over the code were not applied. This is not a huge issue because we can do it ourselves without much effort. If you’re unfamiliar with this, that’s okay, as we’re going to talk about it some.
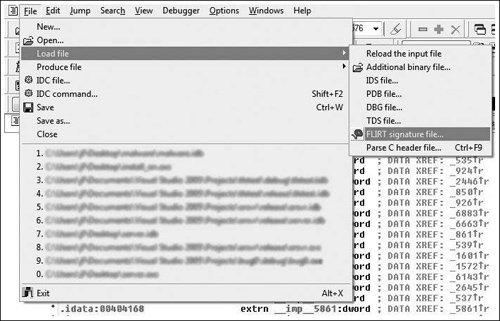
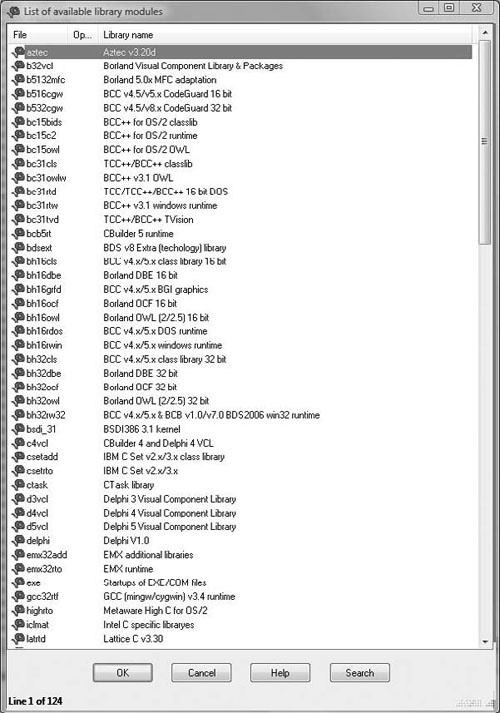
In order to get to the options for loading FLIRT signature files, you go to File > Load File > FLIRT signature file (Figure 8.8), from this menu you get the prompt in Figure 8.9.
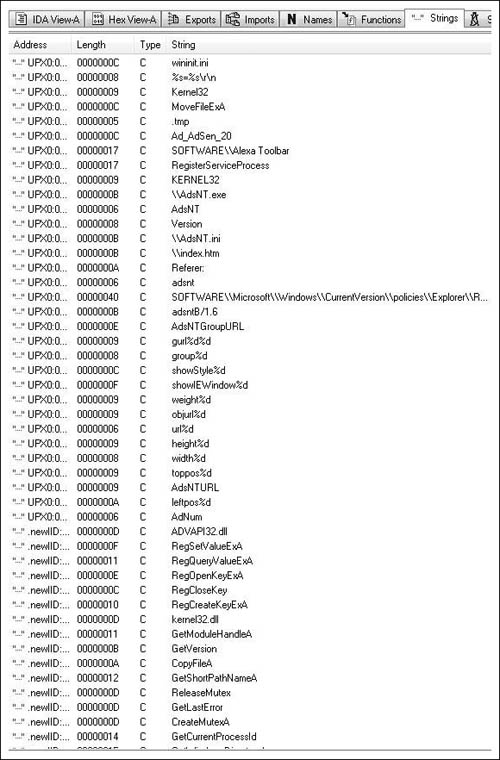
Looking at the prompt, we get some idea of what it does; specifically we see a list of compilers/libraries. Thus the FLIRT signature file applies characteristics known to exist for a given compiler. But how do we know what compiler is in use? This at first seems like it would be implausibly hard, but generally it’s pretty easy and failing that it’s where some experience comes in. Usually, we can look through the strings in a given binary and the compiler inserted a string advertising its use. Failing that we can look at the generated code and try to guess. What to look for exactly when examining the code is a bit beyond the scope of this book. You’ll get a better idea of how to do that as time progresses. For instance however, if you’ve looked at much code generated by GCC you will probably note that it likes to allocate more space on the stack than necessary, then in the next instruction or two it will correct that, you’re basically looking for things like that. In our instance, these are our strings shown in Figure 8.10.
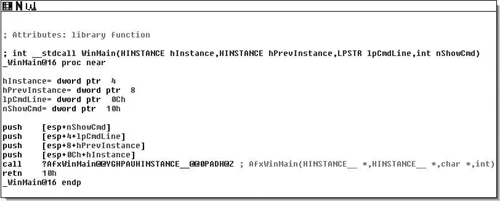
Unfortunately, we don’t get to see any compiler strings so we have to take an educated guess. If worse comes to worse we can just start loading FLIRT signatures until we’ve resolved most everything. In our instance, this is mostly what happened. There are numerous signatures that matched against. The first and most common is the MS Visual C++ runtime signature, but then using MFC starter signatures turned up the most results. In the end, I managed to get most everything resolved, this particular binary was a little wonky, but that’s entirely because it’s using MFC 4.2. With all of that resolved, towards the end of the entry points function, we see that the call at the end has been resolved to a WinMain( ) routine, and when we look at that we see Figure 8.11.
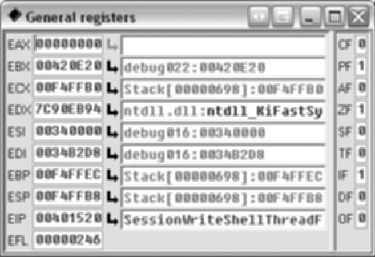
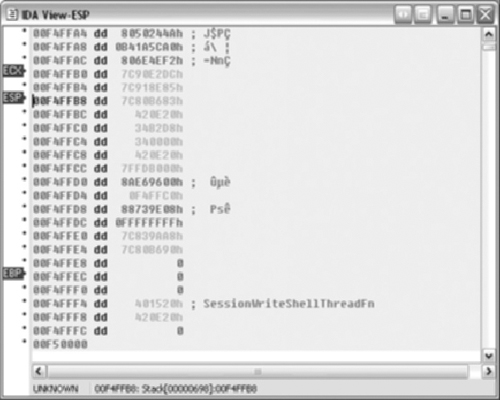
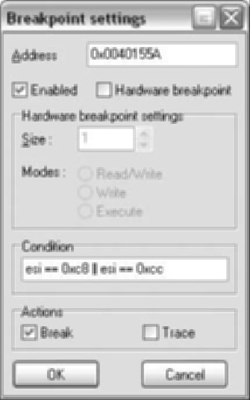
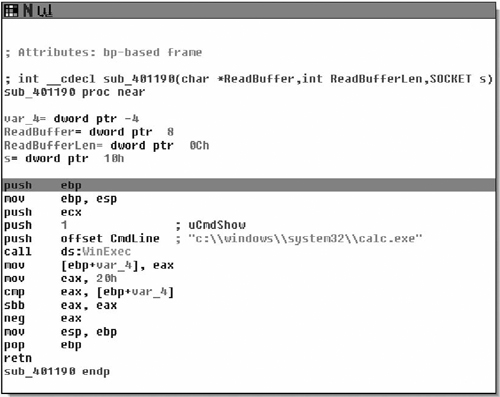
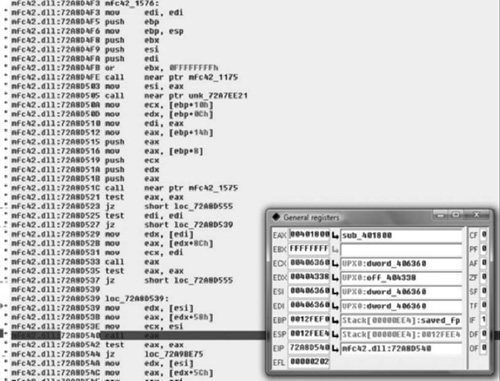
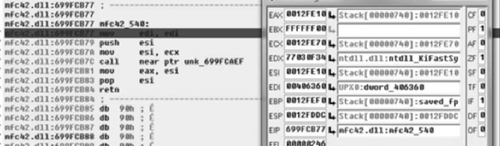
The one interesting thing is that the code is using MFC. I believe out of all the malware I’ve analyzed, this is only the second or third that employs MFC. Now, I’ve managed to spend a fairly significant portion of my life without learning much of anything about MFC, and if we’re lucky we can continue that trend today. So I set a breakpoint on the call and single stepped into the call, hoping that I wouldn’t hit a ton of MFC kludge (See Figure 8.12).
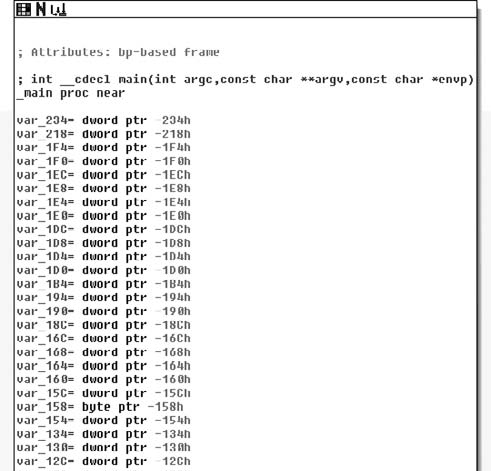
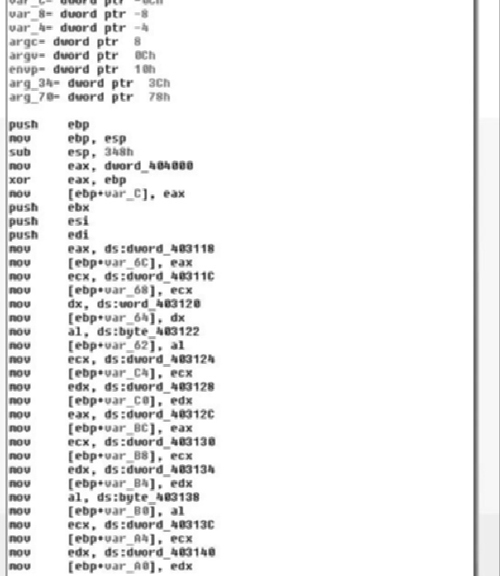
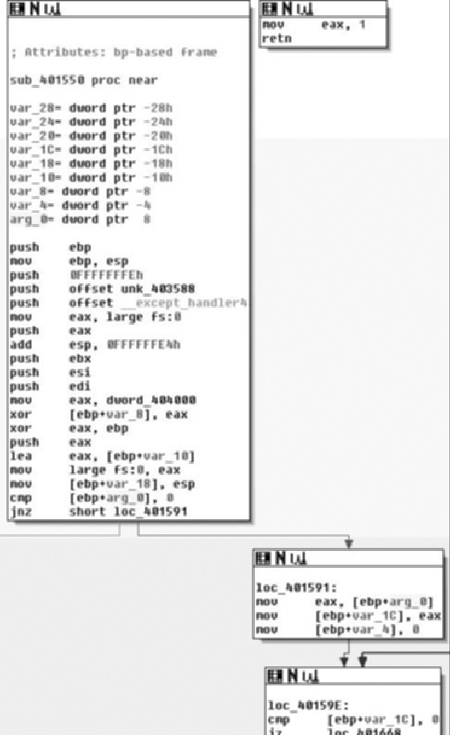
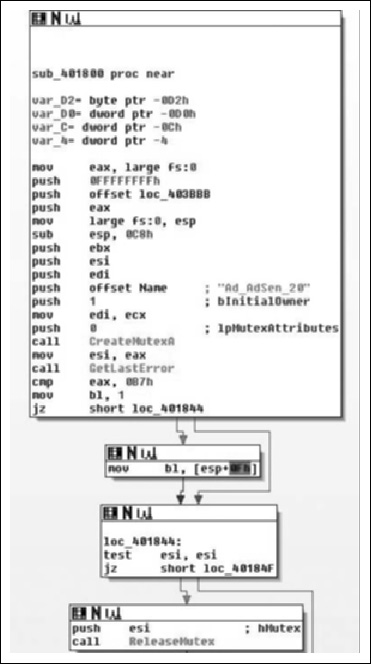
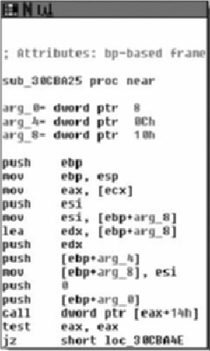
This was a fairly simple function and getting to what we were looking for was rather painless. Because this is malware I’ve never analyzed and I’m not entirely positive what it does, nor the mechanics of AfxWinMain( ), I stepped over the internal calls to other MFC APIs. I had noticed the two calls to the EAX register and figured that one of them was probably what I was looking for. The second one was, as we’ve noted it hands control back into the application to sub_401800. Now we’re going to terminate the debugger and continue static analysis at sub_401800. After terminating the debugger, I simply went to the functions tab, which can be found in between the strings and names tabs—if it’s not there you may have closed it and you can reopen it by going to View > Open Subviews > Functions, or hitting Shift+F3. Once there we see the code in Figure 8.13.
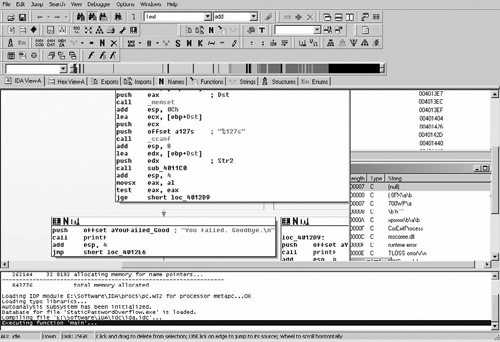
As we can see, the subroutine takes no arguments, and has relatively few arguments. The prologue of the procedure is pretty standard. The first real code we see is a call to CreateMutexA( ) with an argument of “Ad_AdSen_20”. This is potentially used to synchronize access between threads, and we will know for sure as we continue into the application. However, it’s quite likely that this mutex actually prevents double-infection and from multiple copies of the application from trampling itself. Another aspect is that if we Googled for that string, we’d probably find what information we were looking for and we basically just acted as a human anti-virus application. However, we will just assume that we didn’t get any results and continue analyzing.
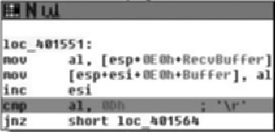
What we see here after the call to CreateMutexA( ) is that the return value is copied into the ESI register and GetLastError( ) is called. This return value is compared against the constant value 0xB7, or 183, which is the value for ERROR_ALREADY_EXISTS. This is exactly what we’re expecting to see if they’re trying to prevent themselves from trampling themselves. From there, the value of 1 is copied into the lower 8-bits of the EBX register, and then we branch depending on the return value. If the condition was true, that CreateMutexA( ) failed, then we branch to loc_401844, otherwise we copy a value from the stack into the low-order 8-bits of EBX. From there, we test to see if the ESI register is non- zero (CreateMutex( ) returns NULL on error). If this is the case we branch off to loc_40184F, otherwise we release ownership of the mutex. Moving on down the function we find the code in Figure 8.14.
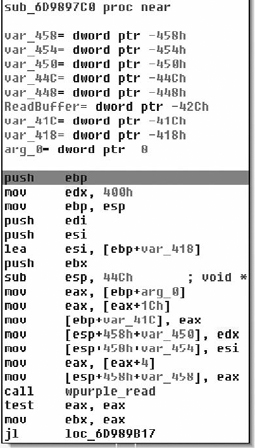
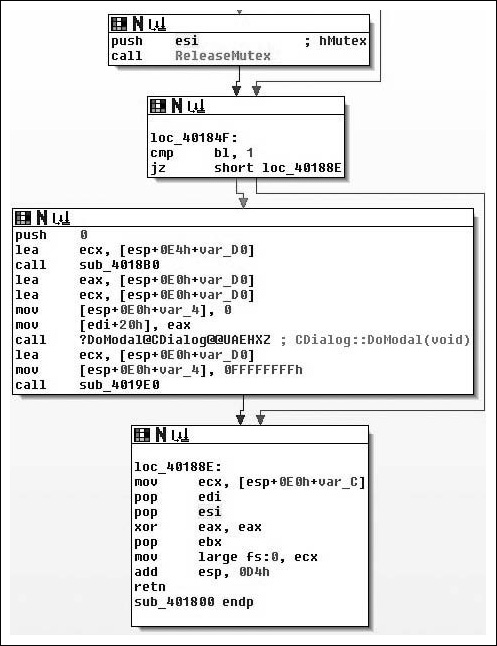
Moving on through the code, we see the potential call to ReleaseMutex( ). Following that, at loc_40184F the low-order 8-bits of the EBX register is checked against the value of 1. If you remember correctly this constant value was moved in and remained in there if the call to CreateMutexA( ) failed, thus the code at loc_40184F simply checks to see if the mutex was successfully created/ownership was giving to the calling thread. If the call failed, execution control is handed off to loc_40188E, otherwise it continues down. Assuming there was no failure, then zero is pushed onto the stack as a parameter to sub_4018B0( ). We also note that the address of an offset in var_D0 is placed in the ECX register immediately before calling the routine, and then before it’s used again the value is overwritten with a different offset. There are two possible explanations here, the first is that a fastcall calling convention is being employed, and the second is that we are calling a method inside a class. Because the first argument is pushed on the stack, instead of being placed in the ECX register (with the second being in the EDX register), we can assume that we are calling an instance method and that what exists in the ECX register is the this pointer. We’ll now take a look at sub_4018B0( ) and see what it does and try to confirm our suspicions about the ECX register shown in Figure 8.15.
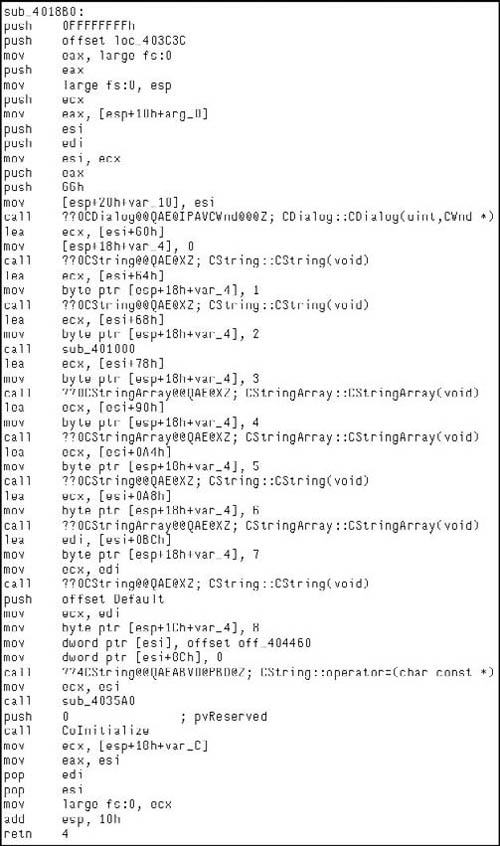
As we enter sub_4018B0( ), we see a fairly standard entry, and we note that this is employing the fastcall calling convention. After the procedure prologue, this also includes the setup of the SEH record. After this we see that the ECX register is saved and the parameter that was pushed onto the stack segment is copied into the EAX register. A copy of the ECX register is saved in the ESI register and the this pointer is saved in var_10 with finally then the constructor for the CDialog class being called. The two arguments passed to the constructor indicate that we don’t want a particular parent window, or rather that the parent window should be that of the main application and the integer specifying a dialog template to use. Here we’re just getting ready to setup a dialog box, which for being malware is a little odd to be honest. We’ll keep looking through it though and eventually the pieces will come together. Moving on through the routine, we see an offset from the current ‘this’ pointer is calculated and saved in the ECX register, then var_14 is initialized to zero and the constructor for CString::CString(void) is called. If you were to single step into that constructor you would see Figure 8.16, which helps make sense of what’s going on in the binary.
So knowing that in our context, the ECX register is an offset from the this pointer of the parent method. We can clearly see that a copy of it is made in the ESI register followed by a call to a near offset. However, interestingly enough, we see the apparent return value overwritten with the pointer that was passed into the method by the caller. Knowing that this is a constructor, we can almost look at this as being a placement new sort of thing. More likely however, is that our caller is a constructor in itself, which makes some sense as if you follow the CDialog::CDialog( ) call in the caller’s frame. You will find a recursive call into sub_4018B0( ). Another interesting aspect is that if you note, there are obviously several instance variables being instantiated in this method, to be more specific four instances of Cstring and three instances of CStringArray. However, the instance of CDialog is a little odd in that the ‘this’ pointer is not modified upon entry. This would at least imply that our class is some abstraction/interface/et cetera of the CDialog class.
Throughout the routine, we see some oddities. For instance the this pointer is saved into var_10, but the variable is never referenced again, var_4 is incremented after each new object is constructed, but never referenced again and so on. The point being that hopefully you’re starting to get the picture about the different types of clues compilers leave laying around for you. Following this, we see the modification of the data at the this pointer—it being modified to off_404460. What is interesting is that the pointer to the last CString object is overwritten with a NULL pointer, leaving an object with no reference. Although, we will reserve judgment until the destructor is inspected to make that determination. The call to the assignment operator for the CString object is also simple to figure out, if you were to single step in, you’d see that quite simply this just ensures nil-termination for the string. Next, we see that the this pointer copy in the ESI register is copied into the ECX register and sub_4035A0( ) is called, implying it is another member method of this class.
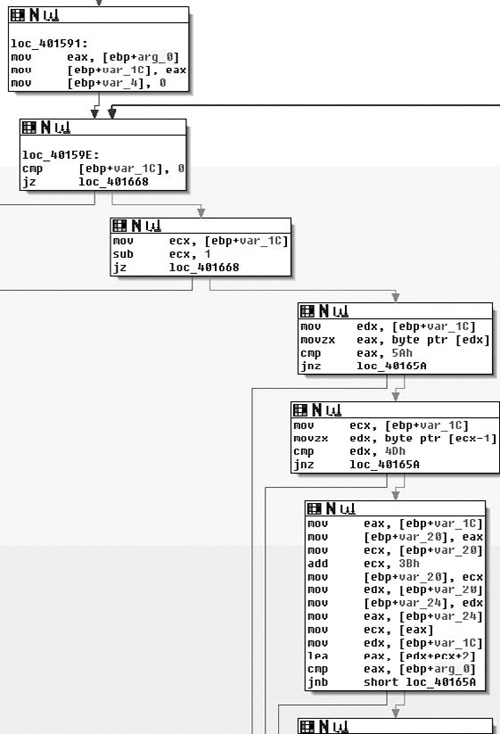
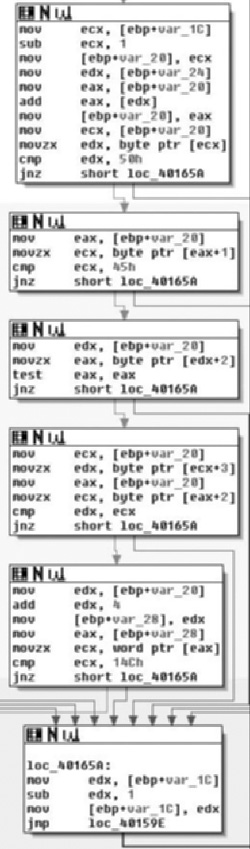
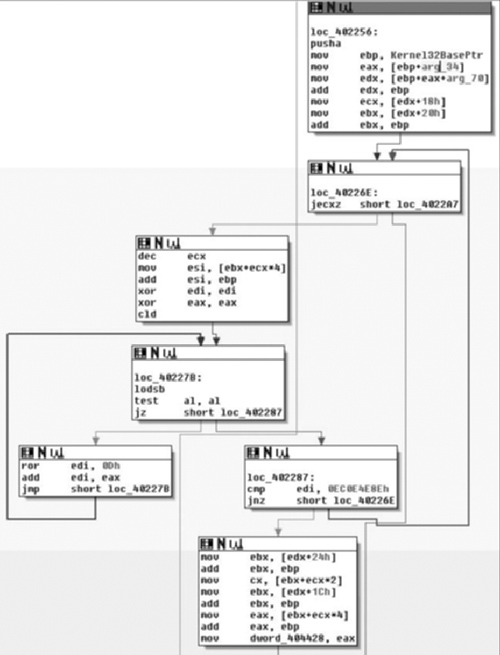
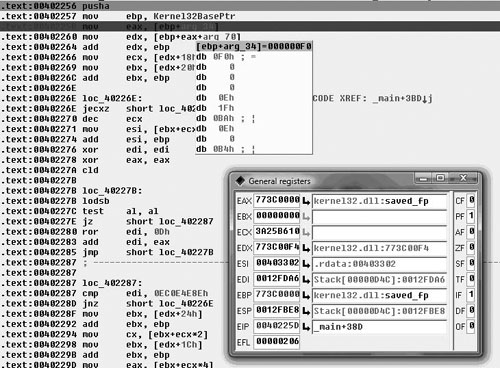
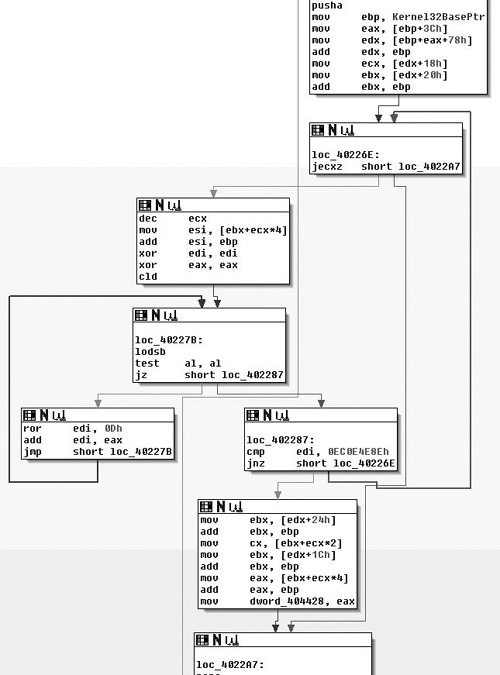
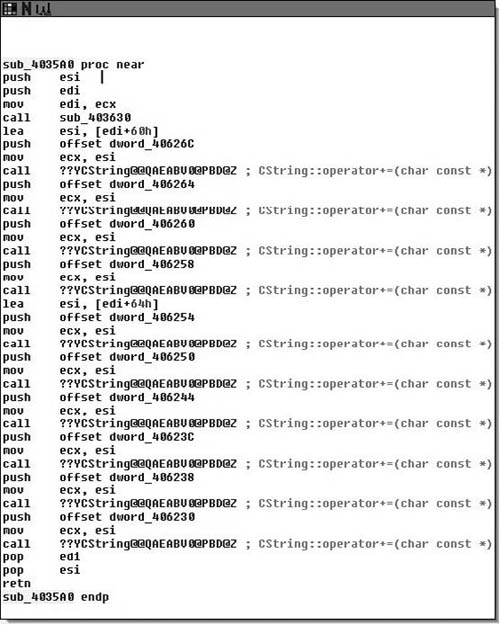
Stepping into sub_4035A0( ) we see the code in Figure 8.17, and it becomes obvious that what we’re viewing is a string initialization routine, and furthermore that a somewhat vague attempt at making it obfuscated has been made, or at least that appears to be the case. This presumption is based off of the number of calls to the operator += and all of the arguments being string constants.
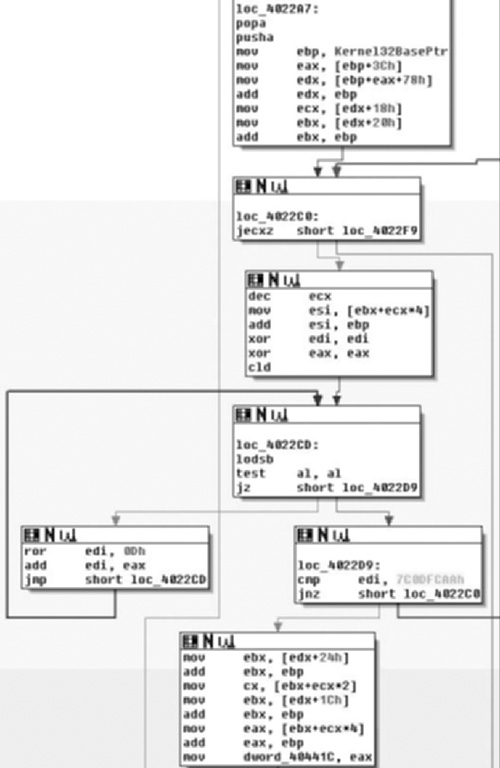
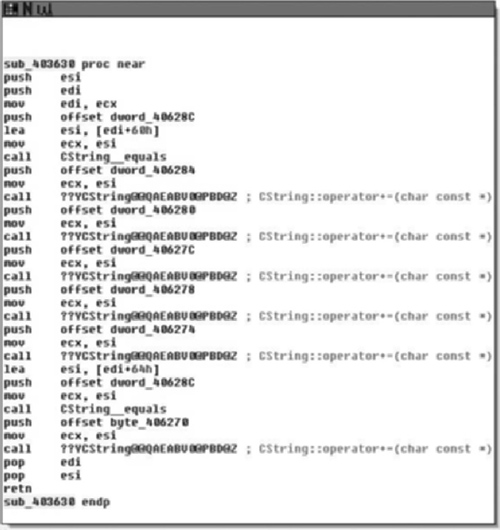
Upon entry into sub_3035A0( ), we see a frameless method. That is to say that we do not see a strict procedure prologue or epilogue and we almost immediately call into sub_403630( ), examining that yields a similar method as the one in Figure 8.18.
If you are really interested, you can single step through these two methods and analyze them, however all they do is result in two CStrings with the values of “http://www.alxup.com/adsnt/AdsNT.ini” and “http://www.alxup.com/adsnt/AdsNT.exe” respectively.
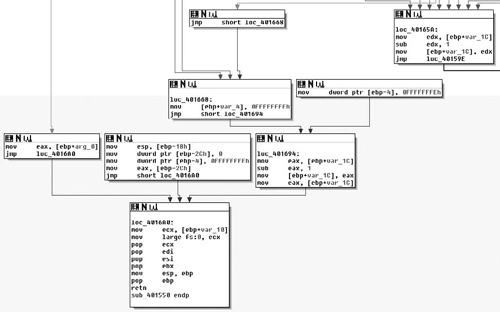
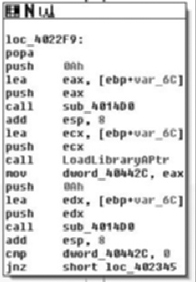
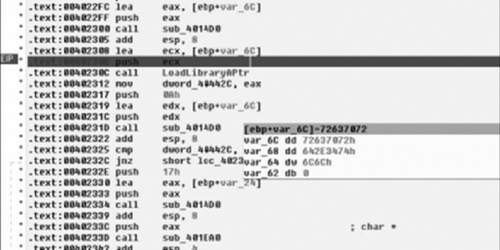
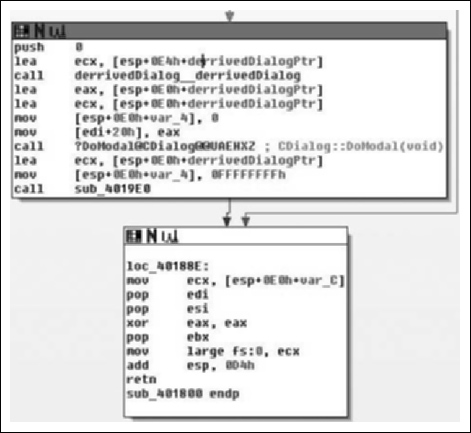
Finally, upon returning back to the constructor method, we see a call to CoInitialize( ) and the this pointer is returned to the caller in the EAX register. Knowing what we know, we’ll call this method we just analyzed derrivedDialog::derrivedDialog( ). Moving back to the calling routine, the WinMain( ) function we have the code in Figure 8.19.
After the object construction, which is what we just analyzed we see that a copy of the pointer to the object is made in the EAX and ECX registers, that var_4 is assigned the value of zero and a copy of the this register is made directly prior to calling CDialog::DoModal( ). We came into this situation hoping to get through the code learning as little about MFC as we can. However, this code presents us with a little bit of a problem, because we’re almost at the end of the code and it looks like it’s all going to be MFC-centric from here on. MSDN tells us that DoModal( ) will create the dialog box that we just setup. So what we can expect to see are a series of call backs for handling the dialog. Let’s fire up the debugger and single step in again.
After a lot of single-stepping, we finally get to a call in MFC that actually creates the window by calling CreateDialogIndirectParamA( ). This API call sends a WM_INITDIALOG message to the dialog’s appropriate procedure, thus this serves as our entry point into the GUI aspect of our application, which is the initialization callback for this dialog type.
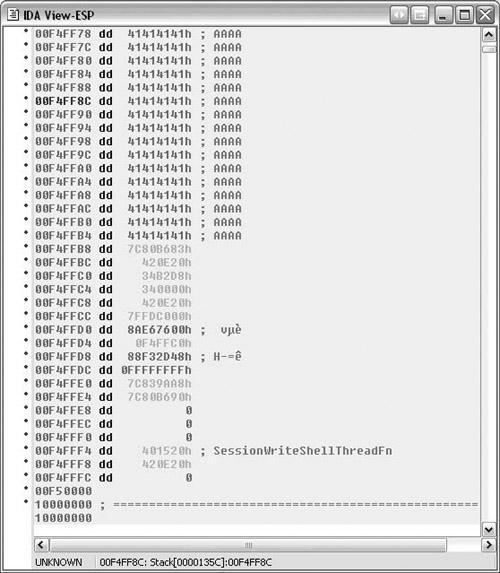
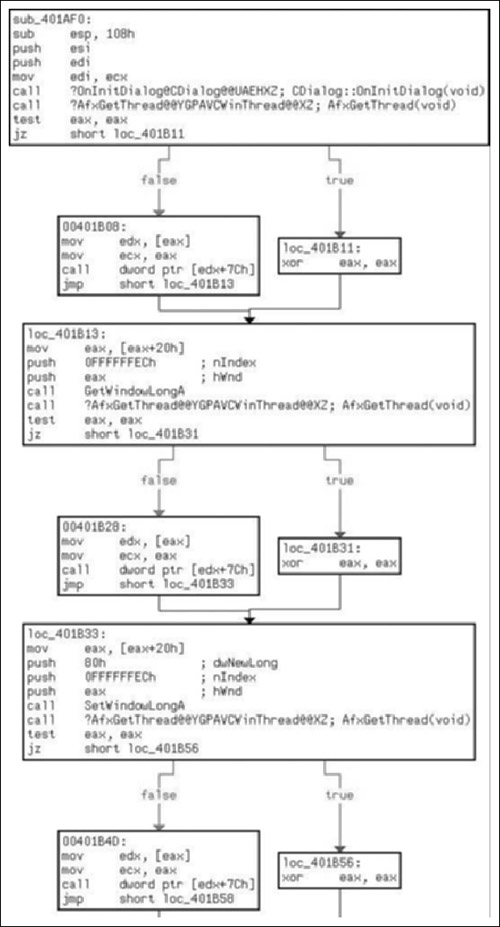
As we can see in Figure 8.20, the callback for initialization of the window is sub_401AF0( ), which is another frameless method. Of what we see of the procedures initialization, there is not much that is interesting to us. We should single step through CDialog::OnInitDialog( ) to ensure that no derived procedures are called, and then also watch the indirect calls to EDX in the blocks labeled 0x00401B08, 0x00401B28 and 0x00401B4D. However, from what we can see thus far, it’s mostly MFC code.
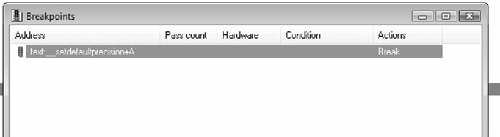
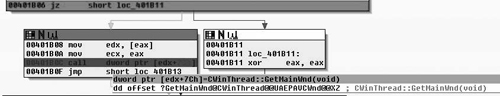
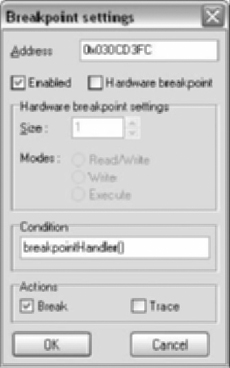
Stepping through we find the following in Figure 8.21. The call to CDialog::OnInitDialog( ) did not execute any user-defined code, and we can clearly see what the function pointer is in the following screenshot. It is important to note that because of the way that we’re going through this code, and how fuzzy of a methodology we’re employing, I’ve set breakpoints on and around the entry points for all functions defined in this binary. So at least in theory if we miss anything we will notice it and can back up to figure out what we missed, how we missed it and so on.
Moving into the next section of code in this function, we find the following code in Figure 8.22, which is a little more interesting and helps flesh out the purpose more.
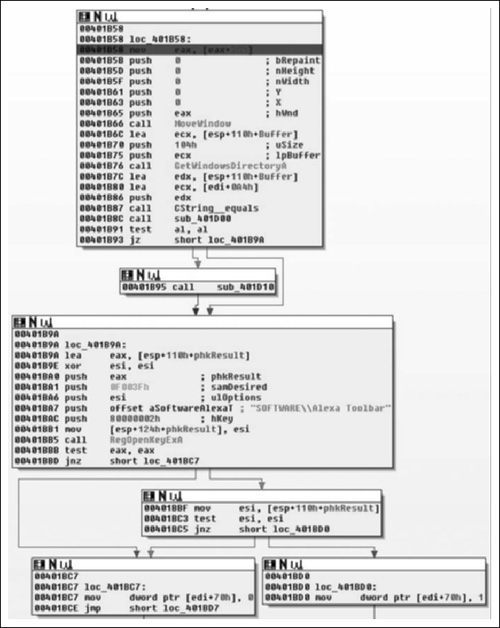
Here we find what we expected. Upon initialization of the window one of the first things done is a call to MoveWindow( ), which will resize and/or reposition a window (Figure 8.23). In this instance they resize the window to be zero by zero at position zero by zero. From there we obtain the location of the windows directory via a call to GetWindowsDirectoryA( ) and assign the return value to the CString at EDI+0x0A4, followed by a call to sub_401D00( ).
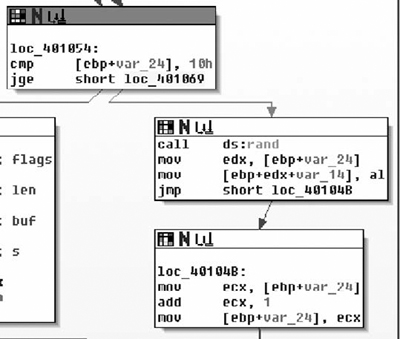
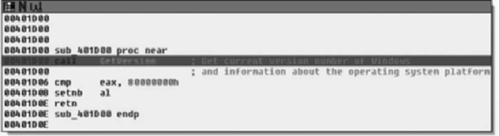
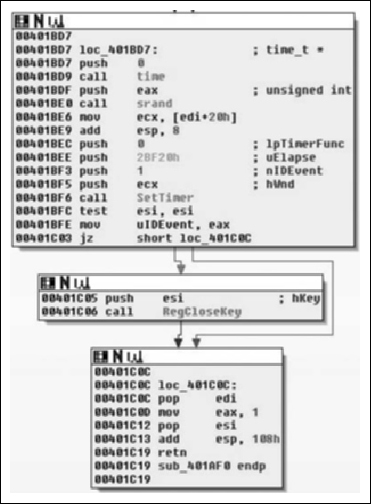
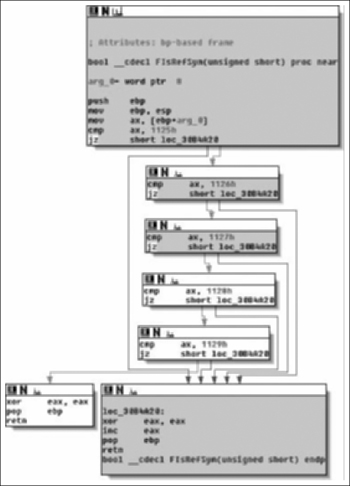
As we can see, sub_401D00( ) is a simple procedure that just checks to see if the current version of Windows is at least Windows NT modifying the AL register based on this result and returning back to the caller. From there, we test the low-order 8-bits of the EAX register, either calling sub_401D10( ) or going to loc_401B9A( ) dependant on Windows version. If the version of the operating system is old enough, then all sub_401D10( ) does is call RegisterServiceProcess( ) to keep the application from exiting when the user logs off. From there, we see that it opens the registry key “Software\Alexa Toolbar” setting the variable at EDI+0x70 to 1 if the call succeeded and to zero if it did not.
From there, we see that the pseudo-random number generator (PRNG) is seeded with the current time and then the SetTimer( ) API is called. Here we note that a NULL pointer is passed in for the callback parameter, which means that a WM_TIMER message will be sent to the window when the timer expires in 0x2BF20 milliseconds or three minutes roughly. From there, the registry key is closed and the routine returns. From there, we will single step some more and see where we end up, knowing that in about three minutes tops we will land at the procedure for the WM_TIMER handler.
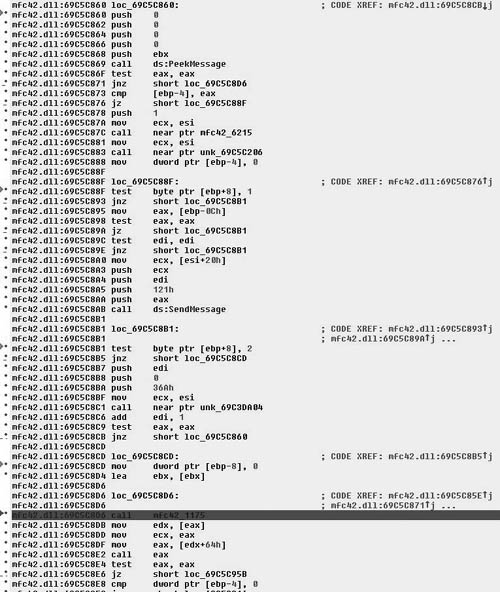
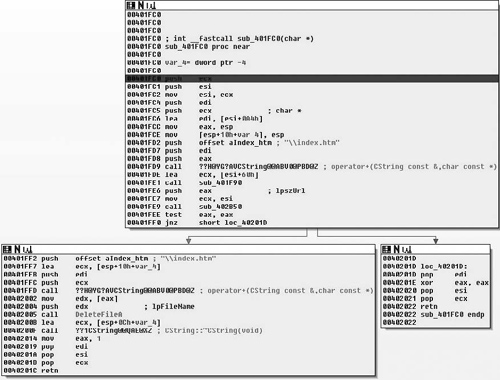
As we single-step past the dialog creation, we enter a section of code in the MFC DLL that acts as a message queue loop, processing windows messages. After the call to PeekMessage( ), if there is a message in the queue then control is branched off to loc_69C5C8D6, and ultimately the call EAX instruction calls CWinThread::PumpMessage( ). Eventually, after walking through the loop long enough we find the next callback, which is sub_401FC0( ) and is defined as shown in Figure 8.26.
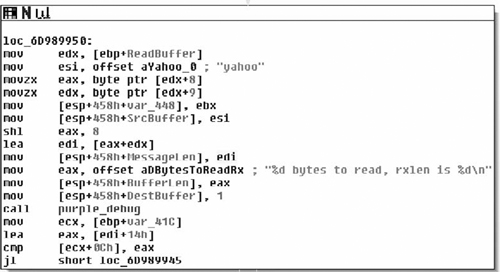
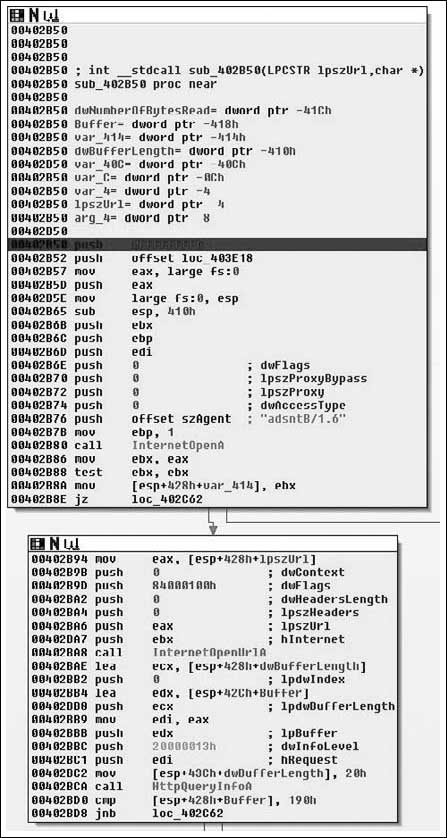
Upon entry into the function, we see a bit more that interests us. Specifically, one of the first things done is the string “\index.htm” and the Windows directory are concatenated together. This yields the string “C:\Windows\index.htm”, which is followed by a call to the sub_401F90( ). This simply dereferences the pointer in the ECX register and copies that pointer into the EAX register. Then a pointer to the string http://www.alxup.com/adsnt/AdsNT.ini and the newly constructed string are then passed as parameters to the routine sub_402B50( ) which we examine in Figure 8.27.
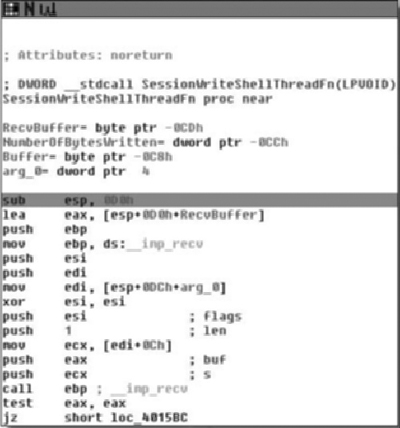
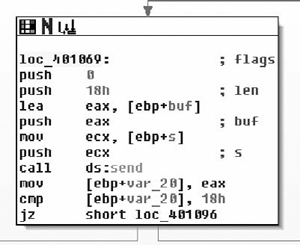
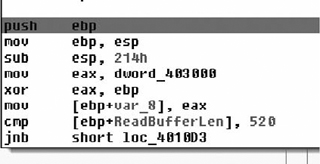
As we step into this new routine, it becomes obvious that we’re really starting to get down to brass tacks with the application. We can now see it making contact with the outside world. After the procedure prologue we see a call to InternetOpenA( ). The only interesting parameter to us in this instance is the User-Agent that will be employed. This gives us a static network detectable pattern to look for. For instance, suppose you wanted to generate an IDS rule, you would probably look for a packet that looks something like this (nuances of fragmentation/request splitting/weirdo tab placement/urgent data/et cetera ignored):
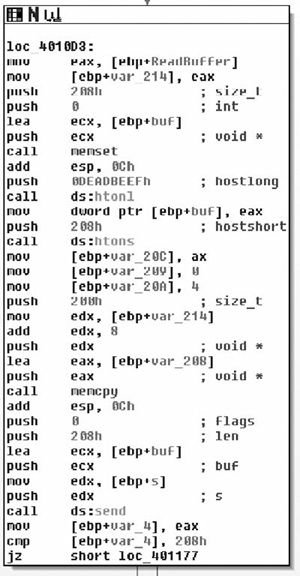
The InternetOpenA( ) API call returns a handle, and we can see the return value copied into the EBX register. This is eventually copied into var_414, and renamed to ‘inetHandle’. It should also be noted that the return value is checked against NULL. From there, the URL that was passed in as a parameter is retrieved via a call to InternetOpenUrlA( ). After that has been retrieved, a call to HttpQueryInfoA( ) is made checking the status code returned by the remote web server. The code then checks this value against 0x190, which is 400 decimal and branches if the status was not less than 400. Now potentially (and I’m not positive because I would need to delve further into the InternetOpenURL( ) function than I am currently willing to), if the status code returned was larger than 0x20 in length than we would end up with an uninitialized variable, which could result in a bug. This is unlikely in this case because the flags passed to HttpQueryInfoA() specifies that we want the status code returned as an integer (0x20000013 is HTTP_QUERY_FLAG_NUMBER | HTTP_QUERY_STATUS_CODE). Moving on through the function body, we see Figure 8.28.
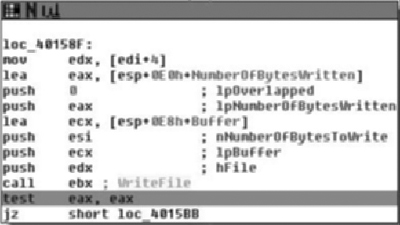
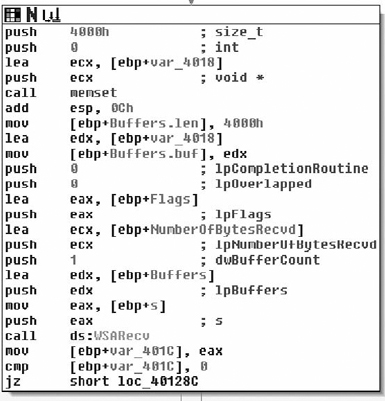
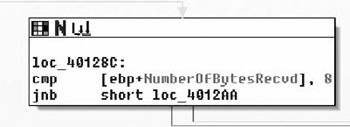
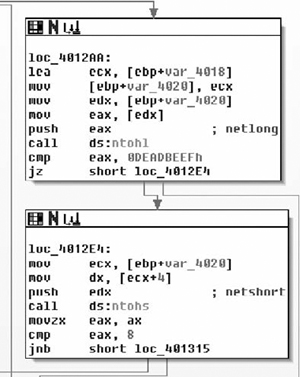
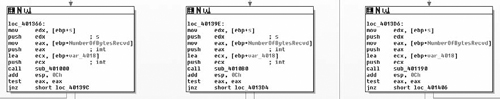
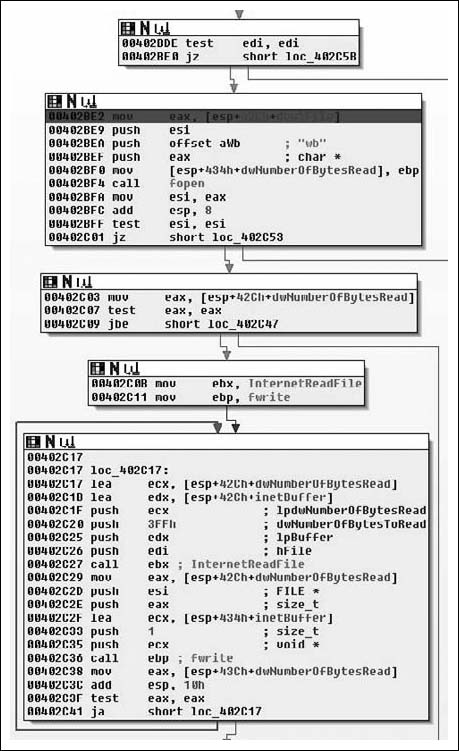
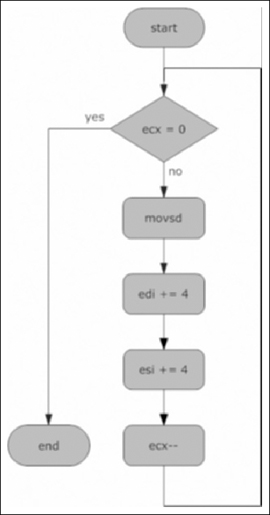
Moving down, the next thing we see is that the copy of the handle returned by InternetOpenA ( ) is tested, branching if its NULL and otherwise moving on to a call to fopen( ). Here we see the second parameter come into play as a file with that name is opened for binary writing. Next the number of bytes is checked, and if all is well we end up at loc_402C17. Here we see a simple loop where 0x3FF bytes at a time are read from the network and, then written to disk via calls to InternetReadFile( ) and fwrite( ) respectively. From this loop we enter the next section of code which is shown in Figure 8.29.
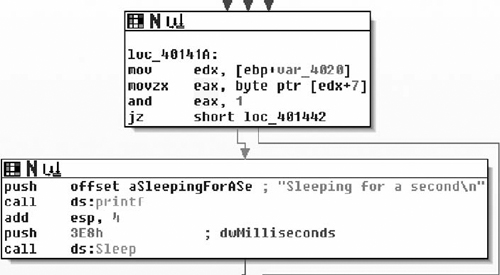
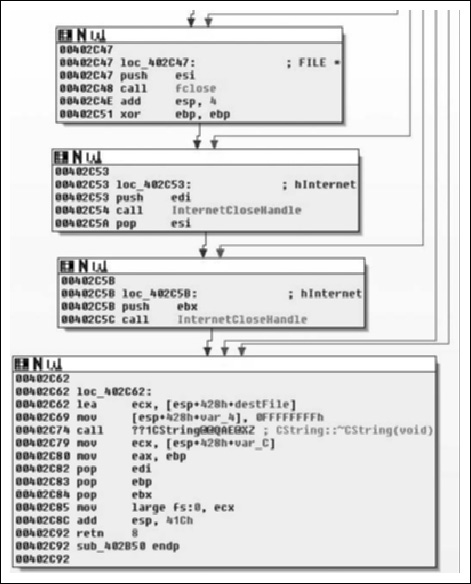
Moving into the final portion of the function, we see largely what we expected. Having read all of the file from the network and writing it to disk, we now close the file handle and internet connection, then call the destructor for the CString and return the EBP register as the return value. This is zeroed out at 0x00402C51, thus a successful I/O cycle in this routine returns a value of zero, and non-zero for failure. So in conclusion, this function takes two parameters: a URL and a path. The routine retrieves the file at the URL and saves it to the path specified. We will rename the function downloadToFile(). It should probably be noted that at least under Vista, there is some oddity that causes the file to be written to “C:\Users\ [username]\AppData\Local\VirtualStore\” instead of C:\Windows. That all said, let’s take a look at the INI file we downloaded.
As you can see, in our file we have a list of URLs and a series of positions and sizes; we can probably safely assume then that we’re looking at ad-ware, and that the sizes/positions refer to browser window placement. What’s annoying, though, is that the application we’re going to download, probably downloads some other application, which downloads another and so on. Even more, we can bet that many of these URLs also host more malicious content. It’s really a losing battle for the user who made the mistake of clicking something they didn’t mean to once as their computer ends up overloaded. This is interesting because if you look at many viruses and worms, the idea of coexistence with the host platform is something that can often be found, to the point that there are actually viruses that attempt to remove other viruses that they recognize. Adware and Spyware are the exact opposite. I suppose it could be argued that the motives are different and that greed causes the corporate malware to take the approach of infecting the computer to the point of it being useless as they don’t expect to survive for any period of time anyways. Nonetheless, enough with the theory, let’s get back to the application shall we?
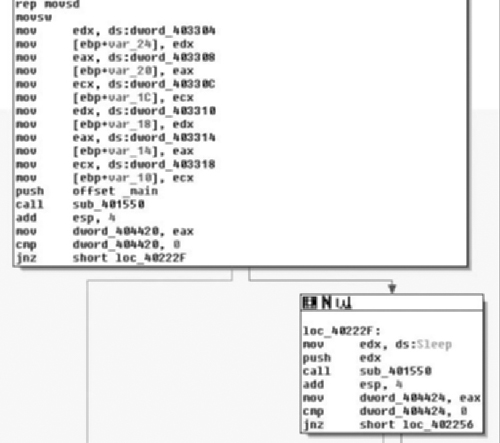
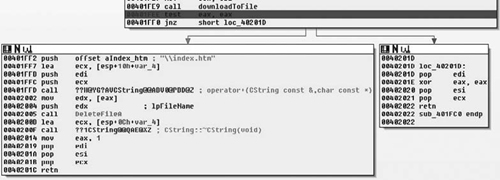
Moving back to the calling function we have the code in Figure 8.30 left to analyze.
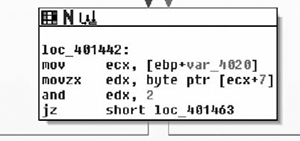
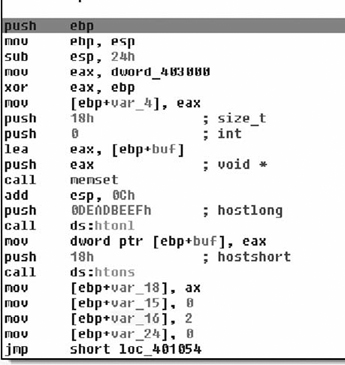
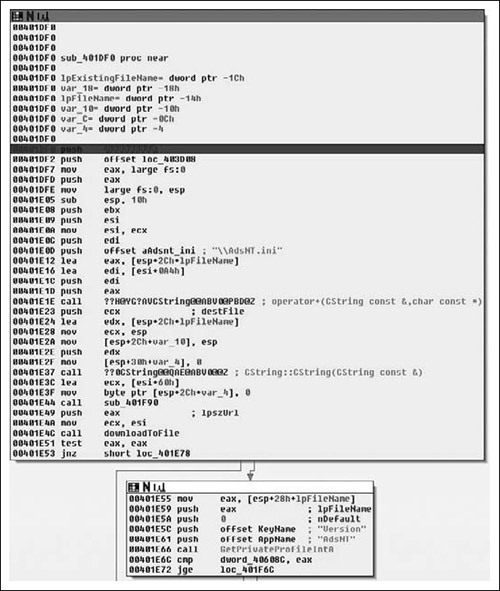
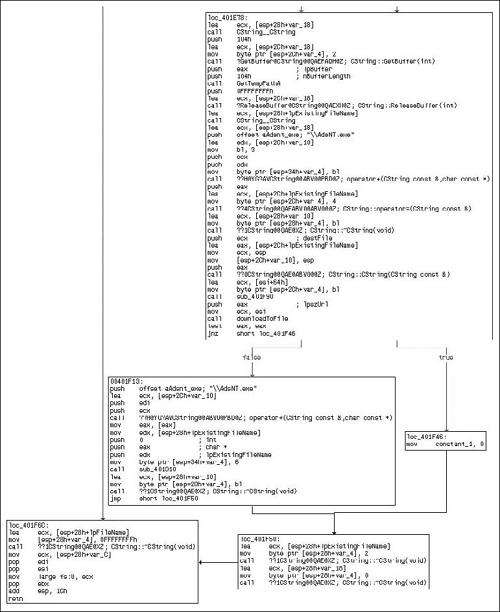
So, after the return value is checked and the call to downloadToFile( ) succeeded, we continue execution at 0x00401FF2, or loc_40201D if the call failed. The CString for the path is once again constructed and a call to DeleteFileA( ) is called, removing the file. After that the destructor for the CString is called and we return to the caller, which the message handling code for the application. From there we enter the next function, sub_401DF0( ), which is defined as shown in Figure 8.31.
Upon entering into this new subroutine, we first see that the path to the AdsNT.ini file is again constructed and then downloaded, branching off to loc_401E78 if there was an error, otherwise continuing at 0x00401E55. From there, we see that the Version is retrieved from the INI file via a call to GetPrivateProfileIntA( ) and then a conditional branch based off of that, thus we have a simple version compatibility check. Moving on to the next section, we see the code from Figure 8.32.
Starting at loc_401E78, we see a fairly familiar pattern, we see a series of CString’s being created, although we see a slight twist in that a temporary filename is retrieved via a call to GetTempPathA( ). From this path we ultimately note that a temporary filename and the string “\AdsNT.exe” are concatenated together. From there, we can see exactly what is going on by the call to downloadToFile( ), which if you remember was the routine we reversed immediately prior to this routine and that simply acted as a go between for a URL and a local file on the disk, fetching a remote file and saving it. Thus the actual executable image that came up at the first object creation is finally being downloaded.
Thus far we have concluded that the application is definitely malicious in the sense that it is obviously adware. It was packed and attempted to obfuscate the strings stored internally, the later especially should raise red flags for you. Furthermore, an INI file was downloaded that after review it became quite clear that it contained information such as URLs and coordinate and window sizes presumably for those URLs. Things look pretty suspicious, but there is still a lot of work to be done. This is okay though, as it provides an excellent opportunity for you, the reader, to apply the knowledge learned in this book. On the Syngress website you can find a copy of this program and repeat some of the steps we have, such as unpacking the application. From there, consider the following exercises:
Exercise 0: | Starting at 0x00401F13, reverse the rest of the application-how does the rest of it operate? |
Exercise 1: | Reverse/Analyze AdsNT.exe |
Exercise 2: | In dealing with the message queue, we skipped over a section of code that is actually defined by the application and serves as the callback that ultimately calls the majority of the functions we’ve analyzed here. Starting at the end of the first routine to call downloadToFile( ), the one that first obtained the INI file, walk through until the routine returns and make note of where in the application control flow is handed to, not step backwards through the application until the initial entry point is realized. |