Table of Contents for
Reverse Engineering Code with IDA Pro
 Reverse Engineering Code with IDA Pro
Published by
Syngress, 2011
Reverse Engineering Code with IDA Pro
Published by
Syngress, 2011
- Copyright
- Visit us at www.syngress.com
- About IOActive
- Contributing Authors
- 1. Introduction
- 2. Assembly and Reverse Engineering Basics
- 3. Portable Executable and Executable and Linking Formats
- 4. Walkthroughs One and Two
- 5. Debugging
- 6. Anti-Reversing
- 7. Walkthrough Four
- 8. Advanced Walkthrough
- 9. IDA Scripting and Plug-ins
Debugging is the act of locating bugs in software. Generally this is done by developers as bugs are worked out of their software. Debugging can take many forms. Beginning programmers often use output as a rudimentary form of debugging. This output can be printf statements in the case of C.
The most popular story on the use of debugging involves actual bugs. The origin of the use of “bug” to refer to a programming mistake is attributed to Admiral Grace Murray Hopper. A moth got caught in one of the relays from the Harvard University’s Mark II computer. The removal of the moth was coined debugging.
Debuggers are programs themselves that run and monitor the execution of other programs. The debugger can control and alter the execution of the target program. Memory and variables can be monitored and altered as well.
Debuggers are an essential tool in the reverse engineer’s toolbox. The ability to perform runtime analysis speeds up program understanding and reverse engineering. Certain tasks are easier within a debugger. Call chains can be watched instead of guessed.
Tracking indirect calls is much easier during debugging. A call through a register is an example of an indirect call. IDA Pro’s static analysis tracks indirect calls in a very limited fashion. Cross references are not created.
Debugging allows us to watch, observe, and guide our reverse engineering. We do not want to reverse engineer entire programs, but rather the interesting parts.
Breakpoints stop execution of a program within the debugger at a location of our choosing. Execution is stopped and control is passed to the debugger. Breakpoints come in two different forms: hardware and software. Hardware breakpoints, as their name indicates, require specialized hardware support from the CPU.
The IA-32 family of processors provides support for four hardware breakpoints. The hardware breakpoints use special debug registers. These registers contain the breakpoint addresses as well as control information and breakpoint type.
Breakpoint addresses are stored in debug registers D0 to D3. In order to set breakpoints a size field is needed. The possible sizes are 1, 2, or 4 bytes. Breaks on execution use a size of 1 byte. The possible sizes have been expanded to include 8 bytes for 64-bit CPUs. There are various conditions to trigger the breakpoints.
Break on execution
Break on memory access (reads and writes)
Break on memory write only
Break on I/O port access (rarely used, most debuggers do not have this as an option)
Software breakpoints can only break on execution. A software breakpoint is simulated because of the lack of hardware support. A software breakpoint replaces the original instruction with an instruction that traps the debugger. In IA-32 processors, the new instruction is generally INT 3 (0xCC). The debugger must keep track of the original instruction.
When a software breakpoint executes, the INT 3 instruction passes control to the debugger. The debugger looks up the breakpoint in an internal table and replaces the INT 3 with the original instruction. The debugger then sets the instruction pointer back, making the saved instruction the next instruction to execute. The entire process is not visible to the user; the debugger will display disassembly with the original instructions in place.
Software breakpoints are used by debuggers more than hardware breakpoints. The main reason is that there is not a set limit to software breakpoints. Some anti-debug techniques involve calculating checksums on code sections to determine if any instructions are changed. Anti-debug techniques are covered in detail in Chapter 6.
Hardware breakpoints can be set on memory, unlike software breakpoints. Breaking on memory access can allow us to look for use of tables or memory corruption.
Single stepping is the process of executing a single instruction and then returning control to the debugger. The IA32 family of processors supports single stepping directly in the hardware. By executing a single instruction at a time, we have the ability to carefully monitor certain sections of code. However, it is impractical to debug an entire program using this method. Generally single stepping is used to understand select portions of code.
From the CPU perspective, the debugger sets the TF (Trap Flag) on the EFLAGS register. Upon the execution of an instruction a debug exception will be generated. This debug exception is caught by the debugger as an interrupt, INT 0x01.
Note
Most debuggers provide step commands. Generally they are called step into and step over. From a user point of view the only differences happen on certain instructions, namely call and rep.
When a call is encountered, a step into command will follow the call, while a step over will break on the instruction following the call. This is generally done by setting a breakpoint, not by single stepping till the return.
We need to keep track of variables. In source level debugging, variables are abstract named locations with values. Within assembly, variables are usually memory locations. The compiler can sometimes optimize a variable into a register.
Watches are a way to display variables or useful expressions. They are updated whenever control is passed to a debugger, such as a breakpoint or single stepping. A watch can be a simple variable such as loop_counter or an expression like packet[offset * 4].
Exceptions are used by programmers to catch errors. The following pseudo demonstrates an exception:
_try
{
      open(file)
}
_except
{
      printerror
}
The debugger can either stop on an exception or pass it on to the application. An exception does not necessarily mean something went wrong. Many times programs use custom exceptions. Custom exceptions are also a common anti-debugging technique.
In Windows the exception 0xc000000005 is an Access Violation. This means that process attempted to access an address that is not mapped. You may have seen advisories that show:
:
Exception C0000005 (ACCESS_VIOLATION reading [41414141])
The address 0x41414141 is not mapped to the process and is most likely part of an overwrite using As. We want the debugger to stop on access violations.
Tracing is the process of executing a program and recording information along the way. The UNIX command strace runs an executable while intercepting all system calls including passed arguments.
user@redbull:~$ strace ls
execve("/bin/ls", ["ls"], [/* 31 vars */]) = 0
brk(0) = 0x805c000
access("/etc/ld.so.nohwcap", F_OK) = -1 ENOENT (No such file or directory)
mmap2(NULL, 8192, PROT_READ|PROT_WRITE, MAP_PRIVATE|MAP_ANONYMOUS, -1, 0) =
0xb7eec000
access("/etc/ld.so.preload", R_OK) = -1 ENOENT (No such file or directory)
open("/etc/ld.so.cache", O_RDONLY) = 3
Tracing can be performed within a debugger, recording various levels of detail. Instruction level tracing is the most detailed. After executing each instruction, register values are recorded. This level of detail is not needed and the process is very slow.
Function tracing can set breakpoints at the entry of all functions or single step till a call. When a function is called, the execution is stopped. The debugger will record the arguments to the function and optionally can record data such as registers and the caller. Execution then resumes.
While function tracing is much faster than instruction tracing, it sometimes does not provide the necessary detail. Ideally we want to trace basic blocks. Basic blocks are sequential instructions that are executed without taking a branch. This type of tracing helps determine why certain branches are taken and, if needed, how to modify input in order to take different branches. While basic block tracing is much faster than instruction tracing, it is still slow. Starting with the P6 line of processors, Intel included hardware support to trace branches. Newer processors have more functionality in this area, but they all use MSR registers.
Intel has documented Last Branch Recording in Chapter 18 of the Intel® 64 and IA-32 Architectures System Programming Guide. New research in this area has been published and proof of concept tools have been released. See www.openrce.org/blog/view/535/Branch_Tracing_with_Intel_MSR_Registers.
IDA Pro comes with a built-in debugger, which was introduced in version 4.50. The debugger is implemented as a plug-in. This is a true testament to the extensibility of IDA Pro.
IDA isn’t limited to debugging the local system. The debugger can operate locally as well as remotely over the network. The debugging clients allow IDA to debug other machines running different operating systems and even CPUs. Authentication is available, but best practices suggest debugging only over the local network.
IDA Pro supports the following debugging environments:
Win32 Local
Win32 Remote
Win64 Remote
Linux Remote (x86 only)
OSX Remote (x86 only)
WinCE Remote (ARM only)
Note
IDA Pro can change register values from the GUI. However, memory locations cannot be changed from the GUI.
IDC, IDA Pro’s scripting language, must be used to change memory locations. Memory locations include data and executable code. The IDC functions such as PatchByte(), PatchWord(), and PatchDword() must be used.
The debugger menu option is made available if the binary being analyzed matches one of the previous targets listed. Debugger settings are available from the debugger menu option as shown in Figure 5.1.
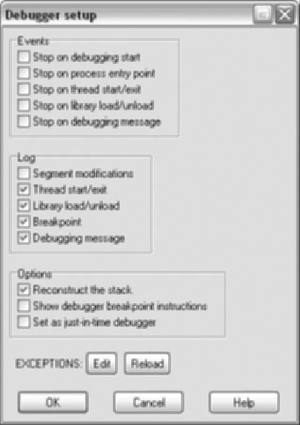
Some of the notable options are:
Stop on debugging start –. This option will stop before the entry point in the case of a PE binary with a TLS section.
Stop on entry point –. This option stops at the listed entry point. Some initialization may have been completed.
Set as just-in-time debugger –. Windows allows a debugger to be set as default when programs crash.
Exceptions –. This option controls how IDA handles exceptions, whether they are passed to the application or not.
In order to demonstrate debugging within IDA Pro we will use Netcat as an example. Netcat is a network tool, whose name comes from the combination of network and the UNIX command cat. You can pipe data to and from other programs over a network, which is why it is known as the “TCP/IP Swiss army knife.”
In December 2004, vulnerability was reported in Netcat for Windows 1.1 (www.vulnwatch.org/netcat/netcat-111.txt). We will be analyzing the vulnerable version 1.1 (http://packetstormsecurity.org/UNIX/netcat/nc11nt.zip), while the patched version is 1.11 (www.vulnwatch.org/netcat/).
Note
Netcat is a networking tool capable of allowing remote access. Some antivirus vendors classify it as a hacking tool. Please be aware of this and take the necessary precautions.
The vendor advisory describes a remote buffer overflow when using the “-e” option. The vulnerability resides in the SessionWriteShellThreadFn function within the dosexec.c source file. Select parts of the vulnerable function are shown in the following code snippet:
static VOID
SessionWriteShellThreadFn(LPVOID Parameter)
{
      PSESSION_DATA Session = Parameter;
      BYTE RecvBuffer[1];
      BYTE Buffer[BUFFER_SIZE];
      BYTE EchoBuffer[5];
      DWORD BytesWritten;
      DWORD BufferCnt, EchoCnt;
      DWORD TossCnt = 0;
      BOOL PrevWasFF = FALSE;
      BufferCnt = 0;

      //Loop, reading one byte at a time from the socket.
      while (recv(Session->ClientSocket, RecvBuffer, sizeof(RecvBuffer), 0) != 0)
           {
              EchoCnt = 0;

              Buffer[BufferCnt++] = EchoBuffer[EchoCnt++] = RecvBuffer[0];
              if (RecvBuffer[0] == '\r')
                   Buffer[BufferCnt++] = EchoBuffer[EchoCnt++] = '\n';

              //Trap exit as it causes problems
              if (strnicmp(Buffer, "exit\r\n", 6) == 0)
                   ExitThread(0);
              //
              //If we got a CR, it's time to send what we've buffered up down to the
              //shell process.
              if (RecvBuffer[0] == '\n' || RecvBuffer[0] == '\r') {
                 if (! WriteFile(Session->WritePipeHandle, Buffer, BufferCnt,
                 &BytesWritten, NULL))
                 {
                  break;
                 }
                 BufferCnt = 0;
              }
      }
      ExitThread(0);
}
The function contains a receive loop with two possible exits. The first exit occurs if the buffer contains an exit\r\n string. The second exit requires either a \n or \r as the received byte and a failure for the WriteFile call.
Note
Netcat sends a \n as a newline when run from Windows. The command to terminate is exit\r\n. In order to terminate the newline needs to be sent as \r\n.
After opening nc.exe in IDA Pro, the debugger tab is available. If an executable format is supported by one of the debuggers, the debugger tab will be visible.
Process options need to be configured. Specifically, we need to configure the command line arguments. The vulnerability is only present when the -e option is used. In order to use this option we must also supply the -l (listening) options as well as the -p (port number option). The -e option executes a program passing any input it receives over the network. We don’t need the executed program to do anything, so we can use the more program. Figure 5.2 shows typical process options using our command line arguments.
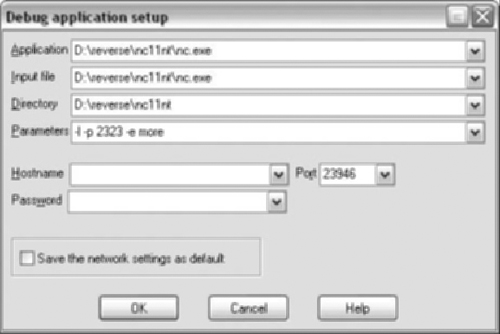
Note
If we are debugging a dll, the setup is slightly different. The dll would be in the input file box, while the application that uses the dll would go in the application box.
This type of setup is very common with Internet Explorer. The iexplore.exe binary does very little work and leaves all the heavy lifting to dlls.
F9 Start debugger/Continue process (if already debugging)
F2 Set/Remove breakpoint
F7 Step into
F8 Step over
CRTL + F7 Run until return
F4 Run to cursor
CTRL + F2 Terminate process
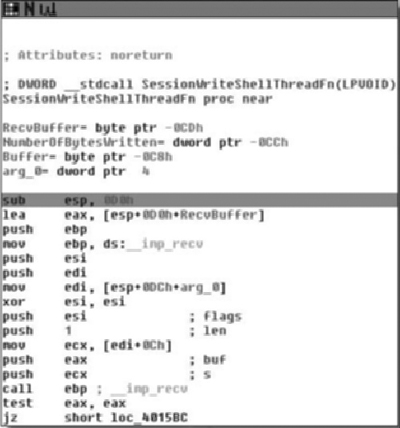
We find the SessionWriteShellThreadFn function by looking at the imports for WriteFile. From the cross references we determine that the function address is .text:00401520. We then set a breakpoint at the beginning of the function. Figure 5.3 shows the graph view of the function. The function has been renamed to SessionWriteShellThreadFn and stack variable buf has been renamed to RecvBuffer for readability.
Push F9 and the debugger will start. The different windows will rearrange themselves. The debugger is running nc.exe using the passed arguments. Since there hasn’t been a connection yet, our breakpoint hasn’t been hit.
Start a cmd.exe shell and we will use another instance of Netcat to connect to the debugged one. This Netcat will be called the Netcat client in order to differentiate between the debugged Netcat. Use the command line:
nc localhost 2323
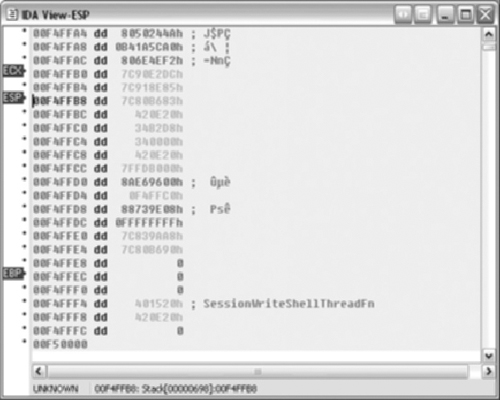
At this point we will hit our breakpoint. The register window will contain values similar to Figure 5.4. A stack window will be displayed similar to Figure 5.5.
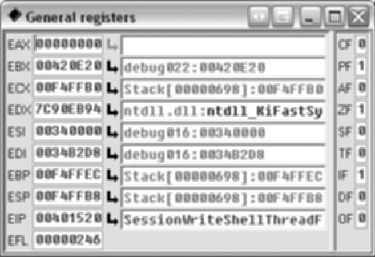
The register window shows the register values on the left and the right side contains any interpretation of the values. Registers can be changed by either right-clicking in the value box or typing directly into the value box. New views are available by right-clicking on registers and most addresses. The views can be assembly or hex.
Stepping with the F8 key (step over) will avoid going into the actual recv call. The recv call will block until it receives data. Type hello\n into the Netcat client. The recv call will return now that it has received data. We can continue single stepping.
The basic block in Figure 5.6 does the following:
Reads the single byte from the recv call into register al
Writes the byte into the buffer
Increments a buffer counter in register esi
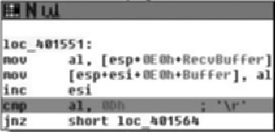
We can set another breakpoint on the instruction cmp al, 0x0d in the basic block from Figure 5.6. Pressing F9 (continue) runs the program until another breakpoint is hit. Execution will stop at the breakpoint we just set. Notice the value of esi has incremented after each character. The character can still be seen in register al. Right-click the breakpoint and select disable breakpoint.
After the entire command from the Netcat client has been copied into the buffer, WriteFile is called. Figure 5.7 shows the basic block containing the call. Set a breakpoint on test eax, eax, which is the instruction following the WriteFile call. When we continue (F9), the debugger will stop on this instruction.
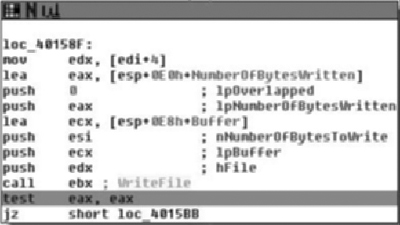
We know the size of the buffer; it is 0xc8 bytes according to Figure 5.7. However, the stack looks different than expected since this function is called by CreateThread().
We can set a conditional breakpoint on the instruction cmp al, 0x0d from the basic block shown in Figure 5.8. In order to set a conditional breakpoint, right-click on the disabled breakpoint and select Edit breakpoint. Enter esi == 0xc8 ‖ esi == 0xcc in the condition box as in Figure 5.8. The breakpoint will hit at the last location of the buffer and then upon overwriting the next DWORD.
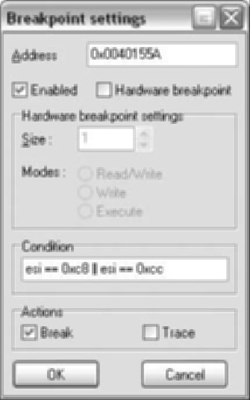
Warning
The condition box takes an IDC statement, which is evaluated. A common mistake is using a single equal = (assignment), when a double == (evaluation) is needed. This is a classic bug type in C code.
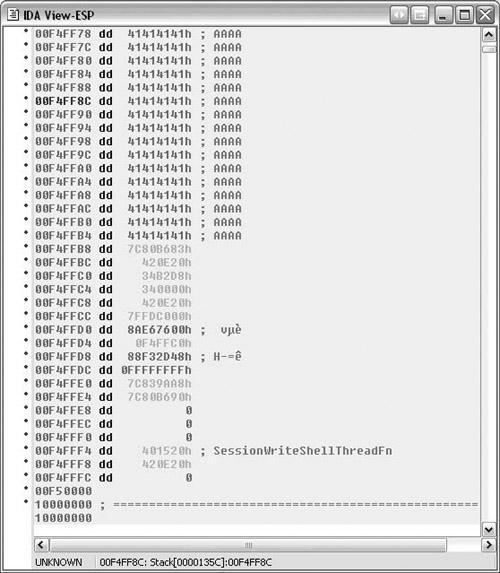
We need to send more data. From the stack view, it appears that 272 bytes will write past the end of the page. Other machines or operating systems may have different memory layout. The easiest way to send the data is to build a string in a text editor and then paste it into the Netcat client.
After the breakpoint hits, the stack looks like Figure 5.9. There is still data to be read and there is very little space left on the page. The next breakpoint is the first of the stack corruption. When the program is allowed to continue, we see the warning and then the exception will come up as shown in Figure 5.10.
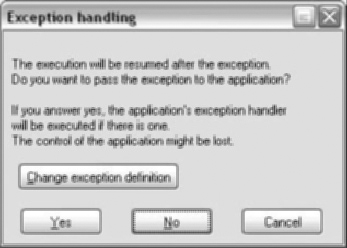
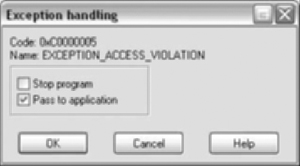
The exception is configured to stop the program. We can go into Change exception definition and select Pass to application. See Figure 5.11.
The program will terminate with this exception. IDA Pro has recorded the exception in the log window:
nc.exe: The instruction at 0x401555 referenced memory at 0xF50000. The memory could not be written (0x00401555 -> 00F50000)
Debugger: Thread terminated: id=00001660 (exit code = 0xC0000005).
Debugger: Thread terminated: id=000017AC (exit code = 0xC0000005).
Debugger: Process terminated (exit code = C0000005h).
Detecting memory corruption is important to the reverse engineer. Stack and heap overflows are attacks that overwrite and corrupt memory.
The debugger can be used to detect memory corruption. Some ways of detecting corruption can be done manually while others are more applicable to being scripts or plug-ins.
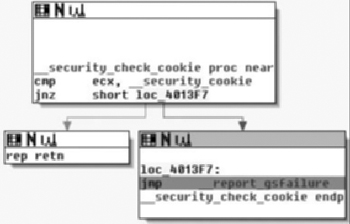
Microsoft began adding stack cookies to their compiler beginning with Visual Studio 2003, using the GS command line switch. At the entry of a function, a stack cookie is placed on the stack. The cookie is calculated by taking a global security cookie, __security_cookie, and XORing it with the esp register. During an exit of the function, the stack cookie is XORed with the esp register. The result of the operation should be __security_cookie. This value is passed to the __security_check_cookie( ) function. If the passed value matches __security_cookie, then __security_check_cookie( ) returns allowing the original function to continue as designed. A more detailed explanation is available here: http://uninformed.org/index.cgi?v=7&a=2&p=1.
The idea of the protection is that the cookie check will fail if the stack has been corrupted. If the check fails, the process will be terminated with an exit code of 0xc0000409. In order to catch the stack corruption, we can set a breakpoint in __security_check_cookie( ), as shown in Figure 5.12. Alternately, the breakpoint can be set directly on the __report_gsfailure( ) function. The __security_check_cookie( ) function is compiled in statically and the address will change depending on the binary.
Checking for heap corruption is more dependent on the operating system being used. Windows XP SP2, Windows 2003, and Vista have various methods of heap protection built in. However, unlike the GS stack protection, the heap protections are part of the operating system. Various techniques have been developed to pass heap protections, but data from a fuzzer will most likely be caught by these protections.
There are multiple checks and simple breakpoints may not be sufficient. Debugger based scripting or a plug-in would be ideal. The heap functions can be hooked to provide allocation data. The protection functions can be hooked to report corruption. For systems without such thorough protection functions, hooked functions containing checks could be added. Rather than stopping attacks, the checks notify us of corruption as soon as possible.
Warning
Debuggers can change the environment and behavior of a process.
Processes started from a debugger use a debug heap, unlike starting the process normally. Attaching to a process is not affected. This difference is important when looking for heap corruption. In order to disable the use of the debug heap, set the environment variable _NO_DEBUG_HEAP to 1.
set _NO_DEBUG_HEAP=1
Microsoft’s gflags.exe utility allows the setting of many debugging options. gflags.exe is part of Debugging Tools for Windows (www.microsoft.com/whdc/devtools/debugging/default.mspx).
Operating system code can have debugger checks. kernel32.Unhandled Exception Filter alters its behavior based on the presence of a debugger. This behavior was originally mentioned in Dave Aitel’s paper “MSRPC Heap Overflow – Part II” and subsequently in the Shellcoder’s Handbook.
The debuggers within IDA Pro are very useful. You have full access to the static analysis, renamed functions, and other parts of code that have been reverse engineered. Like any type of tool, people have preferences for different tools. There are different debuggers available to the reverse engineer.
Each debugger has advantages and disadvantages. It usually comes down to a matter of personal preference. The following paragraphs provide a brief overview of some other debuggers.
Debugging Tools for Windows is a collection of debuggers from Microsoft (www.microsoft.com/whdc/devtools/debugging/default.mspx). There are two different versions available from Microsoft, a 32-bit and 64-bit version.
Debugging Tools for Windows 32-bit Version runs on:
Windows NT 4.0
Windows 2000
Windows XP (32-bit or 64-bit)
Microsoft Windows Server 2003 (32-bit or 64-bit)
Windows Vista (32-bit or 64-bit)
Windows Server 2008 (32-bit or 64-bit)
Debugging Tools for Windows 64-bit Version runs on:
Windows XP (64-bit)
Microsoft Windows Server 2003 (64-bit)
Windows Vista (64-bit)
Windows Server 2008 (64-bit)
The 64-bit version of the Debugging Tools for Windows should only be used if debugging native 64-bit applications.
Windbg is the debugger you will most likely use, although other debuggers are included, such as NTSD, CDB, and KD. Windbg is a user and kernel mode debugger. One of its primary benefits is the tight integration with Windows.
Ollydbg is a free win32 user mode debugger, available from www.ollydbg.be. Although source code isn’t available, there is an SDK provided. Many plug-ins have been written for Ollydbg.
Ollydbg is a very popular debugger among reverse engineers. It was written from the reverse engineer standpoint. Some notable plug-ins include scripting, anti-anti-debugging, and tracing. There are many tutorials available for Ollydbg ranging from basic reversing to security bug hunting to breaking software protections.
The current version is 1.10 and is no longer supported as the author is working on the upcoming 2.0 release full time. There have been various vulnerabilities reported in the debugger, including a format string vulnerability (CVE-2004-0733). Packers use these vulnerabilities in order to prevent debugging. However, reversers have released plug-ins which patch these vulnerabilities, one of the most popular being Olly Advanced (www.openrce.org/downloads/details/241/Olly_Advanced).
Immdbg is a free debugger released by Immunity Inc. (www.immunityinc.com/products-immdbg.shtml). When you first run Immdbg, you will notice that it is ad supported. These are not ads for the next hot stock, but rather they are ads purchased by companies looking for security talent. If Immdbg looks similar to Ollydbg, it is not by mistake. Immunity Inc. licensed the source code to Ollydbg in order to add features useful for exploit development.
Having a source license allows them to fix bugs. New features include graphing, a command line, and remote debugging. The standout new feature is the built-in Python scripting. Some sample scripts are included to demonstrate the Python API. Other scripts have been released by users on the Immdbg forum.
PaiMei is a reverse engineering framework (http://paimei.openrce.org/). It is written in Python and has scripts to use analysis from IDA Pro. One of PaiMei’s key components is PyDbg. PyDbg is a scriptable debugger written in Python allowing it to integrate with IDAPython (http://d-dome.net/idapython/).
IDAPython is an IDA Pro plug-in that allows scripting. It wraps many of the IDC and SDK functions. Unfortunately IDA Python does not wrap many of the debugger calls. However, IDAPython can use PyDbg in order to debug and combine runtime analysis with IDA Pro’s static analysis.
All the other debuggers discussed thus far have been for Windows operating systems. The GNU Project Debugger (GDB) is available for most UNIX systems. GDB is primarily a source level debugger. However, GDB can also operate at the assembly level.
GDB uses a text-based interface, although numerous graphical front ends have been developed. They communicate with GDB using MI (Machine Interface). Scripting languages can drive GDB by using MI.
IDA Pro’s debugger is very powerful and allows for much greater program understanding than static analysis alone. The debugger can operate locally as well as remotely with the most common operating systems.
A benefit to using the IDA Pro debugger over other debuggers is the availability of any reverse engineering work we have done. This includes renaming functions, tables, and local variables.
There are times when IDA Pro’s debugger is not the best solution. Various other debuggers are available.